Bio-Crude Production through Aqueous Phase Recycling of Hydrothermal Liquefaction of Sewage Sludge


 and
and 
Abstract
1. Introduction
2. Material and Methods
2.1. Feedstock Characterization
2.2. Experimental Procedure
2.3. Analysis of the Products
3. Results and Discussion
3.1. Effect of Temperature and Catalyst on Products Yield
3.2. Effect of Aqueous Phase Recycling on HTL Product Yield
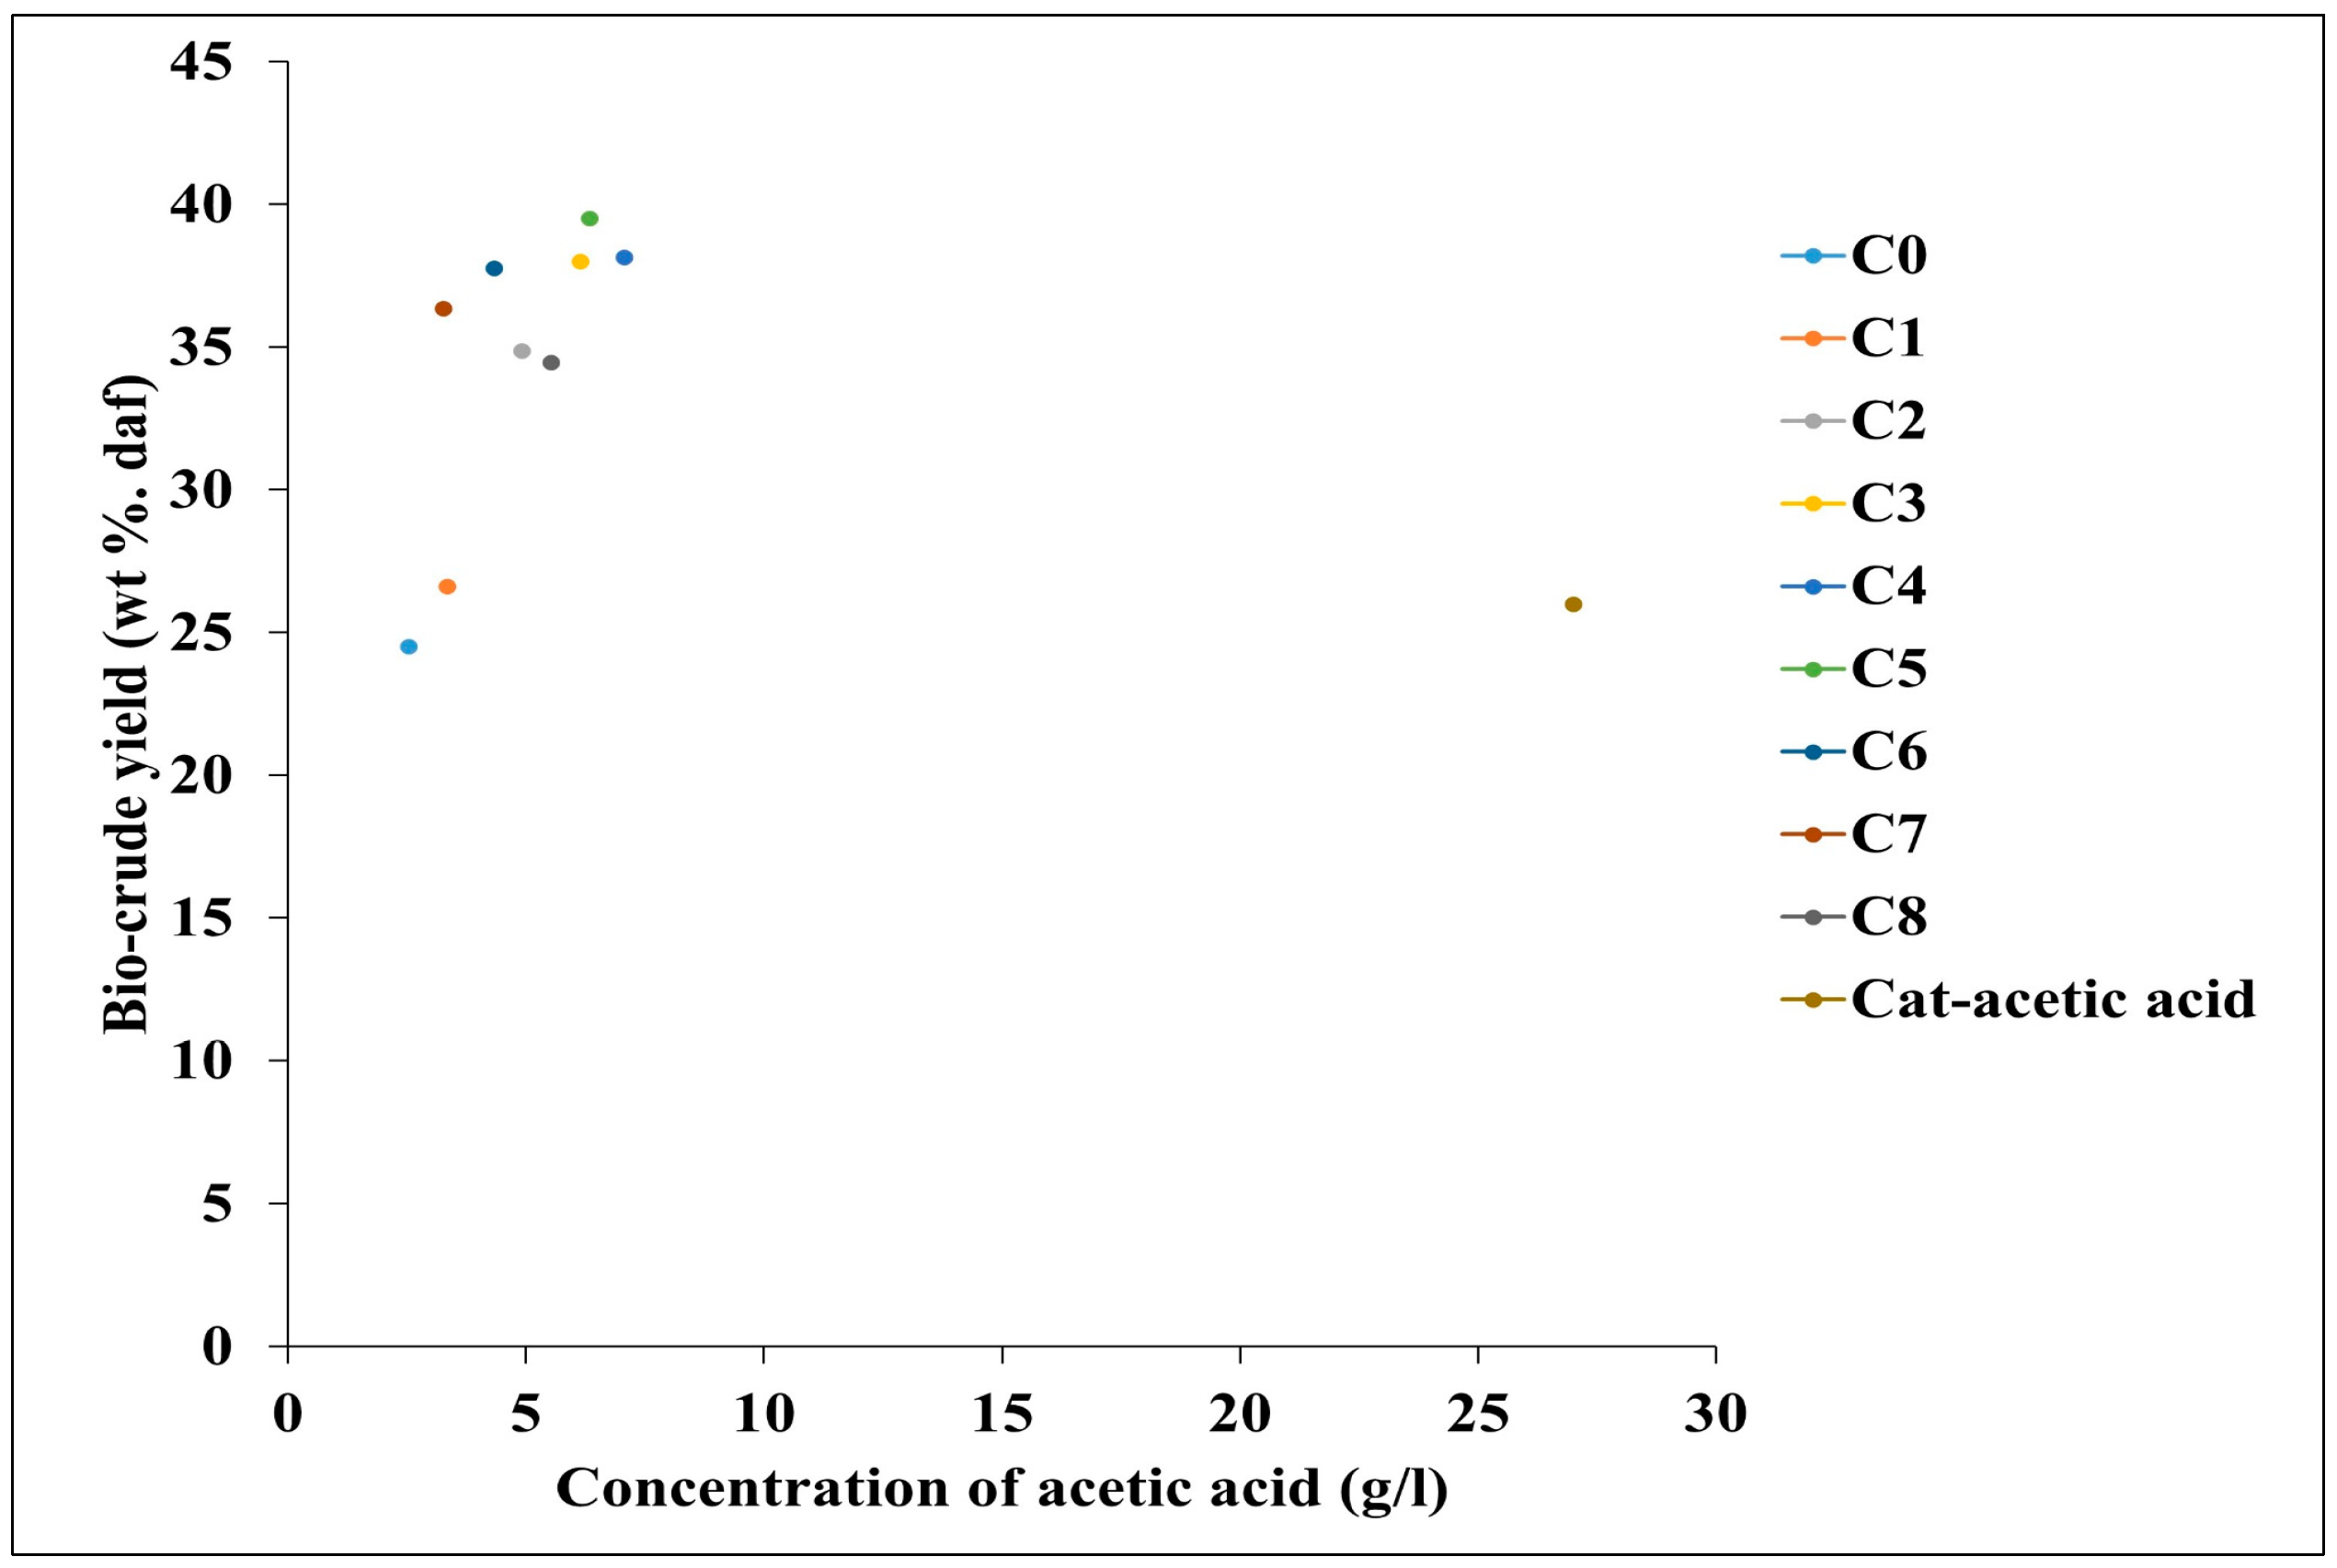
3.3. Influence of Acetic Acid on Bio-Crude Yield and Quality
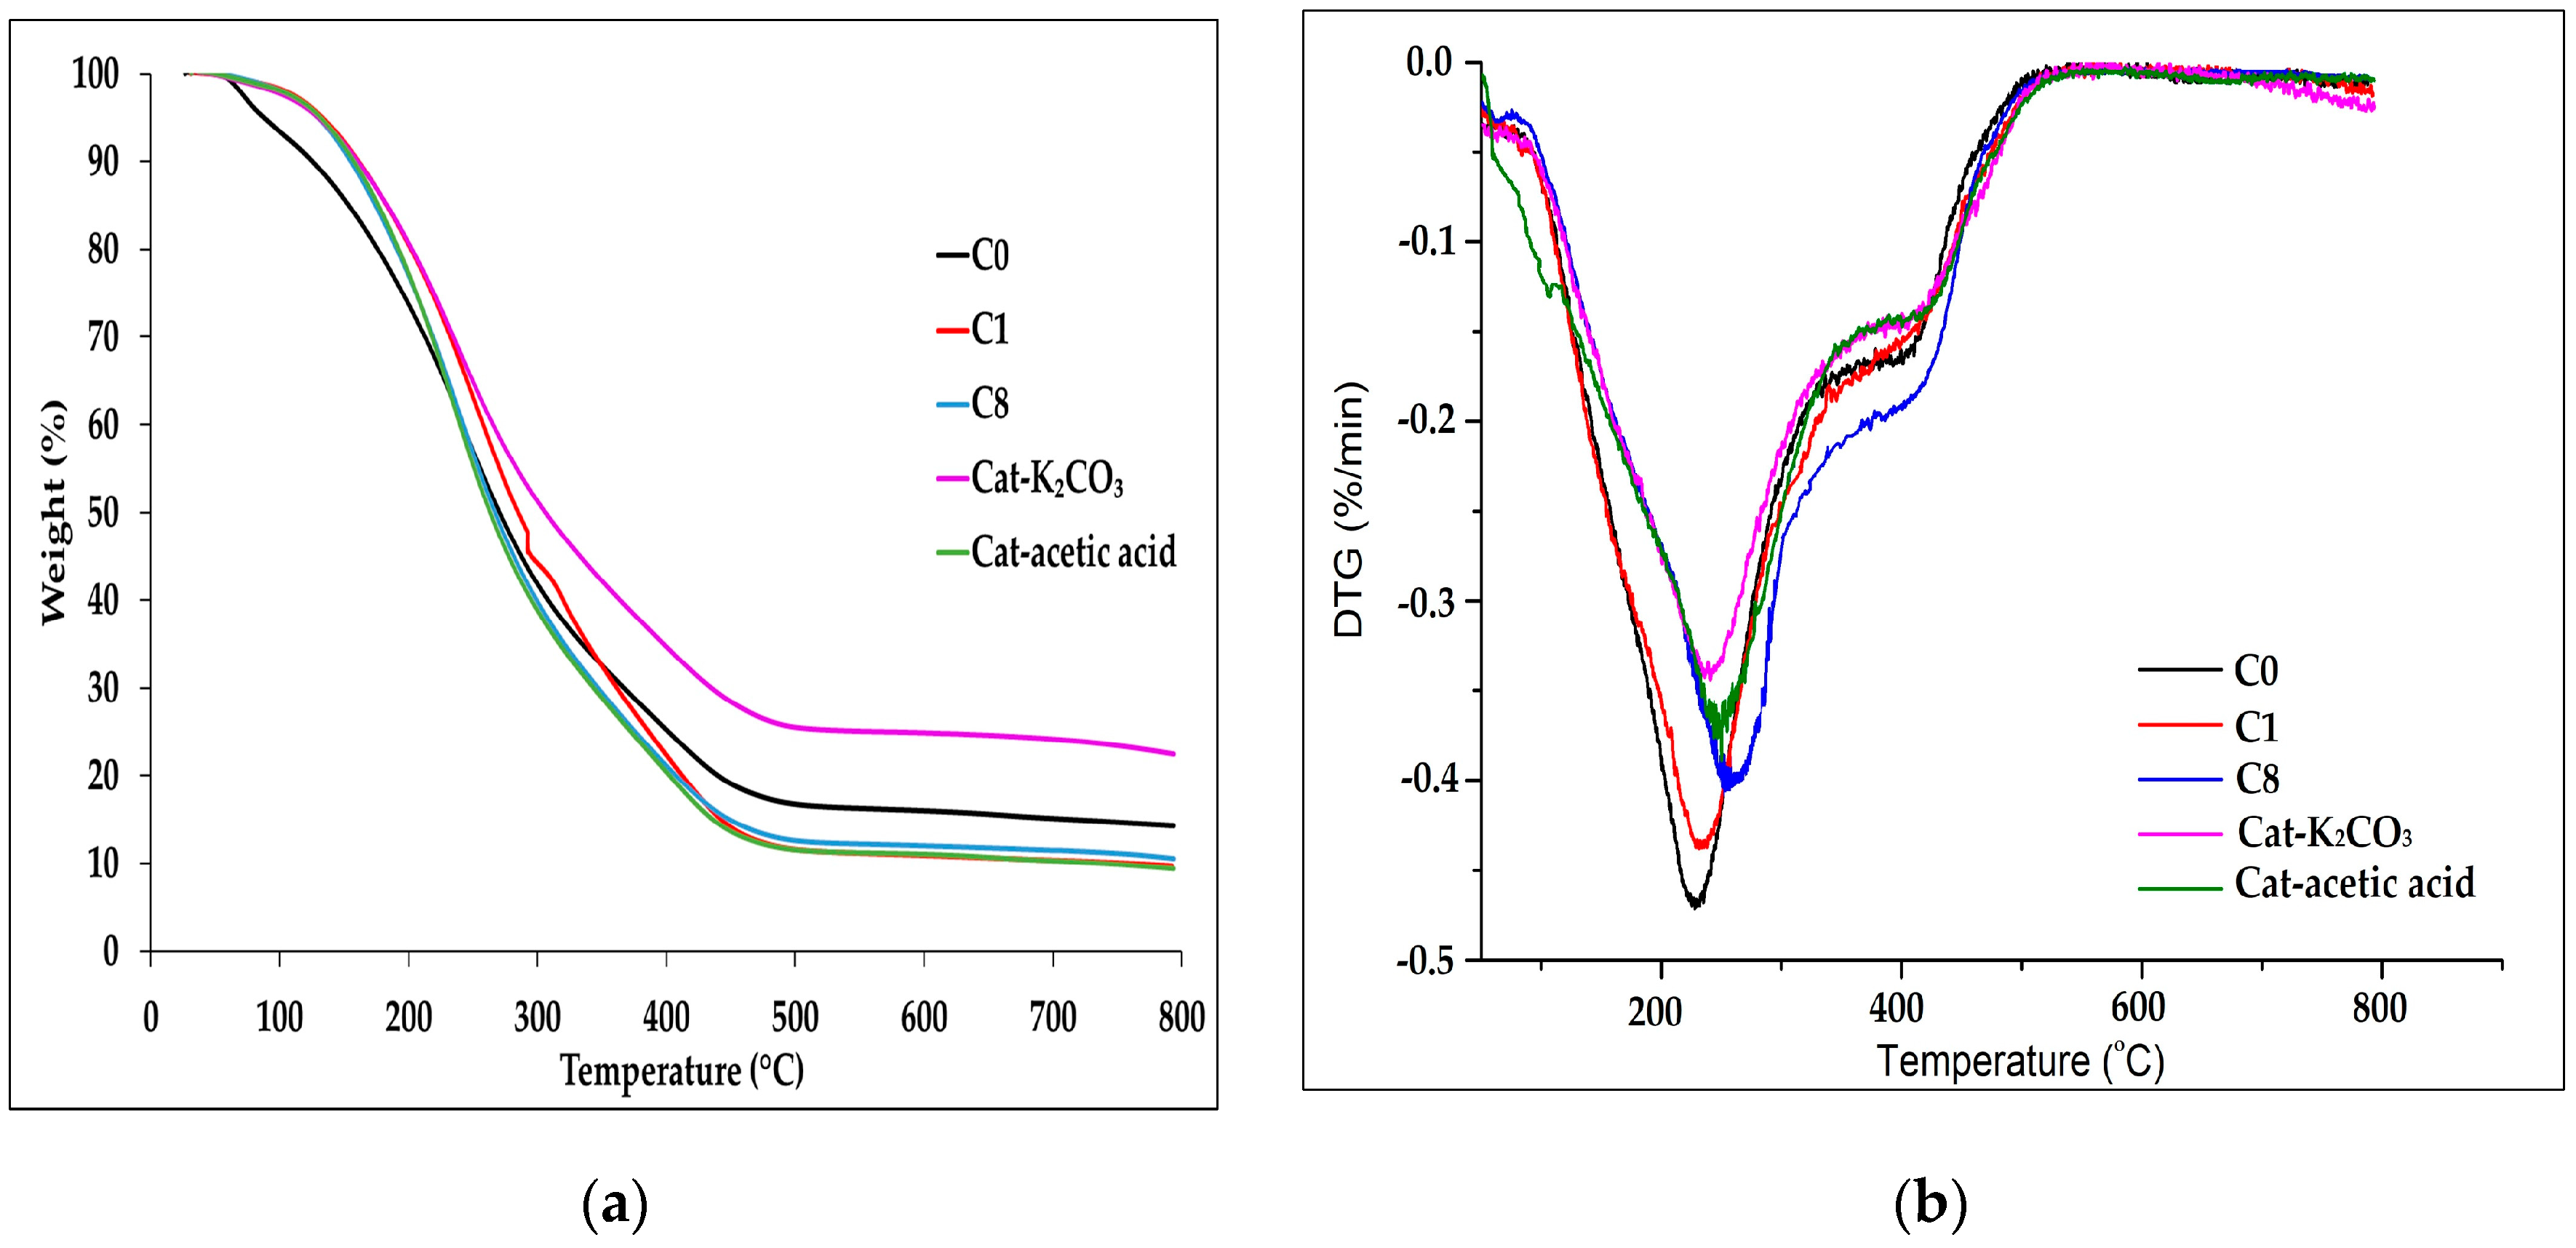
3.4. Thermal Behavior of Bio-Crude
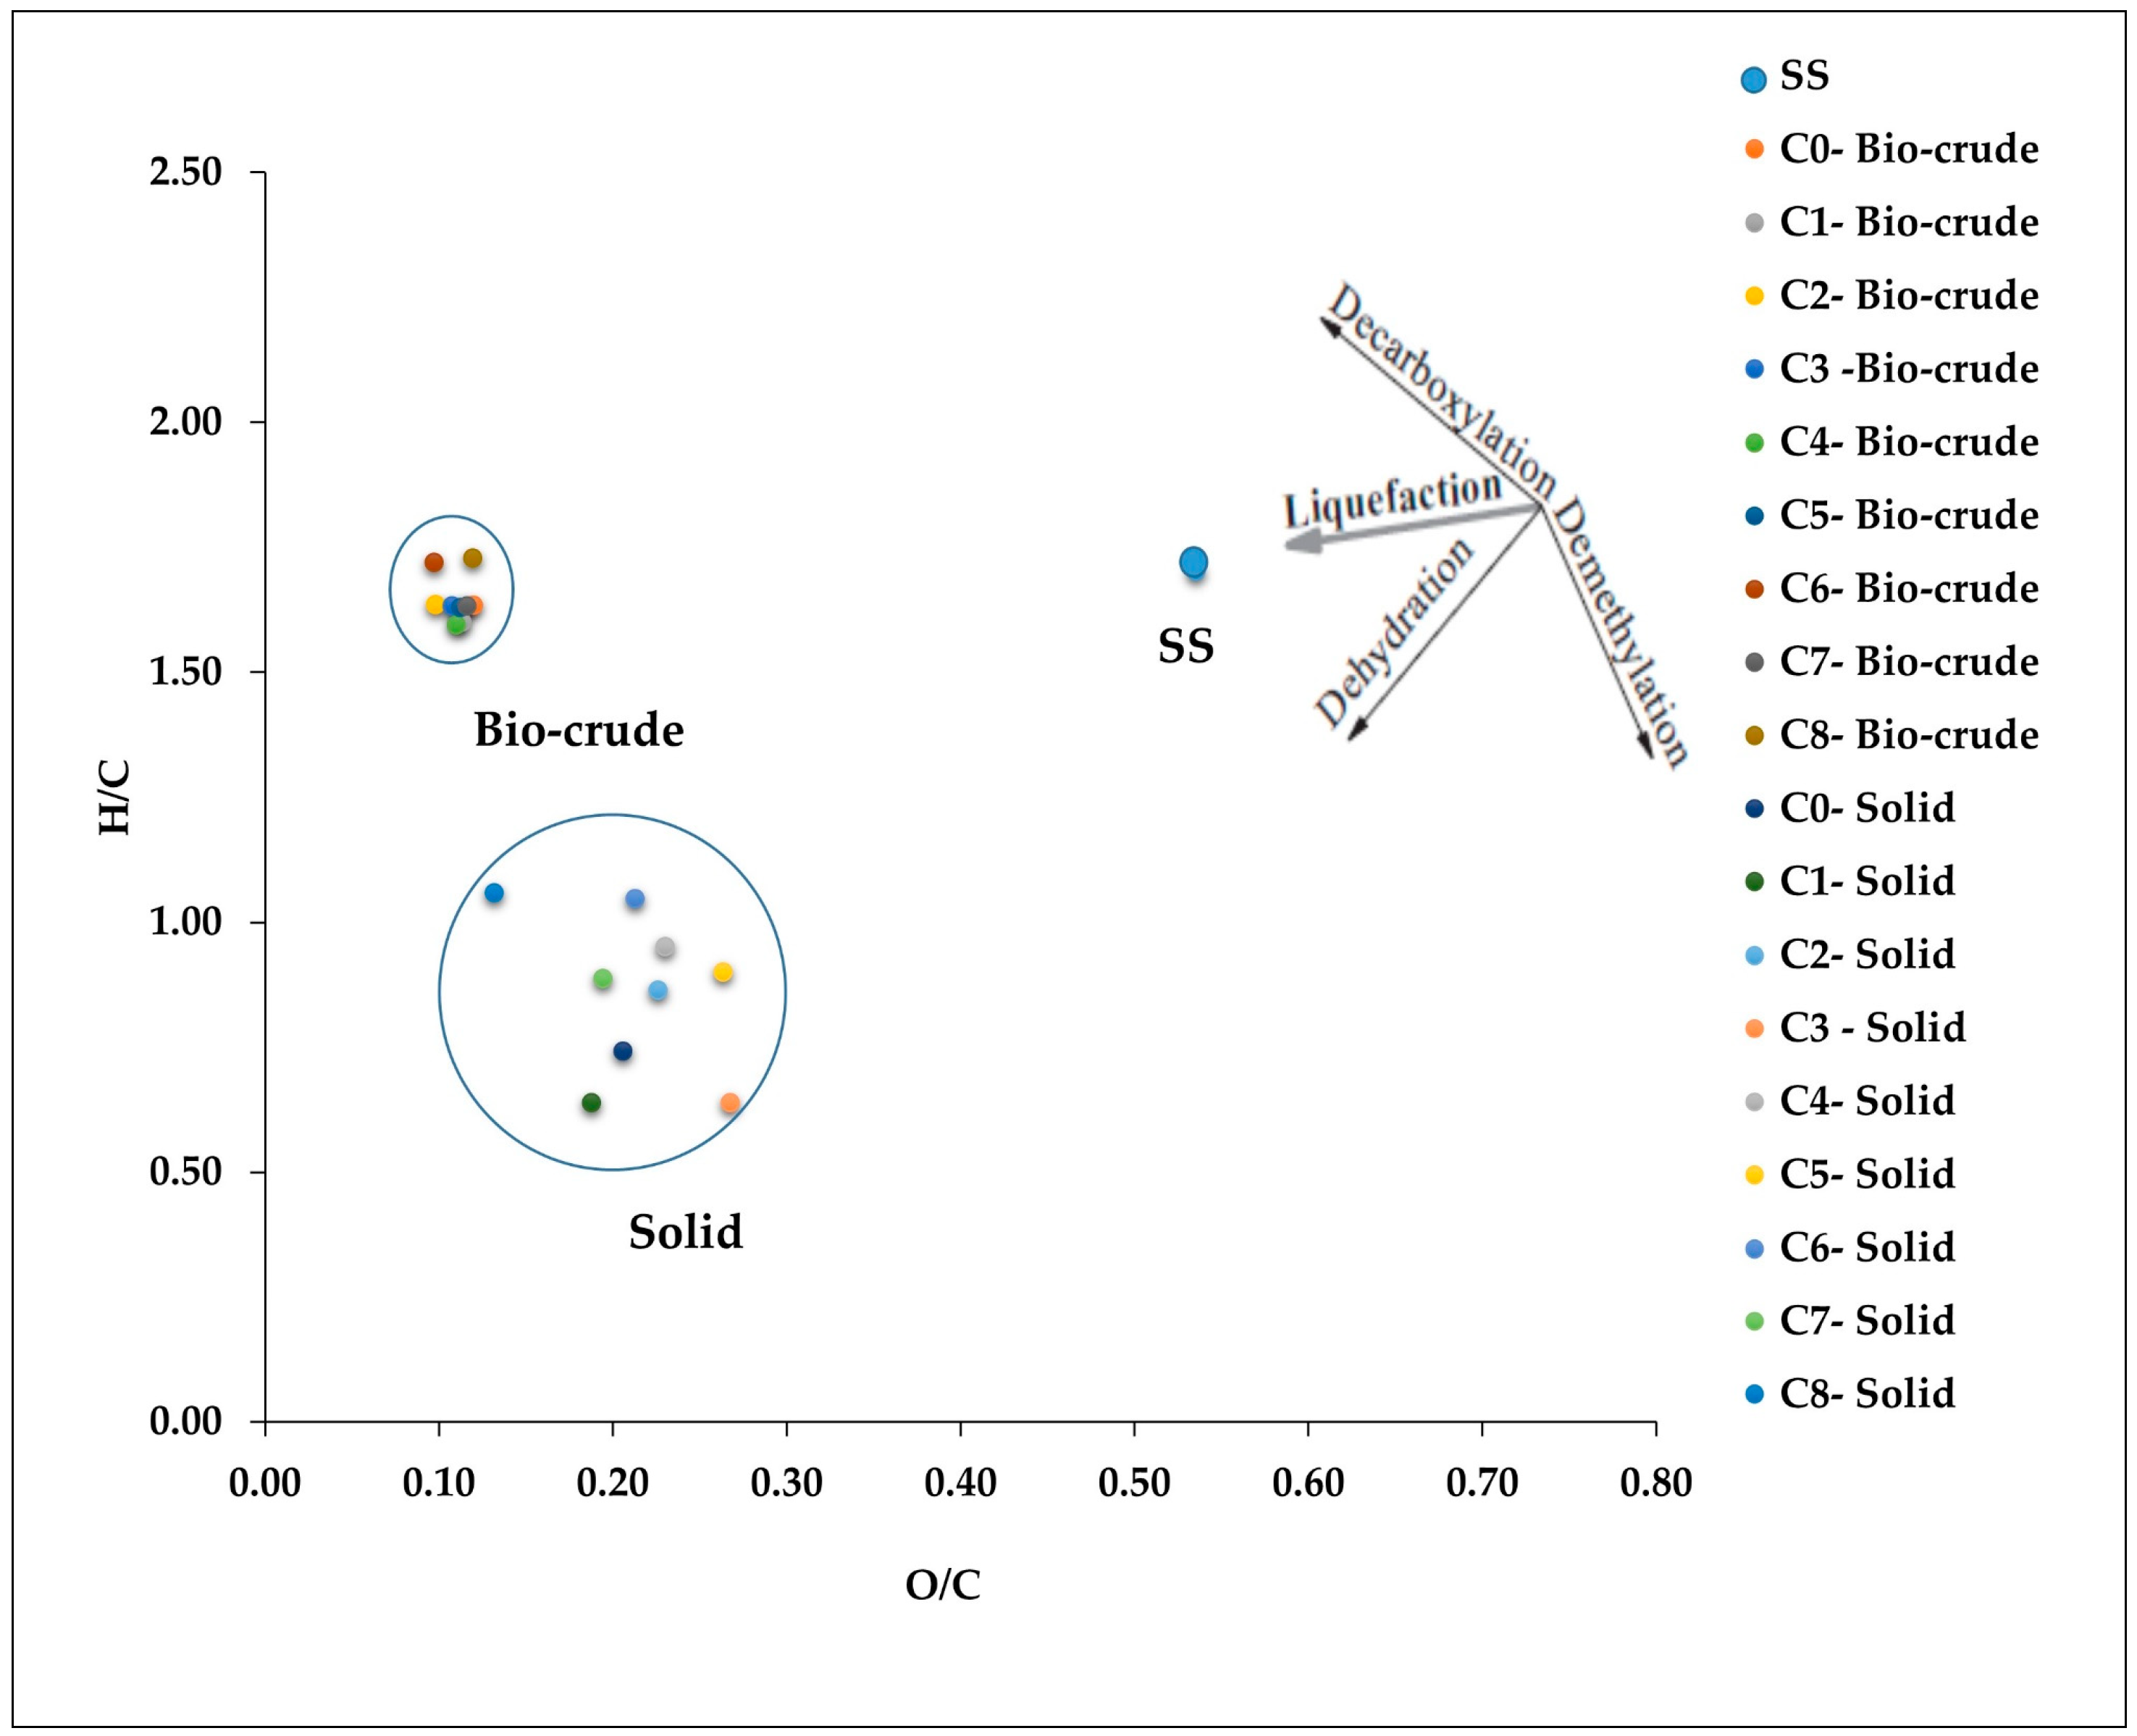
3.5. Compound Composition of Bio-Crude
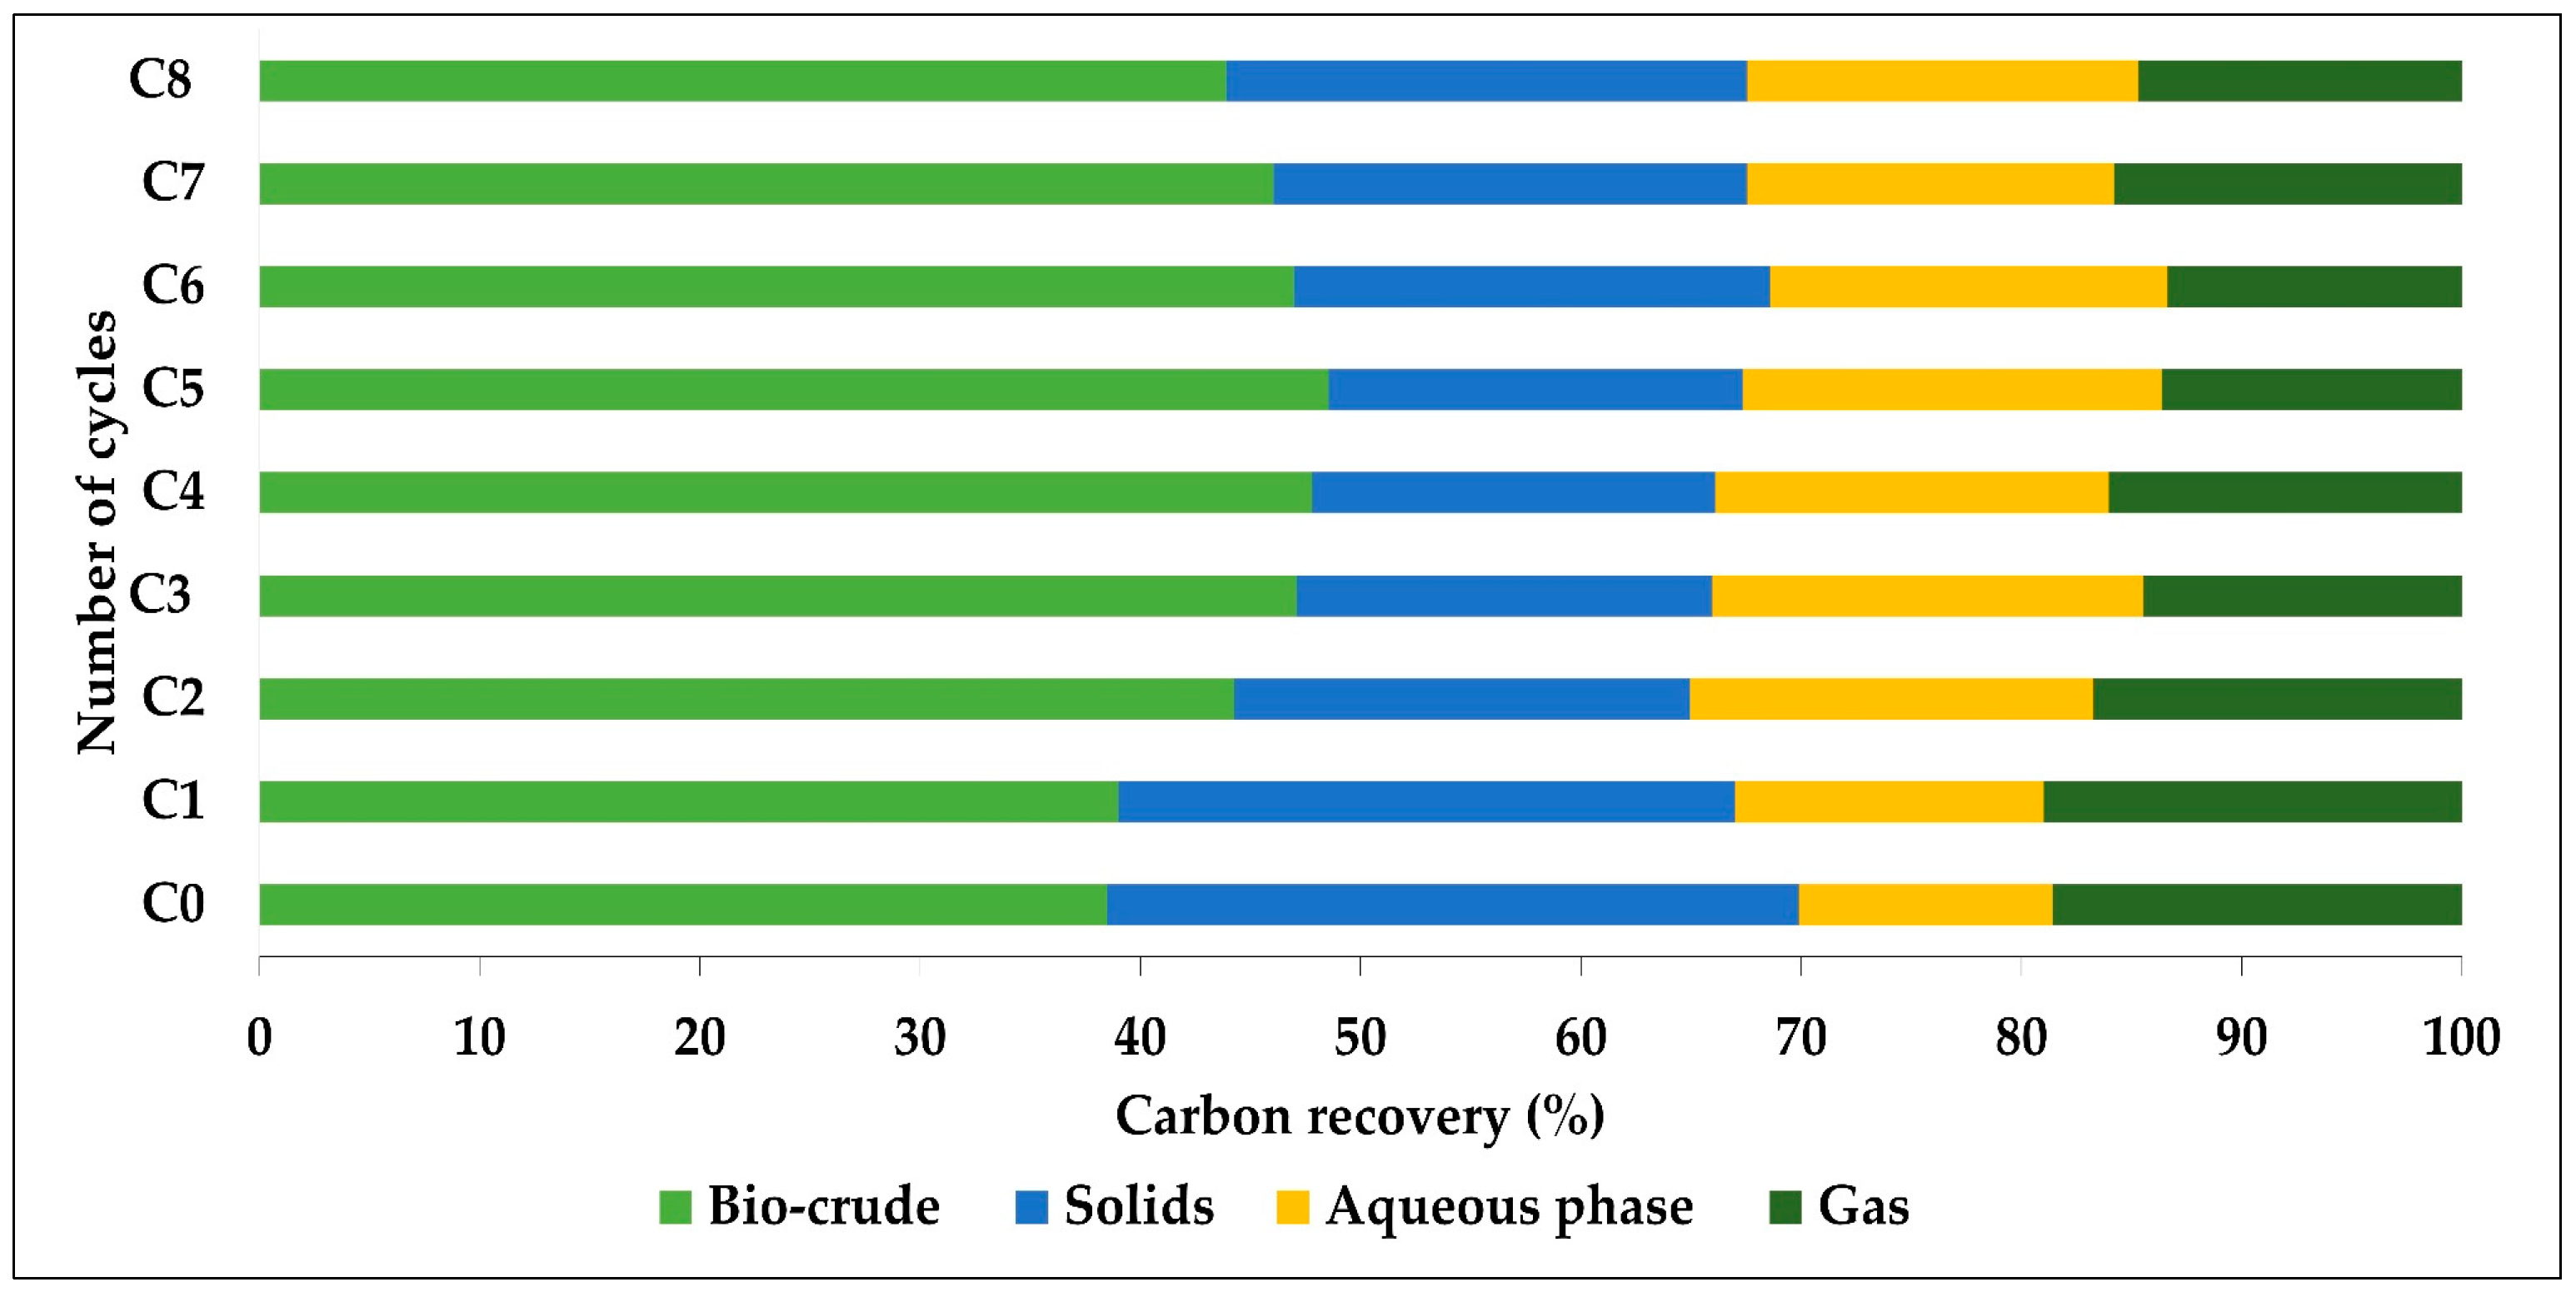
3.6. Carbon Recovery (CR)
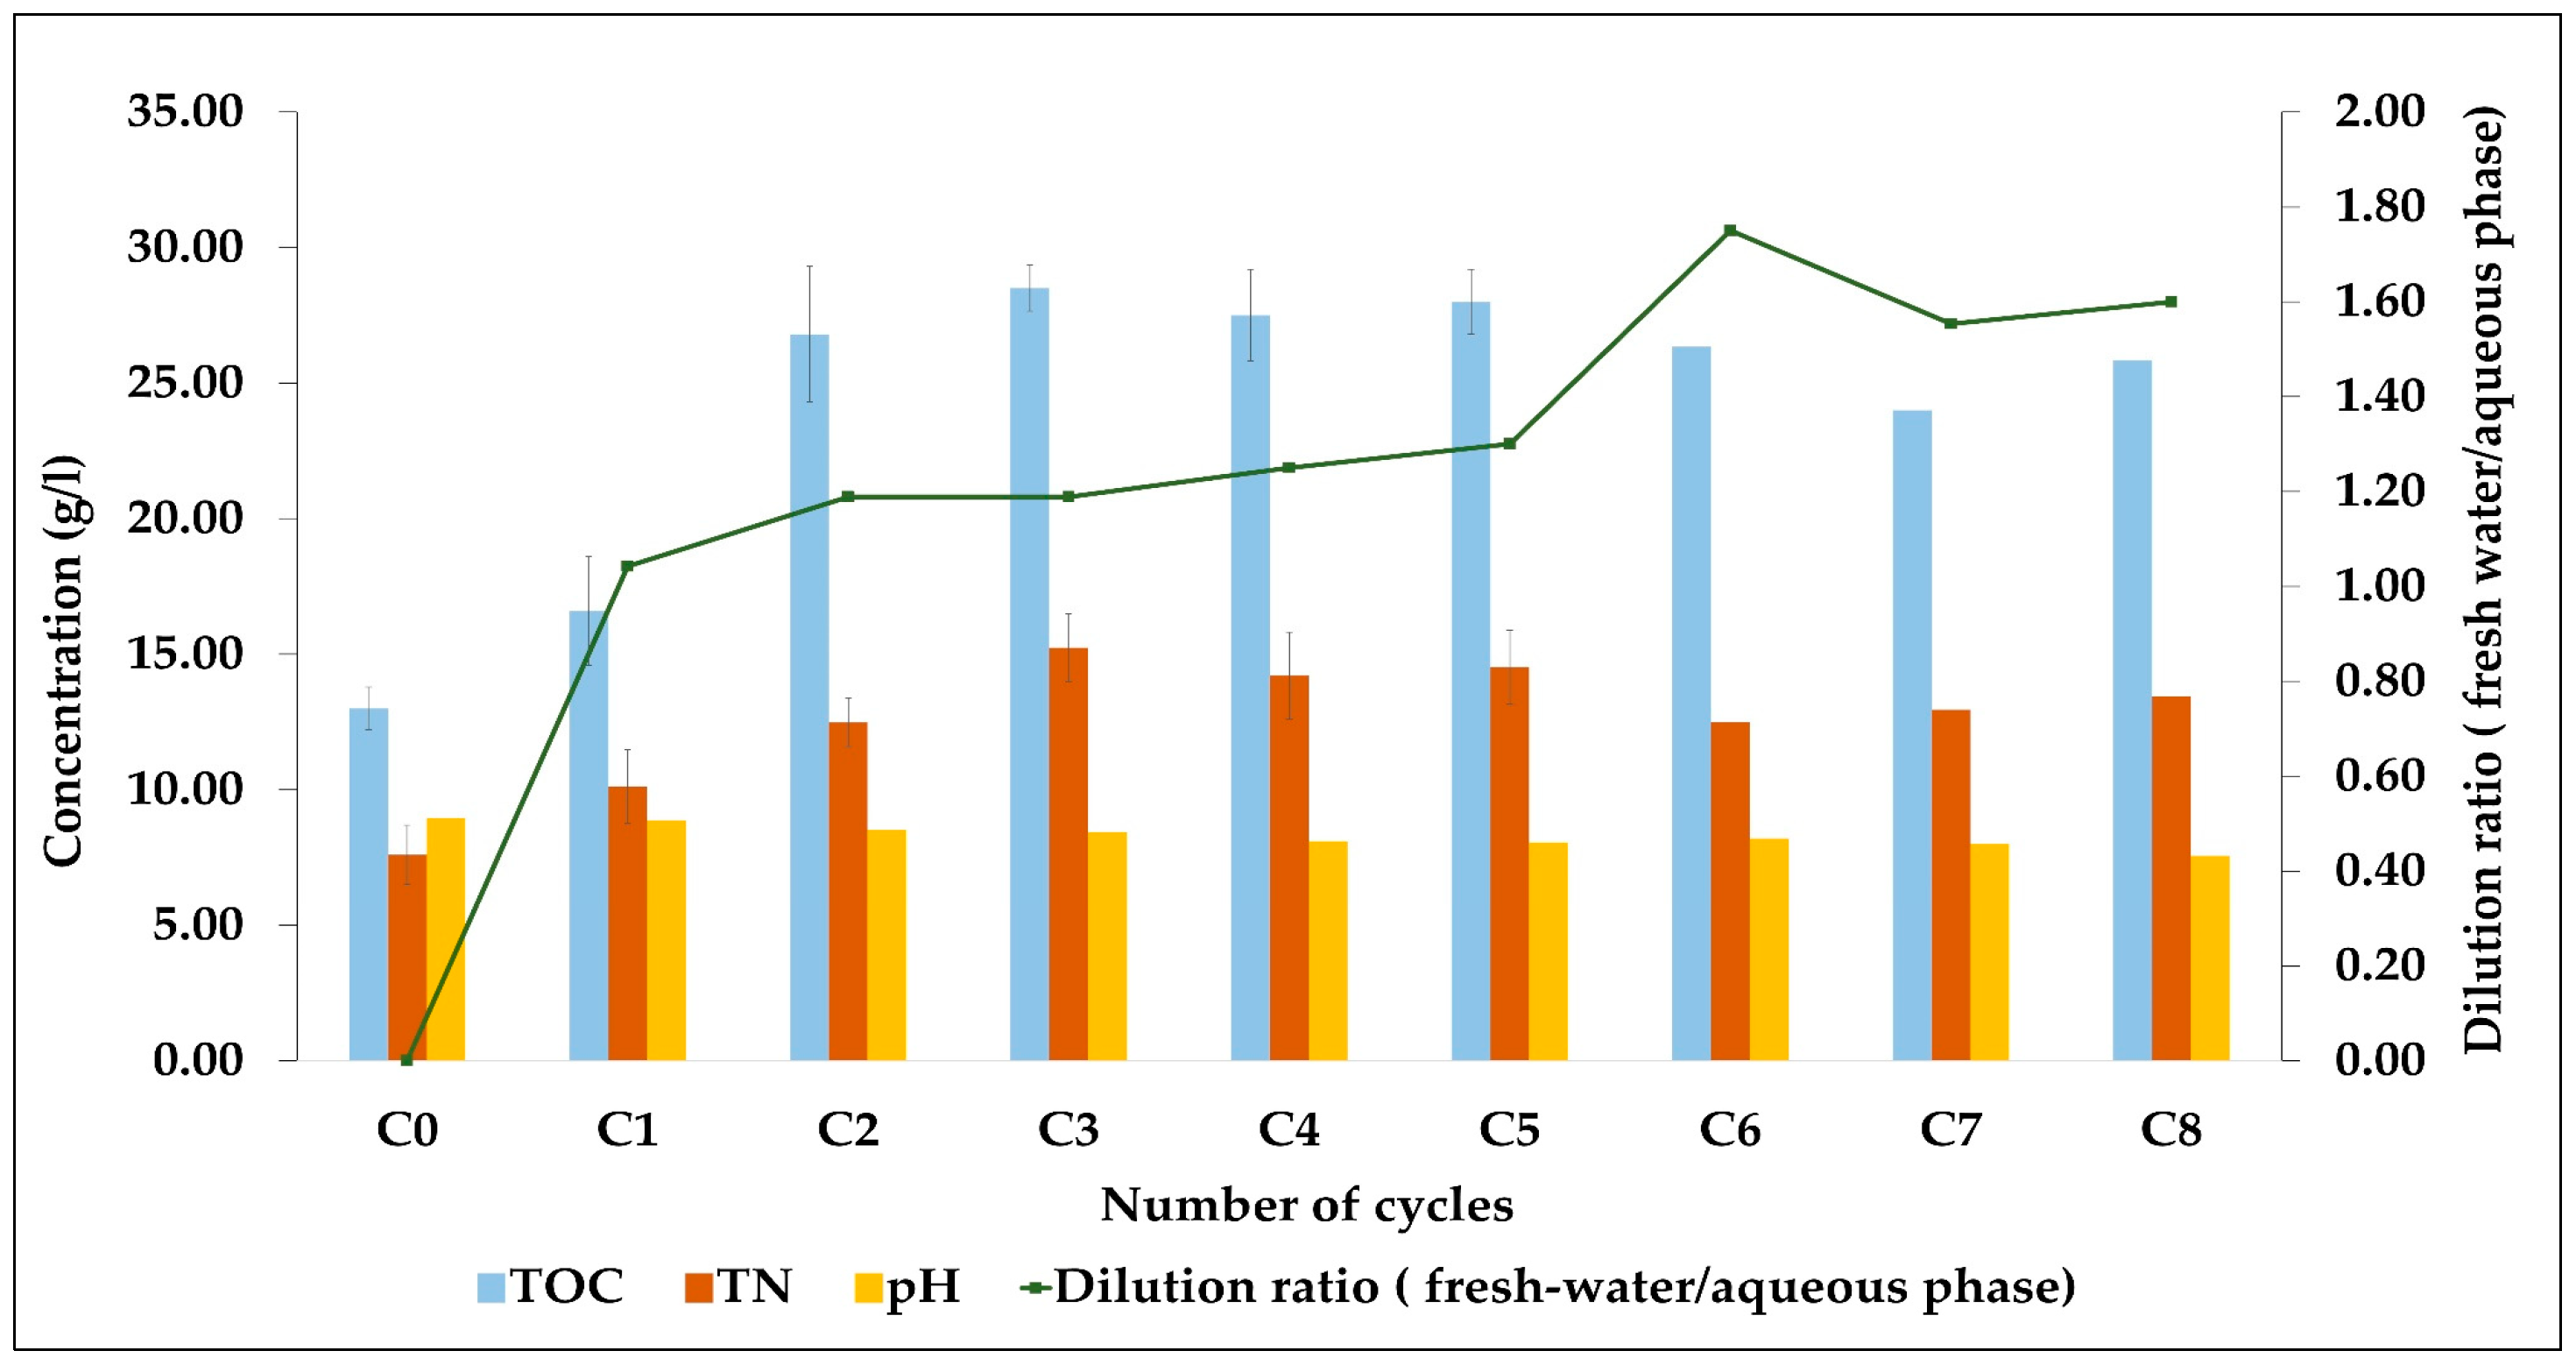
3.7. Characterization of the Aqueous Phase
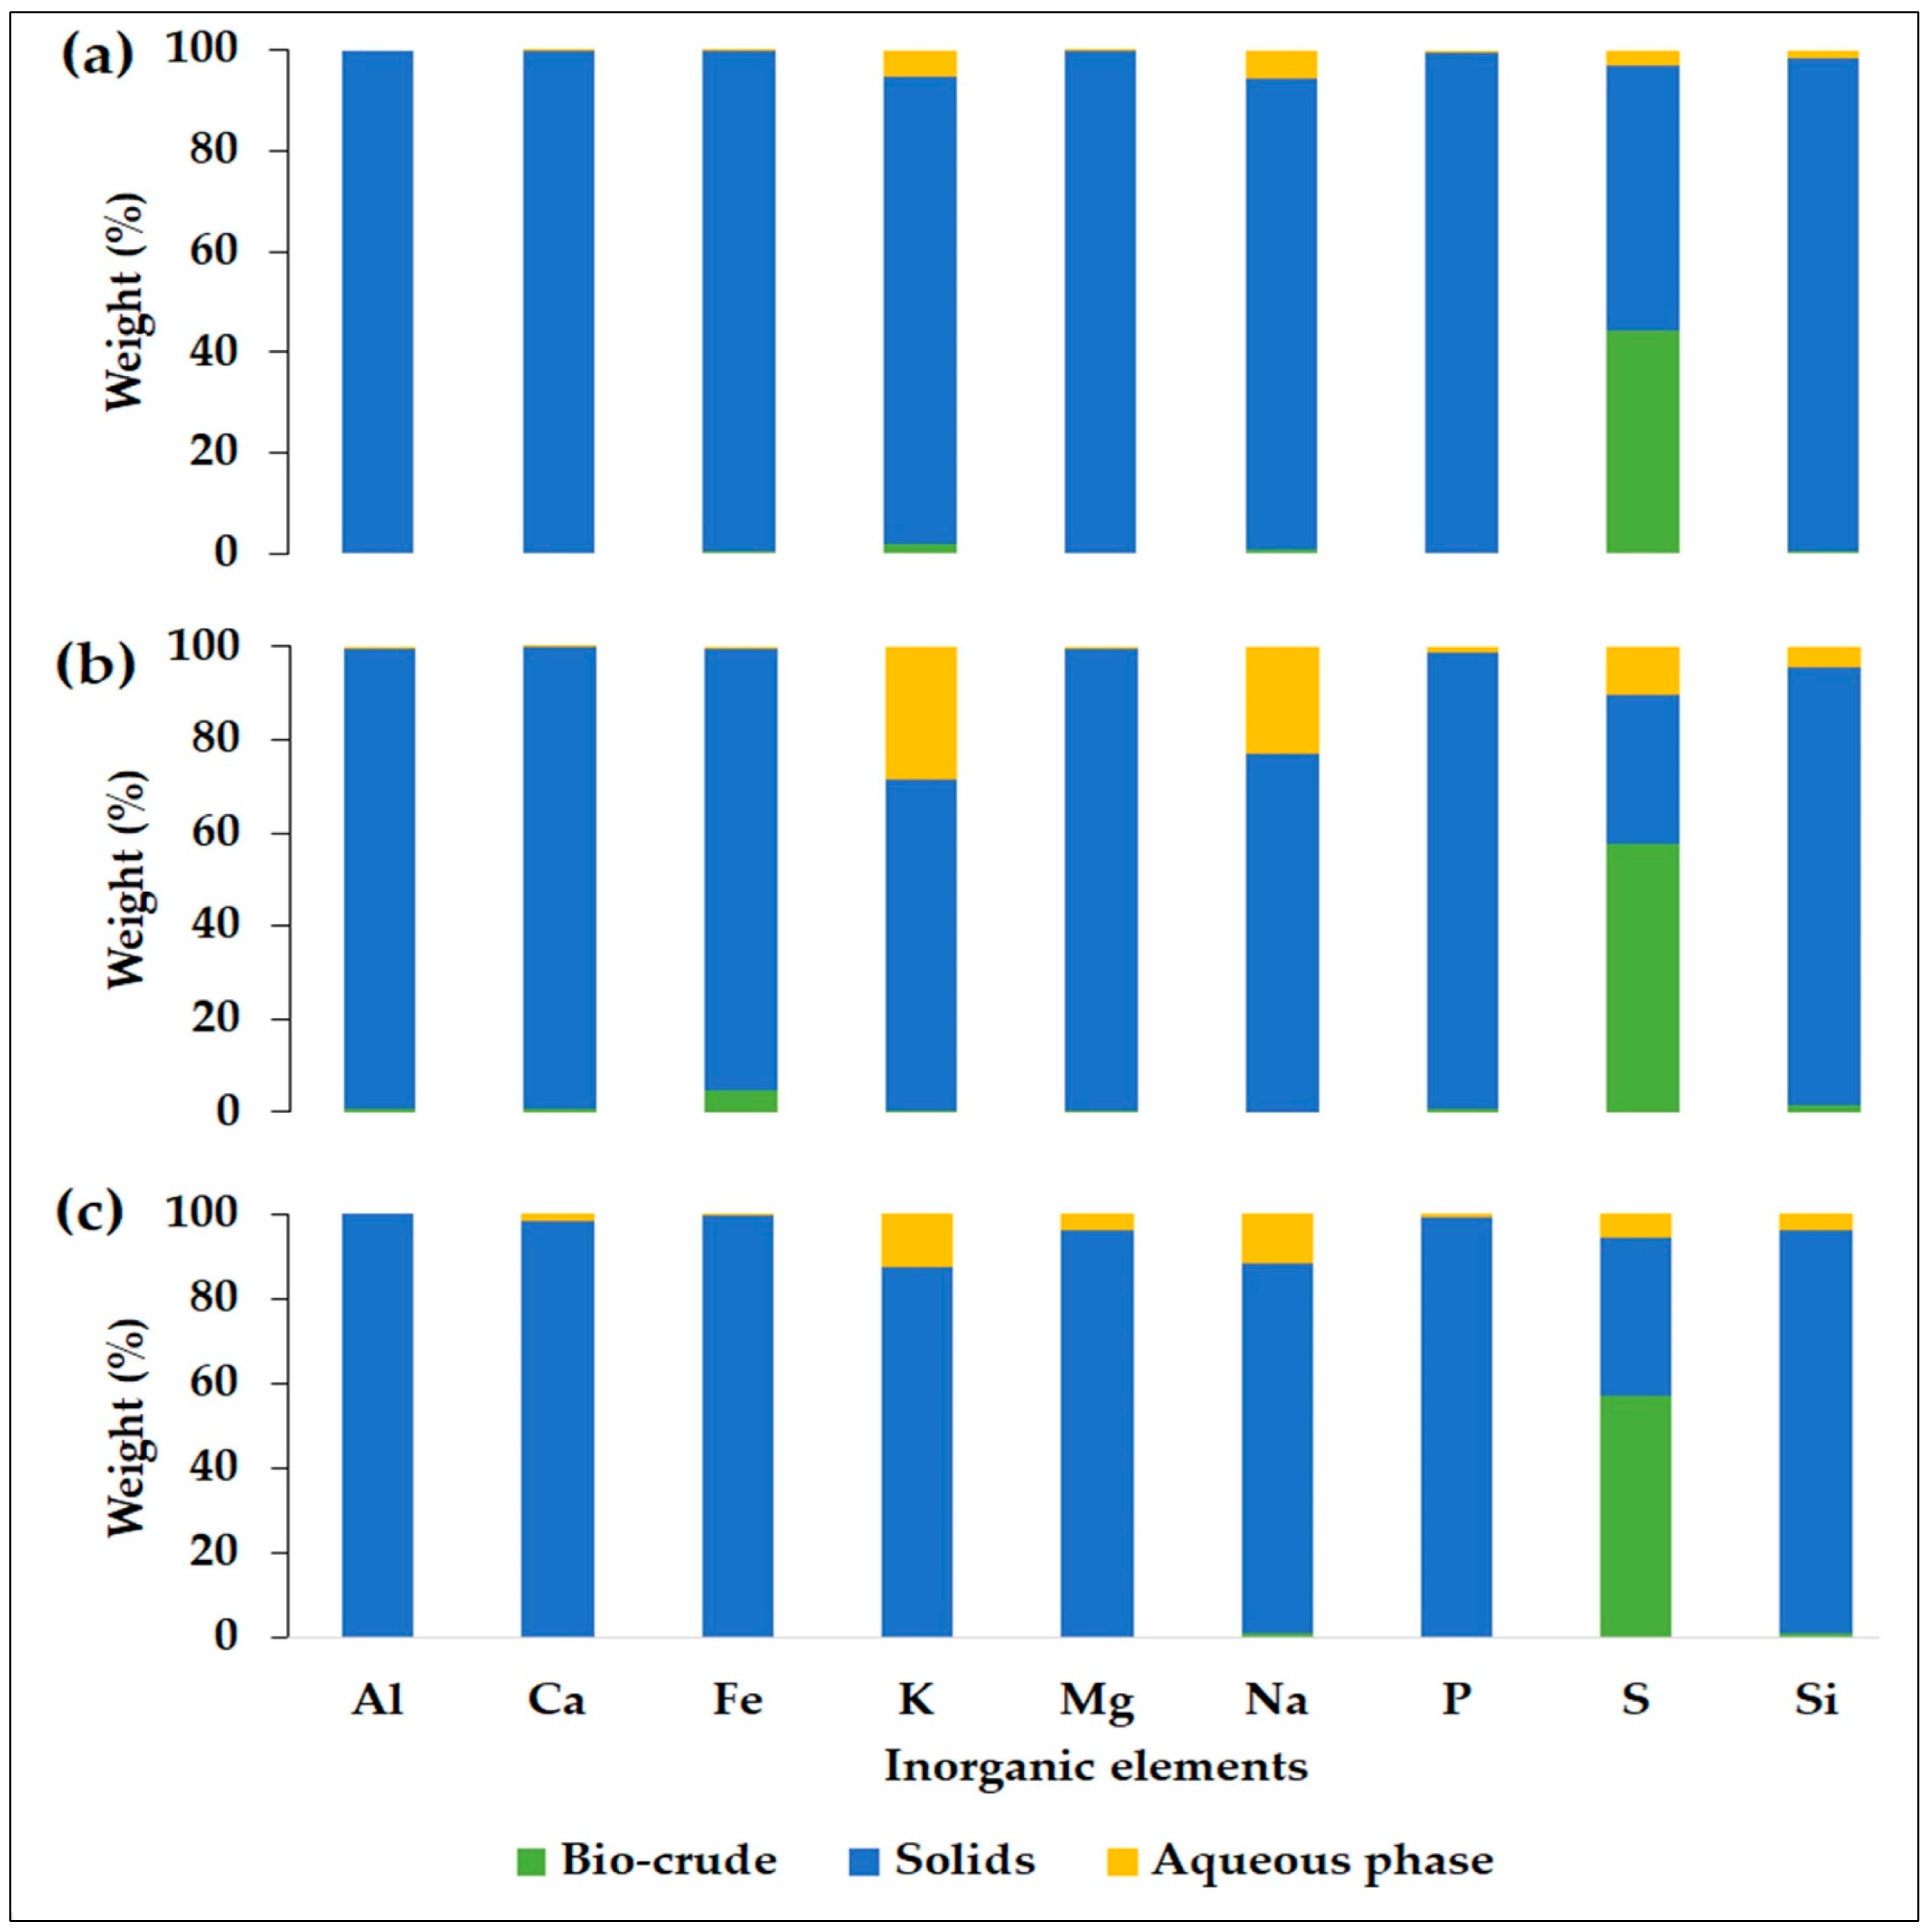
3.8. Distribution of Inorganic Elements
4. Conclusions
Supplementary Materials
Author Contributions
Funding
Conflicts of Interest
References
- Kumar, M.; Olajire Oyedun, A.; Kumar, A. A review on the current status of various hydrothermal technologies on biomass feedstock. Renew. Sustain. Energy Rev. 2018, 81, 1742–1770. [Google Scholar] [CrossRef]
- Akhtar, J.; Amin, N.A.S. A review on process conditions for optimum bio-oil yield in hydrothermal liquefaction of biomass. Renew. Sustain. Energy Rev. 2011, 15, 1615–1624. [Google Scholar] [CrossRef]
- Castello, D.; Pedersen, T.H.; Rosendahl, L.A. Continuous hydrothermal liquefaction of biomass: A critical review. Energies 2018, 11, 3165. [Google Scholar] [CrossRef]
- Fonts, I.; Gea, G.; Azuara, M.; Ábrego, J.; Arauzo, J. Sewage sludge pyrolysis for liquid production: A review. Renew. Sustain. Energy Rev. 2012, 16, 2781–2805. [Google Scholar] [CrossRef]
- Wang, L.; Chang, Y.; Li, A. Hydrothermal carbonization for energy-efficient processing of sewage sludge: A review. Renew. Sustain. Energy Rev. 2019, 108, 423–440. [Google Scholar] [CrossRef]
- Kelessidis, A.; Stasinakis, A.S. Comparative study of the methods used for treatment and final disposal of sewage sludge in European countries. Waste Manag. 2012, 32, 1186–1195. [Google Scholar] [CrossRef] [PubMed]
- Manara, P.; Zabaniotou, A. Towards sewage sludge based biofuels via thermochemical conversion—A review. Renew. Sustain. Energy Rev. 2012, 16, 2566–2582. [Google Scholar] [CrossRef]
- Huang, H.; Yuan, X.; Li, B.; Xiao, Y. Thermochemical liquefaction characteristics of sewage sludge in different organic solvents. J. Anal. Appl. Pyrolysis 2014, 109, 176–184. [Google Scholar] [CrossRef]
- Parikh, J.; Channiwala, S.; Ghosal, G. A correlation for calculating HHV from proximate analysis of solid fuels. Fuel 2005, 84, 487–494. [Google Scholar] [CrossRef]
- Elliott, D.C.; Biller, P.; Ross, A.B.; Schmidt, A.J.; Jones, S.B. Hydrothermal liquefaction of biomass: Developments from batch to continuous process. Bioresour. Technol. 2015, 178, 147–156. [Google Scholar] [CrossRef]
- Li, R.; Ma, Z.; Yang, T.; Li, B.; Wei, L.; Sun, Y. Sub-supercritical liquefaction of municipal wet sewage sludge to produce bio-oil: Effect of different organic-water mixed solvents. J. Supercrit. Fluids 2018, 138, 115–123. [Google Scholar] [CrossRef]
- Qian, L.; Wang, S.; Savage, P.E. Hydrothermal liquefaction of sewage sludge under isothermal and fast conditions. Bioresour. Technol. 2017, 232, 27–34. [Google Scholar] [CrossRef]
- Malins, K.; Kampars, V.; Brinks, J.; Neibolte, I.; Murnieks, R.; Kampare, R. Bio-oil from thermo-chemical hydro-liquefaction of wet sewage sludge. Bioresour. Technol. 2015, 187, 23–29. [Google Scholar] [CrossRef]
- Liu, R.; Tian, W.; Kong, S.; Meng, Y.; Wang, H.; Zhang, J. Effects of inorganic and organic acid pretreatments on the hydrothermal liquefaction of municipal secondary sludge. Energy Convers. Manag. 2018, 174, 661–667. [Google Scholar] [CrossRef]
- Prestigiacomo, C.; Costa, P.; Pinto, F.; Schiavo, B.; Siragusa, A.; Scialdone, O.; Galia, A. Sewage sludge as cheap alternative to microalgae as feedstock of catalytic hydrothermal liquefaction processes. J. Supercrit. Fluids 2019, 143, 251–258. [Google Scholar] [CrossRef]
- Maddi, B.; Panisko, E.; Wietsma, T.; Lemmon, T.; Swita, M.; Albrecht, K.; Howe, D. Quantitative Characterization of Aqueous Byproducts from Hydrothermal Liquefaction of Municipal Wastes, Food Industry Wastes, and Biomass Grown on Waste. ACS Sustain. Chem. Eng. 2017, 5, 2205–2214. [Google Scholar] [CrossRef]
- Xu, D.; Lin, G.; Liu, L.; Wan, Y.; Jing, Z.; Wang, S. Comprehensive evaluation on product characteristics of fast hydrothermal liquefaction of sewage sludge at different temperatures. Energy 2018, 159, 686–695. [Google Scholar] [CrossRef]
- Pham, M.; Schideman, L.; Sharma, B.K.; Zhang, Y.; Chen, W.T. Effects of hydrothermal liquefaction on the fate of bioactive contaminants in manure and algal feedstocks. Bioresour. Technol. 2013, 149, 126–135. [Google Scholar] [CrossRef]
- Valdez, P.J.; Nelson, M.C.; Wang, H.Y.; Lin, X.N.; Savage, P.E. Hydrothermal liquefaction of Nannochloropsis sp.: Systematic study of process variables and analysis of the product fractions. Biomass Bioenergy 2012, 46, 317–331. [Google Scholar] [CrossRef]
- Hu, Y.; Feng, S.; Yuan, Z.; Xu, C.C.; Bassi, A. Investigation of aqueous phase recycling for improving bio-crude oil yield in hydrothermal liquefaction of algae. Bioresour. Technol. 2017, 239, 151–159. [Google Scholar] [CrossRef]
- Cherad, R.; Onwudili, J.A.; Biller, P.; Williams, P.T.; Ross, A.B. Hydrogen production from the catalytic supercritical water gasification of process water generated from hydrothermal liquefaction of microalgae. Fuel 2016, 166, 24–28. [Google Scholar] [CrossRef]
- Pedersen, T.H.; Hansen, N.H.; Pérez, O.M.; Cabezas, D.E.V.; Rosendahl, L.A. Renewable hydrocarbon fuels from hydrothermal liquefaction: A techno-economic analysis. Biofuels Bioprod. Biorefining 2018, 12, 213–223. [Google Scholar] [CrossRef]
- López Barreiro, D.; Bauer, M.; Hornung, U.; Posten, C.; Kruse, A.; Prins, W. Cultivation of microalgae with recovered nutrients after hydrothermal liquefaction. Algal Res. 2015, 9, 99–106. [Google Scholar] [CrossRef]
- Tommaso, G.; Chen, W.T.; Li, P.; Schideman, L.; Zhang, Y. Chemical characterization and anaerobic biodegradability of hydrothermal liquefaction aqueous products from mixed-culture wastewater algae. Bioresour. Technol. 2015, 178, 139–146. [Google Scholar] [CrossRef]
- Zhu, Z.; Rosendahl, L.; Toor, S.S.; Yu, D.; Chen, G. Hydrothermal liquefaction of barley straw to bio-crude oil: Effects of reaction temperature and aqueous phase recirculation. Appl. Energy 2015, 137, 183–192. [Google Scholar] [CrossRef]
- Pedersen, T.H.; Grigoras, I.F.; Hoffmann, J.; Toor, S.S.; Daraban, I.M.; Jensen, C.U.; Iversen, S.B.; Madsen, R.B.; Glasius, M.; Arturi, K.R.; et al. Continuous hydrothermal co-liquefaction of aspen wood and glycerol with water phase recirculation. Appl. Energy 2016, 162, 1034–1041. [Google Scholar] [CrossRef]
- Ramos-Tercero, E.A.; Bertucco, A.; Brilman, D.W.F. Process water recycle in hydrothermal liquefaction of microalgae to enhance bio-oil yield. Energy Fuels 2015, 29, 2422–2430. [Google Scholar] [CrossRef]
- Biller, P.; Madsen, R.B.; Klemmer, M.; Becker, J.; Iversen, B.B.; Glasius, M. Effect of hydrothermal liquefaction aqueous phase recycling on bio-crude yields and composition. Bioresour. Technol. 2016, 220, 190–199. [Google Scholar] [CrossRef]
- Déniel, M.; Haarlemmer, G.; Roubaud, A.; Weiss-Hortala, E.; Fages, J. Bio-oil Production from Food Processing Residues: Improving the Bio-oil Yield and Quality by Aqueous Phase Recycle in Hydrothermal Liquefaction of Blackcurrant (Ribes nigrum L.) Pomace. Energy Fuels 2016, 30, 4895–4904. [Google Scholar] [CrossRef]
- About Treatment Plants (n.d.). Available online: https://aalborgforsyning.dk/kloak/spildevandsrensning/om-renseanlaeg.aspx (accessed on 15 November 2019).
- Leow, S.; Witter, J.R.; Vardon, D.R.; Sharma, B.K.; Guest, J.S.; Strathmann, T.J. Prediction of microalgae hydrothermal liquefaction products from feedstock biochemical composition. Green Chem. 2015, 17, 3584–3599. [Google Scholar] [CrossRef]
- Huang, H.J.; Yuan, X.Z.; Zhu, H.N.; Li, H.; Liu, Y.; Li-Wang, X.; Ming-Zeng, G. Comparative studies of thermochemical liquefaction characteristics of microalgae, lignocellulosic biomass and sewage sludge. Energy 2013, 56, 52–60. [Google Scholar] [CrossRef]
- Conti, F.; Toor, S.S.; Pedersen, T.H.; Nielsen, A.H.; Rosendahl, L.A. Biocrude production and nutrients recovery through hydrothermal liquefaction of wastewater irrigated willow. Biomass Bioenergy 2018, 11, 824–831. [Google Scholar] [CrossRef]
- Helmer Pedersen, T.; Conti, F. Improving the circular economy via hydrothermal processing of high-density waste plastics. Waste Manag. 2017, 68, 24–31. [Google Scholar] [CrossRef]
- Zhou, D.; Zhang, L.; Zhang, S.; Fu, H.; Chen, J. Hydrothermal Liquefaction of Macroalgae Enteromorpha prolifera to Bio-oil. Energy Fuels 2010, 24, 4054–4061. [Google Scholar] [CrossRef]
- Yokoyama, Y.S.; Suzuki, A.; Murakami, M.; Ogi, T.; Koguchi, K.; Nakamura, E. Liquid fuel production from sewage sludge by catalytic conversion using sodium carbonate. Fuel 1987, 66, 1150–1155. [Google Scholar] [CrossRef]
- Li, C.; Yang, X.; Zhang, Z.; Zhou, D.; Zhang, L.; Zhang, S.; Chen, J. Hydrothermal liquefaction of desert shrub salix psammophila to high value-added chemicals and hydrochar with recycled processing water. BioResources 2013, 8, 2981–2997. [Google Scholar] [CrossRef]
- Ross, A.B.; Biller, P.; Kubacki, M.L.; Li, H.; Lea-Langton, A.; Jones, J.M. Hydrothermal processing of microalgae using alkali and organic acids. Fuel 2010, 89, 2234–2243. [Google Scholar] [CrossRef]
- Shakya, R.; Whelen, J.; Adhikari, S.; Mahadevan, R.; Neupane, S. Effect of temperature and Na2CO3 catalyst on hydrothermal liquefaction of algae. Algal Res. 2015, 12, 80–90. [Google Scholar] [CrossRef]
- Peterson, A.A.; Vogel, F.; Lachance, R.P.; Fröling, M.; Antal, M.J.; Tester, J.W. Thermochemical biofuel production in hydrothermal media: A review of sub- and supercritical water technologies. Energy Environ. Sci. 2008, 1, 32–65. [Google Scholar] [CrossRef]
- Abdelmoez, W.; Nakahasi, T.; Yoshida, H. Amino acid transformation and decomposition in saturated subcritical water conditions. Ind. Eng. Chem. Res. 2007, 46, 5286–5294. [Google Scholar] [CrossRef]
- Biller, P.; Ross, A.B. Potential yields and properties of oil from the hydrothermal liquefaction of microalgae with different biochemical content. Bioresour. Technol. 2011, 102, 215–225. [Google Scholar] [CrossRef]
- Zhu, Z.; Toor, S.S.; Rosendahl, L.; Chen, G. Analysis of product distribution and characteristics in hydrothermal liquefaction of barley straw in subcritical and supercritical water. Environ. Prog. Sustain. Energy 2014, 33, 737–743. [Google Scholar] [CrossRef]
- Madsen, R.B.; Biller, P.; Jensen, M.M.; Becker, J.; Iversen, B.B.; Glasius, M. Predicting the Chemical Composition of Aqueous Phase from Hydrothermal Liquefaction of Model Compounds and Biomasses. Energy Fuels 2016, 30, 10470–10483. [Google Scholar] [CrossRef]
- Huang, H.J.; Yuan, X.Z. The migration and transformation behaviors of heavy metals during the hydrothermal treatment of sewage sludge. Bioresour. Technol. 2016, 200, 991–998. [Google Scholar] [CrossRef]
- Yang, Y.; Gilbert, A.; Xu, C.C. Hydrodeoxygenation of bio-crude in supercritical hexane with sulfided CoMo and CoMoP catalysts supported on MgO: A model compound study using phenol. Appl. Catal. A Gen. 2009, 360, 242–249. [Google Scholar] [CrossRef]


| MC a | VM | FC c | Ash | Crude Protein b | Crude Fat b | Carbohydrates b |
|---|---|---|---|---|---|---|
| 7.54 | 54.44 | 11.54 | 34.02 | 43.21 | 4.89 | 51.89 |
| C b | H b | N b | O b,d | H/C | O/C | HHV (MJ/kg) b |
| 50.17 | 7.11 | 6.90 | 35.81 | 1.70 | 0.54 | 21.27 |
| Inorganic Elements | Concentration (mg/kg) | Relative Concentration (wt.%) |
|---|---|---|
| Al | 5515.77 ± 255.25 | 5.98 |
| Ca | 27,514.97 ± 788.17 | 29.82 |
| Fe | 13,239.89 ± 788.04 | 14.35 |
| K | 2691.63 ± 129.44 | 2.92 |
| Mg | 6681.27 ± 485.84 | 7.24 |
| Na | 182.80 ± 34.14 | 0.20 |
| P | 26,244.71 ± 889.01 | 28.44 |
| S | 8873.56 ± 227.96 | 9.62 |
| Si | 1334.43 ± 105.32 | 1.45 |
| Total | 92,279.02 | 100.00 |
| Cycles | Freshwater (mL) | Aqueous Phase (mL) | Dilution Factor (Fresh-Water/Aqueous Phase) |
|---|---|---|---|
| C0 | 15.40 | ----- | ----- |
| C1 | 7.90 | 7.50 | 1.05 |
| C2 | 8.40 | 7.00 | 1.20 |
| C3 | 8.40 | 7.00 | 1.20 |
| C4 | 8.40 | 7.00 | 1.20 |
| C5 | 8.10 | 7.30 | 1.11 |
| C6 | 9.90 | 5.50 | 1.80 |
| C7 | 9.40 | 6.00 | 1.57 |
| C8 | 9.40 | 6.00 | 1.57 |
| Samples | Elemental Analysis (wt. %) | HHV (MJ/kg) a | H/C | O/C | ER (%) | |||
|---|---|---|---|---|---|---|---|---|
| C | H | N | O b | |||||
| SS | 50.17 | 7.11 | 6.91 | 35.81 | 21.27 | 1.70 | 0.54 | ---- |
| 350-None | 73.85 | 10.04 | 4.67 | 11.44 | 35.22 | 1.63 | 0.12 | 39.57 |
| 400-None | 74.12 | 10.12 | 4.42 | 11.34 | 35.42 | 1.64 | 0.12 | 42.27 |
| Cat-K2CO3 | 75.65 | 10.36 | 5.10 | 8.89 | 36.46 | 1.64 | 0.09 | 44.09 |
| Samples | Elemental Analysis (wt. %) | HHV(MJ/kg) a | H/C | O/C | ER (%) | |||
|---|---|---|---|---|---|---|---|---|
| C | H | N | O b | |||||
| C0 | 73.85 | 10.04 | 4.67 | 11.44 | 35.22 | 1.63 | 0.12 | 38.83 |
| C1 | 73.89 | 9.89 | 5.10 | 11.12 | 35.09 | 1.61 | 0.11 | 43.90 |
| C2 | 74.56 | 10.12 | 5.50 | 9.82 | 35.71 | 1.63 | 0.10 | 58.54 |
| C3 | 73.65 | 9.96 | 5.75 | 10.64 | 35.13 | 1.62 | 0.11 | 62.76 |
| C4 | 73.28 | 9.72 | 6.25 | 10.75 | 34.71 | 1.59 | 0.11 | 62.26 |
| C5 | 72.65 | 9.85 | 6.80 | 10.70 | 34.62 | 1.63 | 0.11 | 64.30 |
| C6 | 72.84 | 9.15 | 7.27 | 10.74 | 33.91 | 1.51 | 0.11 | 60.22 |
| C7 | 72.09 | 10.14 | 6.95 | 10.82 | 34.76 | 1.69 | 0.11 | 59.39 |
| C8 | 71.27 | 9.66 | 7.10 | 11.97 | 33.82 | 1.63 | 0.13 | 59.63 |
| Cat-acetic acid | 72.51 | 9.89 | 5.1 | 12.52 | 34.48 | 1.64 | 0.13 | 39.75 |
| S.No. | RT | Compounds | Peak Area (%) | |||
|---|---|---|---|---|---|---|
| C0 | C5 | C8 | Cat-acetic acid | |||
| 1 | 2.42 | Butane, 2,3-dimethyl- | 5.42 | 4.38 | 2.63 | 2.91 |
| 2 | 10.79 | Phenol | 0.23 | 0.25 | 2.12 | 0.8 |
| 3 | 12.41 | p-Cresol | 2.54 | ND | 3.93 | 2.06 |
| 4 | 13.06 | 4-Piperidinone, 2,2,6,6-tetramethyl- | 4.95 | 20.42 | 18.56 | ND |
| 5 | 19.06 | Hexadecane | 4.48 | 2.21 | 4.15 | 3.31 |
| 6 | 23.44 | n-Hexadecanoic acid | 5.32 | 1.63 | 3.9 | 7.02 |
| 7 | 25.53 | Dodecanamide | 5.12 | 4.19 | 6.45 | 7.95 |
| 8 | 25.85 | N-Methyldodecanamide | 5.27 | 3.22 | 3.7 | 3.35 |
| 9 | 27.11 | 9-Octadecenamide, (Z)- | 9.71 | 6.39 | 5.66 | 17.3 |
| Total area detected | 51.65 | 55.26 | 52.84 | 53.82 | ||
| S.No. | RT | Compounds | Formula | Peak Area (%) |
|---|---|---|---|---|
| 1 | 3.44 | Acetic acid | CH3COOH | 5.36 |
| 2 | 7.54 | Acetamide | C2H5NO | 3.09 |
| 3 | 9.14 | Acetamide, N-ethyl- | C4H9NO, | 3.03 |
| 4 | 11.44 | Pentanoic acid, 4-methyl- | C6H12O2 | 3.04 |
| 5 | 12.74 | 2,5-Pyrrolidinedione, 1-methyl- | C5H7NO2 | 13.54 |
| 6 | 13.18 | 3-Aminopyridine | C5H6N2 | 5.11 |
| 7 | 13.44 | 2,5-Pyrrolidinedione, 1-ethyl- | C6H9NO2 | 3.51 |
| 8 | 14.36 | Cyclooctanone, oxime | C9H17NO | 6.18 |
| 9 | 14.51 | 2-Piperidinone | C4H7NO | 7.48 |
| 10 | 22.54 | 4(1H)-Pyridinone,tetrahydro-2,5-dimethyl-1-(1-methylethyl)- | C11H18N2O2 | 3.70 |
| 11 | 23.52 | Pyrrolo[1,2-a]pyrazine-1,4-dione, hexahydro-3-(2-methylpropyl)- | C11H18N2O2 | 7.19 |
| Total area detected | 70.85% | |||
© 2020 by the authors. Licensee MDPI, Basel, Switzerland. This article is an open access article distributed under the terms and conditions of the Creative Commons Attribution (CC BY) license (http://creativecommons.org/licenses/by/4.0/).
Share and Cite
Shah, A.A.; Toor, S.S.; Seehar, T.H.; Nielsen, R.S.; H. Nielsen, A.; Pedersen, T.H.; Rosendahl, L.A. Bio-Crude Production through Aqueous Phase Recycling of Hydrothermal Liquefaction of Sewage Sludge. Energies 2020, 13, 493. https://doi.org/10.3390/en13020493
Shah AA, Toor SS, Seehar TH, Nielsen RS, H. Nielsen A, Pedersen TH, Rosendahl LA. Bio-Crude Production through Aqueous Phase Recycling of Hydrothermal Liquefaction of Sewage Sludge. Energies. 2020; 13(2):493. https://doi.org/10.3390/en13020493
Chicago/Turabian StyleShah, Ayaz A., Saqib S. Toor, Tahir H. Seehar, Rasmus S. Nielsen, Asbjørn H. Nielsen, Thomas H. Pedersen, and Lasse A. Rosendahl. 2020. "Bio-Crude Production through Aqueous Phase Recycling of Hydrothermal Liquefaction of Sewage Sludge" Energies 13, no. 2: 493. https://doi.org/10.3390/en13020493
APA StyleShah, A. A., Toor, S. S., Seehar, T. H., Nielsen, R. S., H. Nielsen, A., Pedersen, T. H., & Rosendahl, L. A. (2020). Bio-Crude Production through Aqueous Phase Recycling of Hydrothermal Liquefaction of Sewage Sludge. Energies, 13(2), 493. https://doi.org/10.3390/en13020493