Abstract
EU targets for sustainable development call for strong changes in the current energy systems as well as committed protection of environmental resources. This target conflicts if a policy is not going to promote the compatible solutions to both the issues. This is the case of the additional renewable energy sources to be exploited for increasing the share in the electricity mix and in the gross final energy consumption. Solar energy is, currently, the cheapest solution in Southern European Countries, like Italy. In this paper, thanks to the availability of three open databases provided by National Institutions, the authors compared the historic trends and policy scenarios for soil consumption, electricity consumption, and renewable electricity production to check correlations. The provincial scale was chosen as resolution of the analysis. The deviations from the policy scenarios was then addressed to identify the demand for policy recommendations and pathways to promote in order to achieve the target for renewable electricity share as well as the reduction in soli consumption trend in 2030. The role of renewables integrated in the existing contexts, such as building integrated photovoltaics, is considered a key driver for solving this issue.
1. Introduction
A transition towards more sustainable energy is the pathway identified by the European Commission for a modern, prosperous and climate neutral continent [1]. One of the pillars is the increasing development of Renewable Energy Sources (RES) and their share in the energy mix [2], characterized by low marginal costs but an intermittent nature [3].
Current EU policy is the 2030 Roadmap that aims at 32.5% of energy efficiency and at 32% of RES share on final energy consumption by 2030, calling for challenging energy and climate plans by each Member State, especially with a focus on cities [4].
Nowadays, the majority of fuel supply is fossil, with the perspective on including different forthcoming renewable alternatives at different scales [5]. Contemporary, large-scale electrification of stationary users as well as transportation by means of Electric Vehicles (EV) [6] draws the attention to electricity sectors entailing new players in new markets such as the flexibility services offered by the buildings [7].
Indeed, referring to the electricity sector, more than half of the energy supply is foreseen to be provided by RES. This strong variation causes policy implications in EU and historical data and time-series [8] play a key role for highlighting the already occurred changes in economics [9] since the first EU Directive in 2001 [10].
Data and its openness are tools for effective monitoring and planning of decarbonisation at different scales [11] and for different technology integration [12]. It implies multi-energy systems and analysis [13] for managing stochastic behaviour of RES involving prosumers in the smart grid environment [14] with the help of the demand response (DR) program [15]. Participation of citizens as contributors to the new energy market and to the new energy policy is included in the new Italian Energy and Climate Plan. Referring to RES, it promotes the repowering of existing plants to pursue the environmental protection [16]. To do so, reducing the land consumption is the main target in order to mitigate the environmental and landscaping impacts as well as the citizens’ quality of life, such as level of pollution [17].
Photovoltaics (PV) is a key technology since it is already deployed and economically viable [18]. Further development in materials and efficiency as well as products’ integration can be promoted by a simplified modelling tool [19] but obstacles still present have to be considered, such as storage needs [20] or energy market mechanisms for its future prospects [21]. As regards impact, according to Reference [22], PV has a low impact if integrated in existing buildings or being part of new ones not entailing further land use [23]. This integration is also promoted by new business models, such as third party ownership (TPO) or community-shared (CS), transforming solar energy in a service to the market [24]. As a matter of fact, buildings are not only electricity consumers but also thermal energy ones. Coupling electrification and energy refurbishment, the actual integration of solar energy must be ensured from the pre-design to the operation phase [25]. Therefore, modelling and optimization should aim at cost-benefit analysis for renovation [26], together with the integration of Information & Communication Technologies (ICT) such as building automation [27].
Yet, deployment of renewable energy plants sees obstacles in the local community and in legislation when the large scale occurs [28]. To overcome those barriers, raising the citizens’ awareness of renewable energy as well as tailored design on local contexts must be included in energy planning [29] for inclusive and quality-driven solutions for all of the population’s ages [30]. Moreover, getting close production to the consumption implies the direct increase of RES share, the avoidance of distribution losses, and an efficient detailed planning of storage infrastructures installation reducing costs [31].
For this purpose, location registered by geographical information systems (GIS) provide a local community database and starting point to go for new renewables accounting for surroundings’ needs and criticalities [32]. Beside this, large-scale data analytics and modelling to optimize multi-energy systems [33] with analytics of penetration of RES, such as PV or new technologies such as heat pump (HP) [34], are useful in multiple operating conditions. It is possible to consider relevant constraints such as load matching and integration in sensitive environments [35] or where the connection to the power grid is weak or even absent [36].
In this field, this study analyses the Italian open database on land use, electricity consumption and renewable electricity production at provincial resolution. The issue of available surfaces dedicated to further renewable energy production is faced accounting for the national policy targets [37], and scenarios to comply with the legislation in force are provided. Open data provided by Public Institutions are considered a transparent tool and a clear explanation of current trends to citizens.
The authors investigated the correlation among the renewable power plants’ installation and land use in order to provide a more informed framework and a set of recommendations to follow for providing a growth trend aligned with policy targets in the field of energy, environmental protection, and economic profitability.
2. Materials and Methods
The objective of this work is the analysis of available open data on land use, electricity consumption, and renewable electricity production in Italy to check if there is any link among them useful to adjust energy and climate strategy plans, putting low impact initiatives into action.
Referring to the Italian territory, it has three administrative levels: 20 regions, 107 provinces and 7926 municipalities.
For the purpose of this analysis, the authors selected the second administrative level, i.e., the provinces, believing that a higher detail leads to excessive fragmentation and a lower detail hides the quality of trends and features of the analysed data.
A geographical subdivision based on homogeneous energy characteristics was carried out in many energy planning researches on specific areas [38], usually recalling administrative boundaries at the regional [39] or municipal level [40]. This change of scales did show pros and cons carefully considered by the authors.
Data on soil consumption come from the homonymous Report edited by ISPRA [41], Italian Institute of Environmental Protection, available both in cartographic and numerical format, i.e., excel sheets. It provides the current status and historic data of the Italian territory as a trend of soil consumption accounting for the different territorial transformations at all levels. Indicators to evaluate consumption characteristics and trends are elaborated. Projections of land use changes and their impacts are provided together with the mapping and evaluation of soil ecosystem services [42]. Soil consumption is a phenomenon associated with the loss of a fundamental environmental resource, due to the occupation of an originally agricultural, natural or semi-natural surface. The phenomenon refers to an increase in artificial ground cover, linked to settlement and infrastructure dynamics. A process mainly due to the construction of new buildings and settlements, the expansion of cities, the densification or conversion of land within an urban area and the infrastructure of the territory. Soil consumption is, therefore, defined as a variation from a non-artificial cover (unused soil) to an artificial ground cover (consumed soil), as defined in Reference [43]. In Appendix A, a description of available data of surfaces at the provincial level from ISPRA can be found [44,45]. Data are administrative surfaces, population and land consumption.
Data on electricity consumption come from the database published by TERNA [46], Italian Transmission System Operator (TSO), and are available on the website in numerical format, i.e., excel sheets. It allows for understanding how the electricity consumption market in Italy changed in relation to industrial and economic developments together with the implementation of international decarbonisation targets. In Appendix B, a description of available data of electricity consumption at the provincial level from TERNA is reported.
Finally, data on renewable electricity production are derived from GSE [47], Italian Energy Services Operator, and are available on the website as yearly excel files as part of all the RES production databases in the Electric, Thermal and Transport sectors. Regional resolution is available. Moreover, GSE is the company identified by the Italian State and owned by the Ministry of Economic Development to pursue and achieve the objectives of environmental sustainability in two pillars: RES and energy efficiency. Besides that, the open data availability occurs at the provincial level except for the production of renewable energy from wind, bioenergy, geothermal and hydroelectric sources. To overcome this barrier, the production of electricity at the provincial level (Eprov,i) for those RES was estimated using Equation (1), where heq,reg,i are the nominal power equivalent hours of production for the generic RES [47] and Pprov,i is the nominal power of the generic RES installed at the provincial level.
Data relating to the power of the systems are available in cartographic and in numerical format on a dedicated website hosting the atlas of all Italian systems [48].
The study was developed over three phases.
In the first phase, a statistical analysis was carried out to characterise the different Italian provinces, by computing the specific variables per unit of administrative surface or per capita. This calculation is commonly used to evaluate the ecological footprint of human activities [49] and is already adopted in the field of energy to assess the impact of the different forms of electricity generation [50,51,52] or to identify the call for surfaces in the energy planning phase [53], considering the opportunity to re-use the brownfield [54].
Twenty classes were identified to perform frequency analysis (first class from 0 to 0.10 of the mean value up to the twentieth class from 1.9 to 2.0).
Data dispersion was classified in quartiles (Q1, first quartile; Q2 the median; Q3, third quartile). A relative measurement of dispersion is the coefficient of quartile deviation (CQD), defined as:
In the second phase, the possible correlation between soil consumption and electricity consumption, with a focus on the overall and the non-renewable portion, was investigated. Several studies in literature, connections among energy use, soil consumption and emissions are examined and accounted in the building future scenarios [55,56] as well as in forecasting the emissions when economic growth and energy sector changes occur [57,58]. The aforementioned correlation was investigated on a provincial base, compared to the regression line, and the deviations of all the provinces were calculated. Using the Excel data analysis tool, a linear regressive analysis and a quadratic regression were performed.
In the third phase, in order to achieve the set of values for RES production in 2030, the amount of new PV plants to be installed for each province was computed. Then, the associated request for new surfaces to occupy with those plants was estimated and a comparison with the surface of consumed soil was made so as to verify the possible need for new surfaces. The evaluation of the additional surface area of photovoltaic systems was carried out by weighting the recommendations reported in Reference [59] related to the technically useful surface for new PV at Italian latitudes (6.6–8.2 m2/kW). This is integrated by the contribution in Reference [60] about the statistical average values of soil consumption when equipped with tracking and non-tracking systems that are from 31.6 m2/kW to 40.9 m2/kW and from 23.5 m2/kW to 32.8 m2/kW, respectively.
3. Status Quo, Trends, and Policy Scenarios for Land Consumption and RES
Given that the European Union target is the elimination of net land consumption by 2050, land permeability is promoted, and where covering is unavoidable, compensation through the re-naturalization of equal or greater extension is promoted [61]. However, no directive has been issued by the EU. Similarly, in Italy, the Parliament has not yet approved a law to protect the soil from its progressive artificial coverage.
According to surveys reported by ISPRA [41], in Italy between 2012 to 2017, the soil consumption increased from 22,814 km2 to 23,063 km2, reaching around 7.65% of the national territory. This value is considered the starting point of the analysis, i.e., scenario #0. In detail, the consumption of soil per inhabitant is approximately 382 m2/inhabitant.
Figure 1 shows the projection of soil consumption considering two evolutionary scenarios:
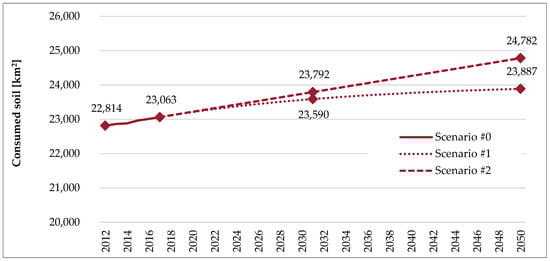
Figure 1.
Soil consumption in Italy.
- Scenario #1 accounts for a progressive reduction in the speed of transformation, equal to −15% every three years, so as to reach an increase in net land occupation equal to zero by 2050. This means that from today to 2050, there would be an additional soil consumption of 818 km2.
- Scenario #2 accounts for the historical trend recorded over the past five years and extends it linearly to 2050. It entails that the future additional soil consumption will be 1672 km2.
Referring to RES deployment, Italy set a target for 2030, i.e., 30% of gross final energy consumption covered by renewables, together with outlining a path for their sustainable growth and full integration into the system [16]. In detail, the target for 2030 foresees a gross final energy consumption of 111 Mtoe (millions of tonnes of oil equivalent), of which about 33 Mtoe is to be supplied by RES.
The electricity sector will be the main contributor, with 16 Mtoe of generation from RES, equal to 187 TWh. Electricity consumption is expected to grow slightly due to the combined effect of the electrification and implementation of energy efficiency measures. It will go from 28.5 Mtoe recorded in 2017 to 29.0 Mtoe in 2030. The strong penetration of electric RES technologies, mainly photovoltaic and wind power, will allow the sector to make renewable 55.4% of gross final electricity consumption in 2030, compared to 34.1% in 2017.
Figure 2 reports the electricity consumption and the renewable electricity share showing the recorder and approved data for 2012–2017 and forecasts up to 2030.
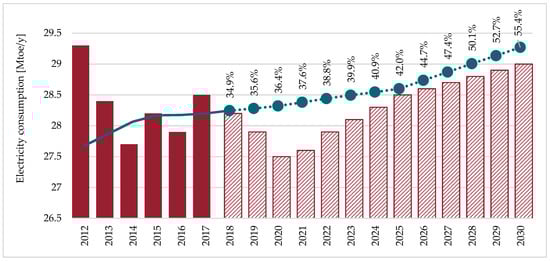
Figure 2.
Electricity consumption and the percentage covered by RES.
Reduction in the cost of photovoltaic and wind power systems will be a key driver of this change.
To achieve the renewable targets by 2030, it will be necessary not only to stimulate new production, but also to preserve the existing one and indeed, where possible, increase it by promoting the revamping and repowering of systems. Promoting the existing wind power revamping and repowering investments with more advanced and efficient machines, taking advantage of the good windiness of already known and used sites, will also limit the impact on soil consumption. A similar approach will have to be followed to drive the significant increase of PV installation first on existing surfaces, such as buildings.
4. Results and Discussion
Statistical analysis of open databases was performed for computing at the provincial level the specific values per capita and per unit of the surface of the three mentioned variables: soil consumption, electricity consumption and renewable electricity production.
Referring to the per capita soil consumption, the average value is 467.9 m2/inh., varying between a minimum value of 129.6 m2/inh. in the province of Naples and a maximum value of 834.8 m2/inh. in the province of Piacenza (Q1 = 382.1 m2/inh.; Q2 = 454.3 m2/inh.; Q3 = 564.6 m2/inh.; CQD = 0.19). A share of 15.1% among the Italian provinces has a soil consumption less than 300 m2/inh., a share of 11.3% more than 600 m2/inh. and the remaining 73.6% has a soil consumption between 300 and 600 m2/inh., as depicted in Figure 3a.
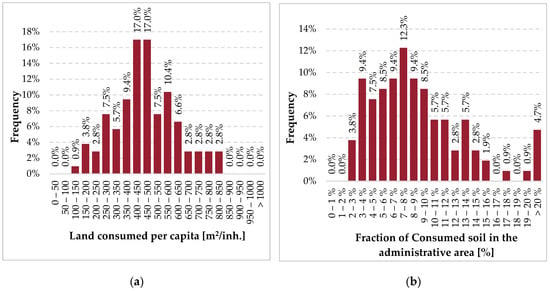
Figure 3.
Distribution of land consumption: (a) per capita and (b) fraction on provincial surface.
The analysis is completed by the fraction of consumed soil per unit of surface of the provincial territory. Larger variations are observed from one province to another one, as reported in Figure 3b. Indeed, the average value is 9.2%, with the minimum in the province of Matera equal to 2.8% and the peak recorded in the province of Monza equal to 41.0% (Q1 = 5.6%; Q2 = 8.0%; Q3 = 11.2%; CQD = 0.34). It is noteworthy that 80.2% of the Italian provinces have a soil consumption of less than 10%.
As regards the electricity consumption, the average value per capita is 5130 kWh/(y·inh.) and varies between a minimum value of 2258 kWh/(y·inh.) in the province of Enna and a maximum value of 12,497 kWh/(y·inh.) in the province of Cremona (Q1 = 3492 kWh/(y·inh.); Q2 = 4839 kWh/(y·inh.); Q3 = 6414 kWh/(y·inh.); CQD = 0.29). In 54.7% of Italian provinces, electricity consumption per capita is less than 5000 kWh/(y·inh.). Only 10.4% of Italian provinces has electricity consumption per capita above 7500 kWh/(y·inh.), as shown in Figure 4a.
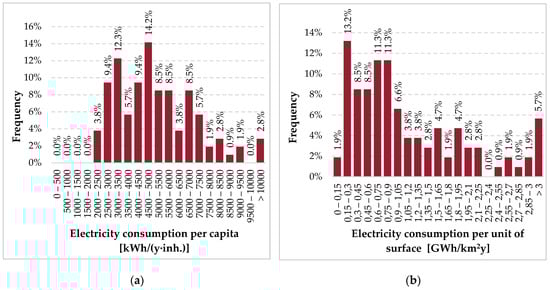
Figure 4.
Distribution of electricity consumption: (a) per capita and (b) per unit of provincial surface.
Even larger variations are observed in the case of electricity consumption computed on unit of provincial territory, as depicted in Figure 4b. The average value is 1.4 GWh/km2y, with the minimum one in the province of Nuoro, equal to 0.1 GWh/km2y and the maximum in the province of Milan, equal to 11.1 GWh/km2y (Q1 = 0.5 GWh/km2y; Q2 = 0.8 GWh/km2y; Q3 = 1.5 GWh/km2y; CQD = 0.55). From the calculation, it is noted that more than 30% of Italian provinces have an electricity consumption lower than 0.5 GWh/km2y, while, 11.3% of the sample overcomes 2.0 GWh/km2y.
Referring to the last analysed variable, i.e., electricity production from RES, the average value per capita is 2526 kWh/(y·inh.) and varies between a minimum value of 152 kWh/(y·inh.) in the province of La Spezia and a maximum one of 24,351 kWh/(y·inh.) in the province of Sondrio (Q1 = 819 kWh/(y·inh.); Q2 = 1528 kWh/(y·inh.); Q3 = 2695 kWh/(y·inh.); CQD = 0.53). In 50.0% of Italian provinces, electricity production from RES is less than 1500 kWh/(y·inh.), whereas 12.3% of Italian provinces produce renewable electricity in the amount 5000 kWh/(y·inh.). Figure 5a reports that distribution.
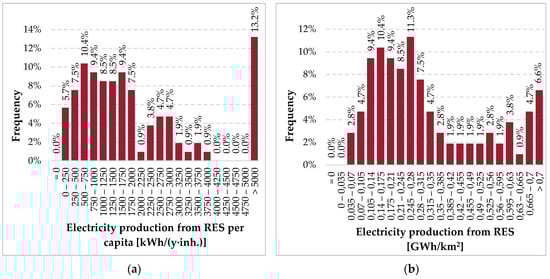
Figure 5.
Distribution of electricity production from RES: (a) per capita and (b) per unit of surface.
On the right side of Figure 5, i.e., b side, the distribution of electricity production from RES per unit of provincial surface is presented. In this case, very limited variations are observed among the provinces. The average value is 0.3 GWh/km2y with a minimum in the province of La Spezia equal to 0.04 GWh/km2y and the maximum in the province of Sondrio equal to 1.4 GWh/km2y (Q1 = 0.2 GWh/km2y; Q2 = 0.3 GWh/km2y; Q3 = 0.4 GWh/km2y; CQD = 0.43). It is noteworthy that more than 78% of the Italian provinces have a value lower than 0.5 GWh/km2y. Only two provinces, i.e., Sondrio and Pisa, show a value higher than 1.25 GWh/km2y, accounting for 1.9% of the sample.
4.1. Analysis of Correlations
The results of the analysis carried out in the previous paragraph were used to search for correlations between the three analysed variables: soil consumption, electricity consumption and renewable electricity production. Using the Excel data analysis tool, a linear and a quadratic regressive analysis was performed in pairs, as summarized in Table 1.

Table 1.
Summary of the regressive analysis carried out.
A derived variable, the non-RES electricity consumption, marked as #5a, #5b, #5c, #5d, was easily calculated by subtracting the third variable from the second one, i.e., electricity production from RES from the electricity consumption. Looking at the table, it is remarkable the correlation between soil consumption per unit of surface and the electricity consumption per unit of surface (#1c, #1d). Similarly, there is a strong correlation between the soil consumption per unit area and the non-RES electricity consumption per unit area (#5c, #5d). For both cases, the quadratic regression shows a slightly higher correlation. However, linear regression is considered suitable for this study since it is the easiest approximation.
Equations (3) and (4) report those correlations and are plotted in Figure 6 and Figure 7, respectively. The electricity consumption per unit area CE, expressed by GWh/km2y, reads as follows:
where CS is the soil consumption per unit of surface expressed by km2/km2.
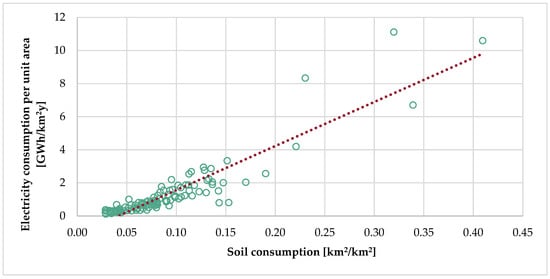
Figure 6.
Soil consumption versus electricity consumption per unit of surface.
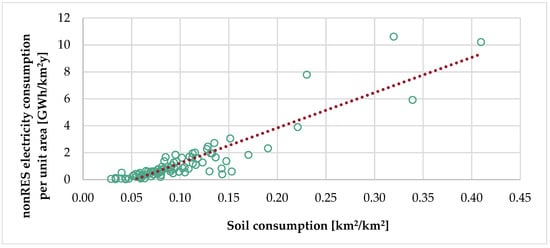
Figure 7.
Soil consumption versus non-RES electricity consumption per unit of surface.
Similarly, the non-RES electricity consumption per unit of surface CEnonRES, expressed by GWh/km2y, reads as:
In order to build the future scenarios, among the two identified correlations as depicted in Table 1 with the values in bold, the one between soil consumption and non-RES electricity consumption per unit of surface was chosen. Indeed, this correlation leads to simultaneously account for the effects of a variation of the overall electricity consumption for the above-mentioned increasing electrification and energy efficiency measures as well as the further integration of new RES plants and their production.
Then, the deviations from the regression line were analysed for the statistic sample. For 57.5% of the Italian provinces, the non-RES electricity consumption was higher than the regression line while, for the remaining 42.5%, it was lower, as shown in Figure 8. Great deviation, i.e., 0.5 GWh/km2y in absolute value, was found for 17.9% and for 11.3% for low and high values, respectively.
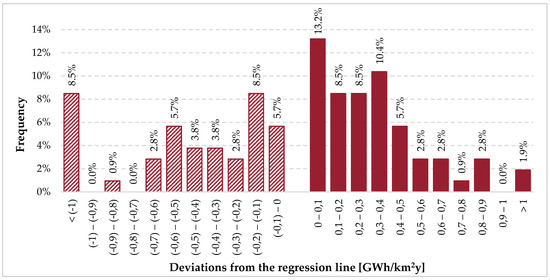
Figure 8.
Distribution of statistic sample deviations from the regression line.
4.2. Future Scenarios
The future scenarios for the electricity sector projected by the current national policy to 2030 and reported in Figure 2 consider a slight increase in electricity consumption, i.e., from 28.5 Mtoe in 2017 to 29.0 Mtoe in 2030, together with a strong increase in the RES share of the electricty production.
In the same interval, this latter variable goes from 34.1% to 55.4%.
At the same time, looking at the soil consumption scenarios presented in Figure 1, the scenario #1 built to achieve a net zero land consumption in 2050 reports the value of 23,063 km2 and 23,590 km2 in 2017 and 2030, respectively. Therefore, to be consistent with the outlined scenarios, Equation (4) was modified, and Equation (5) was elaborated, reading as:
Figure 9 shows the statistical sample and the original and modified regression lines. This is done to check what deviations take place between the current situation and the foreseen one in the Italian provinces. As a consequence, a higher deviation between the statistic sample and the modified regression line accounting for a reduction in land consumption trend appears in Figure 10.
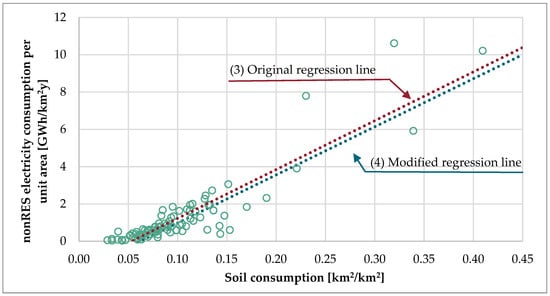
Figure 9.
Soil consumption per unit area versus non-RES electricity consumption per unit of surface.
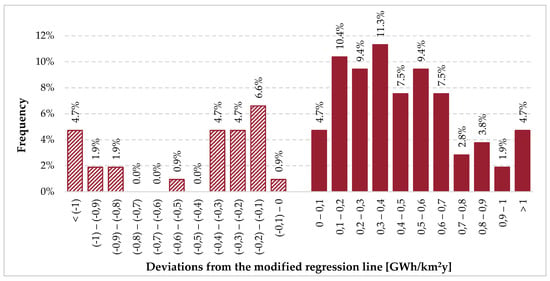
Figure 10.
Distribution of statistic sample deviation from the modified regression line.
Considering the modified regression line and the soil consumption projected for 2030 by the policy documents for net zero land consumption in 2050:
- The target at 2030 is already reached, with non-RES electricity consumption lower than the regression line.
- The remaining land to be consumed should be almost entirely dedicated for the 73.6% of additional RES power plant installations.
Indeed, for each province where additional power (ΔPprov,PV) should be installed to reach the renewable energy policy targets, Equation (6) provides the computational method. It is built accounting for the difference between the current situation and the regression line in terms of non-RES electricity consumption (ΔCEnonRES) and the equivalent production hours of photovoltaic systems (heq,prov,PV) estimated by the National Energy Services Provider GSE [47].
Figure 11 shows the statistical distribution of the additional PV power to be installed. It is noted that 26.4% of the provinces do not call for additional power. Looking at the minimum threshold to overcome for reaching the policy targets, 56.6% of the sample needs an additional power of less than 300 kW/km2, while the cumulative frequency goes to 76.4% when the additional power value is less than 500 kW/km2. Only 8.5% of the Italian provinces require an additional power greater than 700 kW/km2, such as 3156 kW/km2 and 3235 kW/km2 for the province of Pesaro and Padova, respectively.
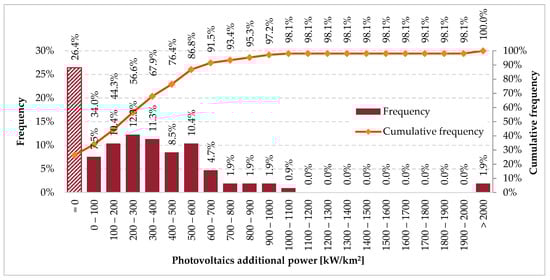
Figure 11.
Distribution of photovoltaic (PV) additional power.
Once the additional PV power to be installed for each province was computed, an estimation of the total area required for it was done. To do so, an average value of 19.8 m2/kW is used as the required surface for installed unit of power.
Figure 12 depicts the distribution of the ratio between the additional land to be consumed for additional PV and the land already consumed. Including 26.4% of the provinces where no additional power is needed, for 52.8% of the Italian provinces, 6% of the surface already consumed is sufficient. The share rises to 70.8% considering all the provinces where less than 10% of the already consumed soil is needed for new PV installation. However, 4.7% of the Italian provinces call for an additional area of more than 30% of the already consumed soil required. This is the case of provinces of Siena with 33.6%, Padova with 33.7%, Sondrio with 35.4%, Isernia with 54.2% and with the remarkable peak of Pesaro with 90.4%.
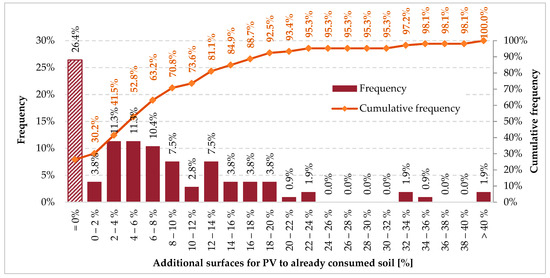
Figure 12.
Distribution of share of additional surfaces for PV to already consumed soil.
This estimation does not take into account the real availability of those surfaces for new PV, but it computes their demand.
Nevertheless, some preliminary indications can be drawn:
- For those provinces where the required space is less than 10% of the consumed soil, it is likely that the targets can be reached by 2030 without resorting to new surfaces.
- For those provinces where the additional required land exceeds 30% of the consumed soil, the achievement of the target by 2030 will certainly be difficult, with only the use of photovoltaic systems.
In this latter case, in-depth studies should be conducted, aimed at a more detailed plan and at activating forms of subsidiarity between neighbouring provinces, together with using higher resolution investigation methods such as GIS.
It is worth mentioning that in this study, reference was made only to PV systems to obtain an additional RES electricity production compared to the current production, not considering the potential of other RES present on the Italian territory: wind energy first, but also bioenergy, hydroelectric and geothermal. The limitation of the study is to highlight the unexploited potential of solar energy in a country with such huge solar irradiation.
Electrification of the energy system will lead to increases in the gross final renewable energy consumption only if supported by energy efficiency measures. Soil is a relevant resource put at the back once the incentive schemes for RES started. The case was for extended areas covered by PV and subtracted by the agricultural sector.
Moreover, priority to brownfield coverage, such as strong commitment for building integrated photovoltaics (BIPV), reveals a much larger number of surfaces to use without incurring soil consumption.
5. Conclusions
The European Community has defined its 2030 targets for greenhouse gas emissions, renewable sources and energy efficiency, with a vision of future development focused on sustainability. Facing the climate change posing the objectives of preserving the landscape, ensuring air quality and water bodies, safeguarding biodiversity and protecting the soil, the necessary interventions for increasing decarbonisation require infrastructures and systems with potential further environmental impacts. This is the case of additional RES plants’ installation.
In this context, the present study wanted to check the compatibility between all the aforementioned objectives with a focus between land consumption and renewable energy deployment. The case analysed was the solar energy deployment in Italy, at the provincial level.
The topic of energy planning was tackled by the statistical analysis of three open databases provided by National Institutions. Comparing the trends and policy scenarios for soil consumption, electricity consumption and renewable electricity production correlations were investigated. Strong correlations were found between soil consumption and electricity consumption, both with reference to the overall second variable (R2 = 0.8310) and with reference only to its non-renewable part (R2 = 0.8237). They were then used to evaluate the possibility of reaching the electricity production targets from RES to 2030, using only photovoltaic systems and exploiting areas already consumed.
The obtained results show that in a large part of the Italian provinces (70.8%), the use of 10% of the soil already consumed could be sufficient to achieve the set objectives. However, they also show that for 4.7% of Italian provinces, the additional area useful for the installation of photovoltaic systems is more than 30% of the consumed soil, with two provinces even exceeding 50%.
The obtained results, even though at higher resolution thanks to the introduction of geographic information systems (GIS), highlight a challenging achievement of both the targets in 2030 when a higher renewable energy share and a contemporary greater electrification are foreseen.
The limitation to solar electricity is given by the lowest impact of new PV installation compared to the authorization process, where wind energy, bioenergy, hydro-electric or geothermal incur. Moreover, it is the current cheapest RES with the largest potential in a country at the latitude of Italy.
Finally, the renewable energy share target for 2050 to be achieved together with a net zero further land consumption in the same year appears unlikely and very demanding, unless the brownfield will play a key role in energy strategy for the large deployment of building integrated photovoltaics.
Author Contributions
The authors equally contributed to this paper. All authors have read and agreed to the published version of the manuscript.
Funding
This research received no external funding.
Conflicts of Interest
The authors declare no conflict of interest.
Appendix A
Through the Geoportal, ISPRA provides information derived from INSPIRE National Monitoring (INfrastructure for SPatial InfoRmation in Europe, Directive 2007/2/EC of the European Parliament and of the Council) and made available by Central and Regional Administrations and Research Institutes having environmental competences. Data on Italian environment status are available through searches based on INSPIRE metadata or by viewing them directly using the thematic Web Viewers (Generic Map Viewer, Land Use, Nature Viewer, Landslides Inventory, Italian Geological Service).
The Land Use Viewer was used to visualize the data optimized for queries on indexes of Italian land use and land cover. Figure A1 shows an example of the map of the Province of Rome.

Figure A1.
Soil consumption in the Province of Rome.
Figure A1.
Soil consumption in the Province of Rome.

Visualisation data are available in numerical files. Table A1 provides a summary of available databases with different resolutions (regional, provincial, municipal) and different years (2012, 2015, 2017, 2018).
Table A1.
Summary of available databases in Geoportal ISPRA.
Table A1.
Summary of available databases in Geoportal ISPRA.
| Open Data Description | Unit |
|---|---|
| Consumed/Not consumed/Not classified soil | km2 |
| Consumed/Not consumed/Not classified soil in % of the administrative unit area | % |
| Increase of consumed soil in hectares | km2 |
| Density of consumed soil over total area | m2/km2 |
| Consumed/Not consumed/Not classified soil in protected areas in hectares | km2 |
| Consumed/Not consumed/Not classified soil in 150 m river buffer zones | km2, % |
| Consumed/Not consumed soil in 300/300–1000/1000–10,000 m from shoreline | km2, % |
| Consumed/Not consumed soil in 0–300/300–600/over 600 m a.s.l. (Above See Level) | km2, % |
| Consumed/Not consumed soil in 0–10%/over 10% slope | km2, % |
| Consumed/Not consumed soil in flood hazard zones | km2, % |
| Consumed/Not consumed soil in landslide hazard zones | km2, % |
| Consumed/Not consumed soil in high/very high seismic hazard zones | km2, % |
| Surface in/not in a 60/100/200 n buffer of consumed soil area | km2, % |
| Surface of Permanent Water Bodies | km2 |
| Classification of municipalities centrality | |
| Classification of municipalities elevation | |
| Total administrative area | km2 |
| Population | |
| Population density | inh./km2 |
| Ratio of low-density urban area on urban area | % |
| Landscape metrics classification of urban areas | |
| Built-up (20 m)/(5 m) area in rural/urban areas | km2, % |
| Urban area | km2, % |
| Rural area | % |
| Low density/Compact urban area | % |
Appendix B
Terna, the National TSO, provides a functional tool to check the collected data (demand, consumption, production, capacity) recorded (since 2000) by producers and distributors (Table A2).
Table A2.
Summary of available open databases.
Table A2.
Summary of available open databases.
| Open Data Description | Unit | Resolution | |
|---|---|---|---|
| Demand | Electricity supplied | TWh | National/Regional |
| Structure of electricity supplied (Bioenergy, Wind, Photovoltaic, Geothermal, Hydropower, Pumping, Thermal) | TWh | National/Regional | |
| Distribution of demand coverage | TWh | National/Regional | |
| Consumption | Electricity consumption by sector | TWh | National/Regional |
| Electricity consumption in the industrial sector | TWh | National/Regional | |
| Electricity consumption by market type (Self-consumption, Free market, Captive market) | TWh | National/Regional | |
| Consumption of electricity by type of activity | TWh | National/Regional/Provincial | |
| Production | Gross Electricity production by source (Net/Gross) | TWh | National/Regional |
| Gross Production from thermoelectric sections (Net/Gross) | TWh | National/Regional | |
| Renewable sources electricity production (Net/Gross) | TWh | National/Regional/Provincial | |
| Capacity | Gross efficient power by source | MW | National/Regional |
| Gross efficient power of thermoelectric sections | MW | National/Regional | |
| Gross efficient power of renewable energy plants (Bioenergy, Wind, Photovoltaic, Geothermal, Hydro) | % | National/Regional | |
References
- European Commission. A Clean Planet for all A European strategic long-term vision for a prosperous, modern, competitive and climate neutral economy. COM 2018, 773, 1–25. [Google Scholar]
- Zappa, W.; Junginger, M.; van den Broek, M. Is a 100% renewable European power system feasible by 2050? Appl. Energy 2019, 233–234, 1027–1050. [Google Scholar] [CrossRef]
- McDonagh, S.; Wall, D.M.; Deane, P.; Murphy, J.D. The effect of electricity markets, and renewable electricity penetration, on the levelised cost of energy of an advanced electro-fuel system incorporating carbon capture and utilisation. Renew. Energy 2019, 131, 364–371. [Google Scholar] [CrossRef]
- Simoes, S.G.; Dias, L.; Gouveia, J.P.; Seixas, J.; De Miglio, R.; Chiodi, A.; Gargiulo, M.; Long, G.; Giannakidis, G. INSMART—Insights on integrated modelling of EU cities energy system transition. Energy Strategy Rev. 2018, 20, 150–155. [Google Scholar] [CrossRef]
- Nastasi, B. Hydrogen Policy, Market and R&D Projects. In Hydrogen Production from Solar Energy; Calise, F., D’Accadia, M.D., Santarelli, M., Lanzini, A., Ferrero, D., Eds.; Elsevier: Amsterdam, The Netherlands, 2019; ISBN 9780128148532. [Google Scholar]
- Fischer, D.; Harbrecht, A.; Surmann, A.; McKenna, R. Electric vehicles’ impacts on residential electric local profiles—A stochastic modelling approach considering socio-economic, behavioural and spatial factors. Appl. Energy 2019, 233–234, 644–658. [Google Scholar] [CrossRef]
- Mancini, F.; Lo Basso, G.; De Santoli, L. Energy Use in Residential Buildings: Characterisation for Identifying Flexible Loads by Means of a Questionnaire Survey. Energies 2019, 12, 2055. [Google Scholar] [CrossRef]
- Kyritsis, E.; Andersson, J.; Serletis, A. Electricity prices, large-scale renewable integration, and policy implications. Energy Policy 2017, 101, 550–560. [Google Scholar] [CrossRef]
- Paraschiv, F.; Erni, D.; Pietsch, R. The impact of renewable energies on EEX day-ahead electricity prices. Energy Policy 2014, 73, 196–210. [Google Scholar] [CrossRef]
- The European Parliament and the Council of the European Union. Directive 2001/77/EC of The European Parliament And of the Council of 27 September 2001 on the promotion of electricity produced from renewable energy sources in the internal electricity market. Off. J. Eur. Communities L 2001, 283, 33–40. [Google Scholar]
- Manfren, M. Multi-Scale Computing for a Sustainable Built Environment. In Smart Cities; John Wiley & Sons, Inc.: Hoboken, NJ, USA, 2017; pp. 53–97. [Google Scholar]
- Nastasi, B. Power to Gas and Hydrogen applications to energy systems at different scales—Building, District and National level. Int. J. Hydrogen Energy 2019, 44, 9485. [Google Scholar] [CrossRef]
- Adhikari, R.S.; Aste, N.; Manfren, M. Multi-commodity network flow models for dynamic energy management—Smart Grid applications. Energy Procedia 2012, 14, 1374–1379. [Google Scholar] [CrossRef]
- Hossain, M.S.; Madlool, N.A.; Rahim, N.A.; Selvaraj, J.; Pandey, A.K.; Khan, A.F. Role of smart grid in renewable energy: An overview. Renew. Sustain. Energy Rev. 2016, 60, 1168–1184. [Google Scholar] [CrossRef]
- Mancini, F.; Nastasi, B. Energy Retrofitting Effects on the Energy Flexibility of Dwellings. Energies 2019, 12, 2788. [Google Scholar] [CrossRef]
- Ministero dello Sviluppo Economico; Ministero dell’Ambiente e della Tutela del Territorio e del Mare; Ministero delle Infrastrutture e dei Trasporti. Proposta di Piano Nazionale Integrato Per L’energia E Il Clima. Available online: https://www.mise.gov.it/images/stories/documenti/Proposta_di_Piano_Nazionale_Integrato_per_Energia_e_il_Clima_Italiano.pdf (accessed on 11 September 2019).
- Piras, G.; Pini, F.; Astiaso Garcia, D. Correlations of PM10 concentrations in urban areas with vehicle fleet development, rain precipitation and diesel fuel sales. Atmos. Pollut. Res. 2019, 10, 1165–1179. [Google Scholar] [CrossRef]
- Castillo, C.P.; e Silva, F.B.; Lavalle, C. An assessment of the regional potential for solar power generation in EU-28. Energy Policy 2016, 88, 86–99. [Google Scholar] [CrossRef]
- Aste, N.; Del Pero, C.; Leonforte, F.; Manfren, M. A simplified model for the estimation of energy production of PV systems. Energy 2013, 59, 503–512. [Google Scholar] [CrossRef]
- Mazzoni, S.; Ooi, S.; Nastasi, B.; Romagnoli, A. Energy storage technologies as techno-economic parameters for master-planning and optimal dispatch in smart multi energy systems. Appl. Energy 2019, 254, 113682. [Google Scholar] [CrossRef]
- Kabir, E.; Kumar, P.; Kumar, S.; Adelodun, A.A.; Kim, K.-H. Solar energy: Potential and future prospects. Renew. Sustain. Energy Rev. 2018, 82, 894–900. [Google Scholar] [CrossRef]
- Biyik, E.; Araz, M.; Hepbasli, A.; Shahrestani, M.; Yao, R.; Shao, L.; Essah, E.; Oliveira, A.C.; del Caño, T.; Rico, E.; et al. A key review of building integrated photovoltaic (BIPV) systems. Eng. Sci. Technol. Int. J. 2017, 20, 833–858. [Google Scholar] [CrossRef]
- Sahu, B.K. A study on global solar PV energy developments and policies with special focus on the top ten solar PV power producing countries. Renew. Sustain. Energy Rev. 2015, 43, 621–634. [Google Scholar] [CrossRef]
- Overholm, H. Spreading the rooftop revolution: What policies enable solar-as-a-service? Energy Policy 2015, 84, 69–79. [Google Scholar] [CrossRef]
- Tronchin, L.; Manfren, M.; James, P.A. Linking design and operation performance analysis through model calibration: Parametric assessment on a Passive House building. Energy 2018, 165, 26–40. [Google Scholar] [CrossRef]
- Garcia, D.A.; Cumo, F.; Tiberi, M.; Sforzini, V.; Piras, G. Cost-benefit analysis for energy management in public buildings: Four Italian case studies. Energies 2016, 9, 522. [Google Scholar] [CrossRef]
- Mancini, F.; Lo Basso, G.; de Santoli, L. Energy Use in Residential Buildings: Impact of Building Automation Control Systems on Energy Performance and Flexibility. Energies 2019, 12, 2896. [Google Scholar] [CrossRef]
- Pueyo, A. What constrains renewable energy investment in Sub-Saharan Africa? A comparison of Kenya and Ghana. World Dev. 2018, 109, 85–100. [Google Scholar] [CrossRef]
- Neves, A.R.; Leal, V.; Lourenço, J.C. A methodology for sustainable and inclusive local energy planning. Sustain. Cities Soc. 2015, 17, 110–121. [Google Scholar] [CrossRef]
- Garcia, D.A.; Cumo, F.; Pennacchia, E.; Pennucci, V.S.; Piras, G.; De Notti, V.; Roversi, R. Assessment of a urban sustainability and life quality index for elderly. Int. J. Sustain. Dev. Plan. 2017, 12, 908–921. [Google Scholar] [CrossRef]
- Poudineh, R.; Jamasb, T. Distributed generation, storage, demand response and energy efficiency as alternatives to grid capacity enhancement. Energy Policy 2014, 67, 222–231. [Google Scholar] [CrossRef]
- de Santoli, L.; Mancini, F.; Garcia, D.A. A GIS-based model to assess electric energy consumptions and usable renewable energy potential in Lazio region at municipality scale. Sustain. Cities Soc. 2019, 46, 101413. [Google Scholar] [CrossRef]
- Manfren, M. Multi-commodity network flow models for dynamic energy management—Mathematical formulation. Energy Procedia 2012, 14, 1380–1385. [Google Scholar] [CrossRef]
- Adhikari, R.S.; Aste, N.; Manfren, M.; Marini, D. Energy Savings through Variable Speed Compressor Heat Pump Systems. Energy Procedia 2012, 14, 1337–1342. [Google Scholar] [CrossRef]
- Frontini, F.; Manfren, M.; Tagliabue, L.C. A Case Study of Solar Technologies Adoption: Criteria for BIPV Integration in Sensitive Built Environment. Energy Procedia 2012, 30, 1006–1015. [Google Scholar] [CrossRef]
- Groppi, D.; Garcia, D.A.; Lo Basso, G.; De Santoli, L. Synergy between smart energy systems simulation tools for greening small Mediterranean islands. Renew. Energy 2019, 135, 515–524. [Google Scholar] [CrossRef]
- Martín-Chivelet, N. Photovoltaic potential and land-use estimation methodology. Energy 2016, 94, 233–242. [Google Scholar] [CrossRef]
- Arabatzis, G.; Kyriakopoulos, G.; Tsialis, P. Typology of regional units based on RES plants: The case of Greece. Renew. Sustain. Energy Rev. 2017, 78, 1424–1434. [Google Scholar] [CrossRef]
- Alsayegh, O.; Saker, N.; Alqattan, A. Integrating sustainable energy strategy with the second development plan of Kuwait. Renew. Sustain. Energy Rev. 2018, 82, 3430–3440. [Google Scholar] [CrossRef]
- Nezhad, M.M.; Groppi, D.; Marzialetti, P.; Fusilli, L.; Laneve, G.; Cumo, F.; Garcia, D.A. Wind energy potential analysis using Sentinel-1 satellite: A review and a case study on Mediterranean islands. Renew. Sustain. Energy Rev. 2019, 109, 499–513. [Google Scholar] [CrossRef]
- Istituto superiore per la protezione e la ricerca ambientale (ISPRA); Marchetti, M.; Marino, D.; de Toni, A.; Giaccio, V.; Giannelli, A.; Mastronardi, L.; Nofroni, L.; Rivieccio, R.; Vizzarri, M. Consumo di suolo, dinamiche territoriali e servizi ecosistemici. In Edizione 2018; ISPRA: Rome, Italy, 2018. [Google Scholar]
- Delfanti, L.; Colantoni, A.; Recanatesi, F.; Bencardino, M.; Sateriano, A.; Zambon, I.; Salvati, L. Solar plants, environmental degradation and local socioeconomic contexts: A case study in a Mediterranean country. Environ. Impact Assess. Rev. 2016, 61, 88–93. [Google Scholar] [CrossRef]
- European Parliament and the Council of the European Union. Directive 2007/2/EC of the European Parliament and of the Council of 14 March 2007 establishing an Infrastructure for Spatial Information in the European Community (INSPIRE). Off. J. Eur. Union L 2007, 108, 50. [Google Scholar]
- Geoviewer Ispra. Available online: http://www.geoviewer.isprambiente.it/index.html?config=config_en.xml (accessed on 2 January 2020).
- Consumo_suolo_2019_Com_Prov_Reg_It_1_1|Uso, Copertura e Consumo di Suolo. Available online: http://groupware.sinanet.isprambiente.it/uso-copertura-e-consumo-di-suolo/library/consumo-di-suolo/indicatori/consumo_suolo_2019_com_prov_reg_it_1_1 (accessed on 2 January 2020).
- Terna S.p.A. The Evolution of the Electricity Market: All Data. Available online: https://www.terna.it/en/electric-system/statistical-data-forecast/evolution-electricity-market (accessed on 10 September 2019).
- Gestore dei Servizi Energetici. Monitoraggio Fer. Available online: https://www.gse.it/dati-e-scenari/monitoraggio-fer# (accessed on 22 August 2019).
- GSE—Gestore dei Servizi Energetici S.p.A. Available online: https://atla.gse.it/atlaimpianti/project/Atlaimpianti_Internet.html (accessed on 10 September 2019).
- Fritsche, U.; Berndes, B.; Cowie, A.; Dale, V.; Kline, K. Energy and Land Use. In Working Paper for the Global Land Outlook; UN Convention to Combat Desertification: Bonn, Germany, 2017. [Google Scholar]
- Fthenakis, V.; Kim, H.C. Land use and electricity generation: A life-cycle analysis. Renew. Sustain. Energy Rev. 2009, 13, 1465–1474. [Google Scholar] [CrossRef]
- Cheng, V.K.M.; Hammond, G.P. Life-cycle energy densities and land-take requirements of various power generators: A UK perspective. J. Energy Inst. 2017, 90, 201–213. [Google Scholar] [CrossRef]
- van Zalk, J.; Behrens, P. The spatial extent of renewable and non-renewable power generation: A review and meta-analysis of power densities and their application in the U.S. Energy Policy 2018, 123, 83–91. [Google Scholar] [CrossRef]
- Konadu, D.D.; Mourão, Z.S.; Allwood, J.M.; Richards, K.S.; Kopec, G.; McMahon, R.; Fenner, R. Land use implications of future energy system trajectories—The case of the UK 2050 Carbon Plan. Energy Policy 2015, 86, 328–337. [Google Scholar] [CrossRef]
- Waite, J.L. Land reuse in support of renewable energy development. Land Use Policy 2017, 66, 105–110. [Google Scholar] [CrossRef]
- Riahi, K.; van Vuuren, D.P.; Kriegler, E.; Edmonds, J.; O’Neill, B.C.; Fujimori, S.; Bauer, N.; Calvin, K.; Dellink, R.; Fricko, O.; et al. The Shared Socioeconomic Pathways and their energy, land use, and greenhouse gas emissions implications: An overview. Glob. Environ. Chang. 2017, 42, 153–168. [Google Scholar] [CrossRef]
- van Vuuren, D.P.; Stehfest, E.; Gernaat, D.E.H.J.; Doelman, J.C.; van den Berg, M.; Harmsen, M.; de Boer, H.S.; Bouwman, L.F.; Daioglou, V.; Edelenbosch, O.Y.; et al. Energy, land-use and greenhouse gas emissions trajectories under a green growth paradigm. Glob. Environ. Chang. 2017, 42, 237–250. [Google Scholar] [CrossRef]
- Pao, H.-T.; Yu, H.-C.; Yang, Y.-H. Modeling the CO2 emissions, energy use, and economic growth in Russia. Energy 2011, 36, 5094–5100. [Google Scholar] [CrossRef]
- Zhao, X.; Du, D. Forecasting carbon dioxide emissions. J. Environ. Manag. 2015, 160, 39–44. [Google Scholar] [CrossRef]
- Chiabrando, R.; Fabrizio, E.; Garnero, G. The territorial and landscape impacts of photovoltaic systems: Definition of impacts and assessment of the glare risk. Renew. Sustain. Energy Rev. 2009, 13, 2441–2451. [Google Scholar] [CrossRef]
- Mauro, G.; Lughi, V. Mapping land use impact of photovoltaic farms via crowdsourcing in the Province of Lecce (Southeastern Italy). Sol. Energy 2017, 155, 434–444. [Google Scholar] [CrossRef]
- European Commission; European Environment Agency. No Net Land Take by 2050? Science for Environment Policy Future Brief 14. Available online: https://www.eea.europa.eu/data-and-maps/indicators/land-recycling-and-densification/no-net-land-take-by (accessed on 10 September 2019).


© 2020 by the authors. Licensee MDPI, Basel, Switzerland. This article is an open access article distributed under the terms and conditions of the Creative Commons Attribution (CC BY) license (http://creativecommons.org/licenses/by/4.0/).