Article

Research on the Processes of Injecting CO2 into Coal Seams with CH4 Recovery Using Horizontal Wells

by
Jarosław Chećko
1,
Tomasz Urych
1,
Małgorzata Magdziarczyk
2 and
Adam Smolinski
1,*
1
Central Mining Institute, Plac Gwarków 1, 40-166 Katowice, Poland
2
Faculty of Economics and Management, Opole University of Technology, ul. Luboszycka 7, 45-036 Opole, Poland
*
Author to whom correspondence should be addressed.
Energies 2020, 13(2), 416; https://doi.org/10.3390/en13020416
Submission received: 18 December 2019 / Revised: 12 January 2020 / Accepted: 13 January 2020 / Published: 15 January 2020
(This article belongs to the Special Issue Coal Conversion Processes)

Abstract

:
The paper presents a research study on modeling and computer simulation of injecting CO2 into the coal seams of the Upper Silesian Coal Basin, Poland connected with enhanced coal bed methane (ECBM) recovery. In the initial stage of the research activities, a structural parameter model was developed specifically with reference to the coal-bearing formations of the Upper Carboniferous for which basic parameters of coal quality and the distribution of methane content were estimated. In addition, a lithological model of the overall reservoir structure was developed and the reservoir parameters of the storage site were analyzed. In the next stage of the research, the static model was supplemented with detailed reservoir parameters as well as the thermodynamic properties of fluids and complex gases. The paper discusses a series of simulations of an enhanced coalbed methane recovery process with a simultaneous injection of carbon dioxide. The analyses were performed using the ECLIPSE software designed for simulating coal seam processes. The results of the simulations demonstrated that the total volume of CO2 injected to a designated seam in a coal mine during the period of one year equaled 1,954,213 sm3. The total amount of water obtained from the production wells during the whole period of the simulations (6.5 years) was 9867 sm3. At the same time, 15,558,906 sm3 of gas was recovered, out of which 14,445,424 sm3 was methane. The remaining 7% of the extracted gas was carbon dioxide as a result of reverse production of the previously injected CO2. However, taking into consideration the phenomena of coal matrix shrinking and swelling, the total amount of injected CO2 decreased to approximately 625,000 sm3.

1. Introduction

Currently, CO2 sequestration in deep unmineable coal seams with parallel methane recovery is considered as one of the potential methods of carbon dioxide utilization [1,2]. In the enhanced coal bed methane (ECBM) technology, the injected CO2 displaces methane on account of the preferential adsorption of CO2 in coal. In general terms, the technology consists in the desorption, diffusion and filtration of the methane adsorbed within the coal matrix towards the production wells at the same time when CO2, which is subject to the same processes, will follow the reversed path, i.e., the desorption, diffusion and filtration in coal [3,4,5,6]. During the ECBM process, the permeability in the vicinity of the injection well gradually decreases, whereas in the vicinity of the production well it first increases and then decreases. This phenomenon is connected with the process of permeability changes within the ECBM technology [7]. The transformation of pore and cleat structures of coal connected with the supercritical CO2 leads to the increase in permeability within the zone of coal strata, which constitutes a key factor for CO2 sequestration and the efficiency of CH4 production [8,9,10]. Lowering the pressure of fluids in the production well and the removal of coal seam waters, which initiates the process of methane desorption accelerated by injecting CO2 to the coal seam through the injection well, constitute the point of departure. The phenomenon of displacing methane by CO2 is based on the assumption that carbon dioxide under the pressure of about 7.38 MPa (i.e., below the critical point) characterizes of greater molecule affinity in relation to coals than methane does (the most frequently quoted preferential sorption ratio is 2:1). In the next stage of the process, the desorbed methane undergoes diffusion through the coal matrix towards the cleat system where it is filtered, according to a pressure gradient, towards the production wells [11]. The ECBM technology is still in the research phase, and, consequently there remain numerous aspects that have not been fully recognized yet, for example the scope of preferential sorption of CO2 in relation to CH4, the flow of the process once the critical point has been achieved as well as the impact of coal physical properties [12,13,14,15,16,17,18]. ECBM constitutes a method, which combines CO2 sequestration in coal seams with the recovery of coal bed methane, which can achieve 72% efficiency [12]. ECBM projects using CO2 and N2 have been carried on since the 1990s in San Juan Basin (USA). Such experimental ECBM works showed that the injection of these gases is technically and economically feasible because it resulted in an increase in methane extraction by about 17–18% in the case of CO2 injection and about 10–20% in the case of N2 injection [19,20,21].
Carbon dioxide stored in porous geological formations is perceived almost exclusively as waste in light of Polish legislation and current technological development. Within the framework of Polish legislation, the concept of waste was set out in the Act of 14 December 2012 On Waste (consolidated text of 15 March 2019 Journal of Laws of 2019, item 701) [22]. The Act on Waste precisely lays down the measures aiming at the protection of the natural environment and human health by means of preventing or mitigating the adverse impacts of the generation and management of waste. The legislator defined waste as any substance or object, which the holder discards, or intends, or is required to discard. However, the legislator singled out a few exceptions, in the case of which the provisions of the act do not apply. Carbon dioxide designated for underground storage in order to execute a CCS demonstration project constitutes such an exception as stipulated by the Geological and Mining Law Act of 9 June 2011, article 1, item 3 (consolidated text of 4 April 2019, Journal of Laws of 2019, item 868) [22].
Considering the conditions of Polish coal resources, the ECBM technology could be applied in the Upper Silesian Coal Basin (USCB) [23]. It is worth mentioning that a few years ago, a unique pilot project RECOPOL (Reduction of CO2 emission by means of CO2 storage in coal seams in the Silesian Coal Basin of Poland) utilizing the ECBM technology was executed in the aforementioned coal basin. The experimental site of RECOPOL, which was one of the first projects of such a kind in the world, was located in a region encompassing the coal seams belonging to Silesia coal mine [24,25].
In contrast to the generally accepted criteria for the selection of formations designated for CO2 sequestration in saline aquifers [26,27], the criteria regarding the selection of sites suitable for the application of ECBM technology have in large part a different character. The assumptions that are of a more general nature constitute an exception. The general criteria include a favorable depth interval within the range of 800–2500 m, the minimum depth of approximately 800 m because of the so called CO2 critical point connected with the temperature and pressure of the rock mass as well as safety conditions related to the occurrence of impermeable rock formations and weak tectonic engagement of the rock mass. Apart from the above mentioned general assumptions, parameters that are directly connected with the specific coal seams, namely the methane content, the petro-physical parameters and, especially permeability are of fundamental importance for the selection of potential CO2 storage sites.
One of the most significant issues concerning the CO2 storage in coal seams is to protect the existing resources as well as to ensure that they are accessible for mining activities. Basically, the seams that are CO2 saturated as a result of carbon dioxide sequestration should be regarded as lost in terms of underground exploitation. The selection of potential sites designated for CO2 sequestration is determined by restrictions related to environmental protection, and, especially to land and urban development. Limited areal distribution of the coal seams within the Upper Silesian Coal Basin considerably decreases the potential of selecting CO2 storage sites. In light of the above mentioned conditions, the following assumptions have been adopted for the selection of carbon dioxide sequestration sites [28]:
  • Areas located beyond the coal seams belonging to operating coal mines, regardless of depth,
  • Minimum depth below 1000 m, preferably 1250–1300 m,
  • Methane content above 4.5 m3 CH4/Mgdaf, (preferably >8.0 m3 CH4/Mgdaf),
  • Occurrence of claystone and mudstone formations in the Carboniferous strata above the CO2 storage as well as isolating formations of Carboniferous overburden,
  • Low degree of urban development.
The aim of the paper is to present the results of modeling and computer simulations of injecting CO2 into selected coal seams of the Upper Silesian Coal Basin, Poland. On the basis of the developed models, the study discusses a series of simulations of the process of enhanced coal bed methane recovery with a simultaneous sequestration of CO2.

2. Materials and Methods

Based on the analysis of geological structures and the deposition of high methane content coal seams in the Upper Silesian Coal Basin, Poland, three promising regions were selected, namely Studzienice, Bzie-Dębina and Pawłowice–Mizerów (see Figure 1).
Region Pawłowice–Mizerów comprising two coal seams, 405 and 510, was selected for the research activities. Coal seams 405 and 510 deposited at the depth of 1130 m and 2270 m characterize of average methane content of 4.2 m3 CH4/Mgdaf and 3.8 m3 CH4/Mgdaf, respectively. For the chosen region, which may constitute a potential CO2 sequestration site, a static model was developed, which takes into consideration the possible occurrence of faults, the lithology of the modeled rock mass as well as the distribution of methane content in the two seams. The above mentioned model was a starting point for the development of a dynamic model encompassing the simulations of injecting CO2 into coal seams using directional drilling.
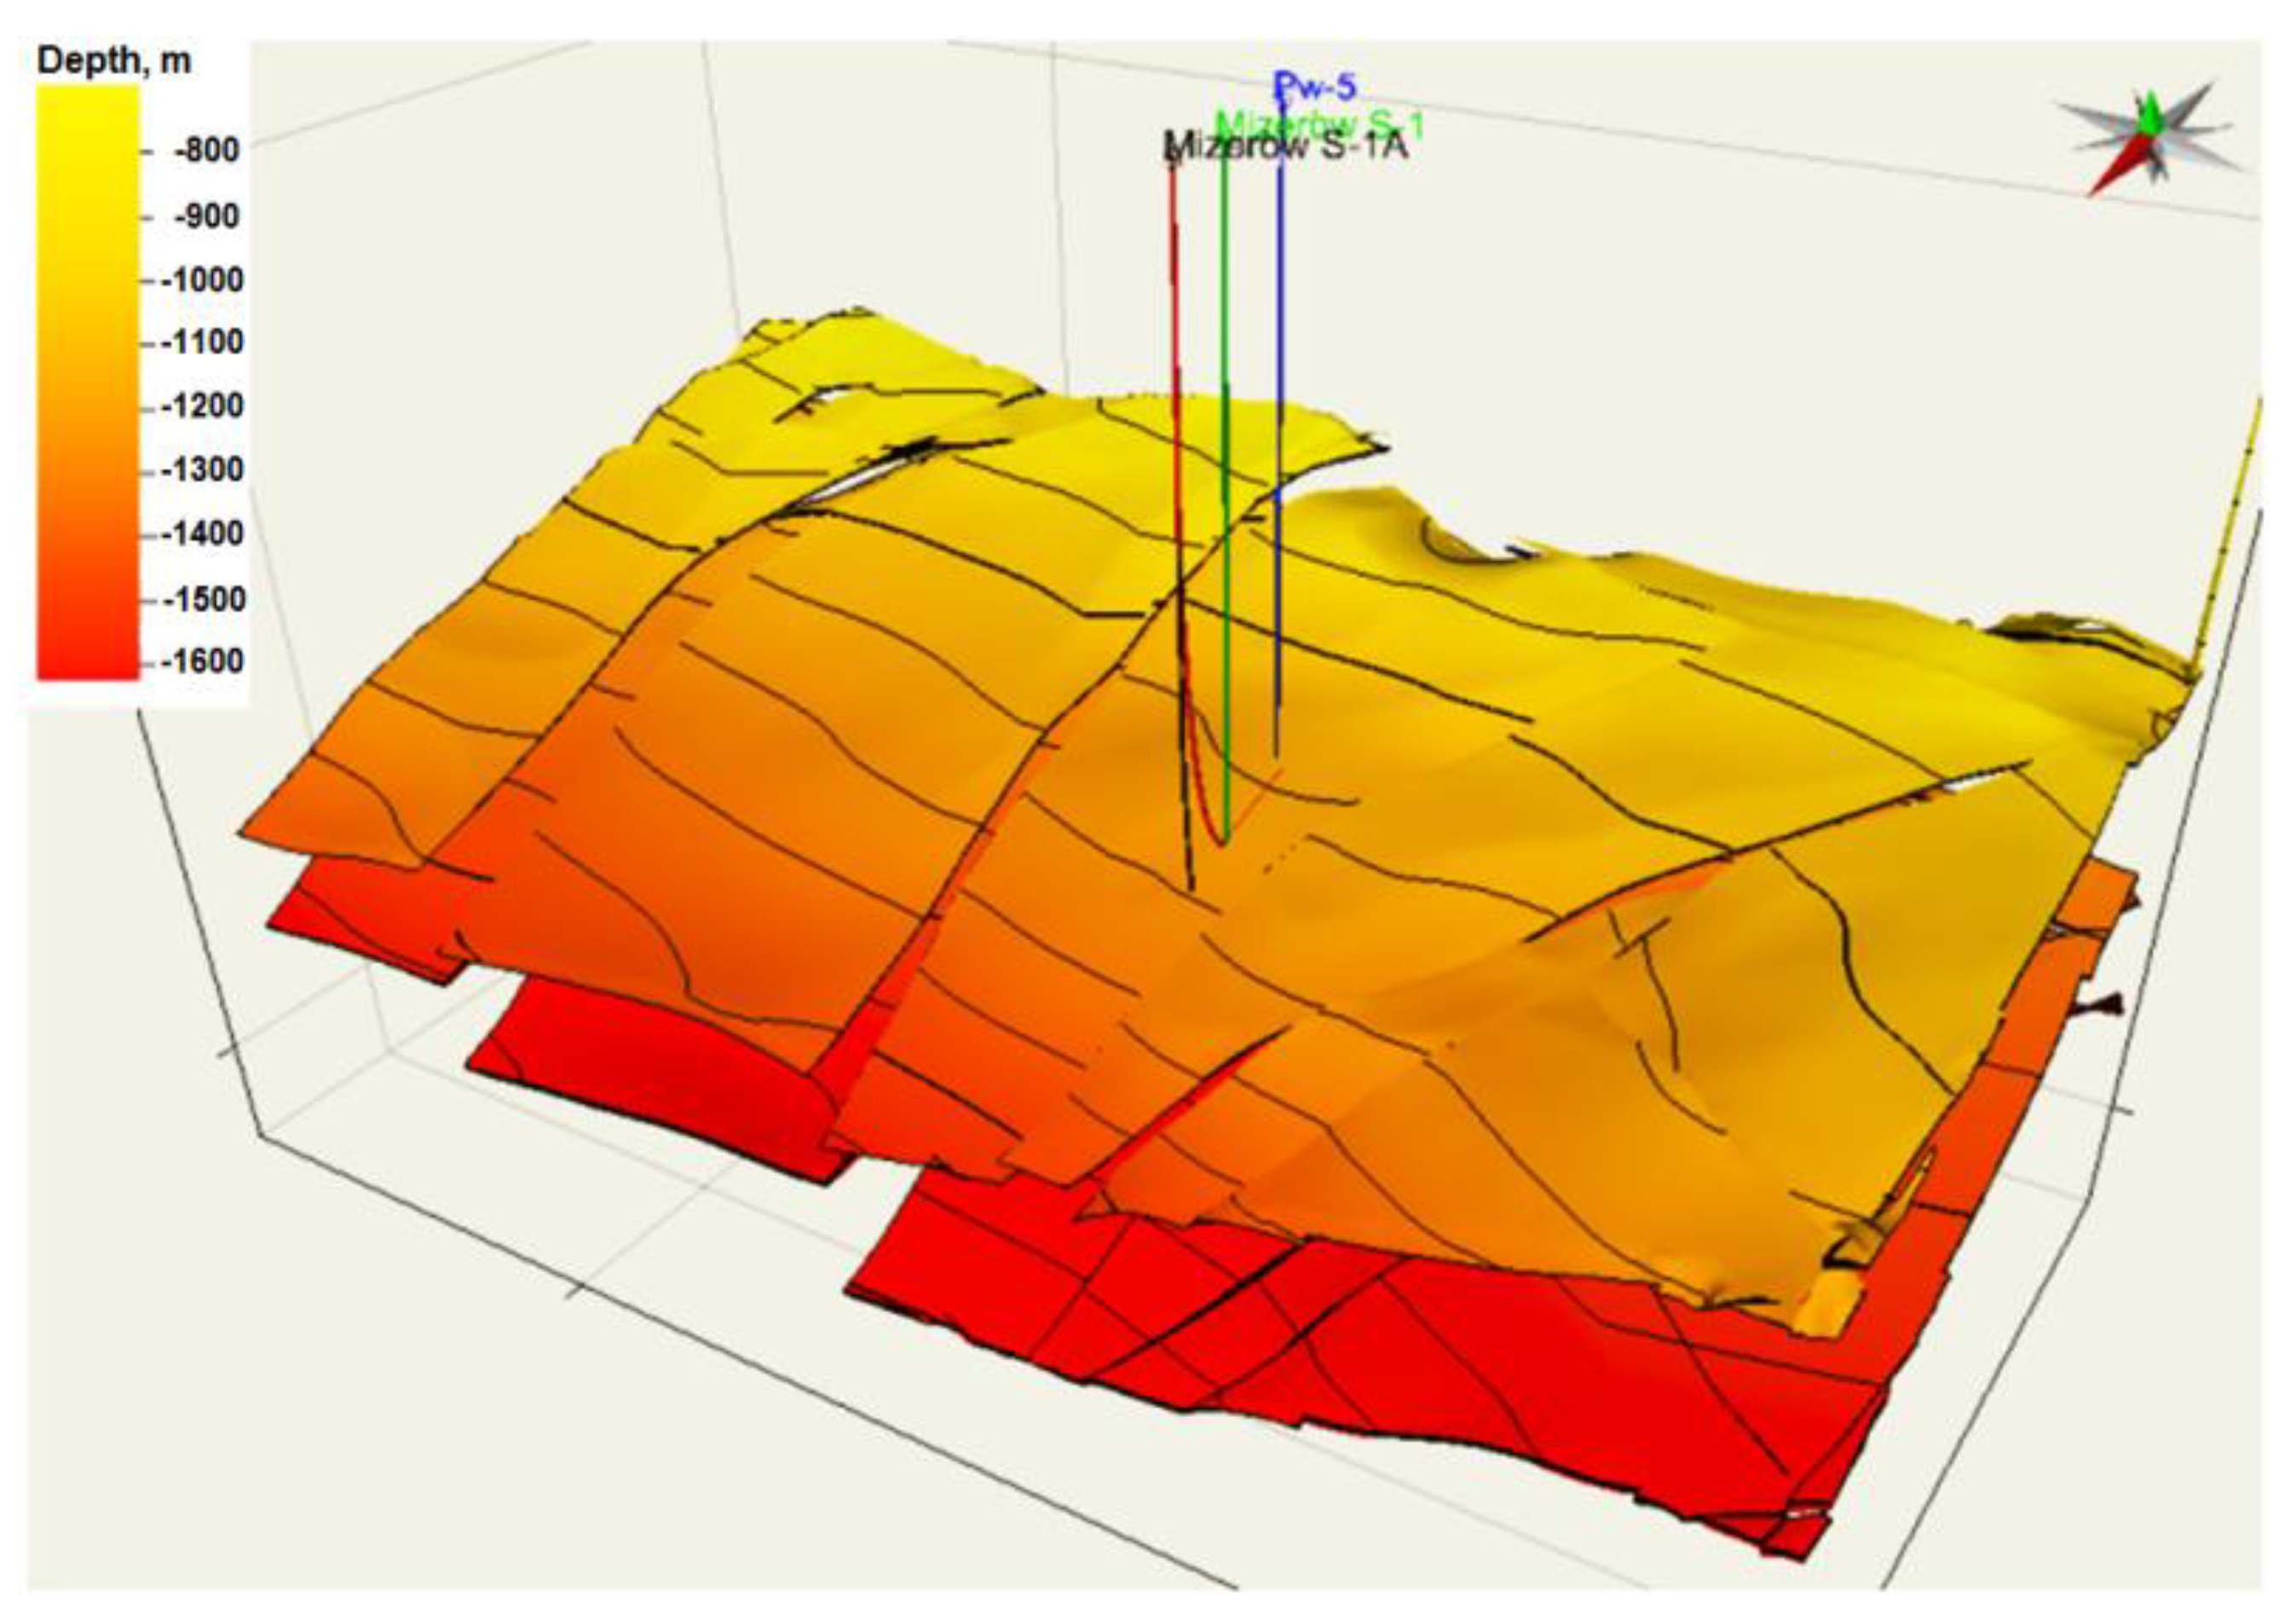
Coal seam 405, lying at the depth of 1130 m in the designated region of Pawłowice–Mizerów, USCB, Poland, belongs to the mudstone series of Załęskie layers, whereas seam 510 to the saddle layers of the Upper Silesian sandstone series. The coal seam spacing within the discussed region is directed towards East-West, while the seams orientation is towards the North (see Figure 2). The faults that occur in the zone divide the model into 17 blocks, the biggest of which has an area of about 19 km2.
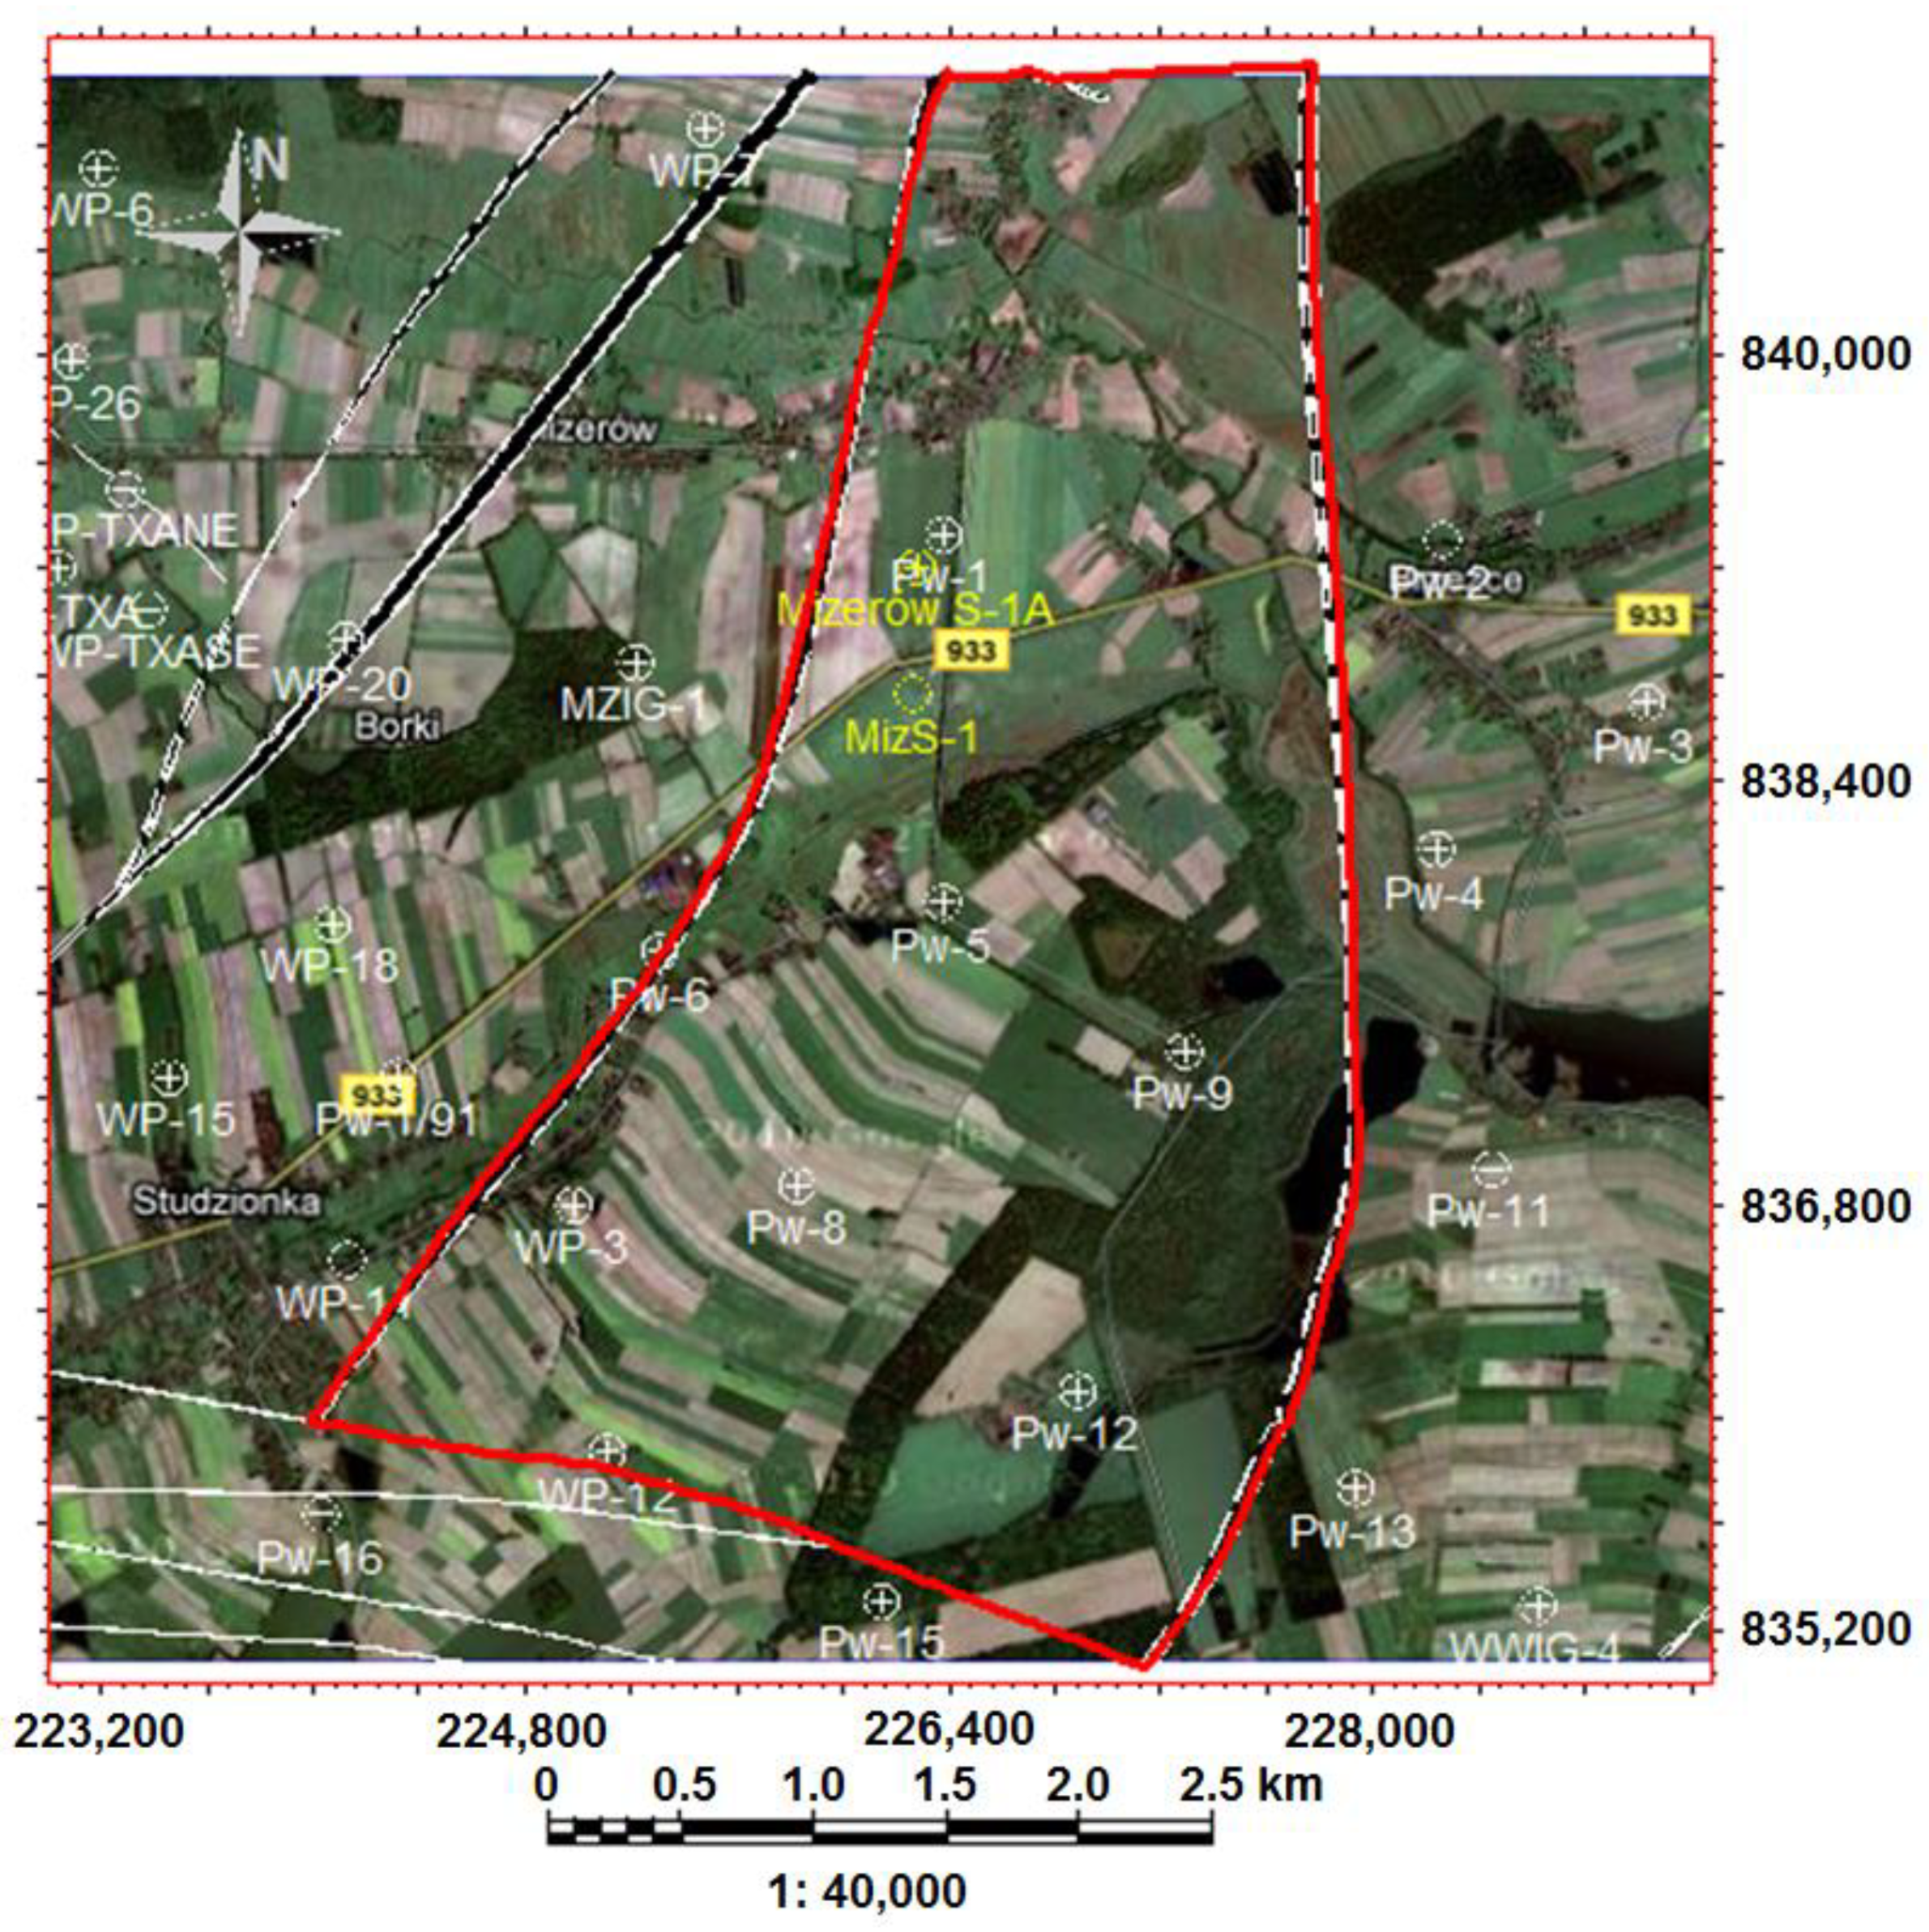
For subsequent modeling analyses, a region situated in a tectonic block of 13 km2 was selected. Figure 3 demonstrates the contour of the modeled area along with the distribution of the boreholes, which provided data for the development of the static model. The thickness of the area ranges from 209 to 521 m. A horizontal resolution of the interpolation of 50 m × 50 m was applied. The depth range in the model is from elevation 840 m ASL (depth of approximately 1100 m) to 2021 m ASL (depth of approximately 2275 m).
Data from well logs concerning lithologic types, methane content and the thickness of the drilled rock below the depth of 1000 m were used to develop the model. Before particular lithologic types were entered into the model, they were ascribed appropriate numerical codes. The results of the well interpretations obtained in such a way were subject to the scale up well logs process in a discrete form. For the lithologic data, a statistical algorithm was applied. The algorithm ascribes to the given interval the most frequently represented lithology type within the averaging interval.

3. Results and Discussion

During the course of developing the lithology model for Pawłowice–Mizerów region, a sequential indicator algorithm (sequential indicator simulation), belonging to the group of stochastic algorithms, was used. The application of this particular methodology was determined by the quantity of data. A static model was developed including the lithology, the thickness and the methane content of the seams in the selected tectonic block with 15.88% share of bituminous coal. Table 1 and Figure 4 present the modeling results of the lithology in the discussed region.
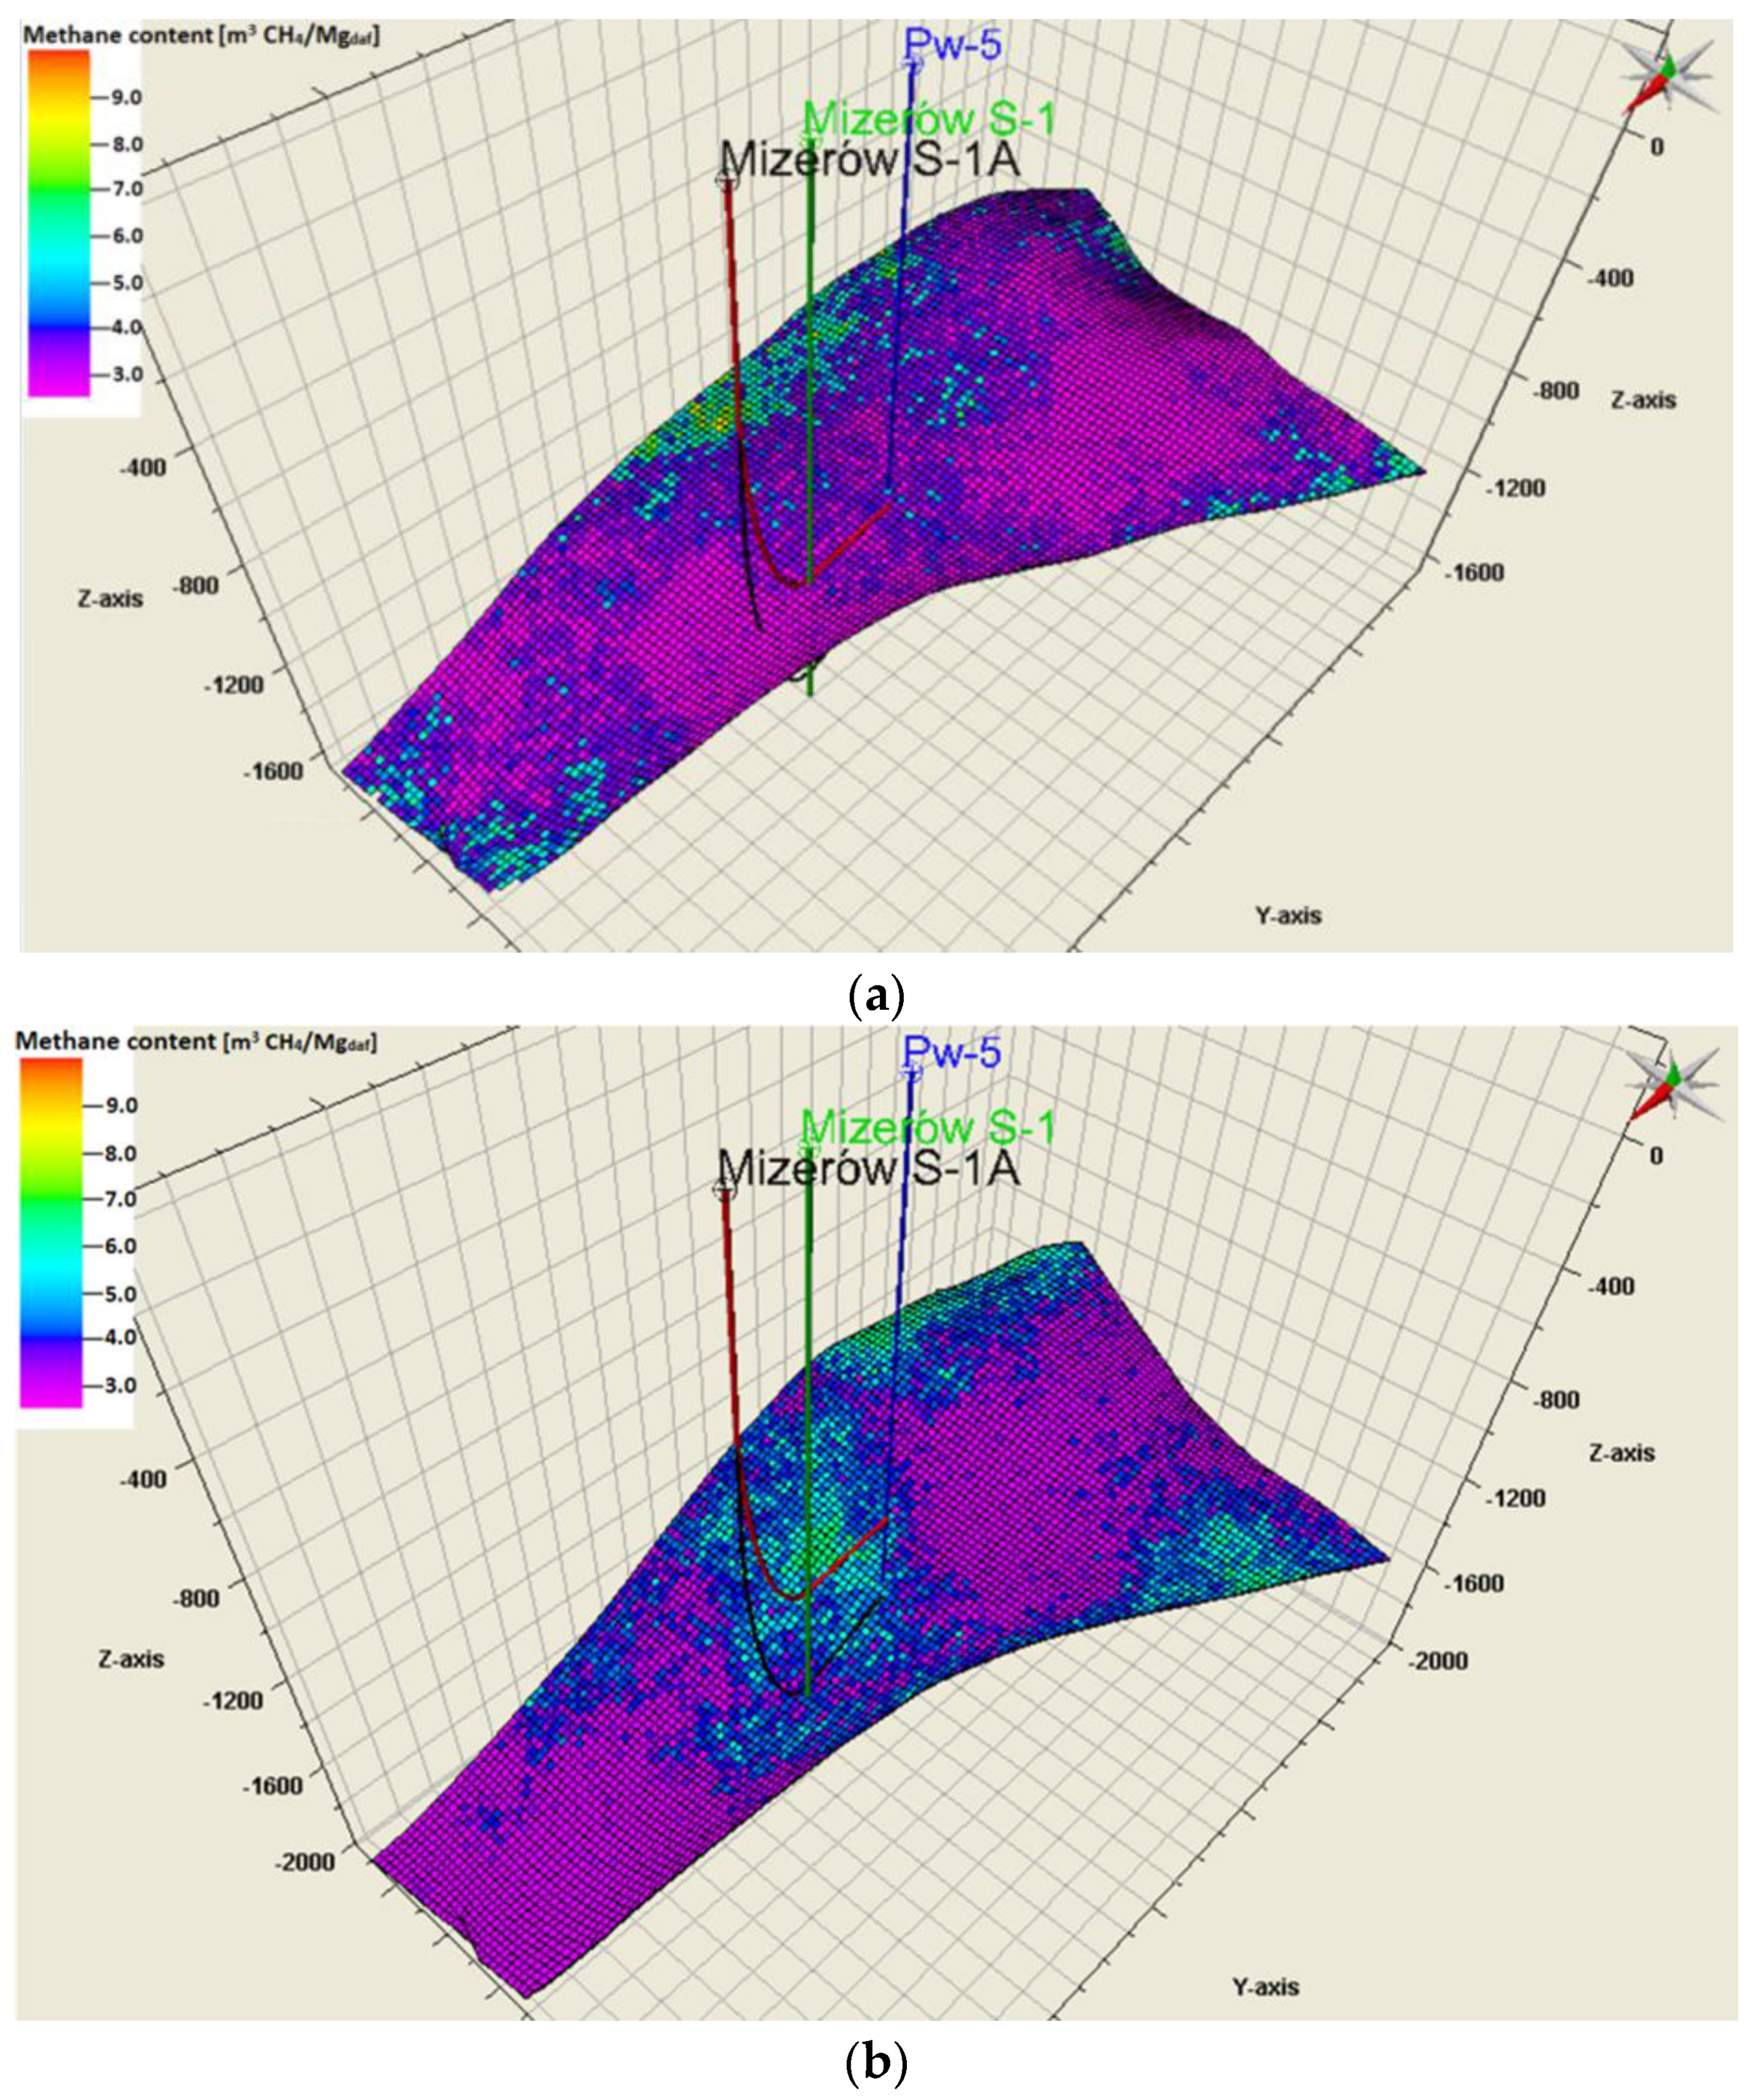
The methane occurring within the Upper Carboniferous rock mass is genetically bound to coal. In hard coal deposits, methane may occur in the form of sorbed methane (physico-chemically bound to coal substance), as free methane, which fills the coal seam pores and fractures or in gangue where it fills the fault fissures. The occurrence of free methane in coal gangues depends on their volume and porosity, on the degree of pore saturation with gas as well as on the reservoir pressure. The amount of methane sorbed on coal depends mainly on coal sorption capacity, temperature and reservoir pressure. The increase in the degree of carbonation and the pressure as well as the decrease in coal moisture and temperature constitute favorable conditions for the accumulation of methane in the seams. In hard coal deposits, methane occurs predominantly in the form of adsorbed methane. In the developed model, the methane content in the designated coal seams ranges from 2.54 to 10.14 m3 CH4/Mgdaf. Table 2 presents data concerning the methane content of seams 405 and 510, i.e., the volumetric amount of the methane of natural origin contained in a weight unit in the body of coal. Figure 5 demonstrates the modeling results of methane content and its distribution in the seams.
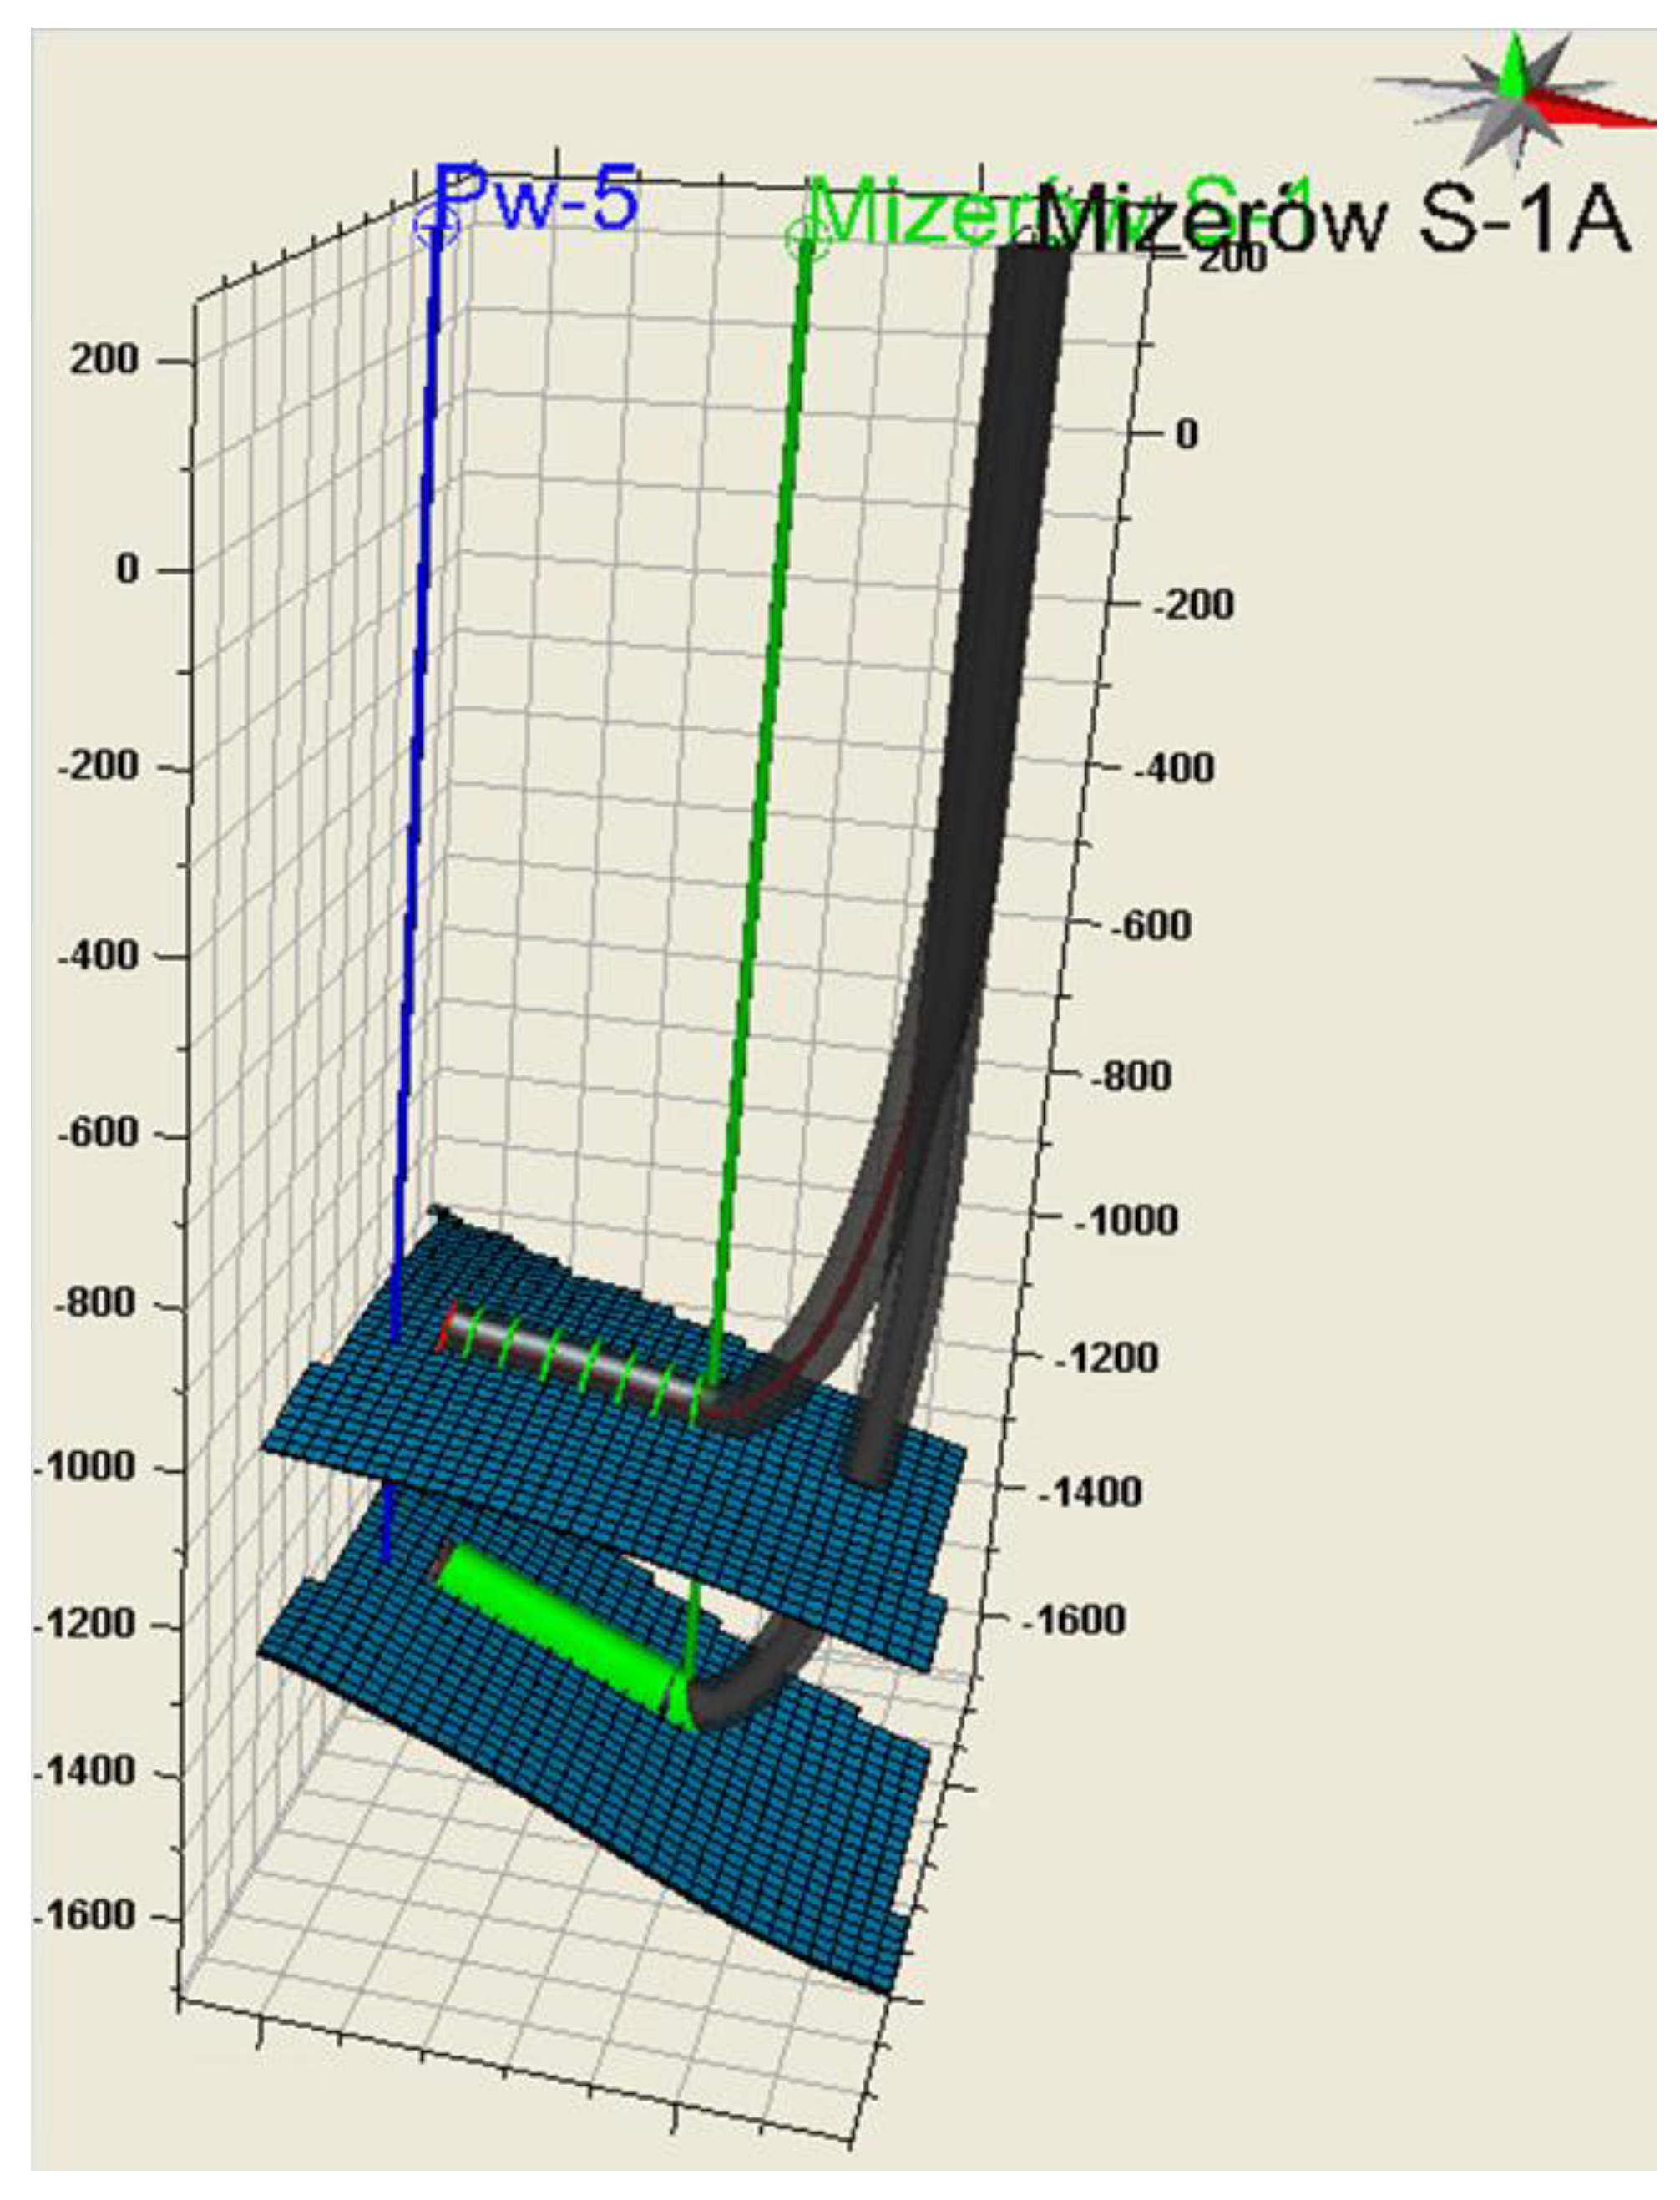
In the developed numerical model, a series of simulations associated with the injection of CO2 into coal seams 405 and 510 using the horizontal injection well Mizerów S-1A was conducted, whereas bore hole Pw-5 performed the function of a production well (see Figure 6).
Table 3 presents the adopted structural model parameters for seams 405 and 510 in the selected block where the simulations were conducted.
The model was constructed on the basis of a regular grid of 50 × 50 blocks. The area of the modeled region totals 1.83679 km2. For the purpose of simulating the injection of CO2 into coal seams 405 and 510, a compositional version of the ECLIPSE (ECLIPSE Reservoir Simulation Software, ver. 2011.3, Schlumberger, New York, NY, USA) simulator with the option of coal bed methane including the phenomena that accompany the process of injecting CO2 into coal seams was used. The above phenomena comprise the major mechanisms responsible for the flow of water and gas within the coal seam, namely the desorption of gas from the coal matrix into the cleat system, diffusion according to Fick law, Darcy’s flow in the fractures, the shrinking and swelling of coal matrix as well as the chemical exchange between CO2 and CH4 molecules.
Coal bed methane is retained in coals in three ways: first, as a free gas within the pore space or fractures in coal; second, as adsorbed molecules on the organic surface of the coal and third, dissolved in groundwater within the coal. Porosity in coals occurs as fracture porosity and matrix porosity. The latter is more significant when considering the CBM retention potential of coals.
The gas generated in excess of that which can be adsorbed on the coal surfaces will be free gas within the porosity of the coal, most notably in the fracture porosity. The fracture porosity in coal is primarily produced due to the formation of fractures called cleat being a joint or a set of joints perpendicular to the top and bottom of the coal seam. Usually, there are two cleat sets developed in an orthogonal pattern. Cleat is a major control on the directional permeability of coals [29].
Simulator ECLIPSE allows for the double porosity in the model. The model consists of two interconnected systems representing the coal matrix and the cleat system. Methane is stored by means of sorption in a poorly permeable coal matrix characterized by varied porosity in comparison to the cleat system where the phenomenon of desorbed gas flow takes place. Accordingly, in double porosity models, the number of layers is doubled, whereas the calculations during the simulation are conducted for a double number of cells.
The model of gas adsorption on coal for the different components is described in ECLIPSE 300 by means of the extended Langmuir isotherm [30]. The adsorption capacity is a function of the pressure and free gas phase composition. For each of the gases (CO2 and CH4), it is required to introduce Langmuir isotherm parameters, i.e., the Langmuir volume constant Vi and the Langmuir pressure constant Pi. These parameters are typically determined on the basis of experiments. Different isotherms can be used in different regions of the field. The multicomponent adsorption capacity is calculated by:
L ( p ,   y 1 ,   y 2 , ) i = θ P s R T s ( V i   y i p P i 1 + j = 1 n c y j   p P j ) ,
where
  • θ = Scaling factor;
  • Ps = Pressure at standard conditions;
  • R = Universal gas constant;
  • Ts = Temperature at standard conditions;
  • Vi = Langmuir volume constant for component i;
  • Pi = Langmuir pressure constant for component i;
  • yi = Hydro carbon mole fraction in gas phase for component i;
  • p = Pressure.
For the special case of a single component, the extended Langmuir isotherm is identical to the usual Langmuir isotherm giving the storage capacity as a function of pressure only:
L ( p ) = θ P s R T s ( V p P 1 + p P ) ,
where V is the maximum storage capacity for the gas, referred to as the Langmuir volume constant, and P is the Langmuir pressure constant. The constants used in the extended Langmuir formulation can hence be estimated from a series of single-component gas experiments.
Time dependent diffusion in ECLIPSE 300, i.e., the diffusive flow between the matrix and the fracture is given by:
Fi = DIFFMF Dc, i Sg RFi (miρc Li),
where
  • mi = Molar density in the matrix coal;
  • DIFFMF = Matrix fracture (or multi porosity) diffusivity;
  • ρc = Rock density (coal density);
  • Dc,i = Diffusion coefficient (coal) component i;
  • RFi = Readsorption factor component i;
  • Sg = Gas saturation, for desorption a value of unity is used;
  • ρcLi = Equilibrium molar density of adsorbed gas.
The matrix-fracture diffusivity is given by:
DIFFMF = DIFFMMF·VOL·σ,
where DIFFMMF is the multiplying factor input, VOL is the coal volume and σ is the factor to account for the matrix–fracture interface area per unit volume.
Often the component’s sorption time is a quantity that is easier to obtain than the diffusion coefficients. For desorption we write the flow as:
Fi = (VOL/τi)·(miρc Li),
where τi = 1/(Dc,i · DIFFMMF ·σ) is called the sorption time.
The parameter controls the time lag before the released gas enters the coal fracture system. The sorption times are given by the diffusion coefficients, DIFFCBM, and the matrix-fracture interface area, SIGMA, together with the multiplying factor DIFFMMF. If the sorption times are known, a value of unity can be assigned to σ and DIFFMMF. The diffusion coefficients can then be assigned to the reciprocal of the sorption times [31].
Simulator ECLIPSE 300 requires predetermining the initial gas concentration in the coal by means of inputting the gas volume to the mass of the base rock (sm3/kg). The ECLIPSE software defines the sm3/kg unit as a cubic meter of gas (pressure of 1 atm = 1013.25 hPa and temperature of 15.56 °C) per one kilogram of coal under in situ conditions.
In the developed model, laboratory data obtained during the execution of RECOPOL project were used [32]. Detailed parameters used in the simulation are compiled in Table 4.
The increase in temperature and the pressure of injected CO2 favors the transport of carbon dioxide, thereby enhancing methane recovery; the presence of water in the coal deposit may decrease coal permeability, and, as a consequence delay CO2 adsorption inhibiting the migration of carbon dioxide [33,34,35,36].
In the course of the simulations, curves reflecting the relationship between relative coal permeability and water saturation obtained during a pilot CBM project in the Upper Silesian Coal Basin executed by TEXACO were applied [37]. The relationships were used during the stage of dynamic modeling for the purposes of RECOPOL project [38].
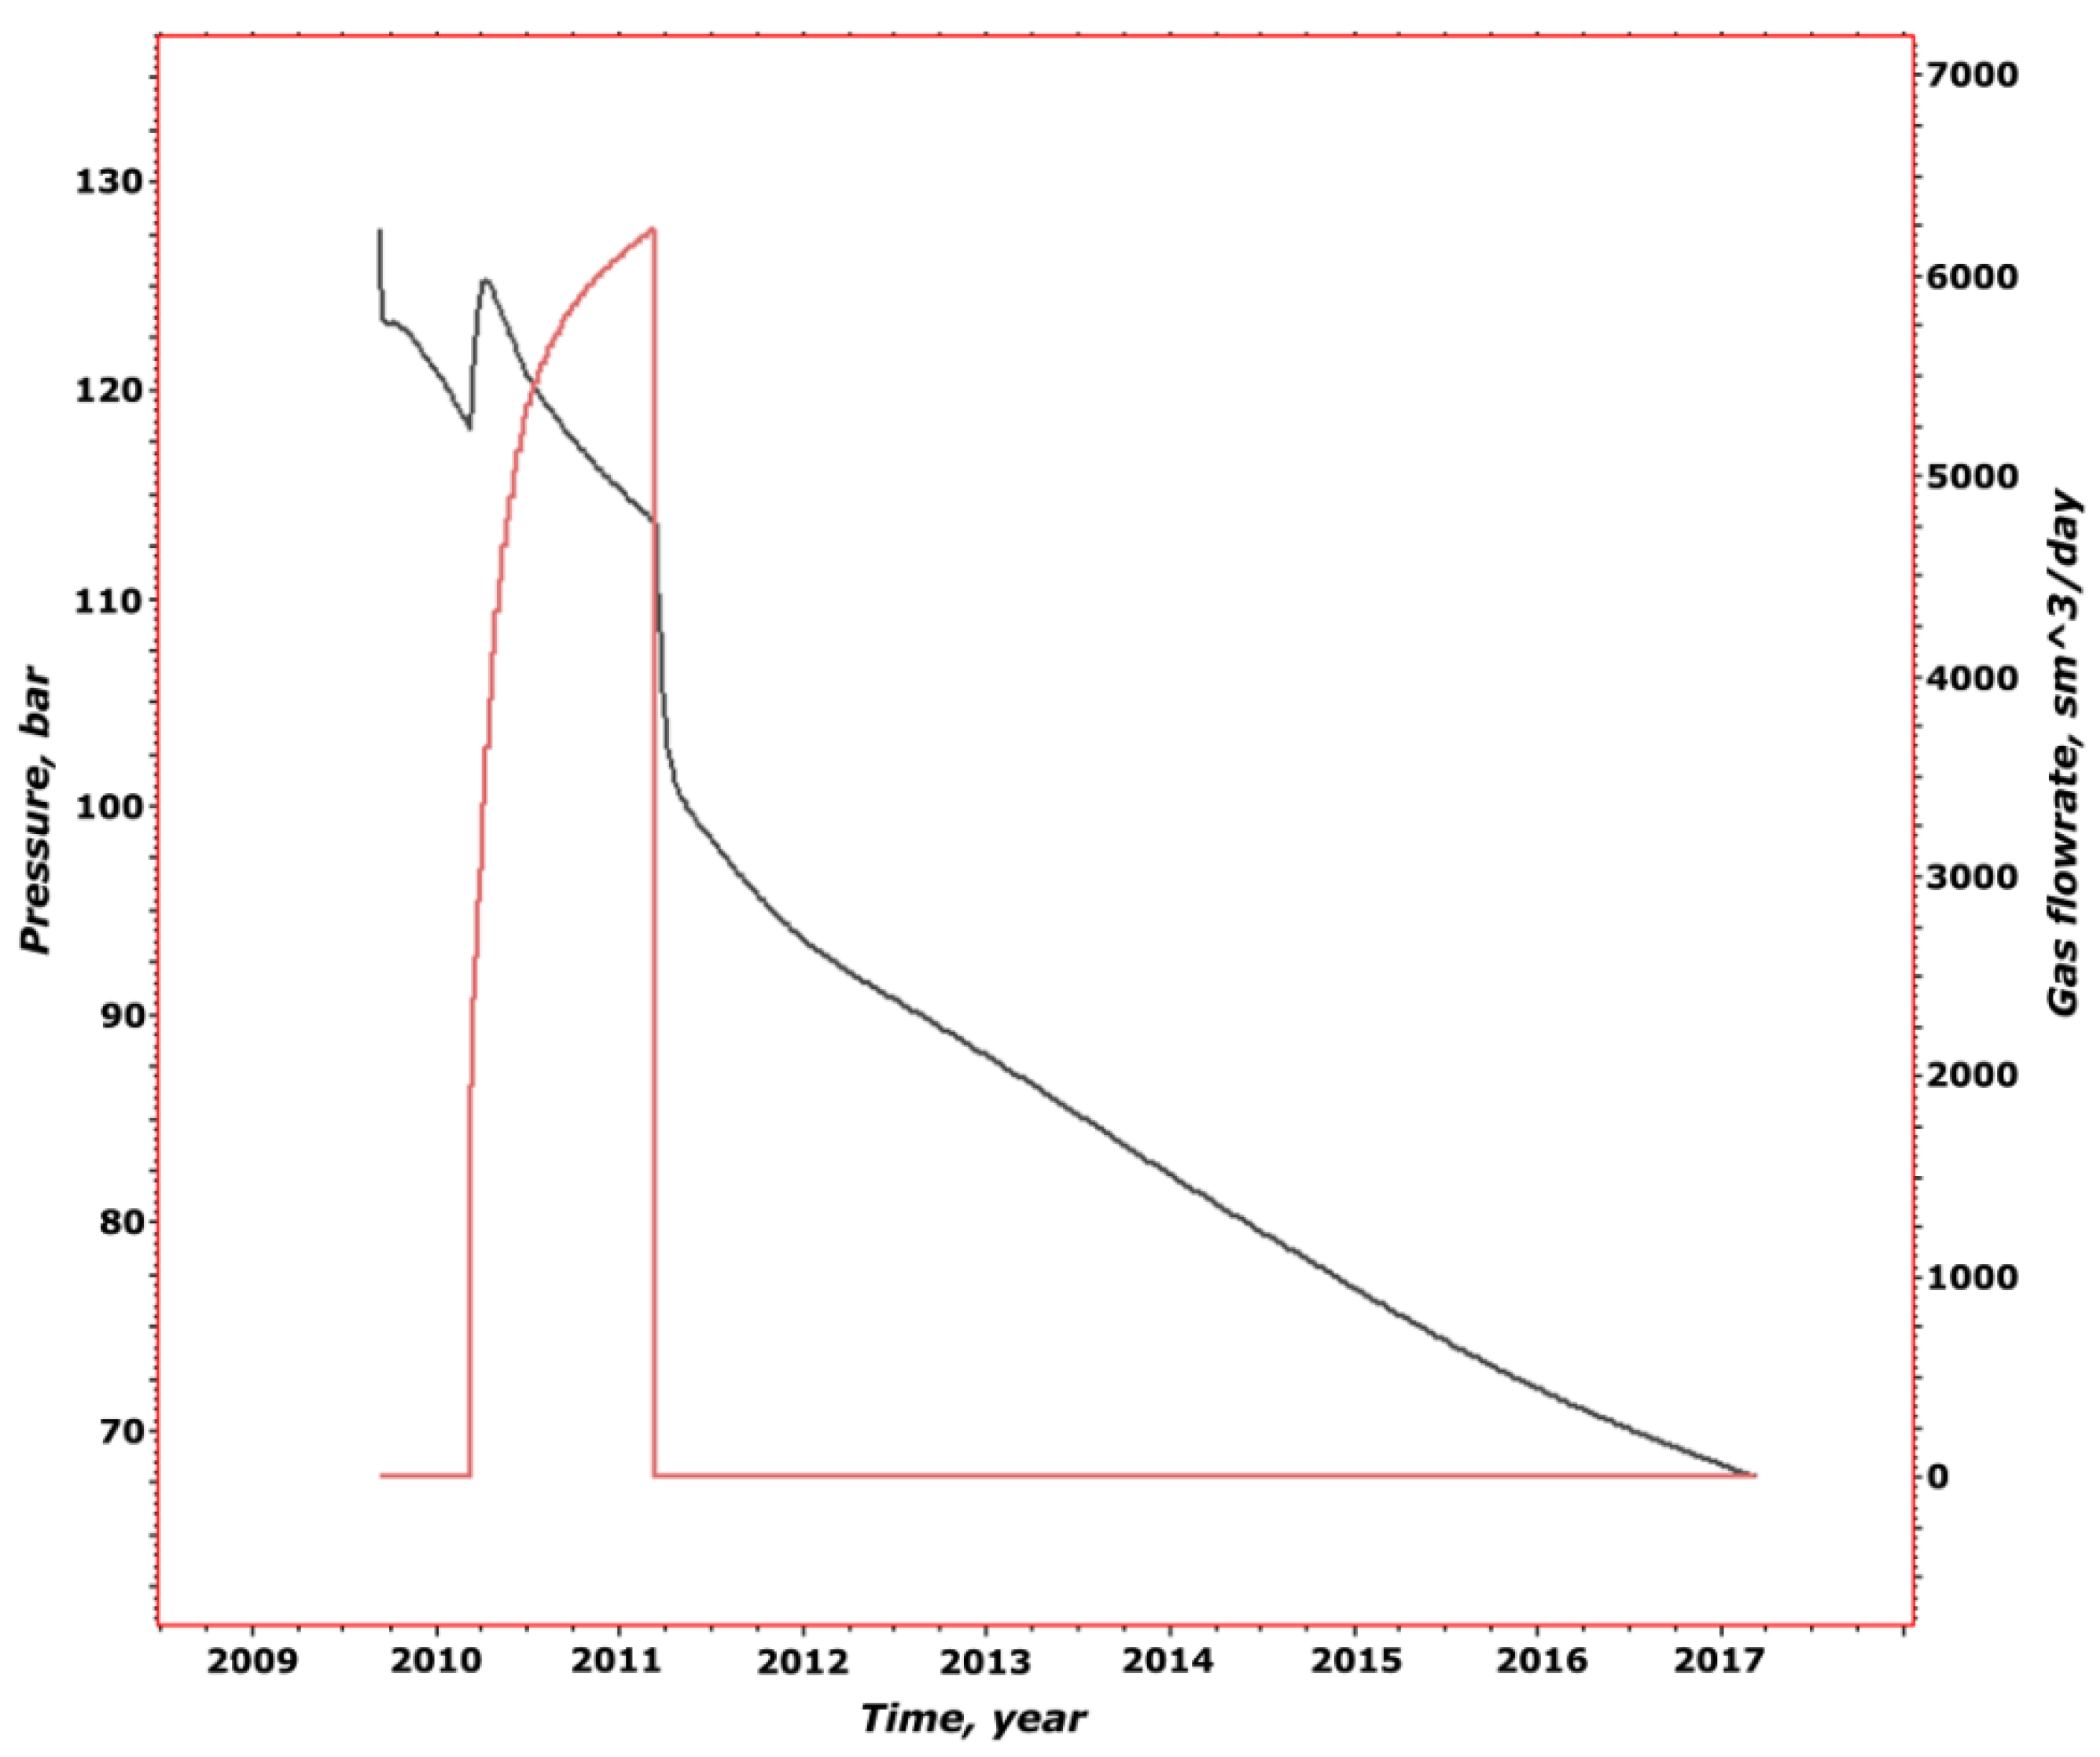
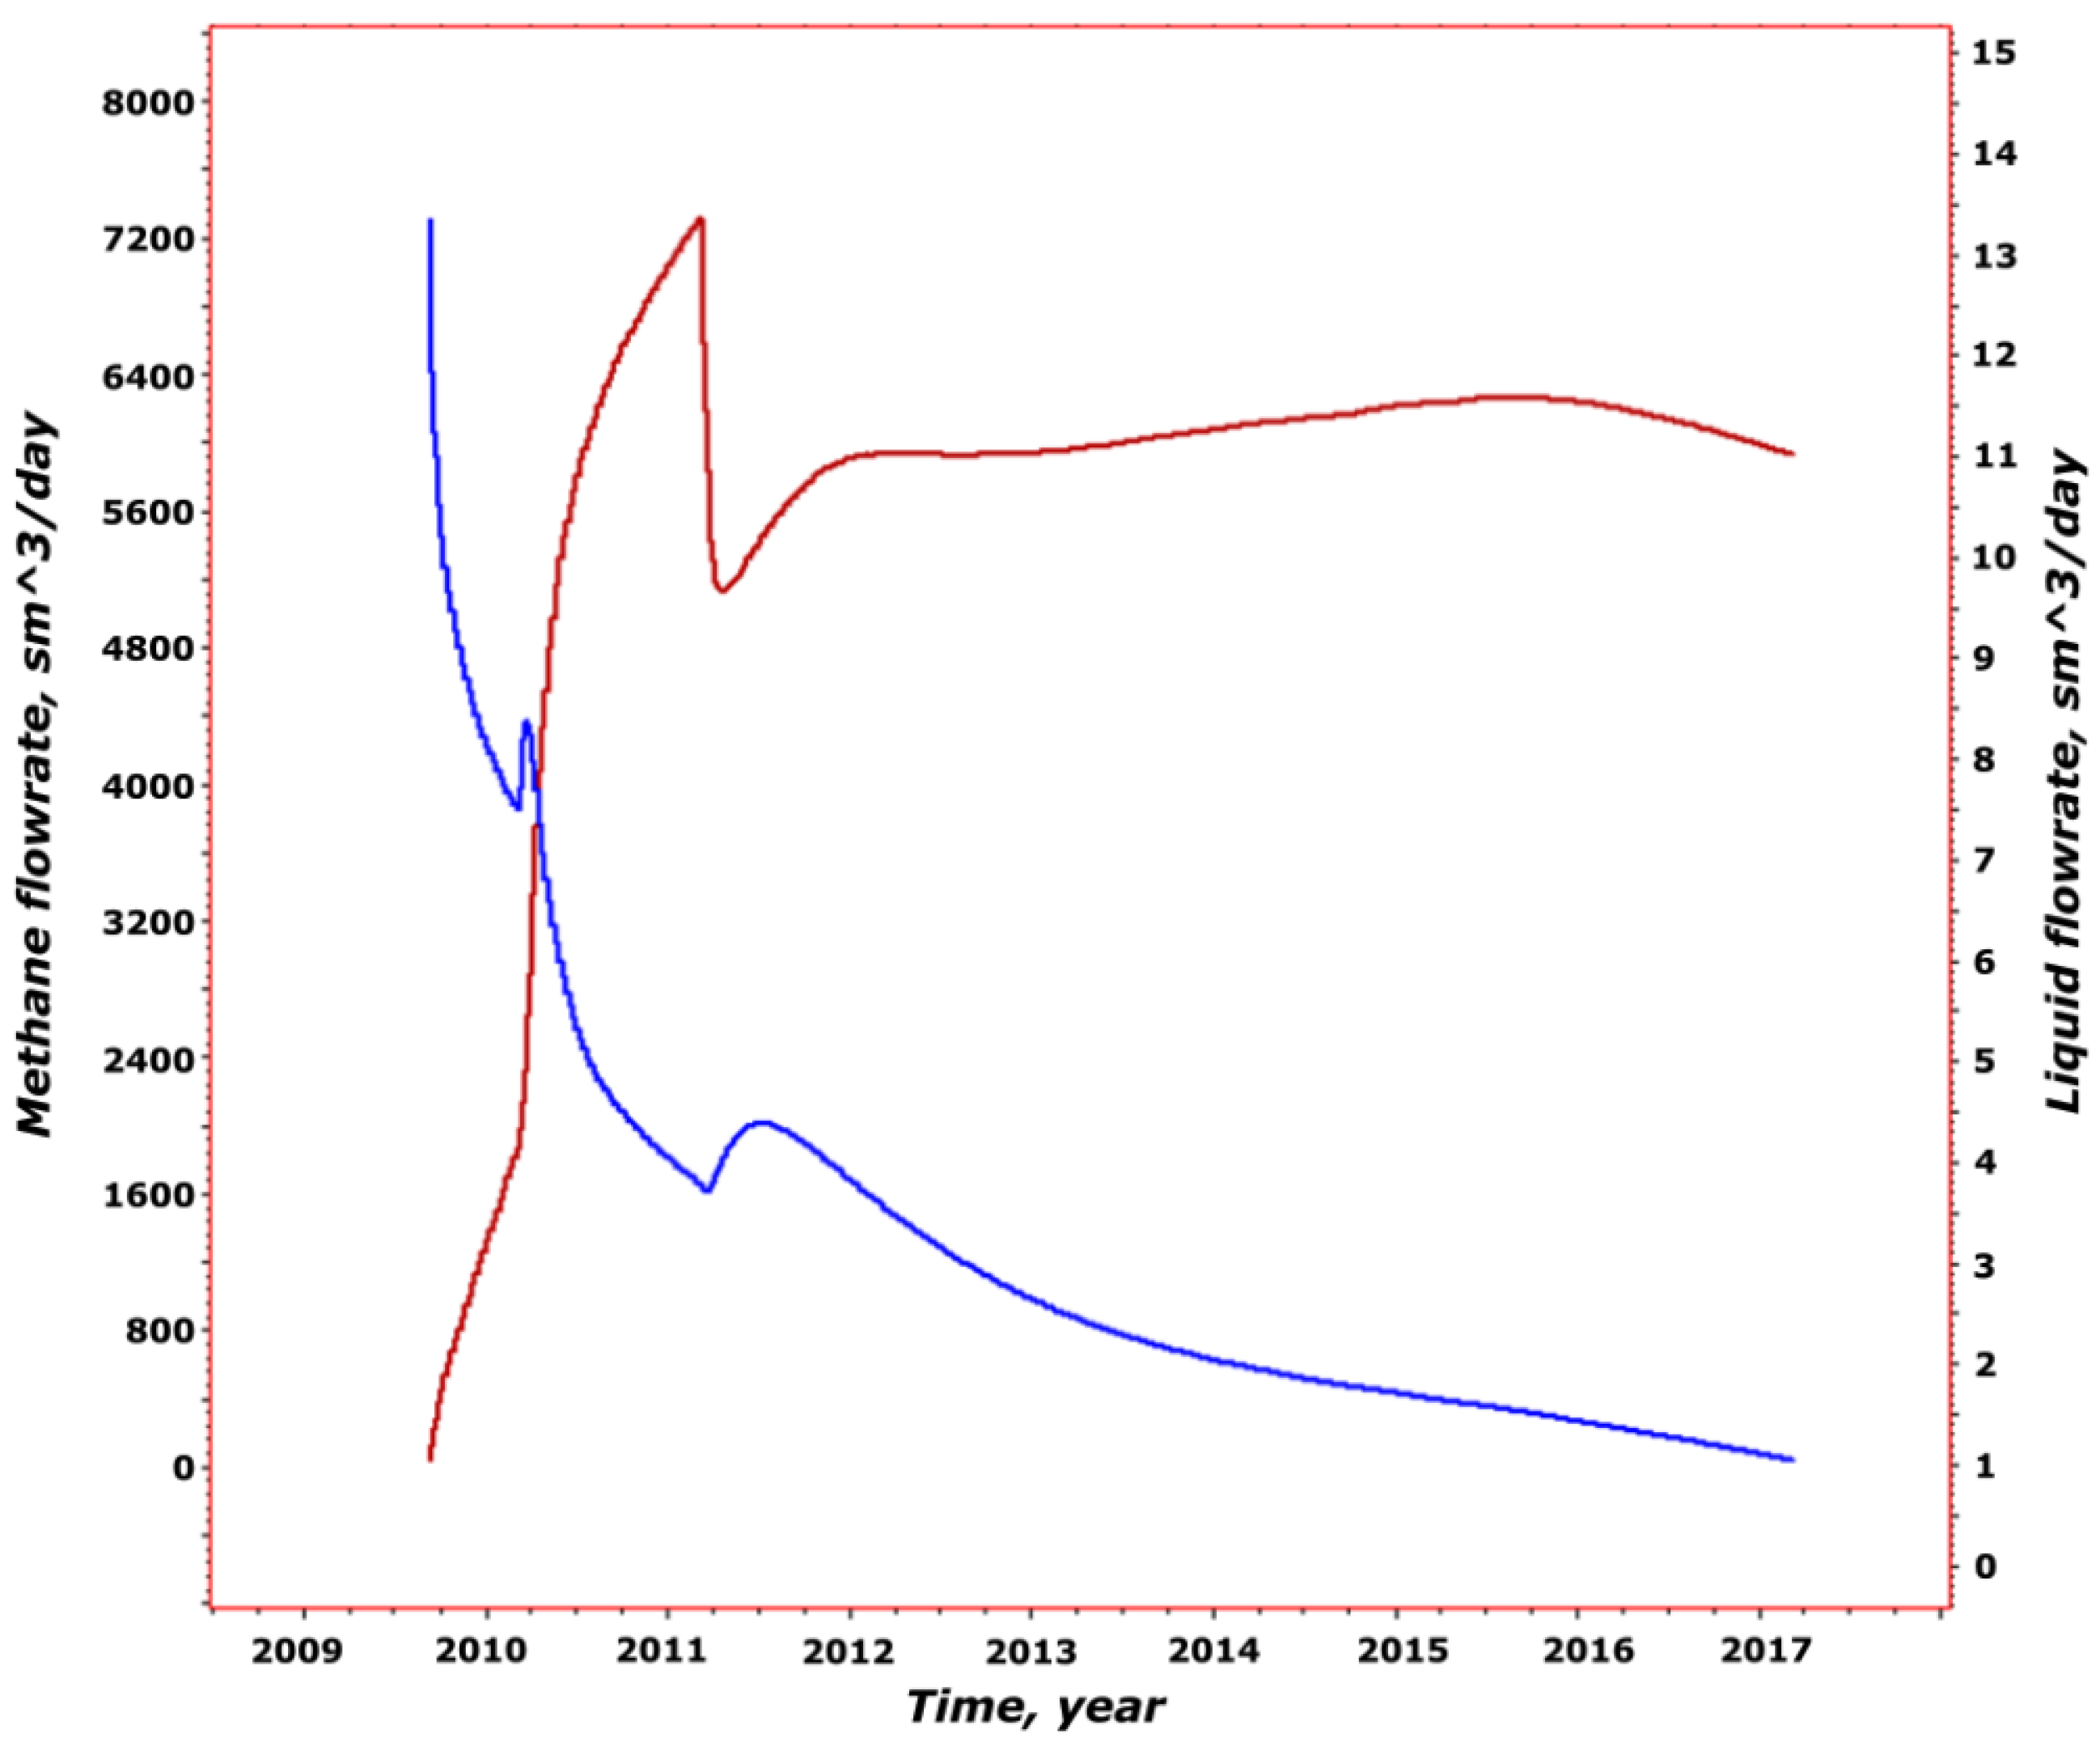
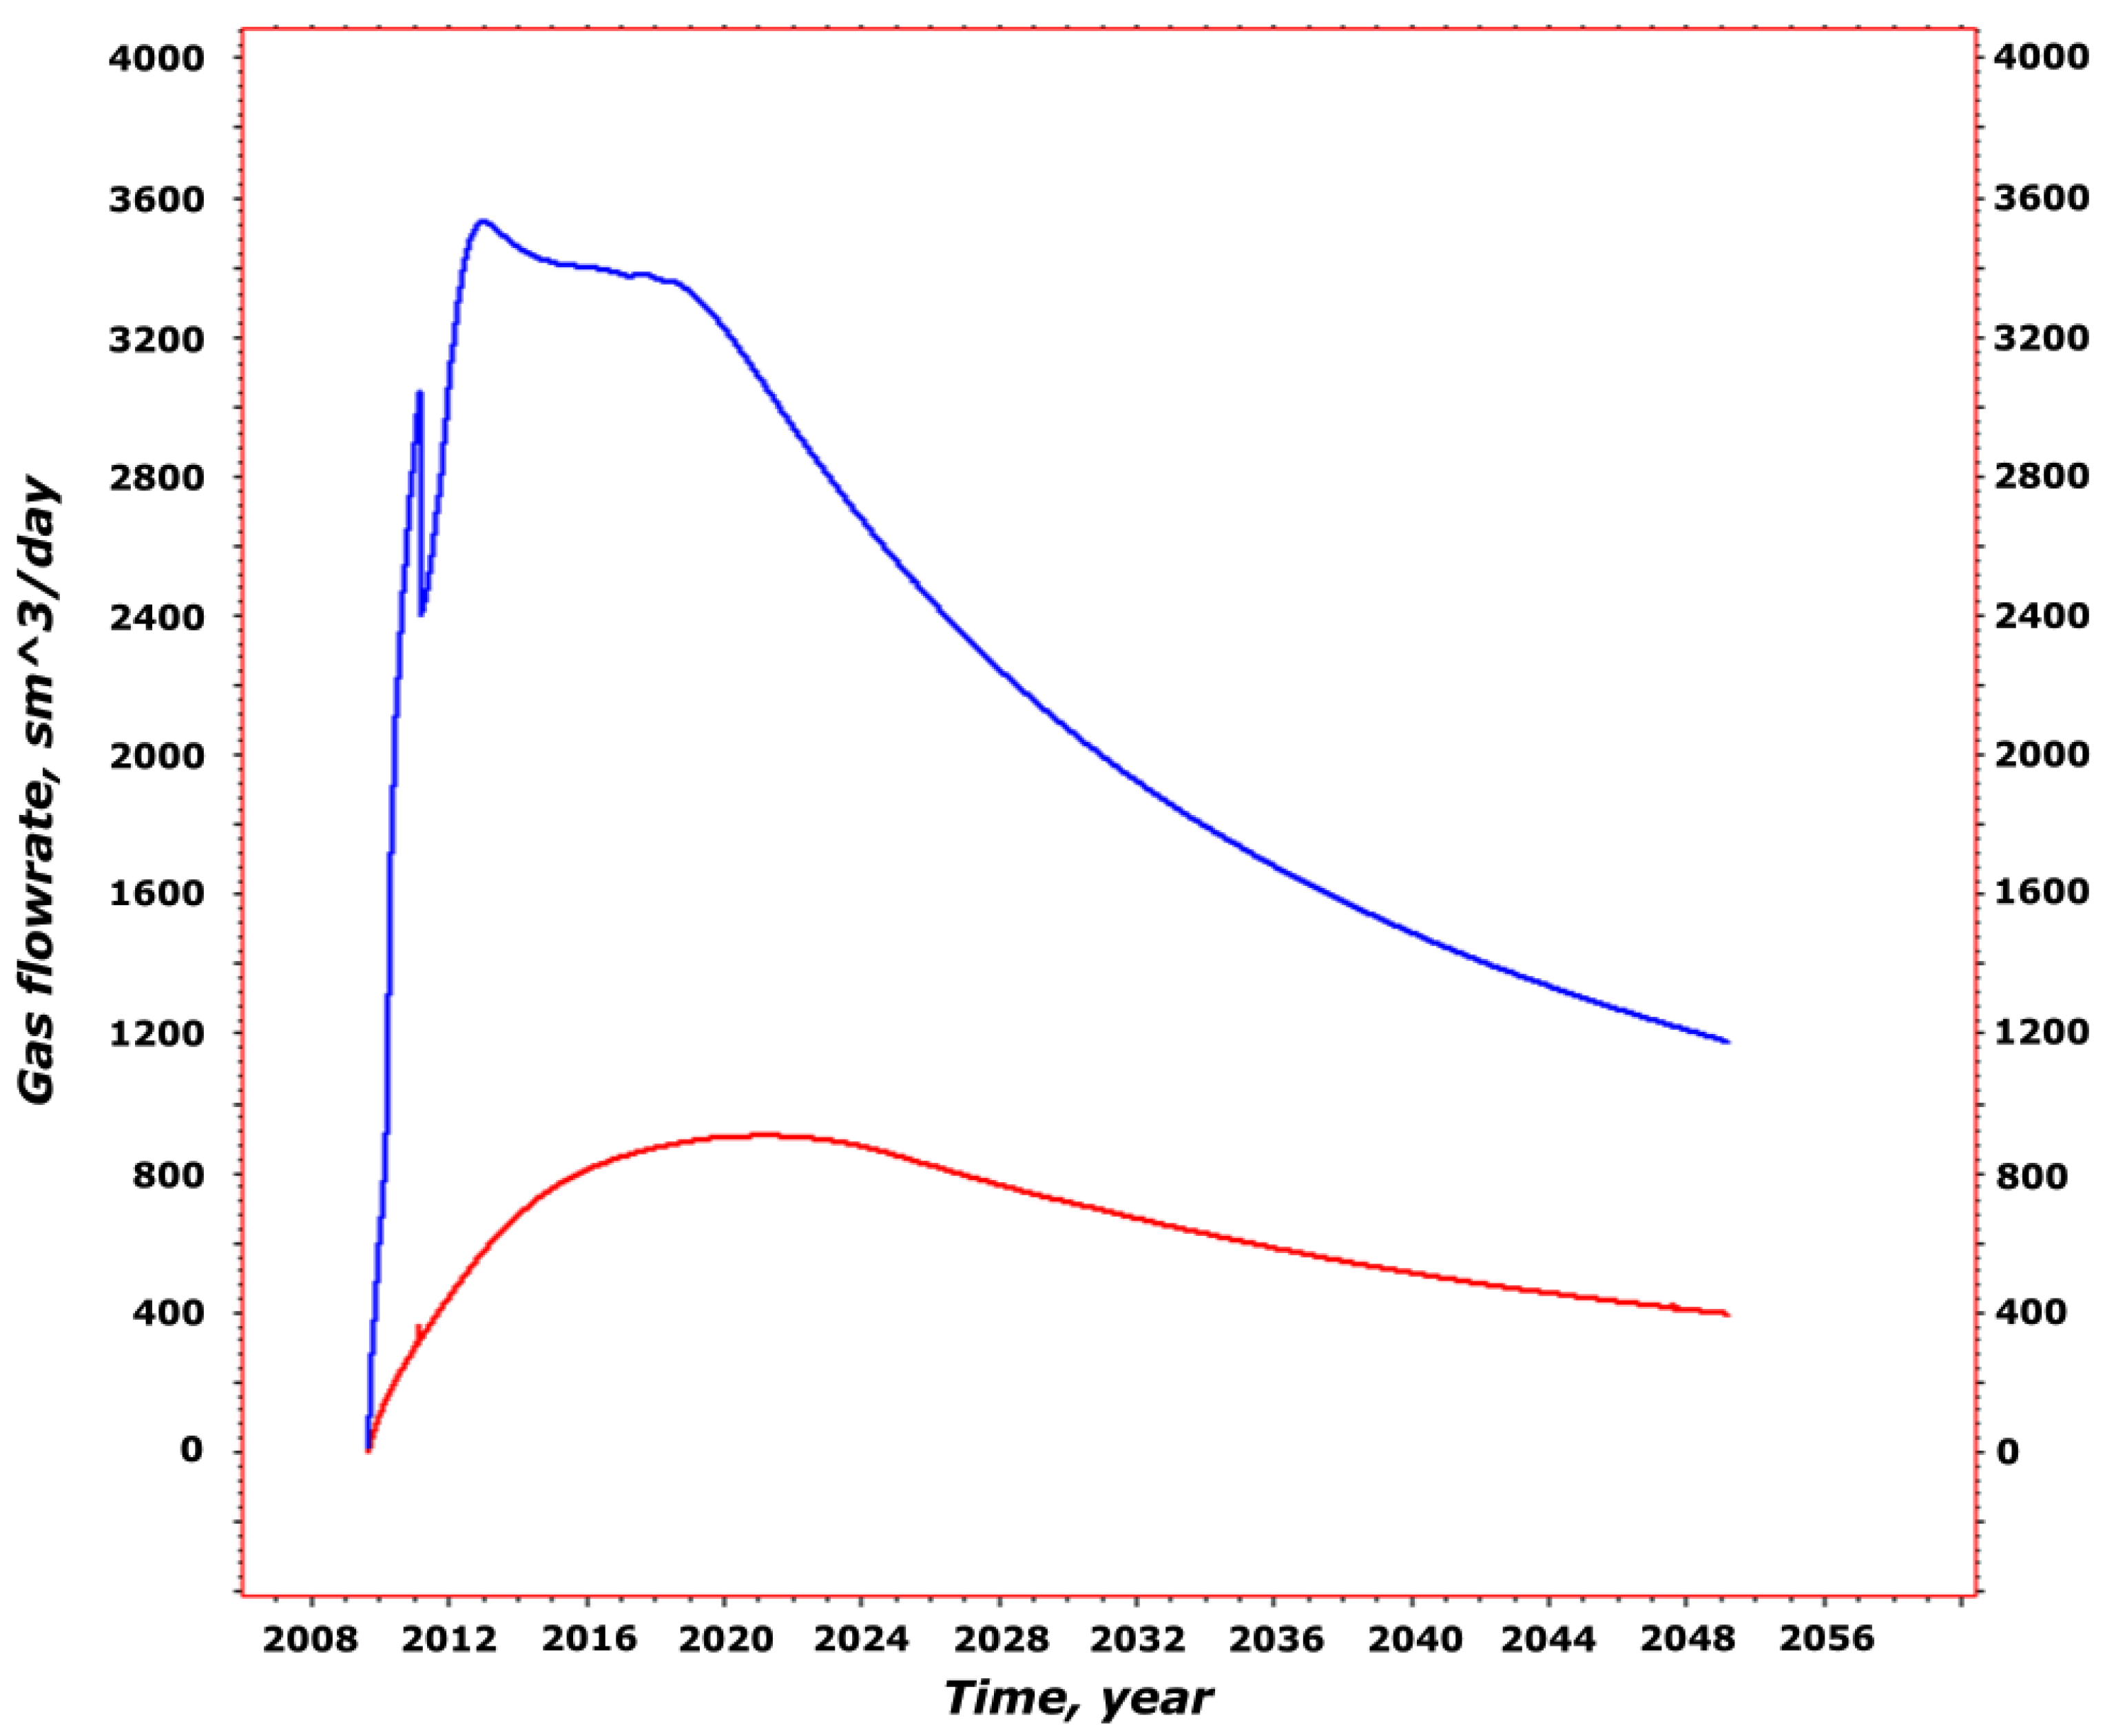
A number of simulations of the process of enhanced coalbed methane recovery with the simultaneous injection of carbon dioxide into the coal seam were conducted. Changes of average pressure in the injection zone, flowrates of CO2 injection and the daily production rates of water and methane were recorded during the simulation (Figure 7 and Figure 8).
Figure 7 shows the changes of average pressure in the CO2 injection zone and the daily flowrate of the CO2 injection. In the simulation, three intervals of time were separated. During the first six months of the simulation, water is produced from the coal seam, which causes the decrease of pressure in the reservoir. The fall of the pressure initiates methane desorption from the coal matrix (Figure 8). After six months from the start of the simulation, the injection of CO2 into the coal seam begins and lasts uninterruptedly for one year. In the first month of injection, a sudden increase in pressure can be observed, but in the following months a marked drop in pressure is noticeable. Figure 7 shows a significant decline in reservoir pressure after the end of CO2 injection. Moreover, the decrease of methane production and the increase of water production can be observed in the first month after the end of the CO2 injection (Figure 8). The simulation of the process of gas migration after the injection has been finished is continued for 5 years. At that time, a constant drop of reservoir pressure can be observed to the end of simulation (Figure 7). Moreover, Figure 8 presents the stabilization of methane production and a decrease in its efficiency in the final phase of the simulation.
The results of the simulations demonstrate that the aggregate amount of carbon dioxide injected into coal seam 405 during the period of one year totaled 1,954,213 sm3. The aggregate amount of water obtained from the production wells during the whole period of the simulations (6.5 years) totaled 9867 sm3. At the same time, 15,558,906 sm3 of gas was extracted, out of which 14,445,424 sm3 constituted methane. The remaining 7% of the recovered gas was carbon dioxide obtained as a result of reverse production of previously injected CO2.
A similar phenomenon related to reversed CO2 production of approximately 9% of the injected gas was observed during a field experiment of CO2 storage in underground coal seams with simultaneous (enhanced) production of coalbed methane in the RECOPOL project performed in the years 2003–2005 in the Upper Silesian Coal Basin, Poland. During the CO2 injection into the coal seam, a slow rise of the CO2 content in the production well was observed, which could be attributed to the injected CO2. In addition, a decrease in total gas production was observed during longer fall-off periods in the injection well. This indicated a clear response of the production well to the injection activities. After the stimulation of the injection well, the gas production increased rapidly and CO2 concentration in the production gas also rapidly increased. It clearly indicated the breakthrough of the gas. The amount of the injected CO2 that was produced back by the production well, mainly after the frac job, was estimated to amount up to 68 tones. The amount of the produced CO2 was much lower (about 9%) than the amount of circa 692 tons of injected CO2 into the reservoir [39].
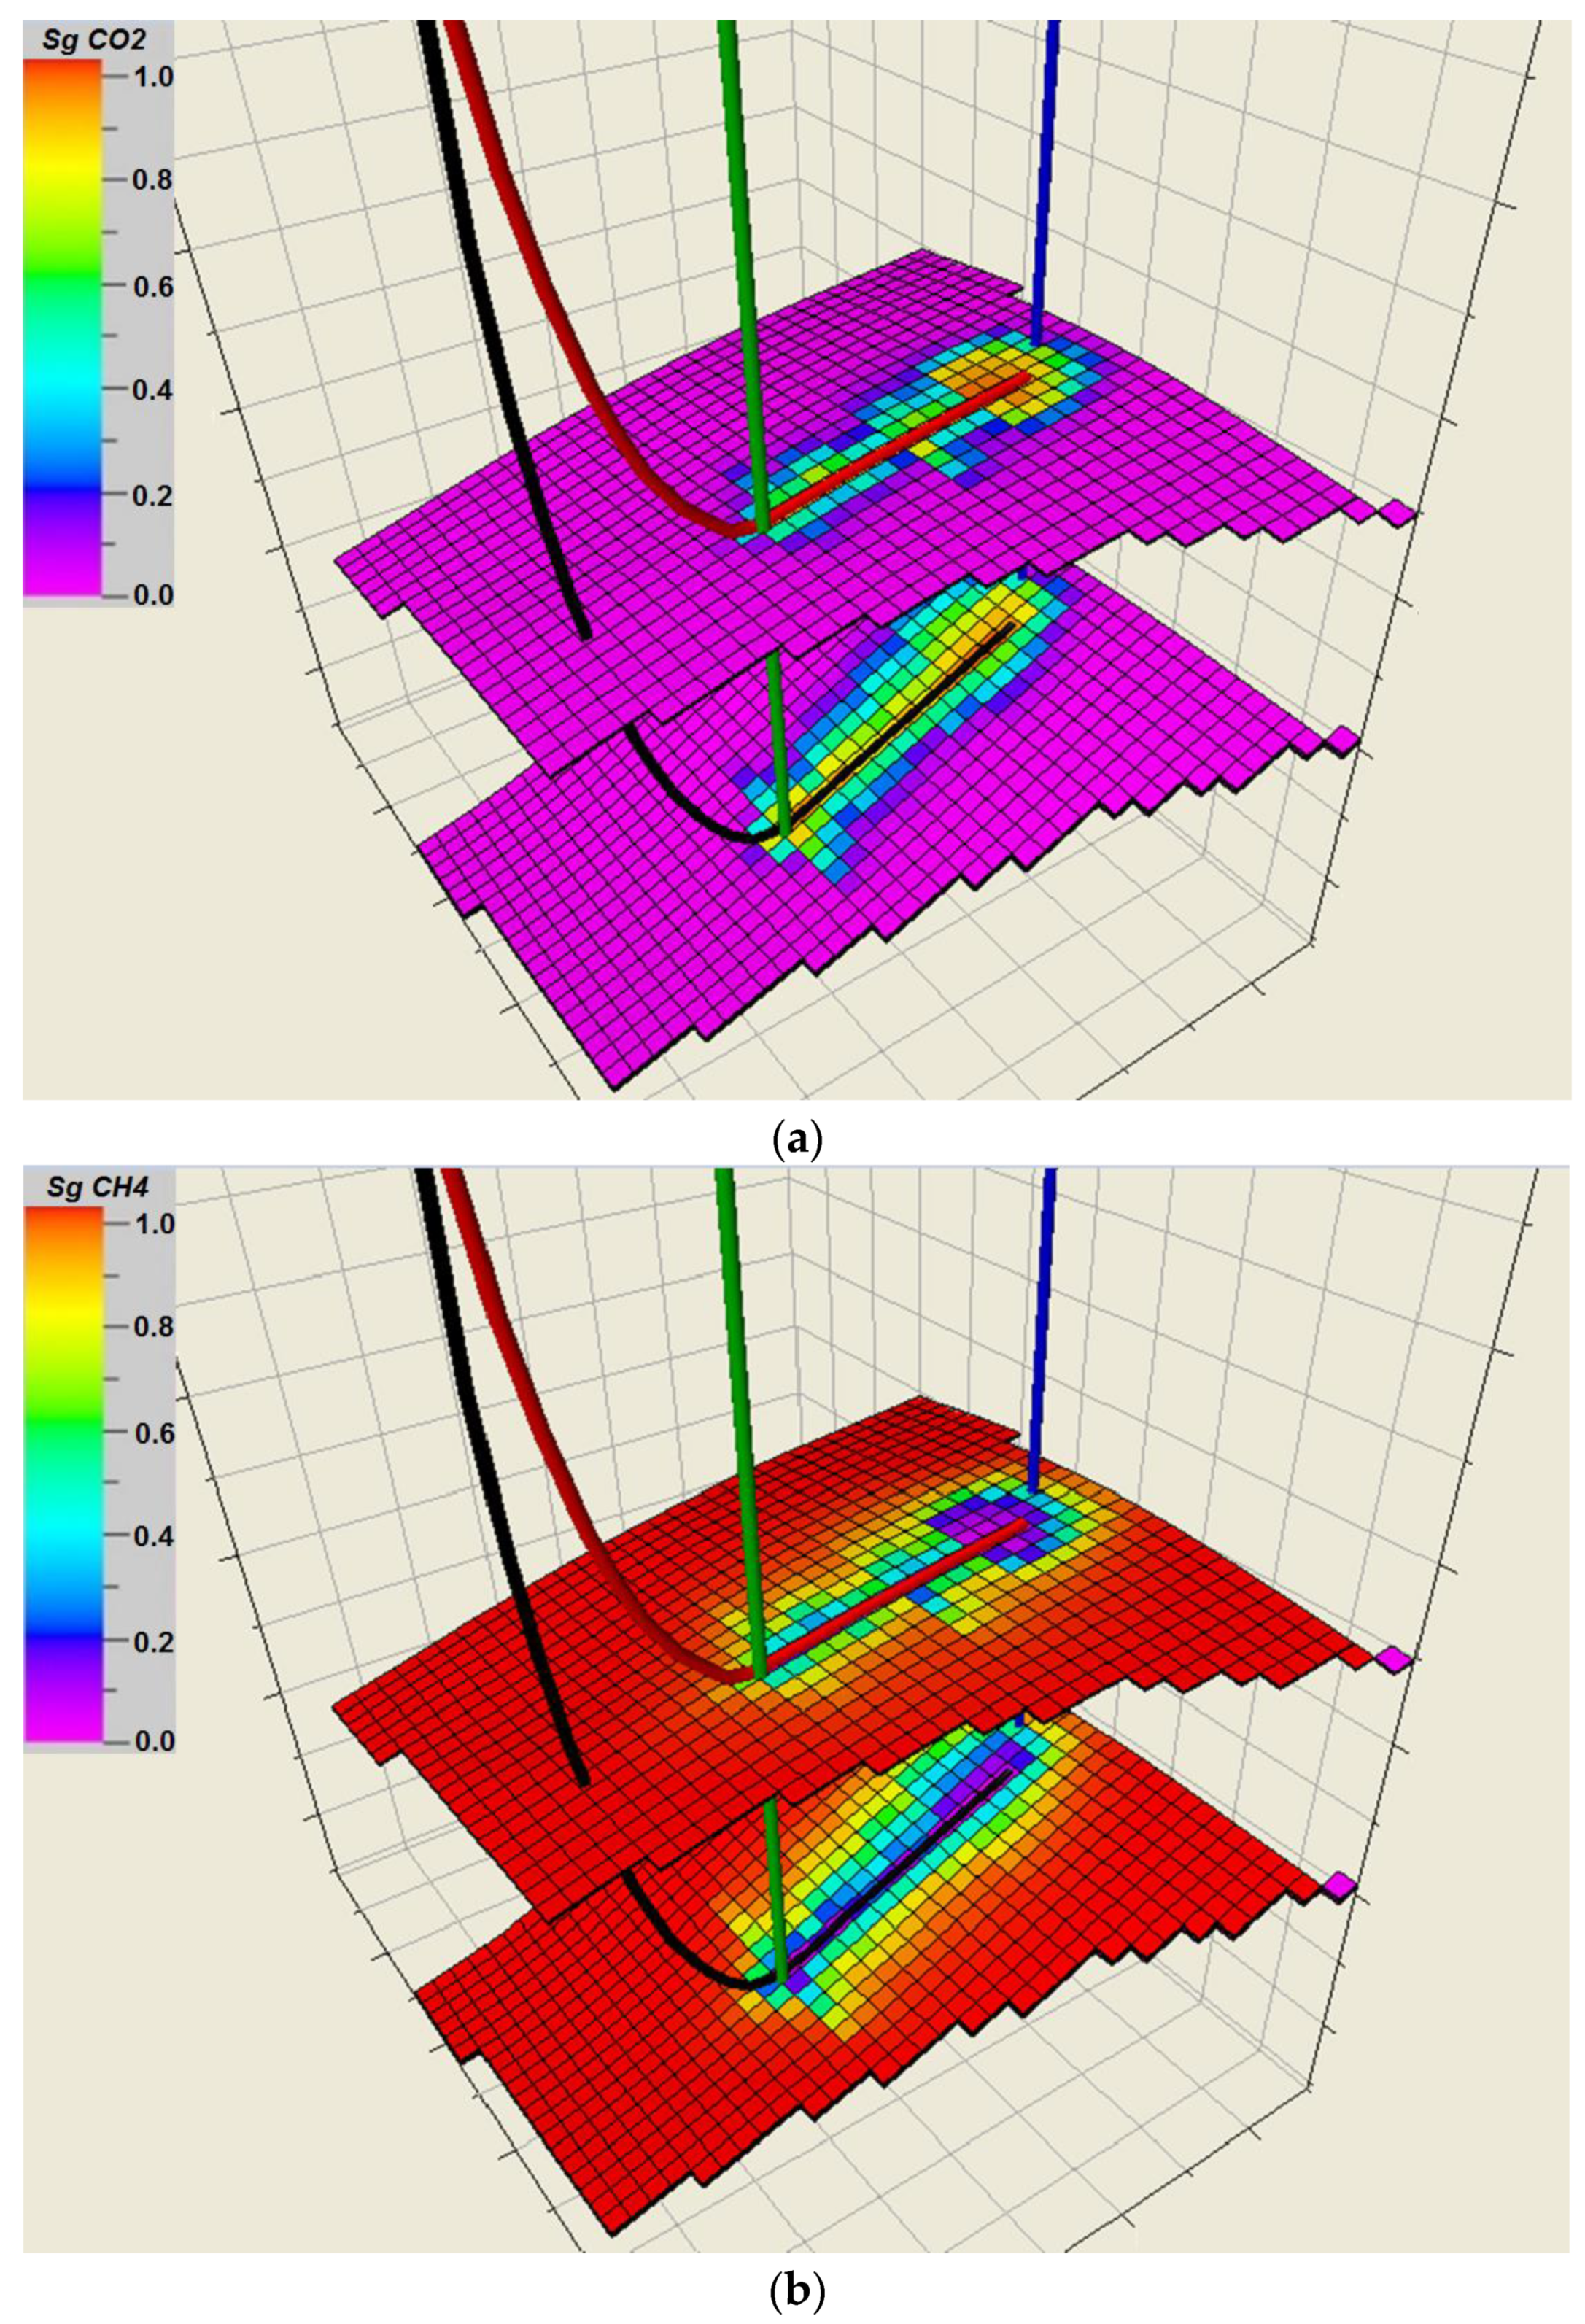
The results of numerical simulations show that part of the CO2 injected into the coal is adsorbed by coal matrix, and the remaining part causes the formation and development of a CO2 zone in the system of fractures around the injection well. The changes in saturation of CO2 and CH4 in the fracture system after one year of CO2 injection are presented in Figure 9 in the form of mole fractions of two components of the gas mixture filling the fractures of coal. Figure 10 presents the saturation of gases in the coal matrix after 1 year of CO2 injection.
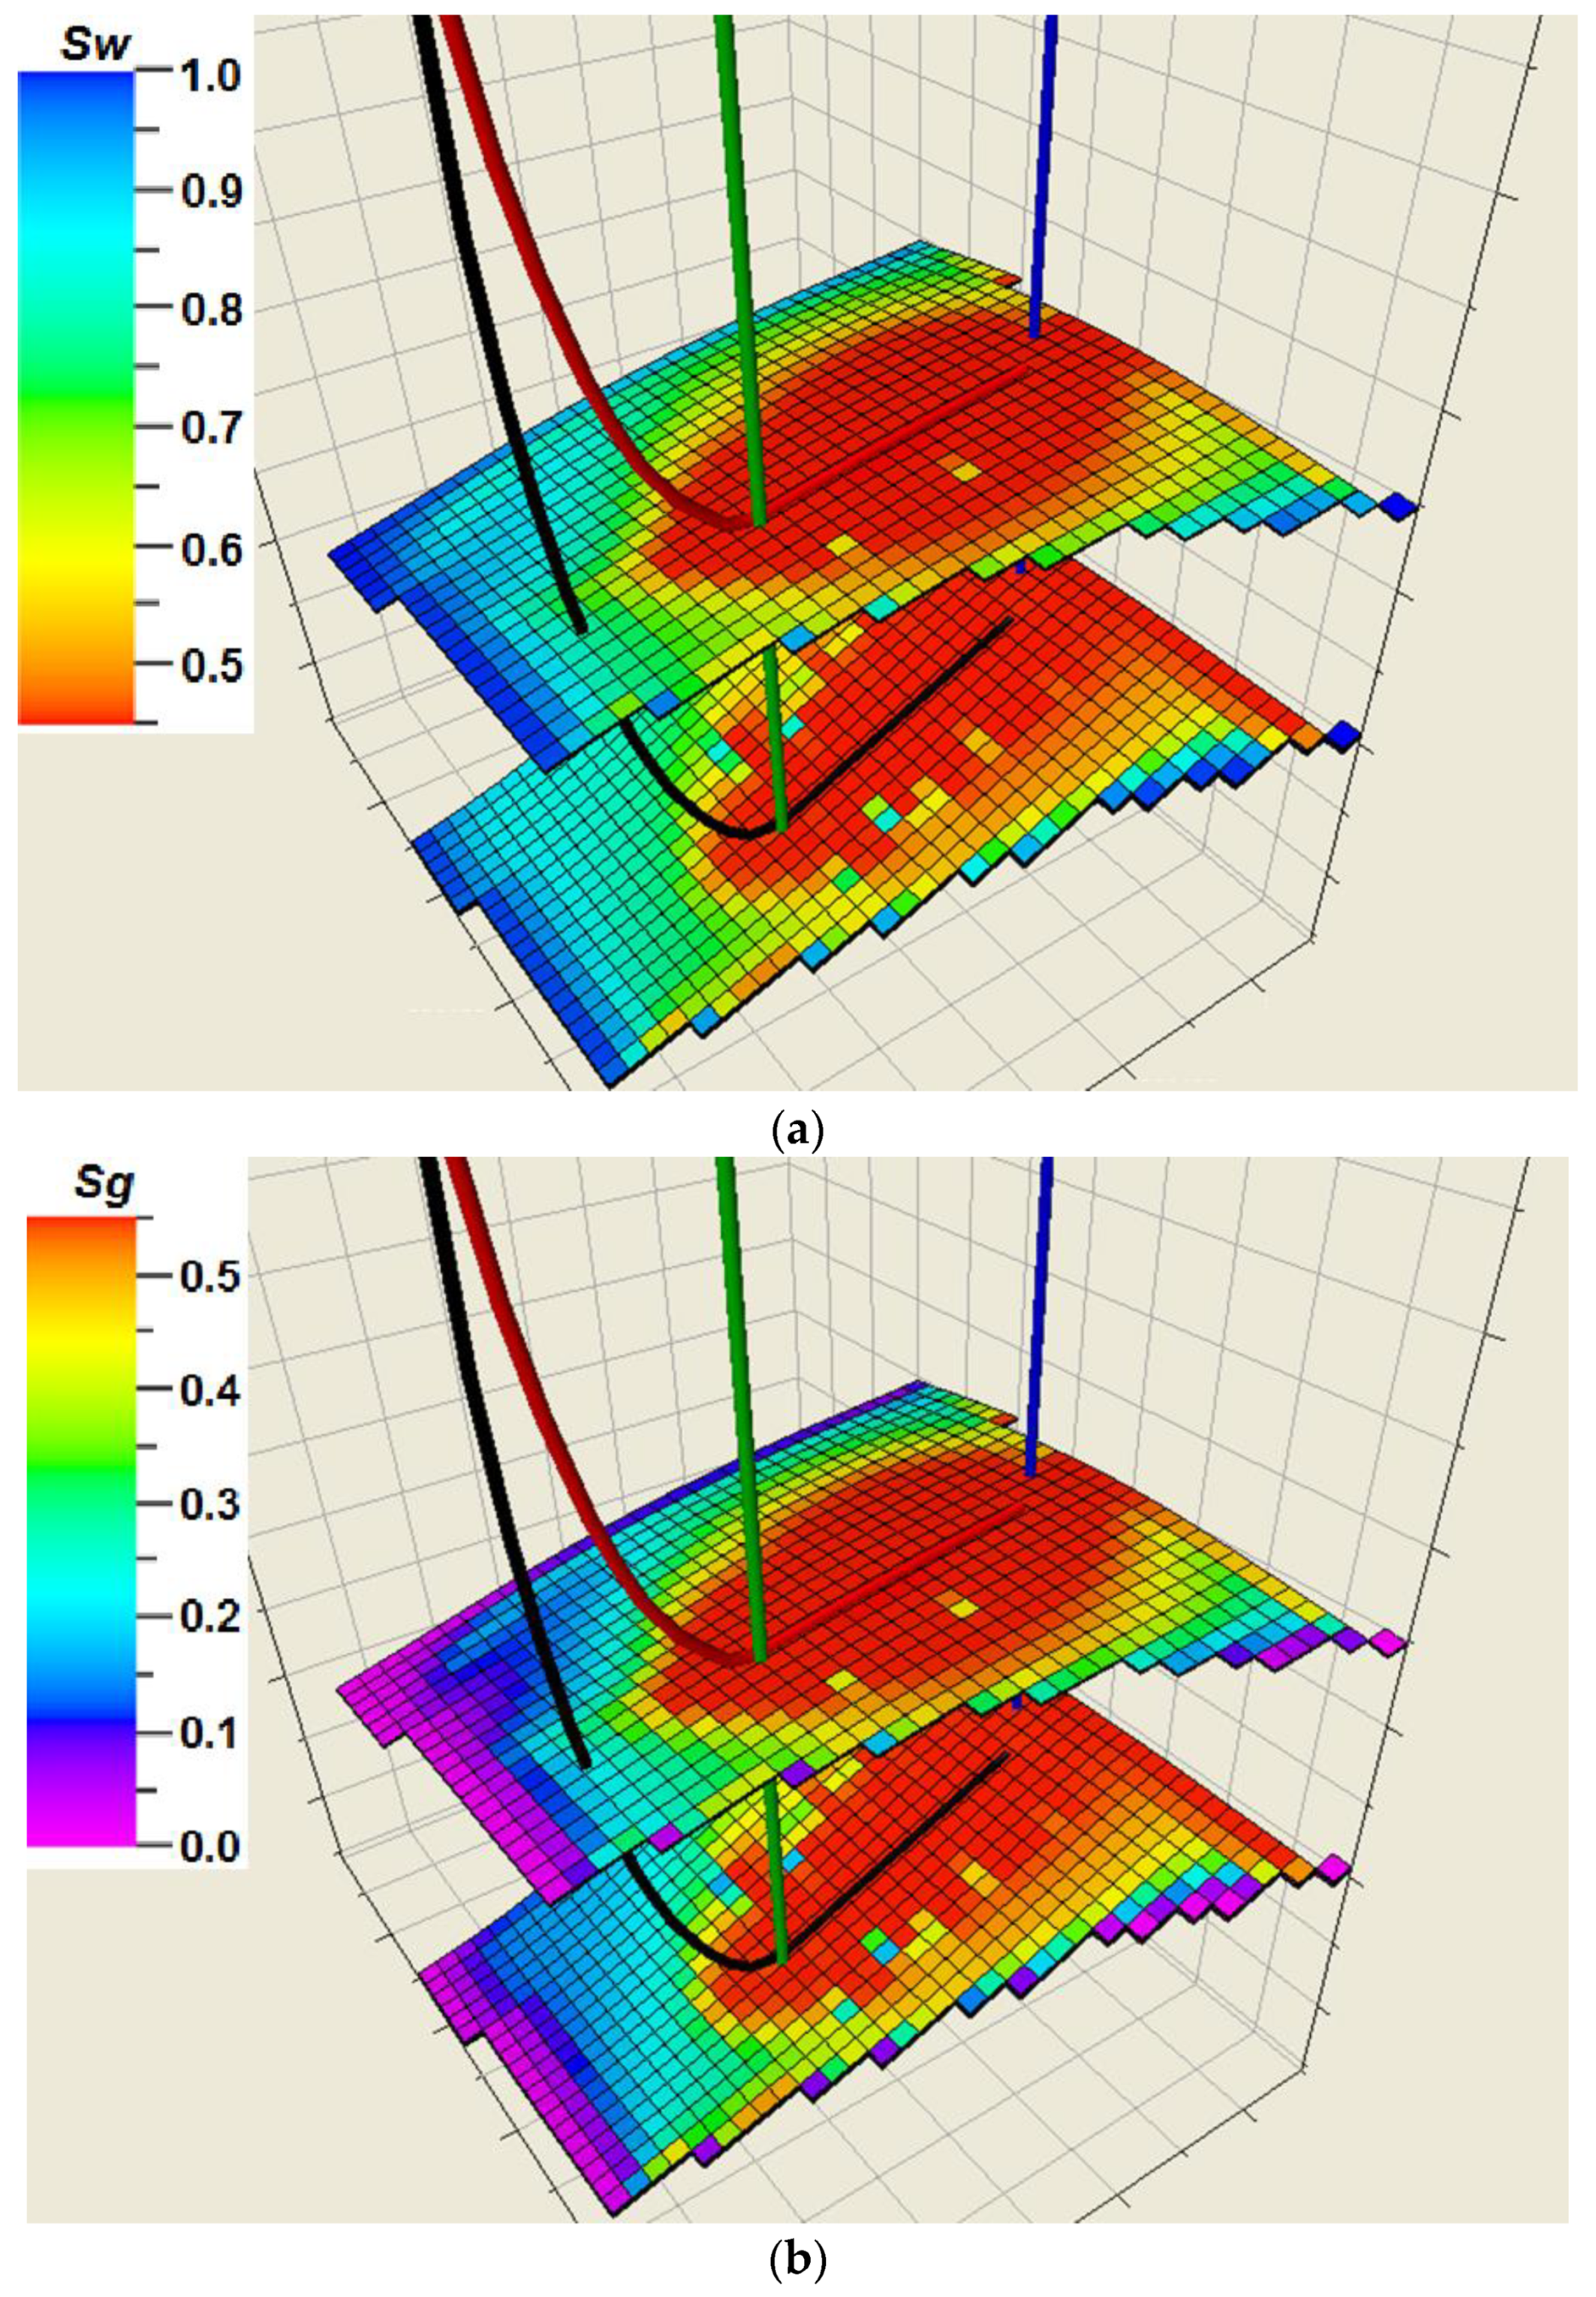
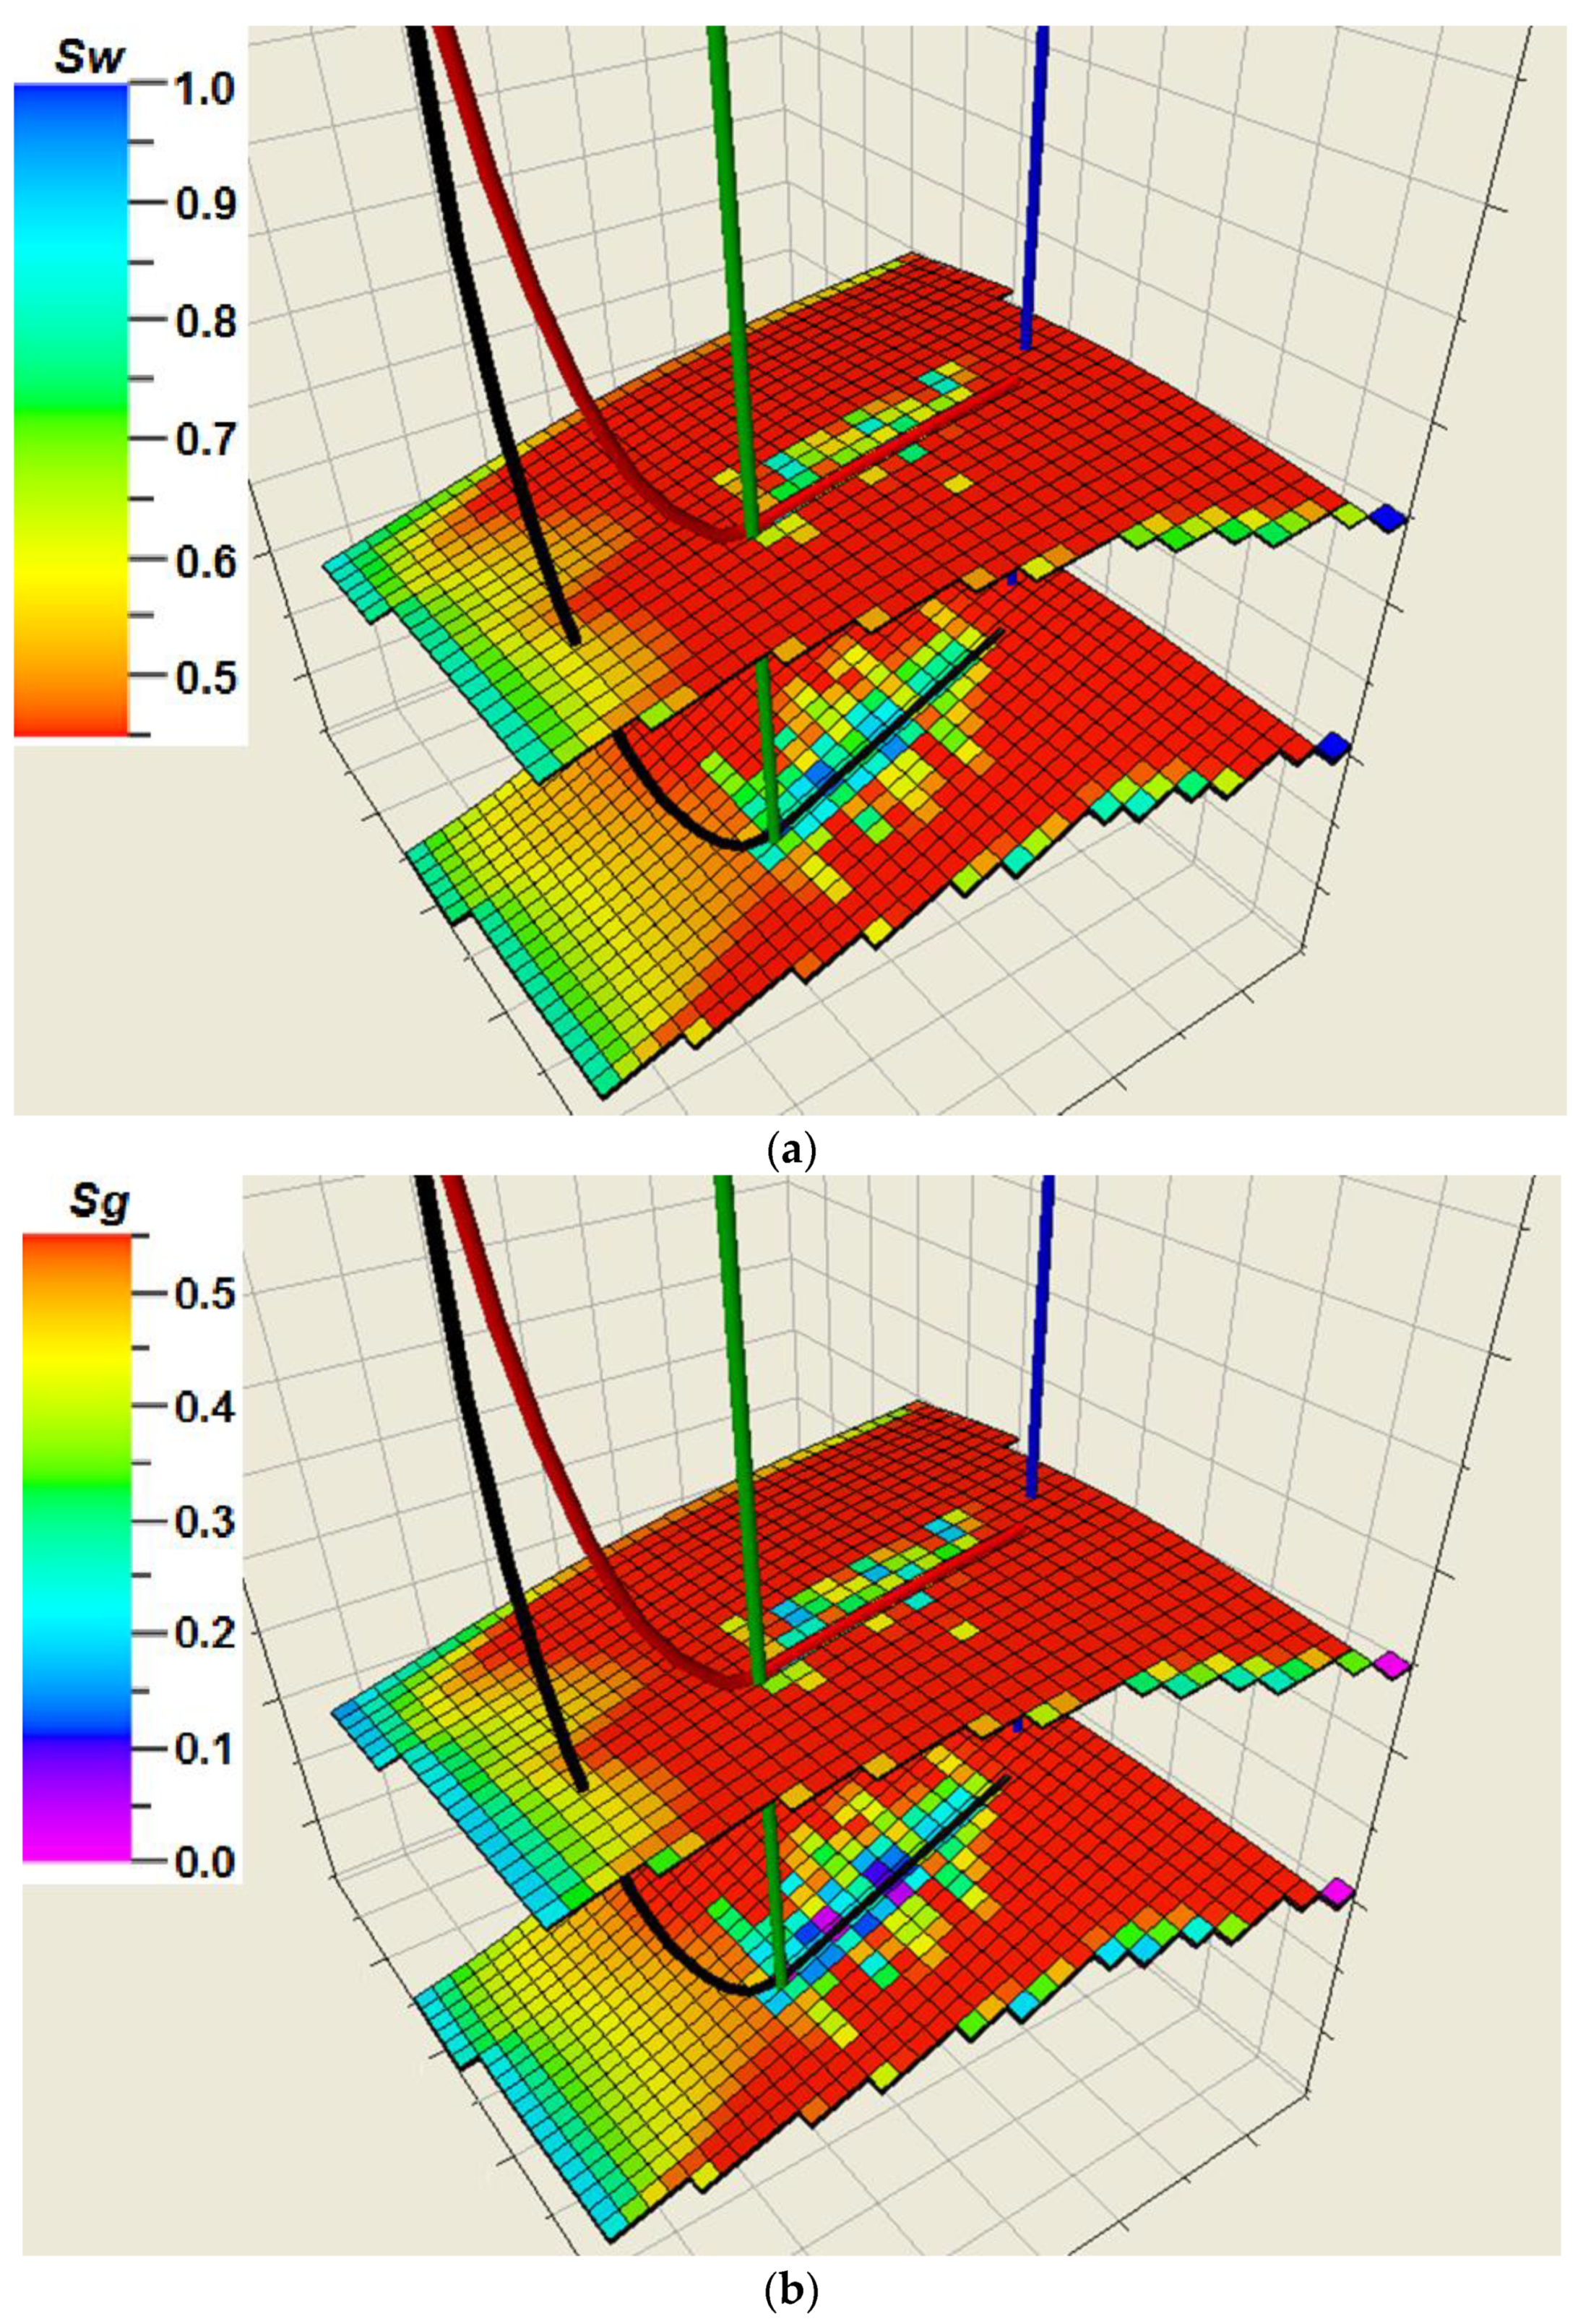
The water saturation of the coal seam decreases from the initial 100% to approximately 45% after 1 year of CO2 injection in the final stage of the simulation (Figure 11a)., whereas gas phase saturation of the cleat system ranges from 0% to about 55% (Figure 11b). Figure 12 presents water and gas phase saturation in the fractures after 5 years from the end of CO2 injection.
Coal cleats are natural fractures whose orientation is connected with the occurrence of tectonic stress during the coalification processes. Coal permeability is mainly related to the system of cleats within the coal structure. During the process of injecting CO2 into the coal seam under supercritical conditions, it may be expected that pore and fracture permeability will increase, especially in the case of large depth storage [21]. Coal permeability may be significantly affected by the changes of relative permeability, which is highly dependent on the degree of rock saturation, on the effective stress exerted on the coal seam as well as on the pore pressure, which causes the coal matrix shrinking and swelling.
The process of methane production from a coal seam is accompanied by two different phenomena closely linked with the gradual drop of the pressure within the seam, which have a negative impact on coal permeability. The first one is rock mass compression causing the increase in the effective stress in the horizontal direction and the decrease in coal permeability. The other one is the phenomenon of methane desorption, which results in the shrinking of coal matrix, thereby decreasing the horizontal stress and increasing coal permeability.
In the case of enhanced methane recovery by means of carbon dioxide injection, the adsorption of CO2, which has a bigger sorption capacity than methane, takes place. The phenomenon of CO2 adsorption may lead to the swelling of coal matrix, which has a negative impact on the permeability of the cleat system. It was reported that the phenomenon of coal matrix shrinking associated with the desorption/adsorption of CO2 is from two to five times bigger in comparison with methane [40]. For this reason, the decrease in coal permeability caused by the shrinking of coal matrix as a result of injecting CO2 is of bigger importance than the increase in coal permeability connected with the matrix shrinking during the primary production of methane [41]. The presented results of the simulations for seam 405 in the Upper Silesian Coal Basin demonstrate that the amount of the injected carbon dioxide significantly decreases after the phenomenon of coal matrix shrinking and swelling has been taken into account in the calculations. It was observed that the aggregate amount of the injected carbon dioxide decreases in such a case by approximately 68%. Figure 13 presents the daily CO2 injection rate both with and without taking into consideration the phenomenon of coal matrix shrinking and swelling.
A number of researchers have investigated coal matrix deformation in laboratory experiments using methane, carbon dioxide and other gases [42,43,44,45,46]. In the majority of these studies, CO2 was found to cause the swelling of coal matrix of the order of two to five times greater than methane. Moreover, simultaneous measurements of coal matrix swelling and permeability under CO2 injection [47] have shown that the swelling of matrix caused by CO2 injection has a severe impact on coal permeability, confirming the outcome of ECBM field pilots. For example, the loss of injectivity was experienced in the RECOPOL field experiment both before the hydraulic fracture treatment was performed and afterwards, especially during the periods when continuous injection was temporarily interrupted. The decrease in injectivity was attributed to coal swelling, but this could not be proven in the field. Other possible explanations include the clogging of the wellbore perforations or of the near-well zone by clays, precipitation of mineral scaling and the collapse of the cleat network around the well. Although such effects cannot be excluded, it can be inferred from laboratory experiments on coal based on the material from the RECOPOL site [48,49], that coal swelling certainly played a significant role in the reduction of permeability in the RECOPOL field test. To overcome this problem, there is a clear need for an operational strategy to control or avoid the permeability loss caused by coal swelling during the ECBM operations.

4. Conclusions

The study presents the results of modeling 3D distributions of gas and water phases within the cleat system assuming phase equilibrium, the distribution of the saturation of CO2 and CH4 in the coal seams as well as the process of gas migrations during particular stages of the simulation. The results of the simulations demonstrate that the aggregate amount of carbon dioxide injected into coal seam 405 during the period of one year equaled 1,954,213 sm3. The aggregate amount of water obtained from the production wells during the whole period of the simulations (6.5 years) totaled 9867 sm3. In parallel, 15,558,906 sm3 of gas was extracted, out of which 14,445,424 sm3 constituted methane.
The remaining 7% of the recovered gas was carbon dioxide obtained as a result of the reverse production of previously injected CO2. Having taken into account the phenomenon of the shrinking and swelling of coal matrix, it was observed that the aggregate amount of the injected carbon dioxide decreased by approximately 68% to the level of 625,000 sm3.
The series of computer simulations conducted in this study enable to observe the changes in the parameters of bituminous coal resulting from the injection of carbon dioxide into the seam. However, a detailed analysis of the selected region in terms of its suitability for coal seam CO2 storage requires further analyses including the sorption, geotechnical and other parameters.
The results of the simulations confirm the possibility of enhancing coalbed methane recovery by means of carbon dioxide injection (ECBM). In the discussed region, a 50% increase in methane extraction was observed in comparison to CBM technology. With regard to the observed significant impact of CO2 injection on coal permeability connected with a decrease in the process effectiveness, it is necessary to apply hydraulic fracturing of the coal seams in order to increase the efficiency of the ECBM technology.

Author Contributions

Conceptualization, J.C., T.U., M.M., and A.S.; methodology, J.C and T.U.; software, T.U.; validation, T.U., J.C. and A.S.; formal analysis, J.C., M.M.; investigation, J.C.; data curation, T.U., J.C.; writing—original draft preparation, J.C., M.M.; writing—review and editing, J.C., M.M., T.U.; visualization, T.U.; supervision, A.S. All authors have read and agree to the published version of the manuscript.

Funding

This work was supported by Narodowy Fundusz Ochrony Środowiska i Gospodarki Wodnej, Poland, grant number 408/2008/15u-07/FG-GO-Tx/D.

Conflicts of Interest

The authors declare no conflict of interest.

References

  1. Ridha, S.; Pratama, E.; Ismail, S.M. Performance assessment of CO2 sequestration in a horizontal well for enhanced coalbed methane recovery in deep unmineable coal seams. Chem. Eng. Trans. 2017, 56. [Google Scholar] [CrossRef]
  2. Sloss, L.L. Potential for Enhanced Coalbed Methane Recovery; IEA Clean Coal Centre: London, UK, 2015; ISBN 978-92-9029-574-7. [Google Scholar]
  3. Sams, W.N.; Bromhal, G.; Jikich, S.A.; Odusote, O.; Ertekin, T.; Smith, D.H. Simulation Carbon Dioxide Sequestration/ECBM Production in Coal Seams: Effects of Coal Properties and Operational Parameters; Paper SPE 78691; Society of Petroleum Engineers: Richardson, TX, USA, 2002. [Google Scholar]
  4. Wojtacha-Rychter, K.; Howaniec, N.; Smoliński, A. The effect of coal grain size on the sorption of hydrocarbons from gas mixtures. Int. J. Energy Res. 2019, 43, 3496–3506. [Google Scholar] [CrossRef]
  5. Wojtacha-Rychter, K.; Smoliński, A. Selective adsorption of ethane, ethylene, propane, and propylene in gas mixtures on different coal samples and implications for fire hazard assessments. Int. J. Coal Geol. 2019, 202, 38–45. [Google Scholar] [CrossRef]
  6. Wojtacha-Rychter, K.; Smoliński, A. The interactions between coal and multi-component gas mixtures in the process of coal self-heating at different various temperatures ranges: An experimental study. Fuel 2018, 213, 150–157. [Google Scholar] [CrossRef]
  7. Fang, H.; Snag, S.; Liu, S. Establishment of dynamic permeability model of coal reservoir and its numerical simulation during the CO2-ECBM process. J. Pet. Sci. Eng. 2019, 179, 885–898. [Google Scholar] [CrossRef]
  8. Du, Y.; Snag, S.; Pan, Z.; Wang, W.; Liu, S.; Fu, C.; Zhao, Y.; Zhang, J. Experimental study of supercritical CO2-H2O-coal interactions and the effect on coal permeability. Fuel 2019, 253, 369–382. [Google Scholar] [CrossRef]
  9. Więckowski, M.; Howaniec, N.; Postnikov, E.B.; Chorążewski, M.; Smoliński, A. Changes in the distribution of temperature in a coal deposit and the composition of gases emitted during its heating and cooling. Sustainability 2018, 10, 3587. [Google Scholar] [CrossRef] [Green Version]
  10. Howaniec, N.; Więckowski, M.; Smoliński, A. The effect of flow rates of gases flowing through a coal bed during coal heating and cooling on concentrations of gases emitted and fire hazard assessment. Int. J. Coal Sci. Technol. 2019. [Google Scholar] [CrossRef] [Green Version]
  11. Bromhal, G.S.; Sams, W.N.; Jikich, S.; Ertekin, T.; Smith, D.H. Simulation of CO2 sequestration in coalbeds: The effects of sorption isotherms. Chem. Geol. 2005, 217, 201–211. [Google Scholar] [CrossRef]
  12. Wong, S.; Gunter, W.D.; Mavor, M.J. Economics of CO2 sequestration in coalbed methane reservoirs. In Proceedings of the SPE/CERI Gas Technology Symposium, Calgary, AB, Canada, 3–5 April 2000; pp. 631–638. [Google Scholar]
  13. Stanton, R.; Froles, R.; Warwick, P.D.; Gluskoter, H. Coalbed sequestration of carbon dioxide. In Proceedings of the 1st National Conference on Carbon Sequestration, Washington, DC, USA, 14–17 May 2001. [Google Scholar]
  14. Krooss, B.; Van Bergen, F.; Gensterblum, Y.; Siemons, N.; Pagnier, H.; David, P. High-Pressure methane and carbon dioxide adsorption on dry and moisture equilibrated Pennsylvanian coals. Int. J. Coal Geol. 2002, 51, 69–92. [Google Scholar] [CrossRef]
  15. Shi, J.Q.; Durcan, S.; Sinka, I.C. Key parameters controlling coalbed methane cavity well performance. Int. J. Coal Geol. 2002, 49, 19–31. [Google Scholar] [CrossRef]
  16. Ceglarska-Stefańska, G.; Nodeński, A.; Hołda, S. Badania układu węgiel-gaz w aspekcie pozyskania metanu i sekwestracji CO2. Gos. Sur. Min. 2007, 23, 51–59. [Google Scholar]
  17. Mazzotti, M.; Pini, R.; Storti, G. Enhanced coalbed methane recovery. J. Supercrit. Fluids 2009, 47, 619–627. [Google Scholar] [CrossRef]
  18. Li, X.; Fang, Z.M. Current status and technical challenges of CO2 storage in coal seams and enhanced coalbed methane recovery. Int. J. Coal Sci. Technol. 2014, 1, 93–102. [Google Scholar] [CrossRef] [Green Version]
  19. Reeves, S.R. Coal-Seq Project Update: Fluid Studies of ECBM recovery/CO2 sequestration in coal seams. In Proceedings of the International Conference on Greenhouse Gas Control Technologies (GHGT.6), Kyoto, Japan, 1–4 October 2002. [Google Scholar]
  20. Reeves, S.R.; Outinot, A. The Tiffany unit N2-ECBM Pilot—A reservoir and economic analysis. In Proceedings of the International Coalbed Methane Symposium, Tuscaloosa, AL, USA, 16–20 May 2005. Paper 0523. [Google Scholar]
  21. Dutta, P.; Zoback, M.D. CO2 sequestration into the Wyodak coal seam of Powder River Basin—Preliminary reservoir characterization and simulation. Int. J. Greenh. Gas Control 2012, 9, 103–116. [Google Scholar] [CrossRef]
  22. Zdeb, J.; Howaniec, N.; Smoliński, A. Utilization of carbon dioxide in coal gasification—An experimental study. Energies 2019, 12. [Google Scholar] [CrossRef] [Green Version]
  23. Urych, T.; Smoliński, A. Numerical modeling of CO2 migration in saline aquifers of selected areas in the Upper Silesian Coal Basin in Poland. Energies 2019, 12, 3093. [Google Scholar] [CrossRef] [Green Version]
  24. Van Bergen, F.; Krzystolik, P.; Van Wageningen, N.; Pagnier, H.; Jura, B.; Skiba, J.; Winthaegen, P.; Kobiela, Z. Production of gas from coal seams in the Upper Silesian Coal Basin in Poland in the post injection period of an ECBM pilot site. Int. J. Coal Geol. 2009, 77, 175–187. [Google Scholar] [CrossRef]
  25. Van Bergen, F.; Winthaegen, P.; Pagnier, H.; Krzystolik, P.; Jura, B.; Skiba, J.; Van Wageningen, N. Assessment of CO2 storage performance of the enhanced coalbed methane pilot site in Kaniów. Energy Procedia 2009, 1, 3407–3414. [Google Scholar] [CrossRef] [Green Version]
  26. Chadwick, A.; Arts, R.; Bernstone, C.; May, F.; Thibeau, S.; Zwigiel, R. Best Practice for the Storage of CO2 in Saline Aquifers, Observations and Guidelines from SACS and CO2STORE Projects; British Geological Survey: Nottingham, UK, 2006.
  27. Koteras, A.; Chećko, J.; Urych, T.; Magdziarczyk, M.; Smoliński, A. An assessment of the formations and structures suitable for safe CO2 geological storage in the Upper Silesian Coal Basin in Poland in the context of the regulation relating to the CCS. Energies 2020, 13, 195. [Google Scholar] [CrossRef] [Green Version]
  28. Jureczka, J.; Checko, J.; Krieger, W.; Warzecha, R. Feasibility study of CO2 storage in saline formations and structures of the Upper Silesian Coal Basin. Biul. Państwowego Inst. Geol. 2012, 448, 47–56. [Google Scholar]
  29. Larry, T. Coal Geology; John Wiley & Sons, Ltd.: Chichester, UK, 2002; p. 261. [Google Scholar]
  30. Arri, L.E.; Yee, D.; Morgan, W.D.; Jeansonne, N.W. Modeling Coalbed Methane Production with Binary Gas Sorption; SPE 24363; Society of Petroleum Engineers: Richardson, TX, USA, 1992. [Google Scholar]
  31. ECLIPSE User Manual; ECLIPSE Reservoir Simulation Software; Simulation Software Manuals 2011.1; Schlumberger: Houston, TX, USA, 2011.
  32. Wageningen, W.F.C.; Maas, J.G. Reservoir simulation and interpretation of the RECOPOL ECBM pilot in Poland. In Proceedings of the International CBM Symposium, Tuscaloosa, AL, USA, 23–24 May 2007. [Google Scholar]
  33. Mu, Y.; Fan, Y.; Wang, J.; Fan, M. Numerical study on injection of flue gas as heat carrier into coal reservoir to enhance CBM recovery. J. Nat. Gas. Sci. Eng. 2019, 72. [Google Scholar] [CrossRef]
  34. Mukherjee, M.; Misra, S.A. A review of experimental research on enhanced coal bed methane (ECBM) recovery via CO2 sequestration. Earth Sci Rev. 2018, 179, 392–410. [Google Scholar] [CrossRef]
  35. Cao, J.; Sun, H.T.; Dai, L.C.; Sun, D.L.; Wang, B.; Miao, F.T. Simulation research on dynamic effect of coal and gas outburst. J. China Univ. Min. Technol. 2018, 47, 113–120. [Google Scholar]
  36. Wahid, A.; Putra, F.A.; Taufiq Hidayt, M.; Yusuf, M. Enhanced coal bed methane (ECBM) recovery: Optimization of CBM production using different injected gas composition and rate for South Sumatra CBM field, Indonesia. E3S Web Conf. 2018, 67, 03015. [Google Scholar] [CrossRef]
  37. McCants, C.Y.; Spafford, S.; Stevens, S.H. Five-spot production pilot on tight spacing: Rapid evaluation of a coalbed methane block in the Upper Silesian Coal Basin, Poland. In Proceedings of the 2001 International Coalbed Methane Symposium University of Alabama, Tuscaloosa, AL, USA, 14–18 May 2001; Paper 0124. pp. 193–204. [Google Scholar]
  38. Reeves, S.; Taillefert, A. Reservoir Modeling for the Design of the RECOPOL CO2 Sequestration Project, Poland—Topical Report; Advanced Resources International: Houston, TX, USA, 2002. [Google Scholar]
  39. Pagnier, H.; van Bergen, F.; Krzystolik, P.; Skiba, J.; Jura, B.; Hadro, J.; Stevens, S. Field experiment of ECBM-CO2 in the Upper Silesian Basin of Poland (RECOPOL). Greenh. Gas Control Technol. 2005, 1391–1397. [Google Scholar] [CrossRef]
  40. Seidle, J.R.; Huitt, L.G. Experimental measurement of coal matrix shrinkage due to gas desorption andimplications for cleat permeability increases. In Proceedings of the International Meeting on Petroleum Engineering, Beijing, China, 14–17 November 1995. [Google Scholar] [CrossRef]
  41. Palmer, I.; Mansoori, J. How Permeability Depends on Stress and Pore Pressure in Coalbeds: A New Model; SPE Paper 36737; Society of Petroleum Engineers: Richardson, TX, USA, 1998. [Google Scholar]
  42. Moffat, D.H.; Weale, K.E. Sorption by coal of methane at high pressures. Fuel 1955, 34, 449–462. [Google Scholar]
  43. Reucroft, P.J.; Patel, H. Gas induced swelling in coal. Fuel 1986, 65, 816–820. [Google Scholar] [CrossRef]
  44. Gray, I. Reservoir engineering in coal seams: Part 1—The physical process of gas storage and movement in coal seams. SPE Reserv. Eval. Eng. 1987, 2, 12514. [Google Scholar] [CrossRef]
  45. Mitra, A.; Harpalani, S. Modeling incremental swelling of coal matrix with CO2 injection in coalbed Methane reservoirs. In Proceedings of the 2007 SPE Eastern Regional Meeting, Lexington, KY, USA, 17–19 October 2007. SPE Paper 111184. [Google Scholar]
  46. Chikatamarla, L.; Cui, X.; Bustin, R.M. Implications of volumetric swelling/shrinkage of coal in sequestration of acid gases. In Proceedings of the 2004 International Coalbed Methane Symposium, Tuscaloosa, AL, USA, 3–9 May 1999. [Google Scholar]
  47. Durucan, S.; Ahsanb, M.; Shia, J. Matrix shrinkage and swelling characteristics of European coals. Energy Procedia 2009, 1, 3055–3062. [Google Scholar] [CrossRef] [Green Version]
  48. Van Bergen, F. Effect of Coal Matrix Swelling on Enhanced Coalbed Methane Production: A Field and Laboratory Study. Ph.D. Thesis, Utrecht University, Utrecht, The Netherlands, 2009; p. 196. [Google Scholar]
  49. Mazumder, S.; Wolf, K.-H. Differential swelling and permeability change of coal in response to CO2 injection for ECBM. Int. J. Coal Geol. 2008, 74, 123–138. [Google Scholar] [CrossRef]
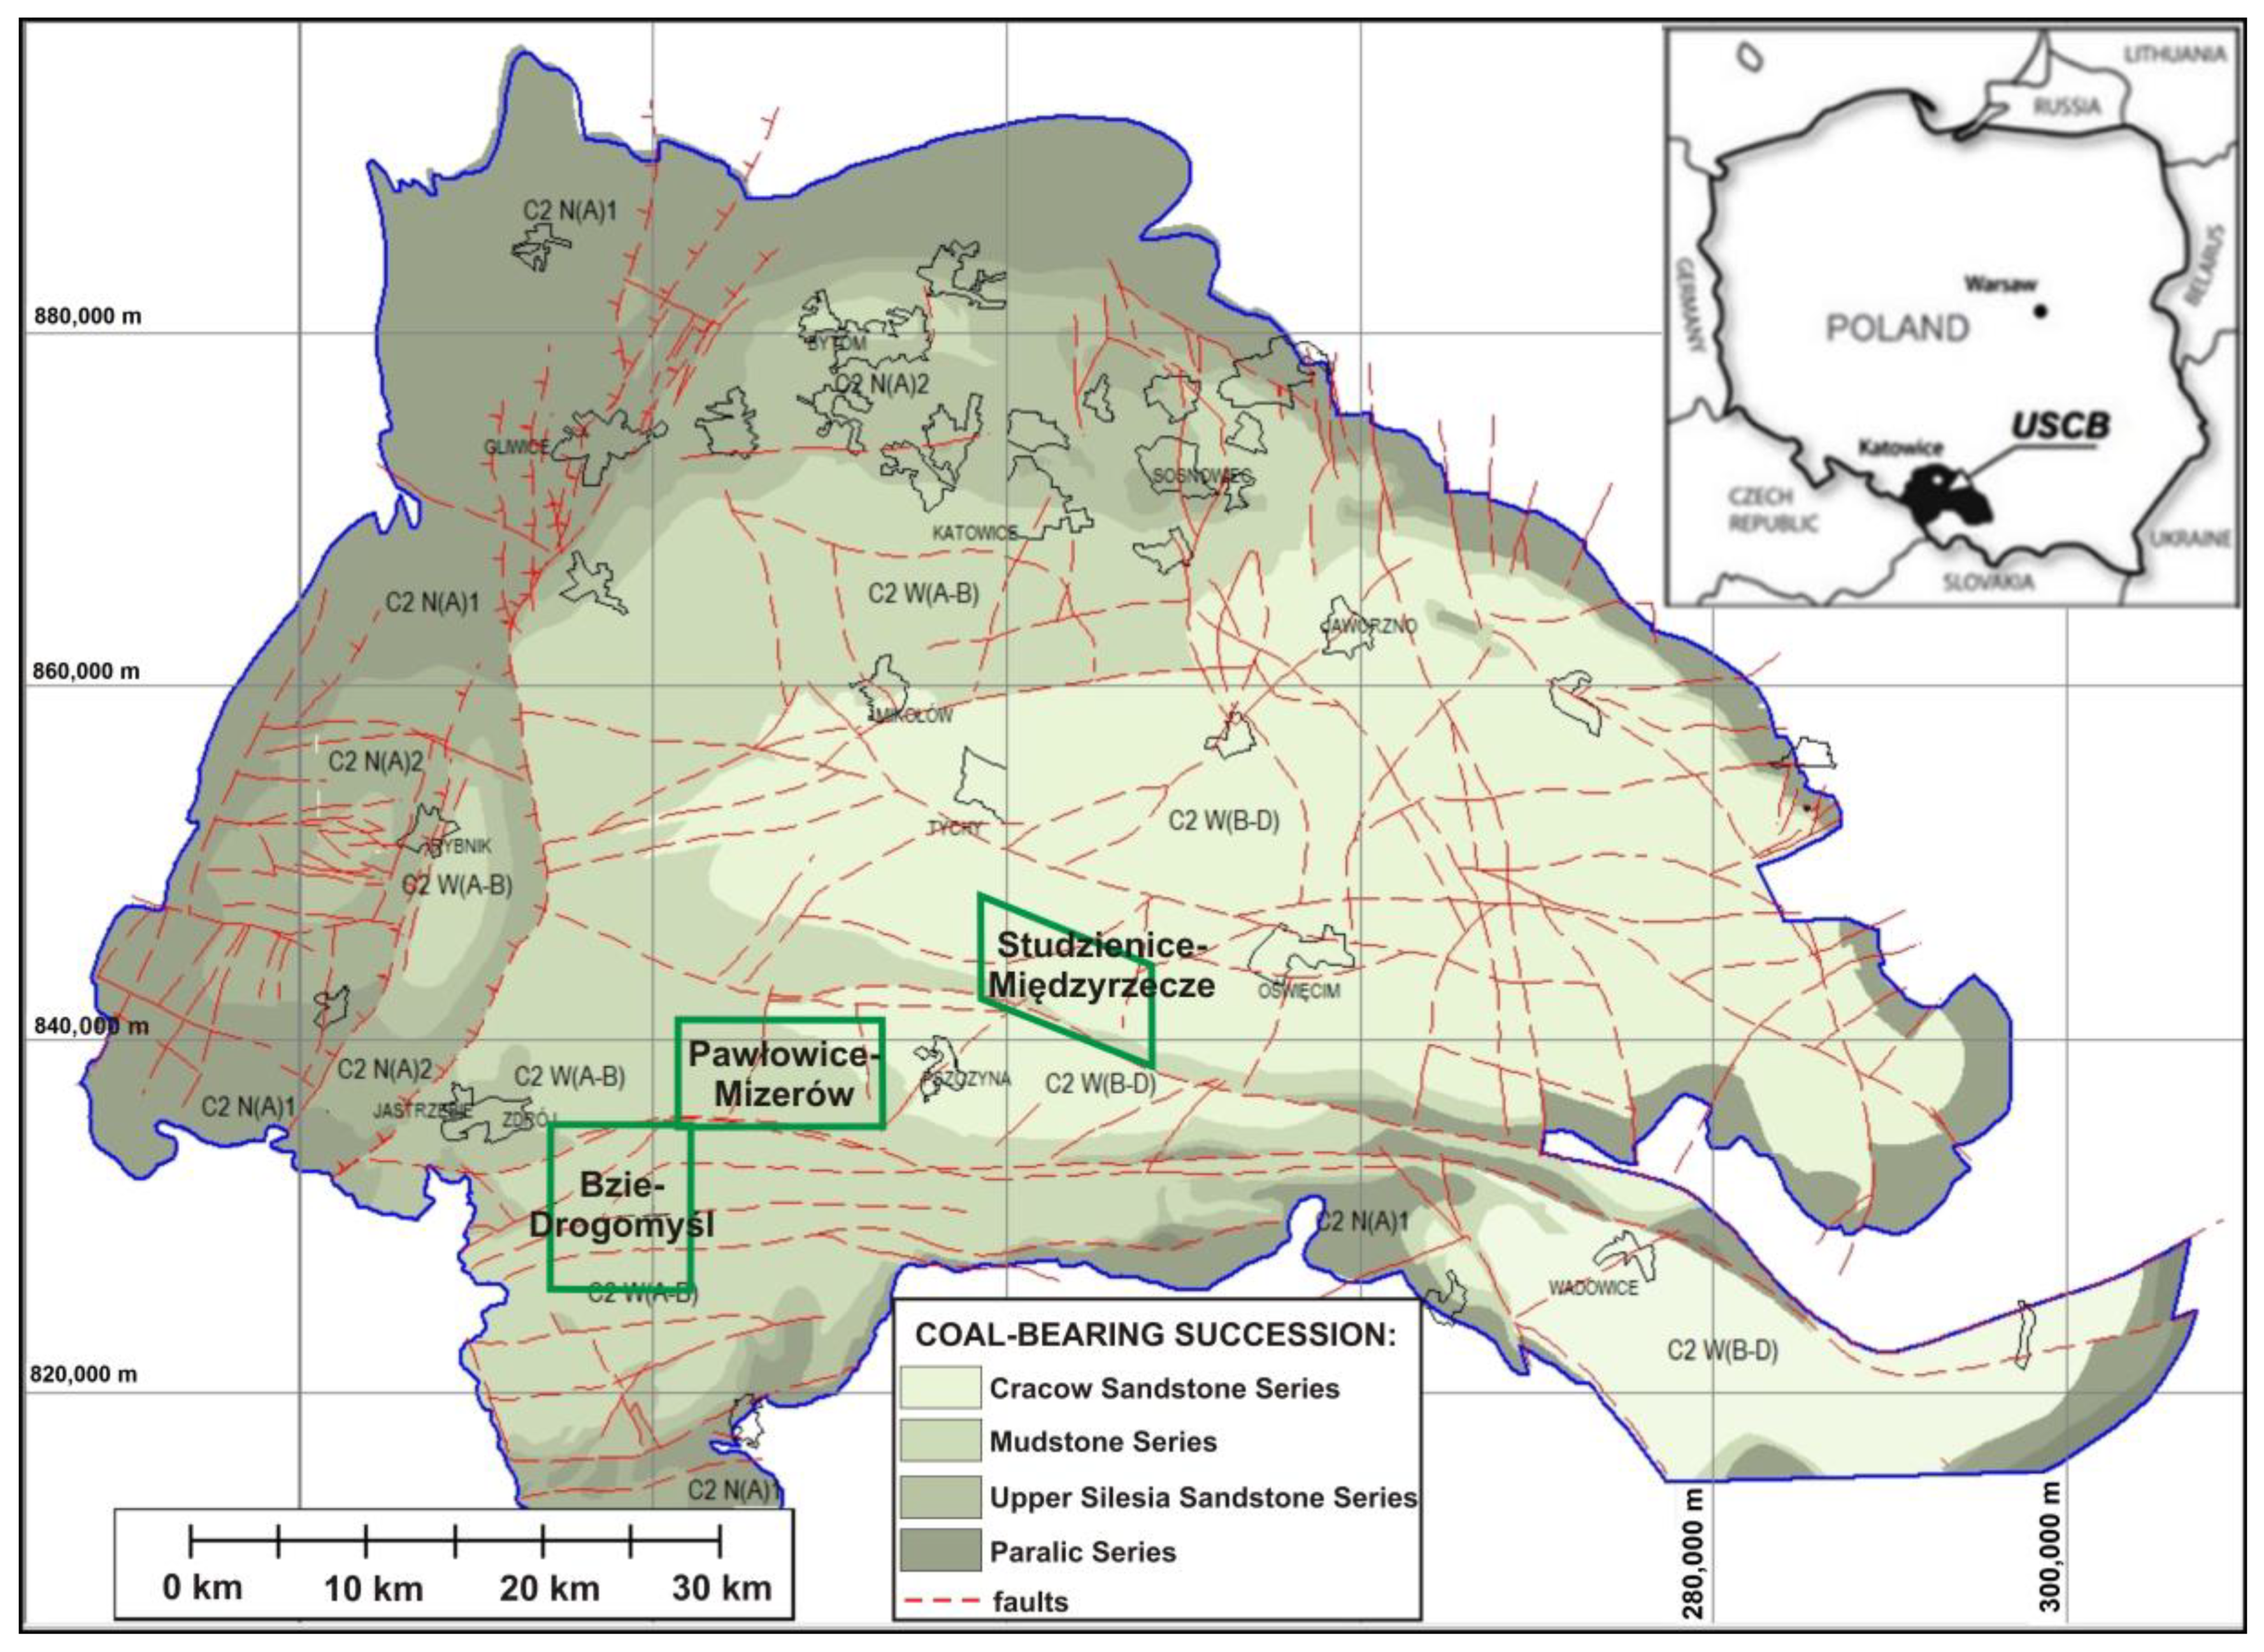
Figure 1. Location of the three enhanced coal bed methane (ECBM) promising regions selected for research on CO2 storage in deep coal seams on the geological map of the Upper Silesian Coal Basin (USCB).
Energies 13 00416 g001
Figure 2. Coal seams 405 and 510 as reflected in the model.
Energies 13 00416 g002
Figure 3. The location of the modeled area set against a map of land development with the designated wells, archival bore holes and tectonic blocks.
Energies 13 00416 g003
Figure 4. A spatial lithology model of Pawłowice–Mizerów region (USCB, Poland).
Energies 13 00416 g004
Figure 5. The distribution of methane content for seams: (a) 405 and (b) 510.
Energies 13 00416 g005
Figure 6. The layout of wells in the model of seams 405 and 510.
Energies 13 00416 g006
Figure 7. Changes of average pressure in the CO2 injection zone (black line) and daily CO2 injection flowrate (red line).
Energies 13 00416 g007
Figure 8. Daily production rates of water (blue line) and methane (red line).
Energies 13 00416 g008
Figure 9. Changes in gas saturation-Sg: (a) CO2 and (b) CH4 in fractures after 1 year of CO2 injection (mole fractions of gases in fractures).
Energies 13 00416 g009
Figure 10. Changes in gas saturation-Sg: (a) CO2 and (b) CH4 in coal matrix after 1 year of CO2 injection. (mole fractions of gases in coal matrix).
Energies 13 00416 g010
Figure 11. Changes in water saturation—Sw (a) and gaseous phase—Sg (b) in the fractures after 1 year of CO2 injection.
Energies 13 00416 g011
Figure 12. Changes in water saturation—Sw (a) and gaseous phase—Sg (b) in the fractures after 5 years from the end of CO2 injection.
Energies 13 00416 g012
Figure 13. Daily CO2 injection rate (the red color signifies the results of the simulation taking into account the phenomenon of coal matrix shrinking and swelling, while the blue one represents the simulation results, which do not include the phenomenon).
Energies 13 00416 g013
Table 1. The results of lithology modeling in the region of Pawłowice–Mizerów (USCB, Poland).
Lithology TypePercentage (%)
Bituminous coal15.90
Claystone44.31
Sandstone27.40
Mudstone12.15
Conglomerate0.23
Table 2. Methane content in coal seams 405 and 510.
SeamMethane Content (m3 CH4/Mgdaf)
minmaxAverage
4052.5410.054.20
5102.986.763.80
Table 3. Structural parameters of the model for seams 405 and 510.
ParameterSeam 405Seam 510
Thickness (m)3.08.0
Depth (m)1333–15161640–1967
The area of the model (m2)1,836,790
Horizontal resolution of the interpolation grid (m)50 × 50
Vertical resolution of the model (m)1.02.66
Fracture porosity (%)0.5
Permeability X,Y,Z (mD)1.5
Table 4. Details of the reservoir simulation model.
ParameterSeam 405Seam 510Unit
Initial pressure at the injection point110.4–115.7143.4–157.3bar
Coal density1330.0kg/m3
CH4 Diffusion coefficient0.0000685m2/d
CO2 Diffusion coefficient0.0001390m2/d
Min. Production pressure5.0bar
Max. Injection pressure165.0175.0bar
Extended Langmuir Isotherm Parameters
CH4, volume VL0.0205sm3/kg
CH4, pressure PL42.00bar
CO2, volume VL0.0320sm3/kg
CO2, pressure PL19.03bar