Article

Thermal Performance and Energy Saving Analysis of Indoor Air–Water Heat Exchanger Based on Micro Heat Pipe Array for Data Center

Beijing Key Laboratory of Green Built Environment and Energy Efficient Technology, Beijing University of Technology, Beijing 100124, China
*
Author to whom correspondence should be addressed.
Energies 2020, 13(2), 393; https://doi.org/10.3390/en13020393
Submission received: 4 December 2019 / Revised: 5 January 2020 / Accepted: 8 January 2020 / Published: 13 January 2020

Abstract

:
According to the temperature regulations and high energy consumption of air conditioning (AC) system in data centers (DCs), natural cold energy becomes the focus of energy saving in data center in winter and transition season. A new type of air–water heat exchanger (AWHE) for the indoor side of DCs was designed to use natural cold energy in order to reduce the power consumption of AC. The AWHE applied micro-heat pipe arrays (MHPAs) with serrated fins on its surface to enhance heat transfer. The performance of MHPA-AWHE for different inlet water temperatures, water and air flow rates was investigated, respectively. The results showed that the maximum efficiency of the heat exchanger was 81.4% by using the effectiveness number of transfer units (ε-NTU) method. When the max air flow rate was 3000 m3/h and the water inlet temperature was 5 °C, the maximum heat transfer rate was 9.29 kW. The maximum pressure drop of the air side and water side were 339.8 Pa and 8.86 kPa, respectively. The comprehensive evaluation index j/f1/2 of the MHPA-AWHE increased by 10.8% compared to the plate–fin heat exchanger with louvered fins. The energy saving characteristics of an example DCs in Beijing was analyzed, and when the air flow rate was 2500 m3/h and the number of MHPA-AWHE modules was five, the minimum payback period of the MHPA-AWHE system was 2.3 years, which was the shortest and the most economical recorded. The maximum comprehensive energy efficiency ratio (EER) of the system after the transformation was 21.8, the electric power reduced by 28.3% compared to the system before the transformation, and the control strategy was carried out. The comprehensive performance provides a reference for MHPA-AWHE application in data centers.

Graphical Abstract

1. Introduction

With the development of information technology, the scale of data centers (DCs) is increasing daily, and the mass heat dissipation affects the stability and reliability of the circuits [1,2]. The American Society of Heating, Refrigerating and Air-Conditioning Engineers (ASHRAE) proposed that the indoor temperature of DCs should be controlled at 28 °C, and the air cleanliness should reach grade three [3]. The air conditioning systems of DCs run continuously for 8760 h throughout the year, which results in a huge energy consumption [4,5]. Due to the low outdoor environment temperatures in the transition season and winter, the natural cold energy can be fully utilized to reduce the cooling system energy consumption [6]. Therefore, using natural cold energy efficiently has great significance on the research of DCs.
The technologies making use of natural cold energy in data centers are mainly divided into three conventional DC cooling architectures [7]: (a) Room-based cooling throughout the space, (b) row-based cooling between servers, (c) chip and rack-based cooling. Because of the simple design and high efficiency of the first architecture, it is suitable for energy-saving reconstruction in small-sized and medium-sized DCs, which has been widely studied by scholars worldwide. According to the direct air-side free cooling system, the results showed that the energy consumption of free air cooling system reduced by 20%–47.5% compared to conventional the air-conditioning system in DCs [8,9]. However, this type is always limited by the cleanliness, temperature and humidity of the outdoor environment. Other researchers have analyzed the applicability and energy saving potential of various types of air–air heat exchangers system in data centers. The energy saving effect is remarkable, and the structure is simple compared to a conventional air conditioning system [10,11,12,13]. However, the air–air heat exchanger systems of various types, along with the heat transfer rate, are also limited by the high quality requirements of air flow, narrow space and large heat transfer area.
Many scholars [14,15,16] have applied desiccant cooling system (DCS) and also phase-change materials to DCs, and as the free cold air and indoor exhausted–air can be dehumidified by solid (silicone), liquid (LiCl) and other desiccants, the dry air can then be cooled by evaporative cooling equipment to reach the indoor air supply requirements. In a sensible heat state, the cooling efficiency of DCS is higher, reaching more than 80%. This technology replaced CFCs with no pollution to the environment, and in the process of regeneration can be combined with solar energy and other clean resources. However, the integrated desiccant cooling system has many shortcomings and problems which hinder its development and application; for example, the stability of desiccants, the pressure drop of air flow in desiccant devices, power consumption in the regeneration link and complexity, etc. To overcome these disadvantages, different types of air–water heat exchanger systems have been studied. An integrated water side economizer (IWSE) adopted by Le Bot [17] was simulated to investigate the efficiency of the server room temperature, and a new temperature adaptive control strategy was proposed and tested. To enhance the heat transfer performances, Wang et al. [18,19,20] studied the heat transfer and resistance characteristics of AWHEs with different kinds of fins. The results showed that different plate spacing, numbers of rows, and arrangement modes had certain effects on the comprehensive performance, and the louver fin showed the best performance amongst the flat fins, perforated fins, corrugated fins, and louver fins of air–water heat exchanger. The results of Hsieh [21] showed that when the Reynolds number (Re) was in the range of 300–2000, the heat transfer factor j of the louver fins was 18.6%–29.8% higher than flat fins, and the friction resistance factor f increased by 39.7%–58.9%. Based on the above research, it was concluded that the heat transfer performances of air–water heat exchangers were better than those of air–air heat exchangers. However, common air–water heat exchangers have the disadvantages of large pressure drops and thermal resistances [22].
To enhance heat transfer and uniformity of the temperature distribution, a growing number of scholars are applying heat pipe cooling systems to DCs with the development of heat pipe technology. Zhu et al. [23] proposed a separate heat pipe heat exchanger system and a simulation method to estimate the operating performance and the energy efficiency, which reduced the mismatch degree by increasing the heat pipe series, and the maximum heat transfer efficiency of a three-stage heat pipe heat exchanger was 65%. Yue et al. [24] developed a parallel micro-channel separate heat pipe system, where the maximum cooling capacity reached 9.6 kW when the corresponding optimal refrigerant filling ratio was 65.27%. Moreover, the heat flux was greatly affected by the temperature distribution of the inlet and outlet and different filling ratios. There are also some studies that use gravity heat pipes to improve the performance of heat exchanger system [25,26,27]. However, the separated and the gravity heat pipe systems were directly affected by many factors, such as (a) the selection and filling rates of the working fluids, (b) the ambient temperature and pipeline length, and (c) the limitation of the shape of round heat pipes, which are difficult to fit with fins. There are several limitations in the heat transfer rate, system stability, and spatial distribution.
Based on these limitations, Zhao et al. [28] proposed a flat micro-heat pipe array (MHPA). It possessed a large heat transfer coefficient and a large contact area with a flat shape which showed good heat transfer performances [29,30,31,32,33]. Diao et al. [34] used an air–air heat exchanger based on MHPA to achieve heat recovery. The surface of the MHPA was composed of serrated fins to enhance the heat transfer, and the highest heat transfer efficiency was 75%. From these previous studies, it can be concluded that a heat exchanger with MHPA as its core component would exhibit a relatively better performance than the above mentioned heat exchangers.
In this study, a new type of indoor air–water heat exchanger based on MHPA (MHPA-AWHE) is proposed to apply in DCs, and the software DeST-c developed by Tsinghua University [35] was adopted to simulate the hourly environment temperature and cooling load of typical DCs in Beijing all the year round, and the energy saving and equipment investment payback period were analyzed. This work has the following advantages:
With regard to the theoretical calculation and actual design of MHPA-AWHE, there are several steps as follows: (a) The comprehensive performance based on heat transfer and pressure drop characteristics of serrated fins shows the best performance of different kinds of fins [19,20]. (b) The heat transfer equations are established from the air side to water side of MHPA-AWHE, and the optimal solution is obtained by simultaneous equations. Under the design condition of certain heat transfer rates, the size of the heat exchanger with the minimum number of MHPAs and the minimum length, width, height is obtained. (c) On this basis, the experimental platform is established, and the experimental results are verified with theoretical calculation values.
With regard to the structure aspect, there are several advantages: (a) The flat-plate appearance of MHPA facilitates the combination with the heat transfer enhancement structure. (b) On the water side, the parallel flow tube with tiny porous channels enlarges the heat transfer area, and the flat-plate appearance can easily fit with MHPA, (c) The serrated fins are used to increase the disturbance of air flow and enlarge the convective heat transfer area to enhance heat transfer.
With regard to the operating effect, (a) compared with traditional heat exchangers, the proposed configuration has a compact structure, small footprint, and low heat loss. (b) The MHPA-AWHE system is flexible and reliable and uses water or antifreeze as the circulating medium between indoor and outdoor sides instead of refrigerant pipelines.
With regard to the energy saving aspect, the most economical operation condition and matching number of modules are suggested in this work, and the critical environment temperature for the opening and closing of MHPA-AWHE system is obtained. The power consumption of DCs after the transformation is lower than that before the transformation.
According to these, the Enthalpy Potential Method Laboratory was used to simulate the ambient temperature of the data center at 28 °C. The heat transfer process and thermal performance of MHPA-AWHE under different conditions were investigated, factors j and f were obtained to analyze the heat transfer and resistance characteristics of MHPAs, and the energy saving characteristic of the MHPA-AWHE system showed good performance and is useful for the application in DCs.

2. Experimental Investigation

2.1. MHPA-AWHE

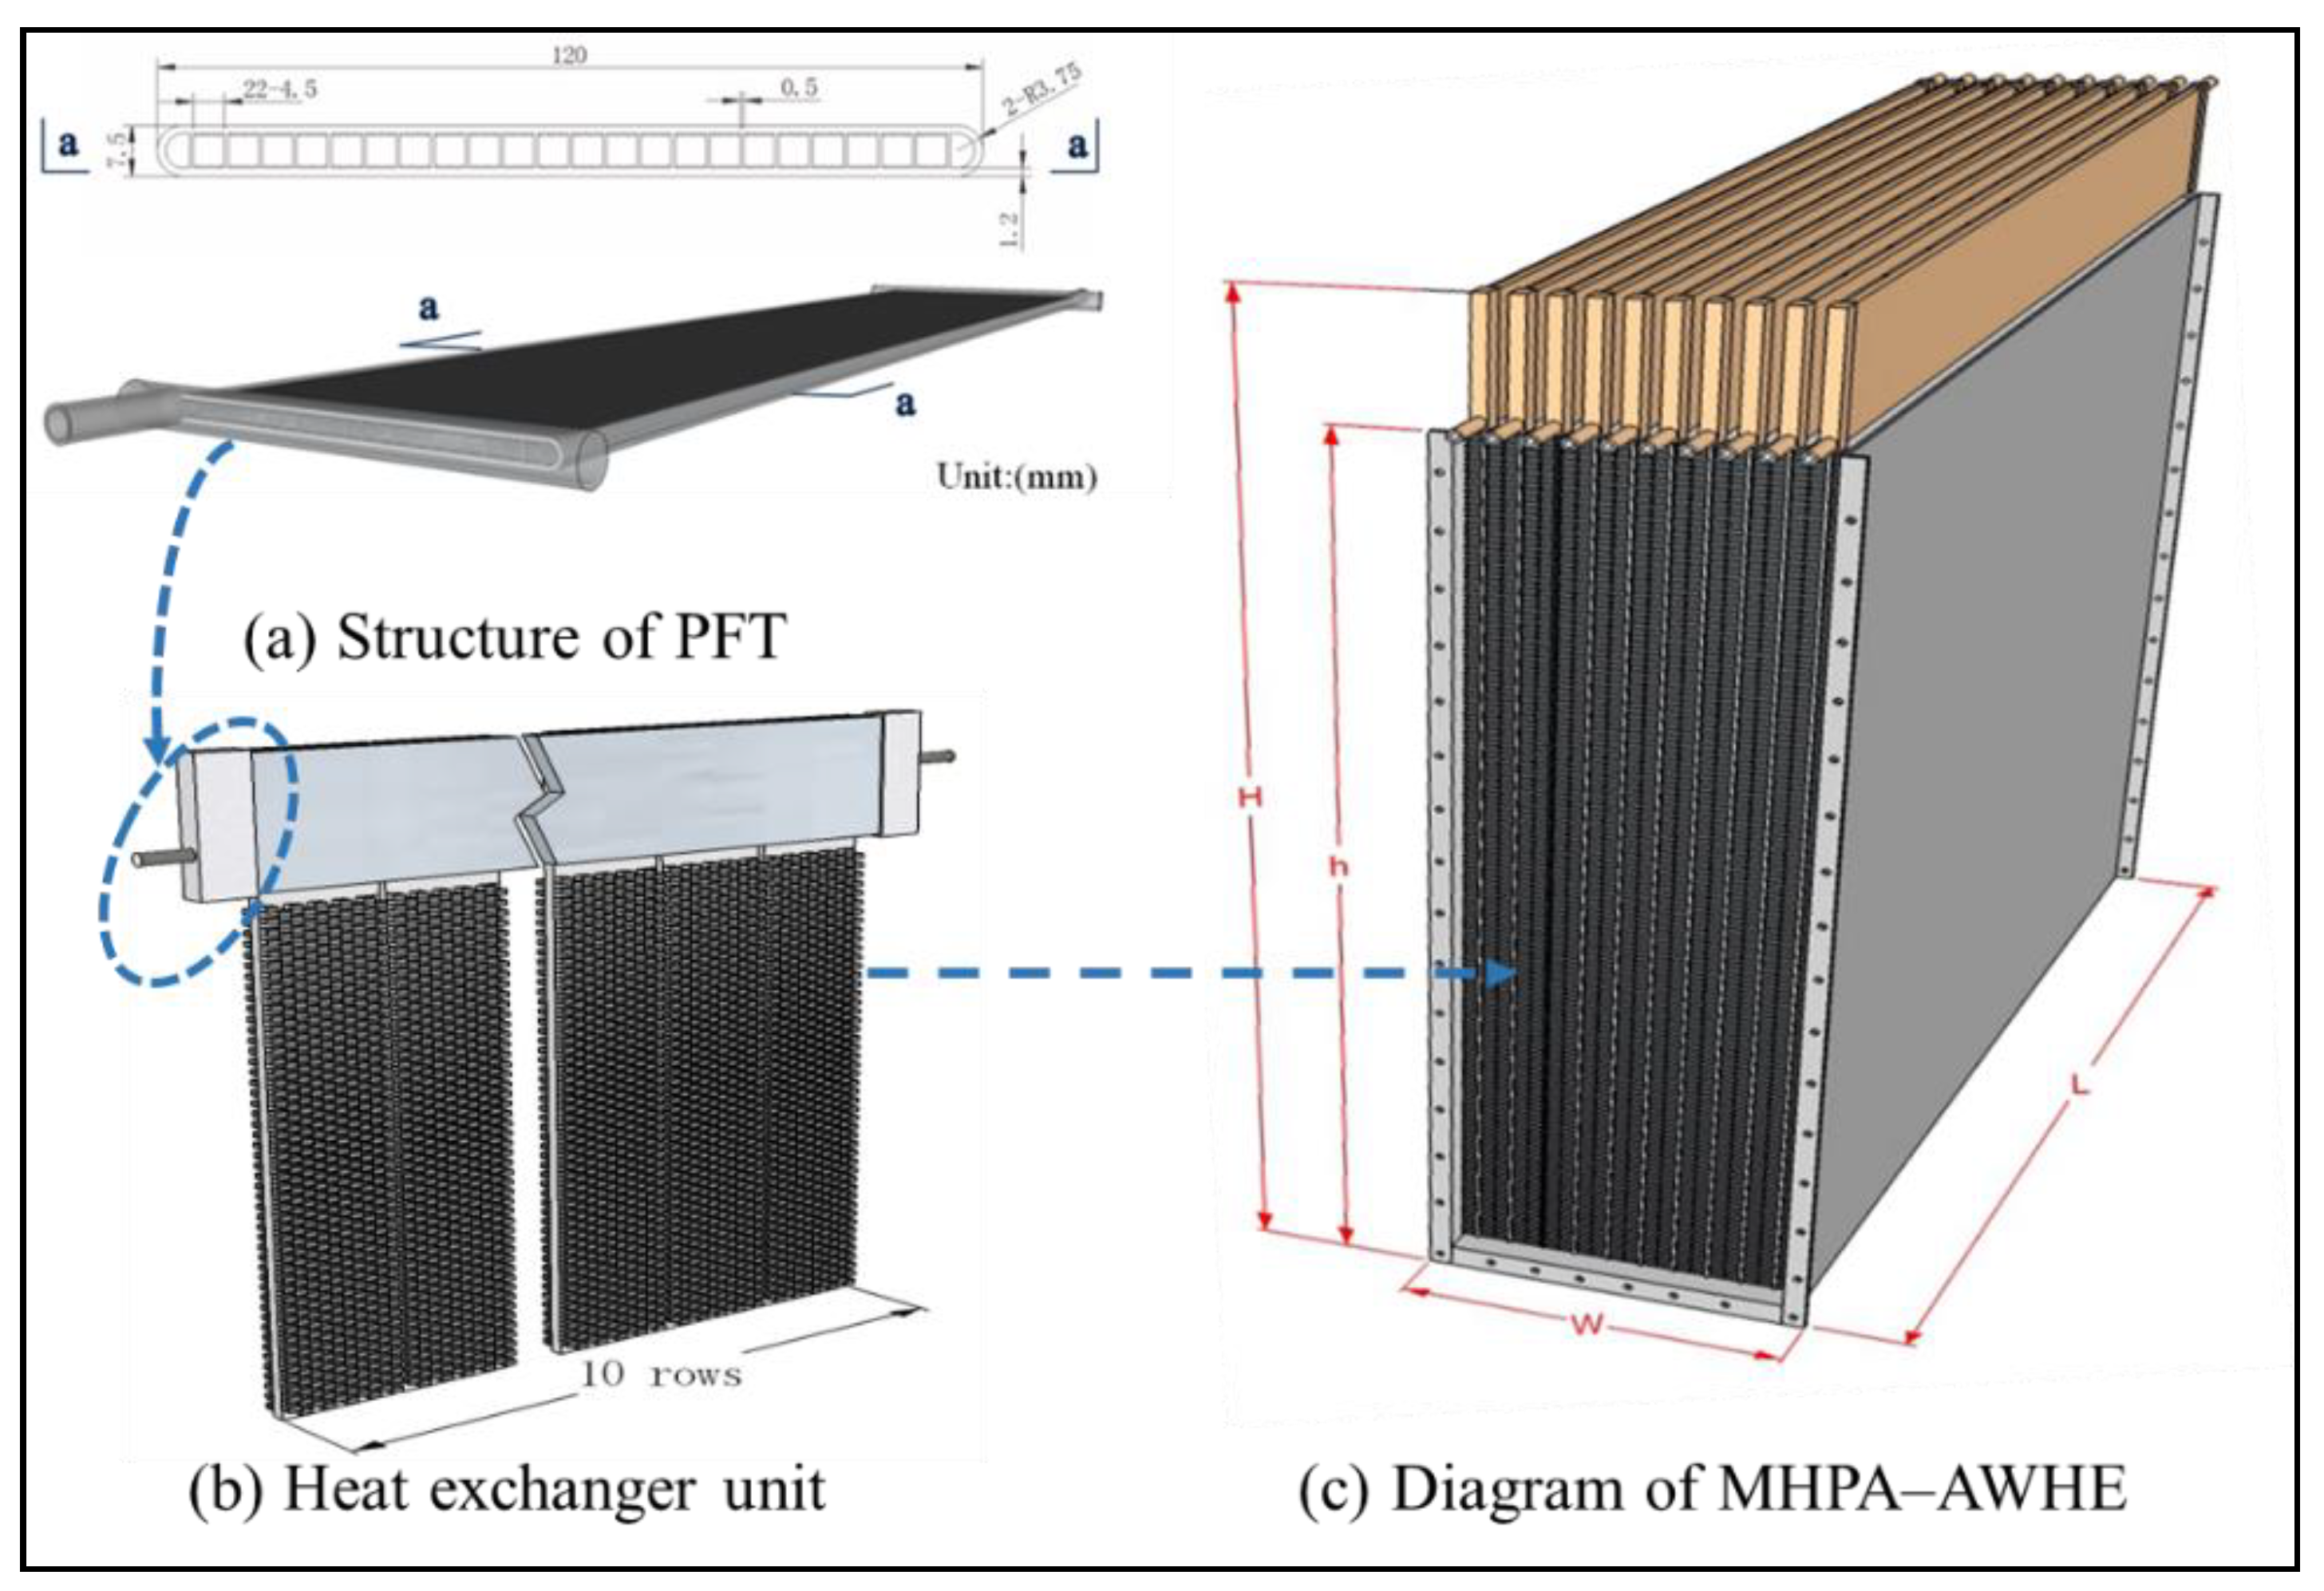
The MHPA is extruded from aluminum alloy which has a capillary microgroove structure; it has the advantages of a small size, high heat transfer efficiency and uniform temperature distribution. As shown in Figure 1, there are dozens of micro-pores, each working independently, which can transfer heat energy rapidly by a phase change of the working fluid. The width, length, and thickness of the MHPA were 80, 1000, and 3 mm, respectively. The MHPA with serrated fins on the surface was the core heat transfer component of the MHPA-AWHE. Through the conclusion on the performance of the MHPA by our research groups [33], when the filling working fluid is R141b, the filling rate is 20% and the vacuum degree is 10−5 Pa, this kind of MHPA shows the best performance according to the indoor temperature of DCs between 24–28 °C. Each core heat transfer component was divided into two parts from the bottom upwards, the evaporation section and condensation section. The length of the evaporation section, which was covered by serrated fins, was 880 mm. The condensation section of MHPA was pasted to a parallel flow tube (PFT) with a length of 120 mm. The height, width, and thickness of each serrated fin were 12, 3, and 0.2 mm, respectively. The area of the convective heat transfer of the MHPA-AWHE with serrated fins was calculated to be nine times larger than that without fins.
The parallel flow tube (PFT) consists of 22 tiny porous channels, the width, height, and thickness of each channel are 4.5, 4, and 1.2 mm, respectively, as shown in Figure 2a. The total length and width of PFT were 820 and 120 mm, respectively. The inner surface had micro groove structures to enlarge the heat transfer area.
A heat transfer unit was composed of a PFT with tiny porous channels and core components, as shown in Figure 2b. According to the theoretical calculation, the experimental heat exchanger consisted of 10 rows of heat exchanger units. The total length, width, and height of the MHPA-AWHE were 820, 330, and 1000 mm, respectively. As shown in Figure 2c. The air side corresponds to the evaporation section and the water side corresponds to the condensation section of the MHPA-AWHE.

2.2. Experimental System

2.2.1. Experimental System of MHPA-AWHE

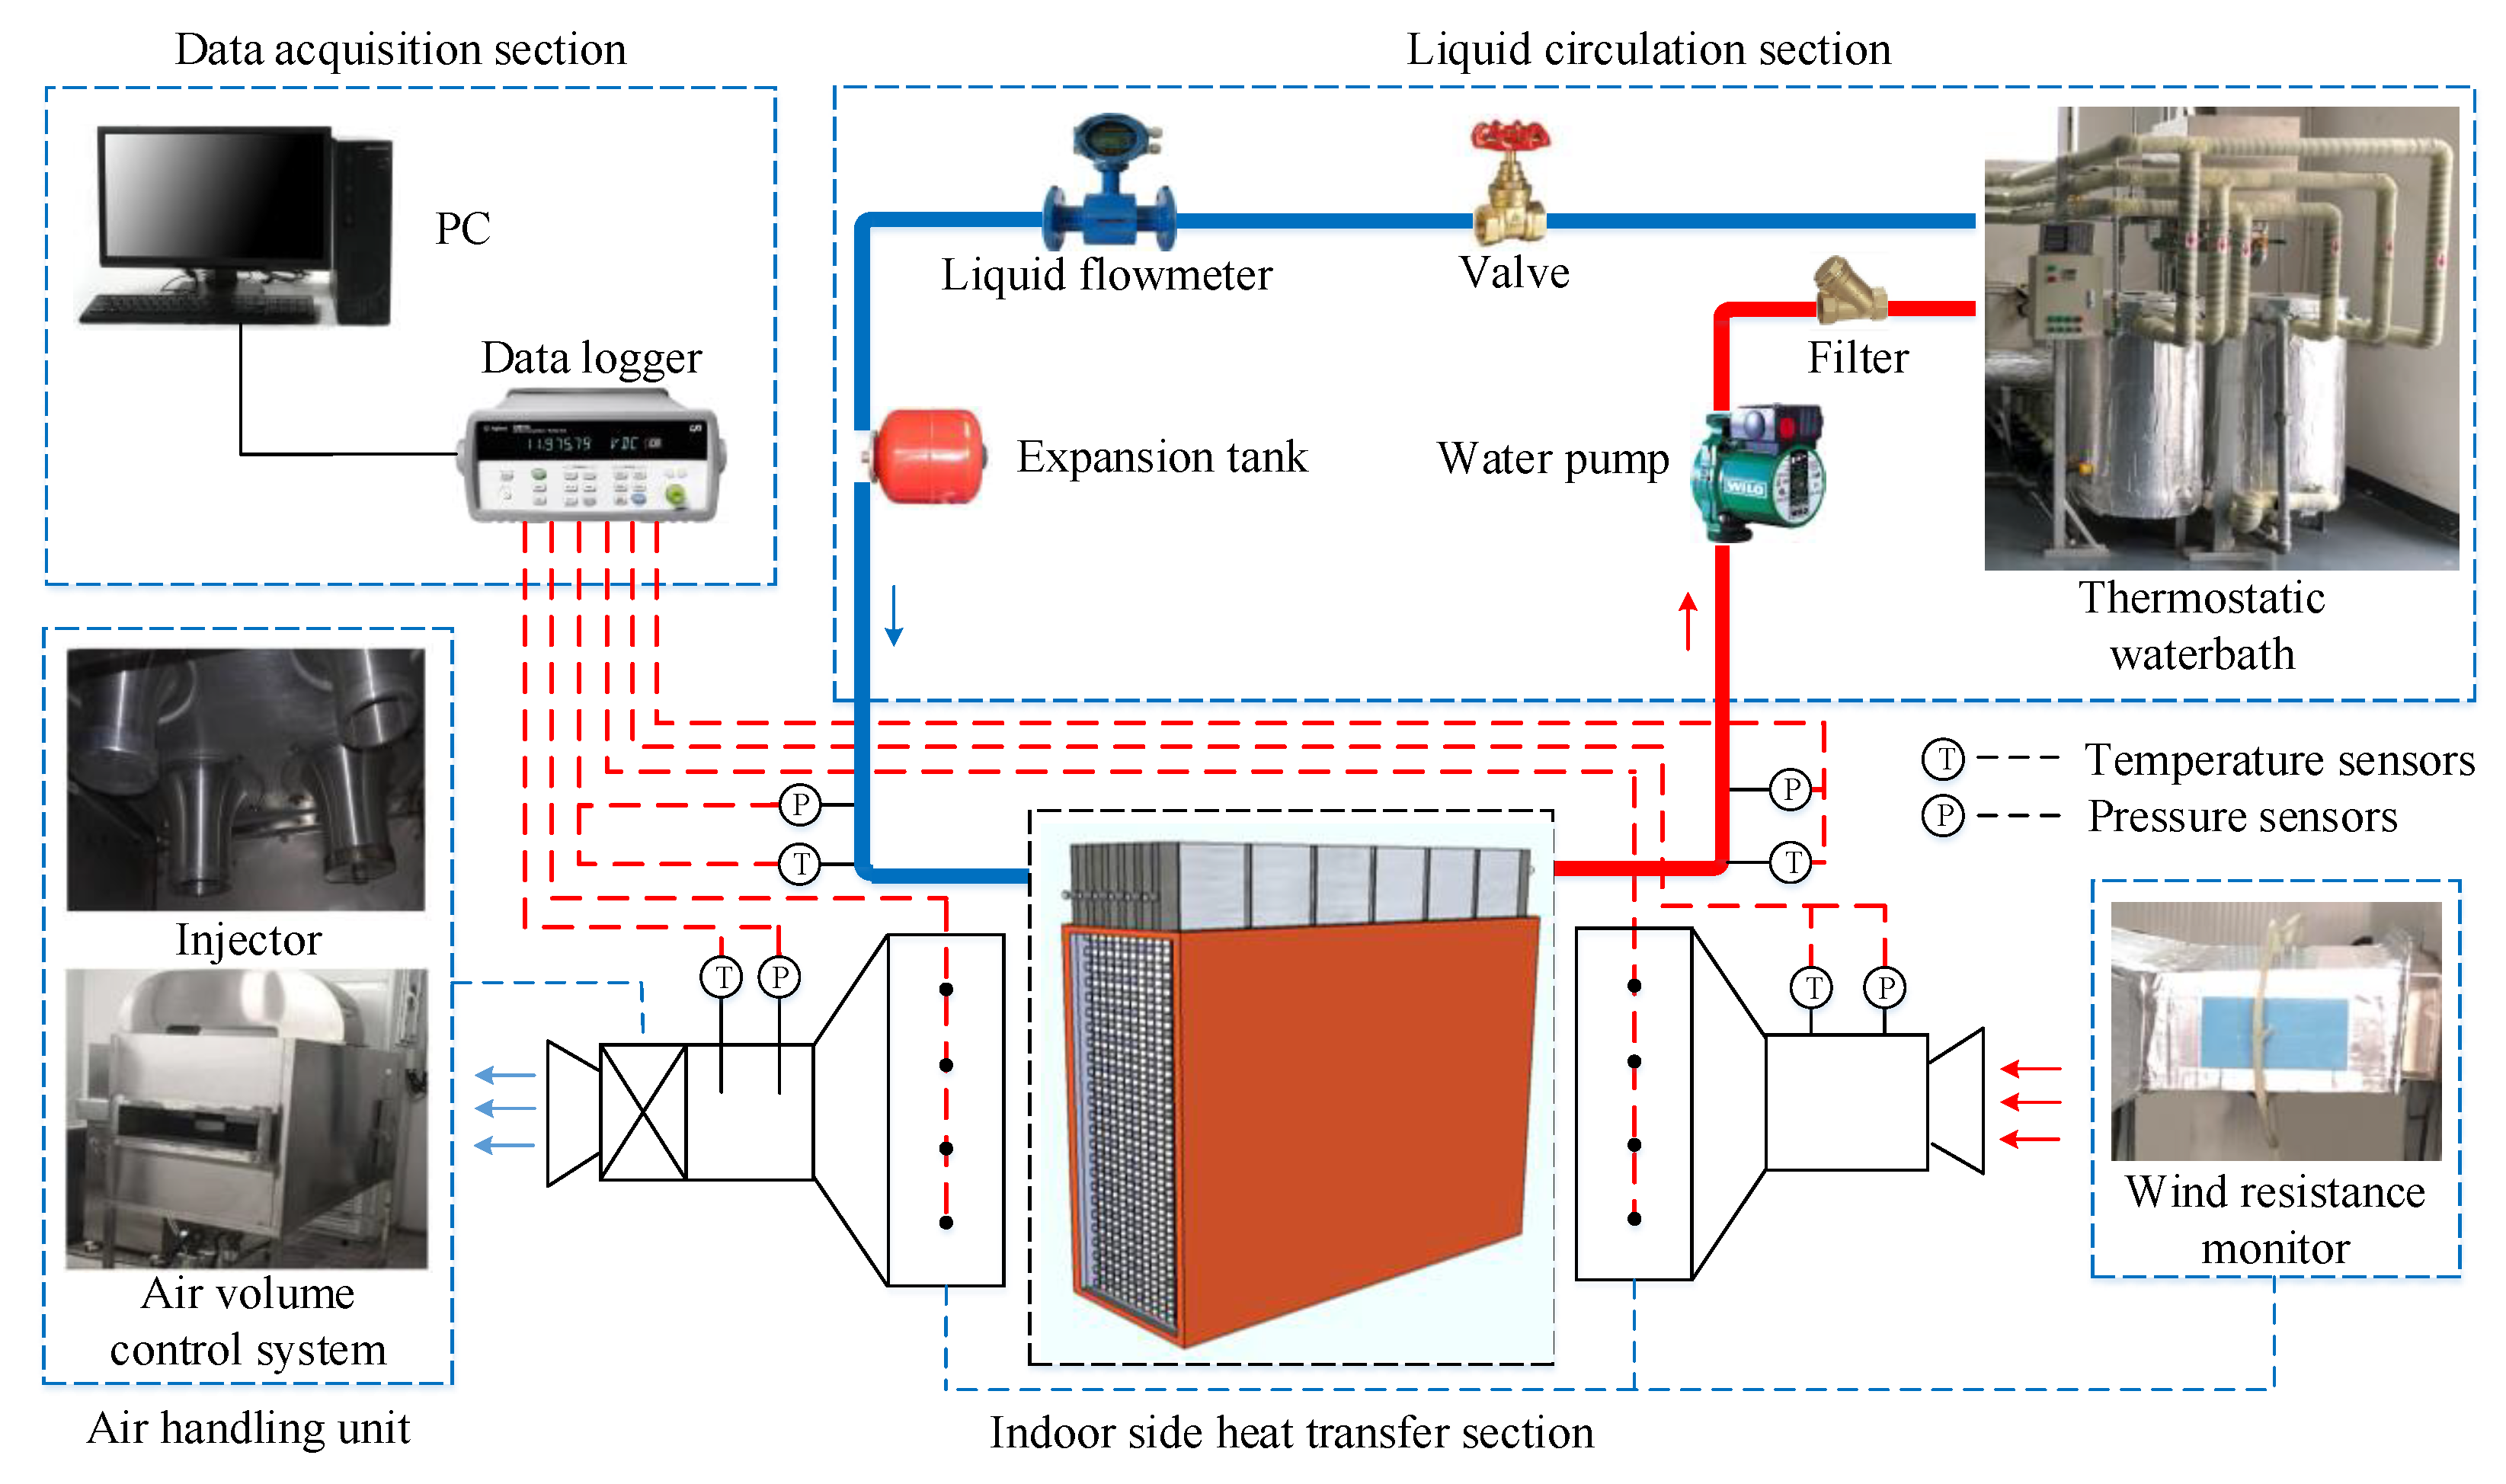
The indoor MHPA-AWHE system consisted of three parts: The heat exchanger part, the liquid cooling circulation part, and the data acquisition part, as shown in Figure 3.
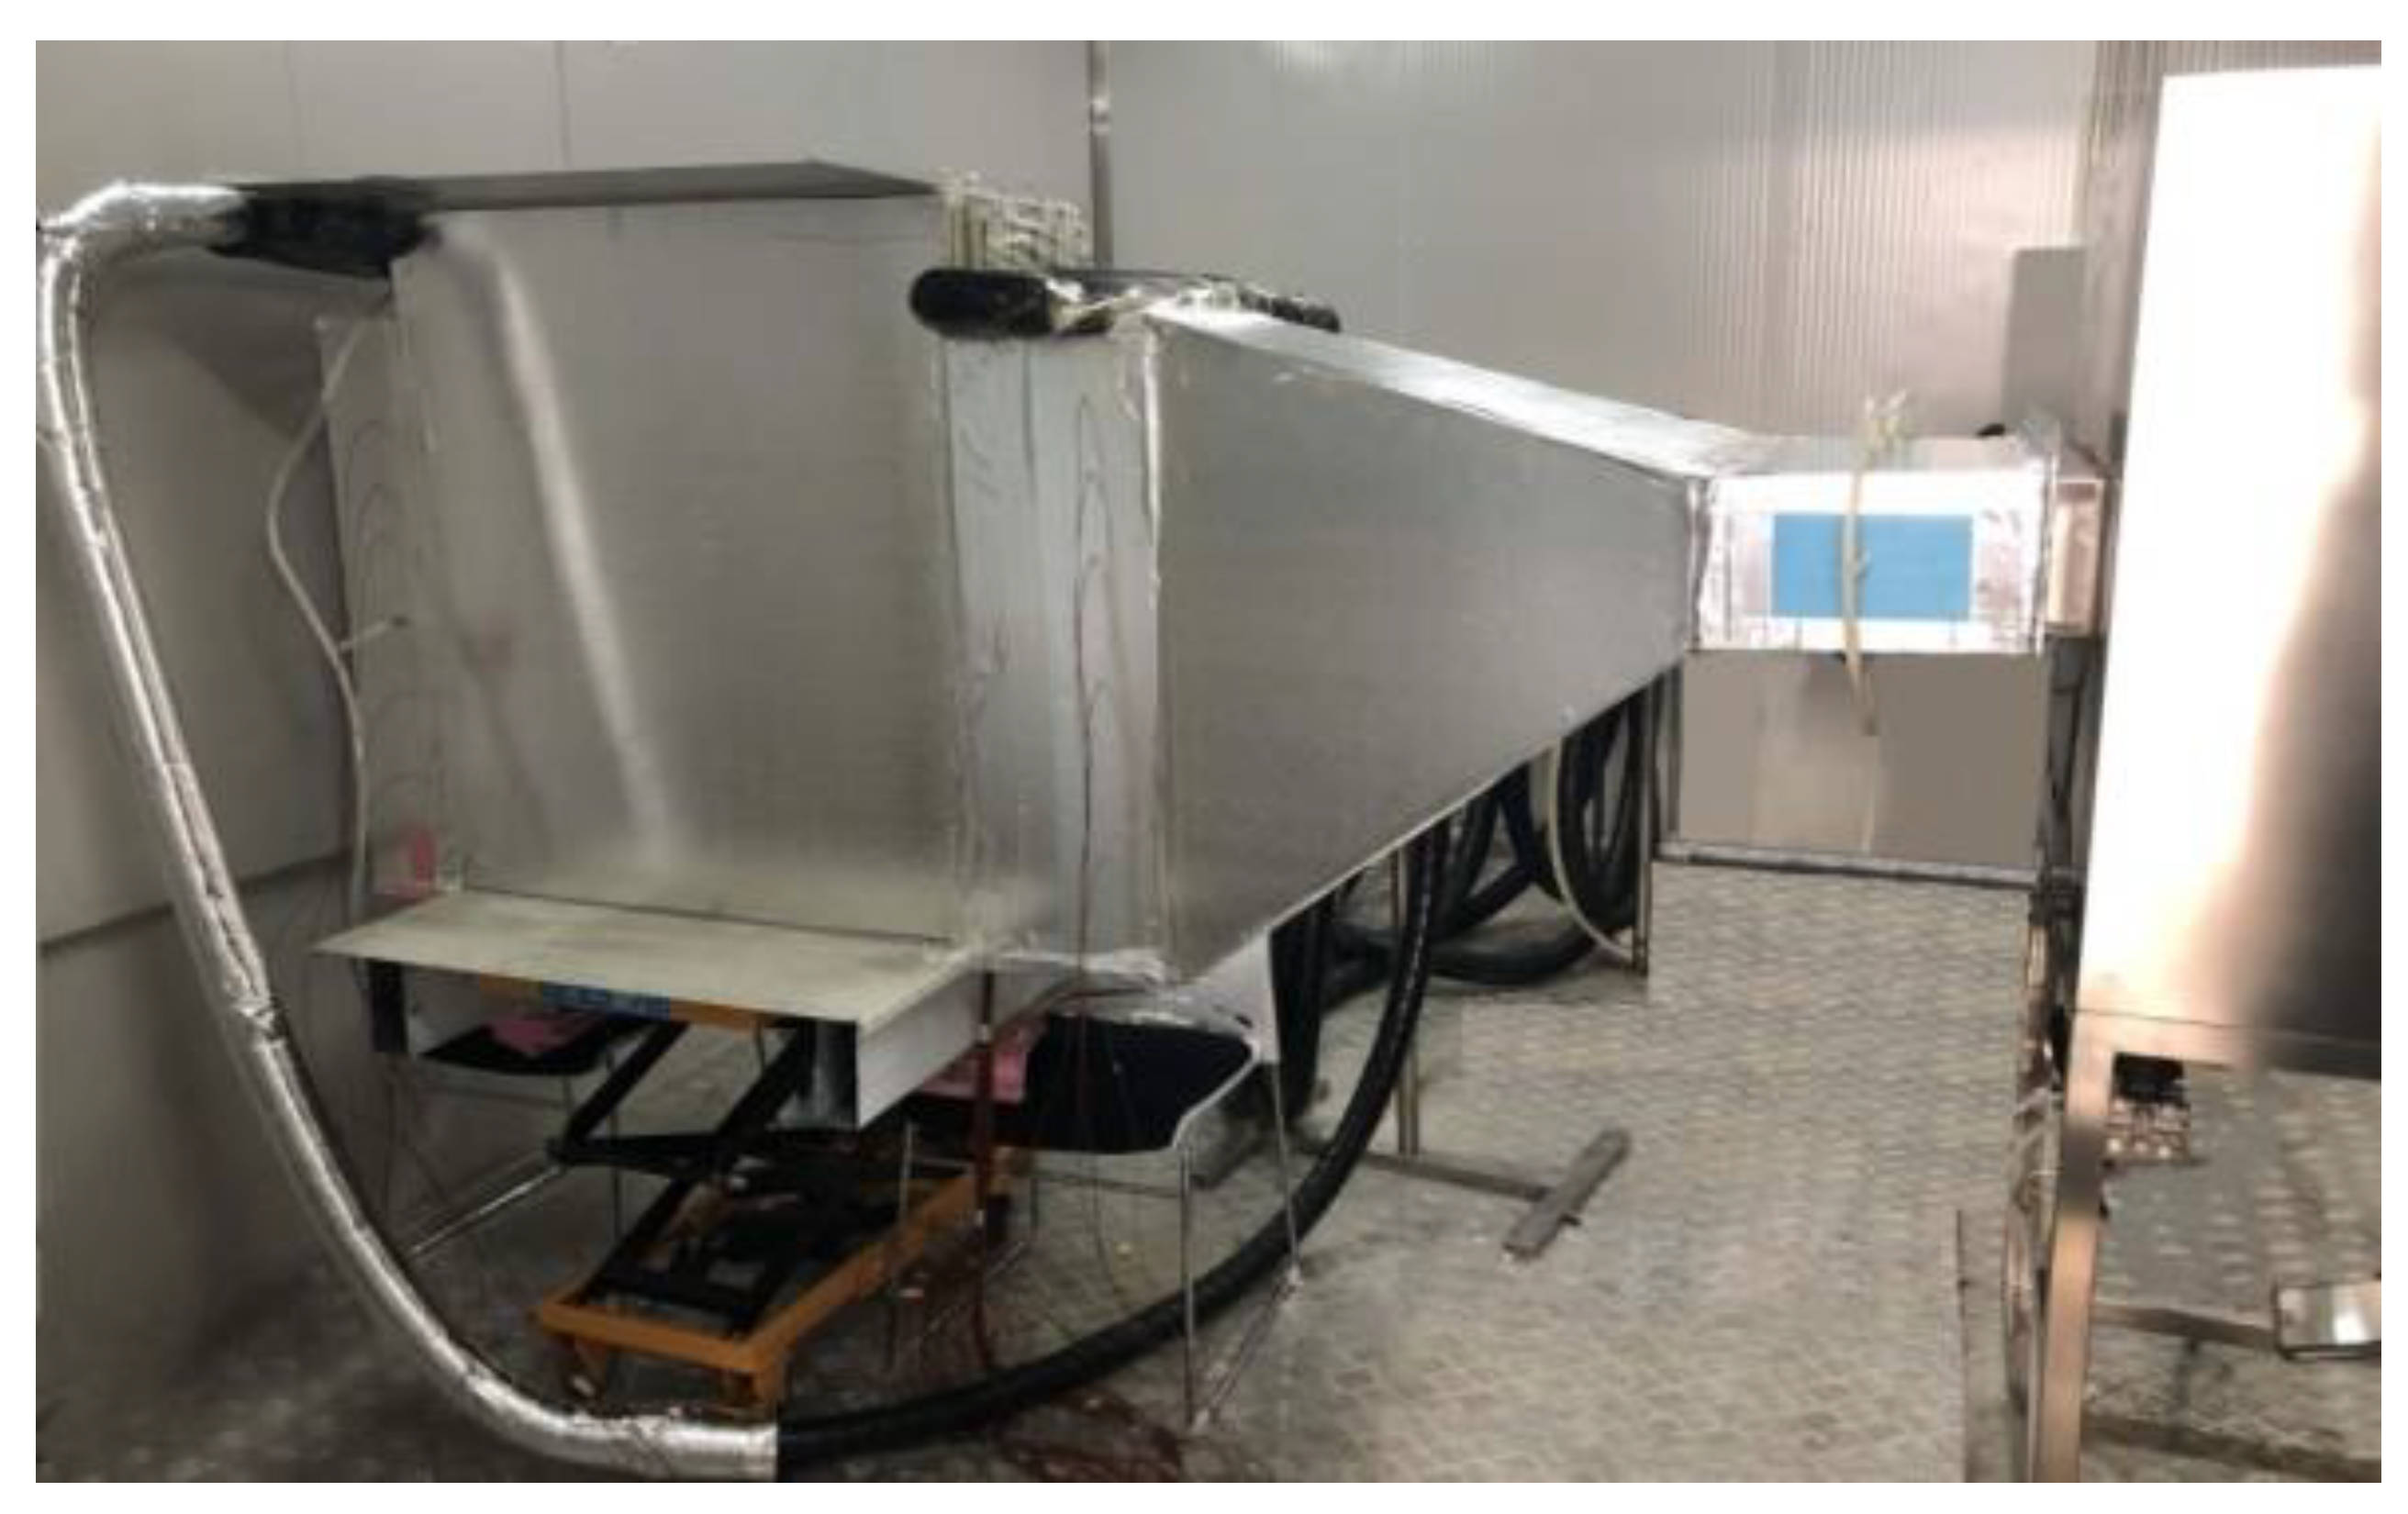
The heat exchanger section mainly consisted of the MHPA-AWHE, centrifugal fan, air handling unit and differential pressure transmitter. The fan continuously sent hot air to the heat exchanger. The core heat transfer components transferred heat energy from the evaporation section to the condensation section, and the heat energy was carried by the circulation from the PFT, as shown in Figure 4. The outdoor side can use the same type of MHPA-AWHE or a cooling tower system to achieve heat dissipation.
The liquid circulation section was mainly composed of thermostatic water equipment, a frequency conversion pump, a ball valve, a filter, and a flow meter. In this system, hot water from the MHPA-AWHE was cooled and recalculated using thermostatic water equipment by adjusting the pump frequency to regulate water flow.
The data acquisition section recorded data every 10 s using an Agilent instrument and transmitted the data to the computer for analysis. High-accuracy differential pressure transmitters were used to measure the pressure drop at the inlet and outlet positions of the air and water sides. The temperature was measured by a thermocouple and thermal resistance. The test equipment and parameters are detailed in Table 1.

2.2.2. Distribution of Temperature Measurement Points

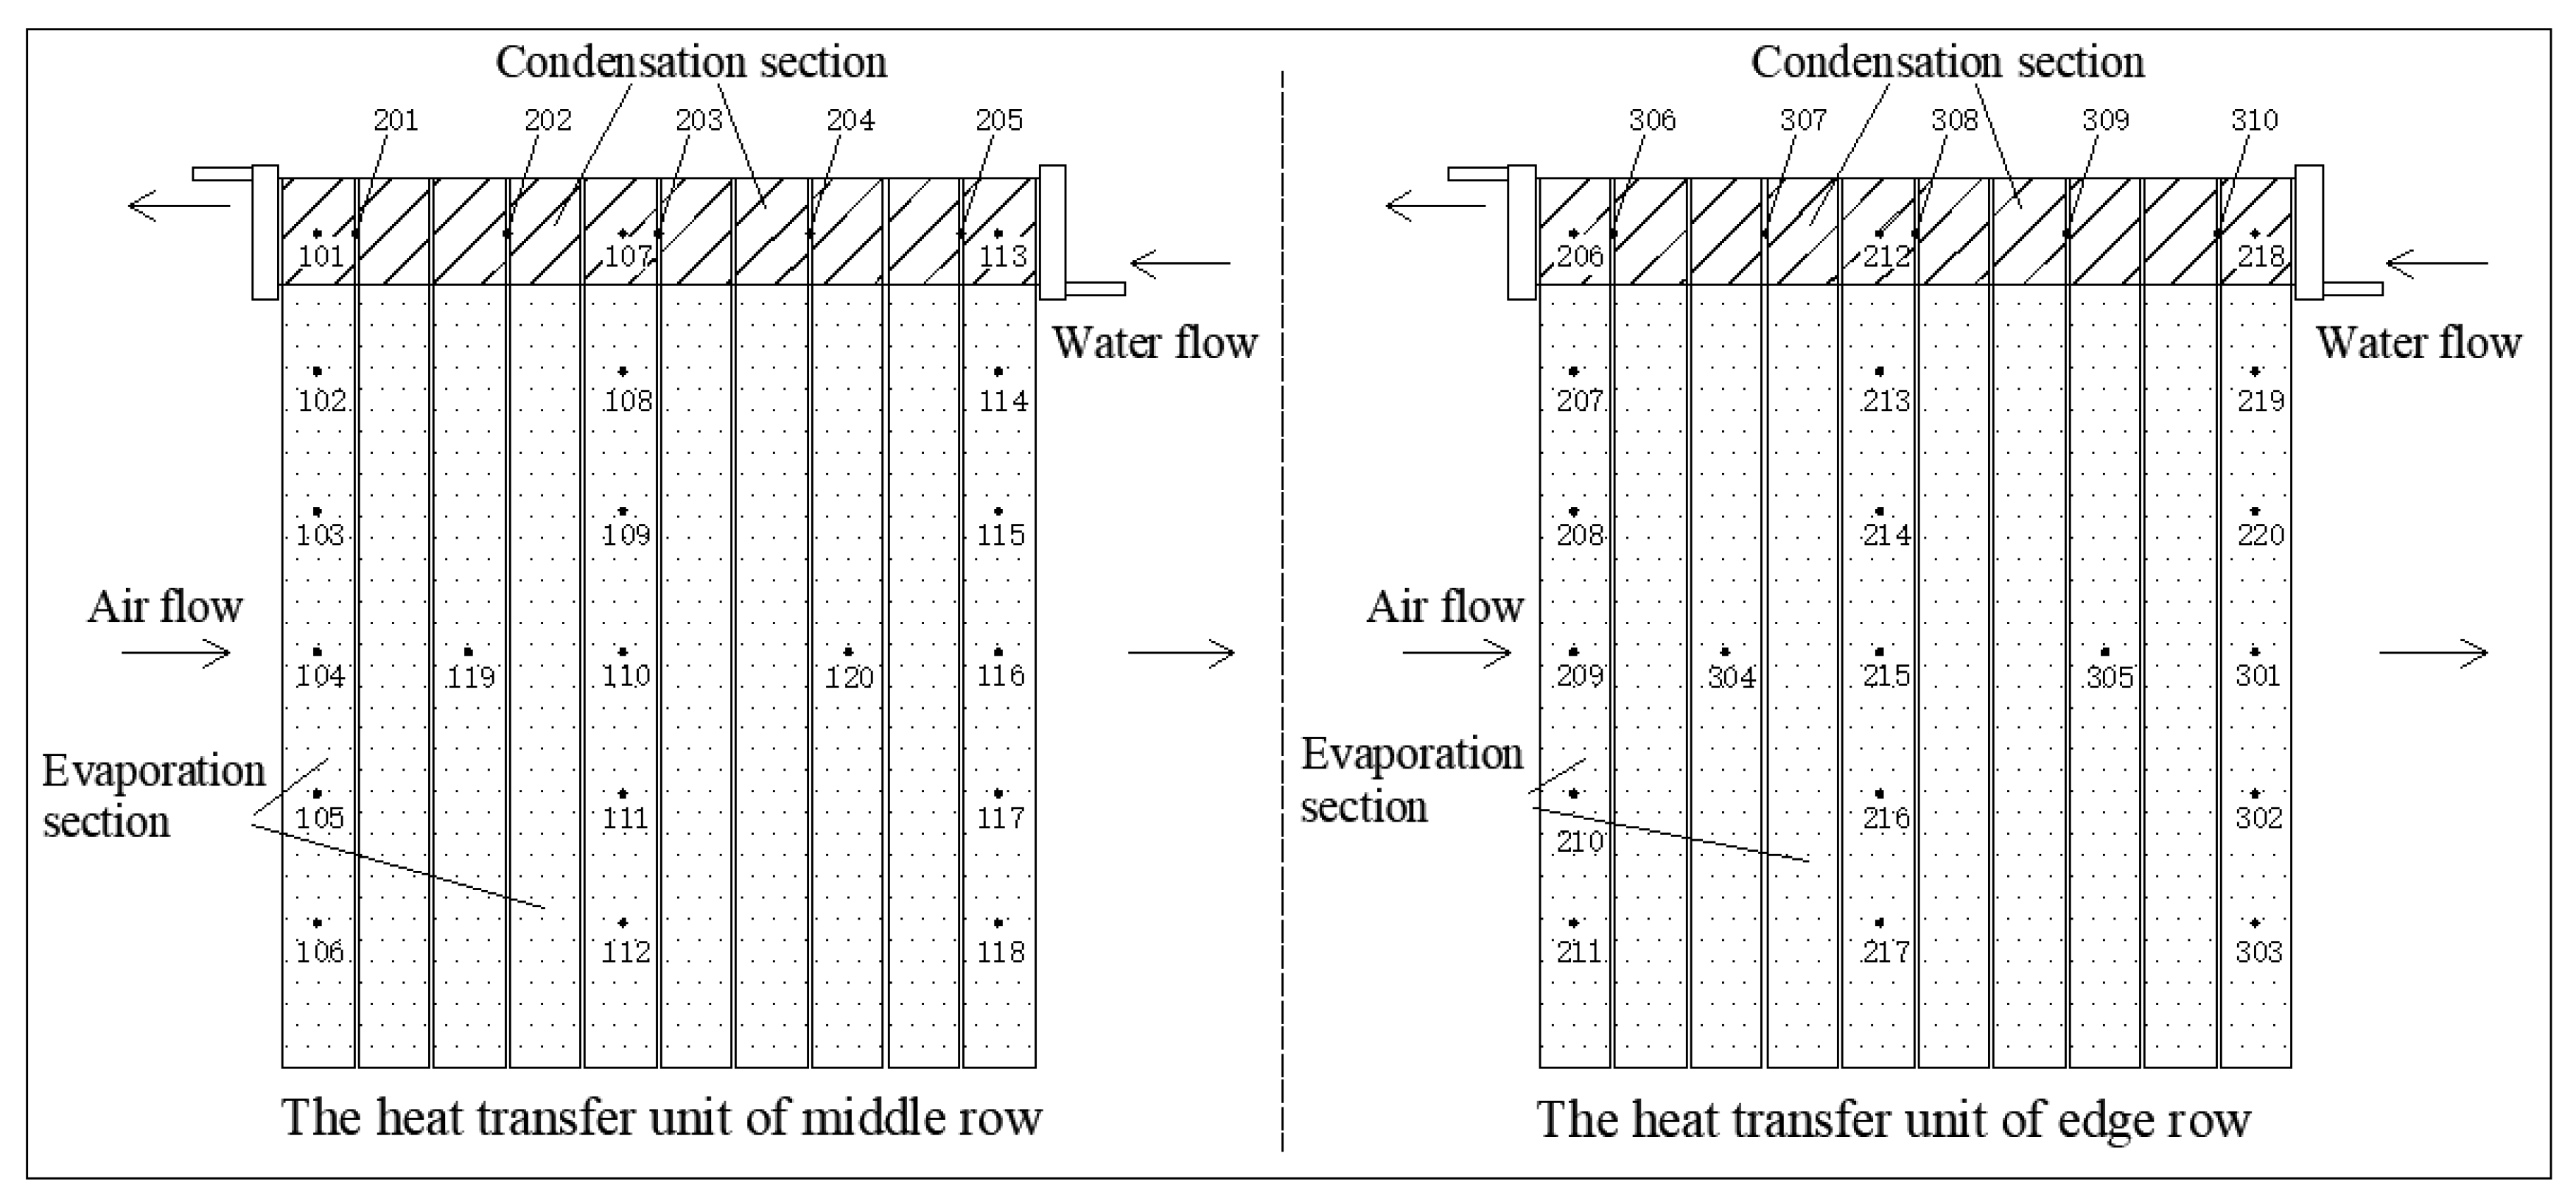
Two thermal resistors were arranged at the inlet and outlet of the main pipeline to obtain the water temperature on both sides. Three thermocouples were arranged on each side of the inlet and outlet, and the average temperature of three thermocouples were taken as the inlet and outlet temperatures of the air side.
The heat transfer units of the middle and edge rows were selected to arrange thermal resistors in the heat exchanger, as shown in Figure 5. The six MHPA components were distributed at the inlet, middle, and outlet of AWHE. Each core component had six measuring points along the vertical direction, corresponding to a total of 36 measuring points. The surface of the core components and PFT along the direction of the air flow and water flow were distributed, corresponding to a total of 24 measuring points. The temperature distribution of each component in the heat exchanger can be obtained.

2.2.3. Experimental Method

In the experiment, the inlet air temperature was kept at 28 °C, and the inlet water temperature was set at 5, 10, 15 and 20 °C. The different air flow rates were 500, 1000, 1500, 2000, 2500 and 3000 m3/h, respectively. The different water flow rates were 400, 600, 800, 1000 and 1200 L/h. The heat balance performance, heat transfer rate, heat transfer efficiency, and pressure drop of the MHPA-AWHE were experimentally analyzed and studied under the above conditions.

2.3. Evaluation Index of Heat Exchanger System

2.3.1. Heat Transfer Rate and Heat Loss Rate

The heat transfer rate is an important index used to measure the performance of a heat exchanger. However, the difference in heat transfer between air and water sides determines the accuracy of experimental data. In this study, the heat loss rate was used to measure the heat balance performance. The expressions used are as follows:
Heat transfer rate of air side:
Q a = c p a ρ a q v a ( t a , i t a , o ) .
Heat transfer rate of water side:
Q w = c p w ρ w q v w ( t w , o t w , i ) .
Heat loss rate:
β = | Q a Q w | m a x ( Q a , Q w ) .

2.3.2. Efficiency of MHPA-AWHE System

The method of heat transfer (ε-NTU) is used to reflect the ratio of the input and output of the heat exchanger to evaluate the heat transfer process. The efficiency expression of a counter-flow heat exchanger is as follows:
ε = 1 e x p [ N T U ( 1 C m i n C m a x ) ] 1 C m i n C m a x e x p [ N T U ( 1 C m i n C m a x ) ] ,
where N T U = K A C m i n is the number of heat transfer units, C a = c p a ρ a q v a is the specific heat capacity of the air side, C w = c p w ρ w q v w is the specific heat capacity of the water side, and Cmax and Cmin represent the maximum and minimum values, respectively.

2.3.3. Heat Flux and Thermal Conductivity of Core Components

According to the heat transfer rate and the effective heat conduction area of core components, the expression for the heat flux is as follows:
F e c = Q e c A s , e c .
The heat transfer process of the core components was regarded as an equivalent heat conduction process, and the equivalent thermal conductivity is as follows:
λ = Q e c δ e c A s , e c ( t e t c ) .

2.3.4. Heat Transfer Process of MHPA-AWHE

The heat transfer process of the MHPA-AWHE is divided into five processes, and the diagram of the heat transfer process is shown in Figure 6.
Part 1 is a heat convection process between the air and the evaporation section of the core components. Part 2 is an equivalent heat conduction process from the evaporation section to the condensation section of the core components. Part 3 is the contact heat conduction process between the condensation section of the core components and the outer surface of the PFT. Part 4 is the heat conduction process from the outer surface to the inner surface of the PFT. Part 5 is a heat convection process between the inner surface of the PFT and water. The heat resistances are represented by Ra, Rec, Rr, Rp, Rw, respectively, and the heat transfer rate is calculated as follows:
Q = h a A a ( t a t e ) ,
      Q = λ e c δ e c A s , e c ( t e t c ) ,
      Q = λ p δ p A p ( t p , o u t t p , i n ) ,
Q = h w A w ( t p , i n t w ) .
Figure 7 shows the temperature position more clearly for each component of the heat transfer unit.

2.3.5. Comprehensive Performance Evaluation Index (j/f1/2)

Factor j represents the convective heat transfer performance and factor f represents flow resistance [36]. Because the friction factor f is proportional to the square of the velocity in most cases, and the heat transfer factor j is linearly related to the velocity, to qualitatively judge whether the increase in the heat transfer rate is greater than the increase of resistance under the same dimension, j/f1/2 is used as an evaluation index of comprehensive performance. This index, which is practical and objective, is expressed as follows:
j = h a ρ a v a c p a P r a 2 / 3 ,
f = D P a 2 l ρ a v a 2 .

2.3.6. Energy Saving Evaluation Indexes

Cooling capacity, EER and payback period of equipment investment were evaluated. Referring to the relevant literature [37], the fitting curve of the system EER1 under different environment temperatures of standard AC in DCs before the transformation is obtained as follows:
E E R 1 = 4.73 0.0031 t e n 0.00114 t e n 2 .
According to the different ambient temperatures, it is necessary to match the different number of MHPA-AWHE modules; meanwhile, the operation mode of the MHPA-AWHE system and the AC system need to meet the requirement of the cooling load. The comprehensive EER2 of DCs after the transformation is as follows:
E E R 2 = Q 0 N ( P f a n + P p u m p ) + P A C .
The initial investment (I) of the MHPA-AWHE system includes fans, pumps and MHPA-AWHEs, and the commercial electricity price (α) is set to 0.85 RMB/kWh. The payback period of the MHPA-AWHE system (Y) is calculated as follows:
Y = N ( I f a n + I p u m p + I M H P A A W H E ) ( B 1 B 2 ) α .

2.4. Uncertainty Analysis

Inevitable errors that occur in the experimental results, which are attributed to the low accuracy of the experimental instruments, are called systematic errors. In this study, error transfer formulas were used to calculate the errors of the indirect measurement data. If an indirect measure y is a function of many independent direct measurements x1, x2, x3, …, xn, the standard uncertainty of y can be calculated as follows:
δ y = [ ( y x 1 δ x 1 ) 2 + ( y x 2 δ x 2 ) 2 + + ( y x n δ x n ) 2 ] 1 2 .
According to error transfer formula, the relative uncertainties of main parameter variables in the experiment are analyzed, and the results are shown in Table 2.

3. Results and Discussion

3.1. Thermal Performance of MHPA-AWHE

3.1.1. Thermal Balance Performance of MHPA-AWHE

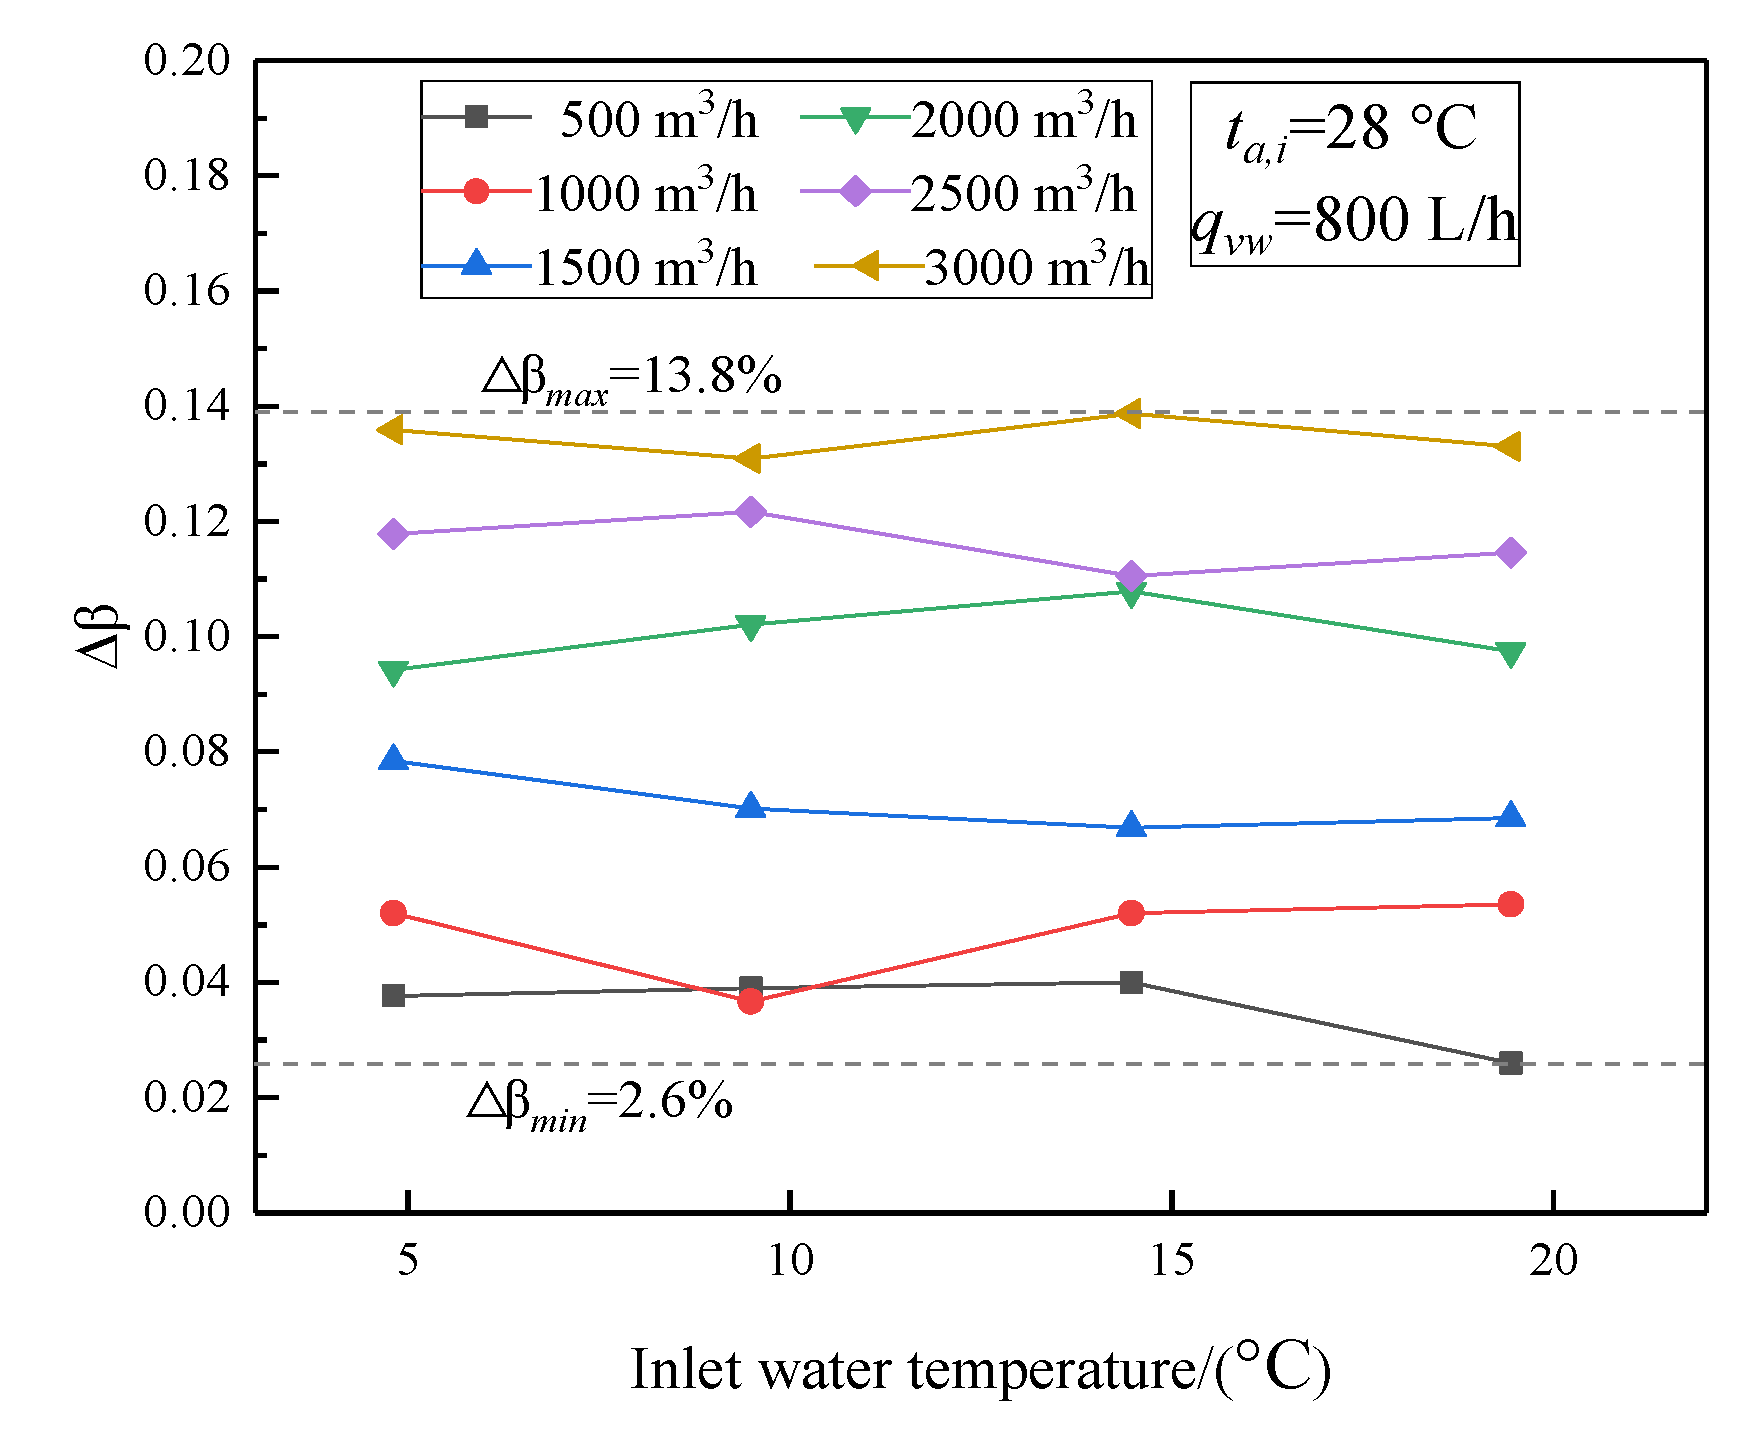
By changing the flow rate on the air and water sides, the heat losses for different inlet water temperatures were analyzed. As shown in Figure 8, when the water flow rate was 800 L/h, with the increase of the air flow rate, the heat loss rate increased gradually from 2.6% to 13.8%. Because the surface area of the duct was relatively large the cold air permeability increased gradually, and the heat loss increased correspondingly. As shown in Figure 9, the maximum heat loss rate was 10.2%, and because of the simple connection and better insulation of the water pipe, the water flow rate had a slight effect on the heat loss rate. However, the heat loss rate exhibited no evident change with the increase of the inlet water temperature. Therefore, the heat loss rate of the MHPA-AWHE was mainly influenced by the air flow rate. The heat loss rate was kept within 14% throughout the experiment.

3.1.2. Heat Transfer Rate for Different Flow Rates and Inlet Water Temperatures

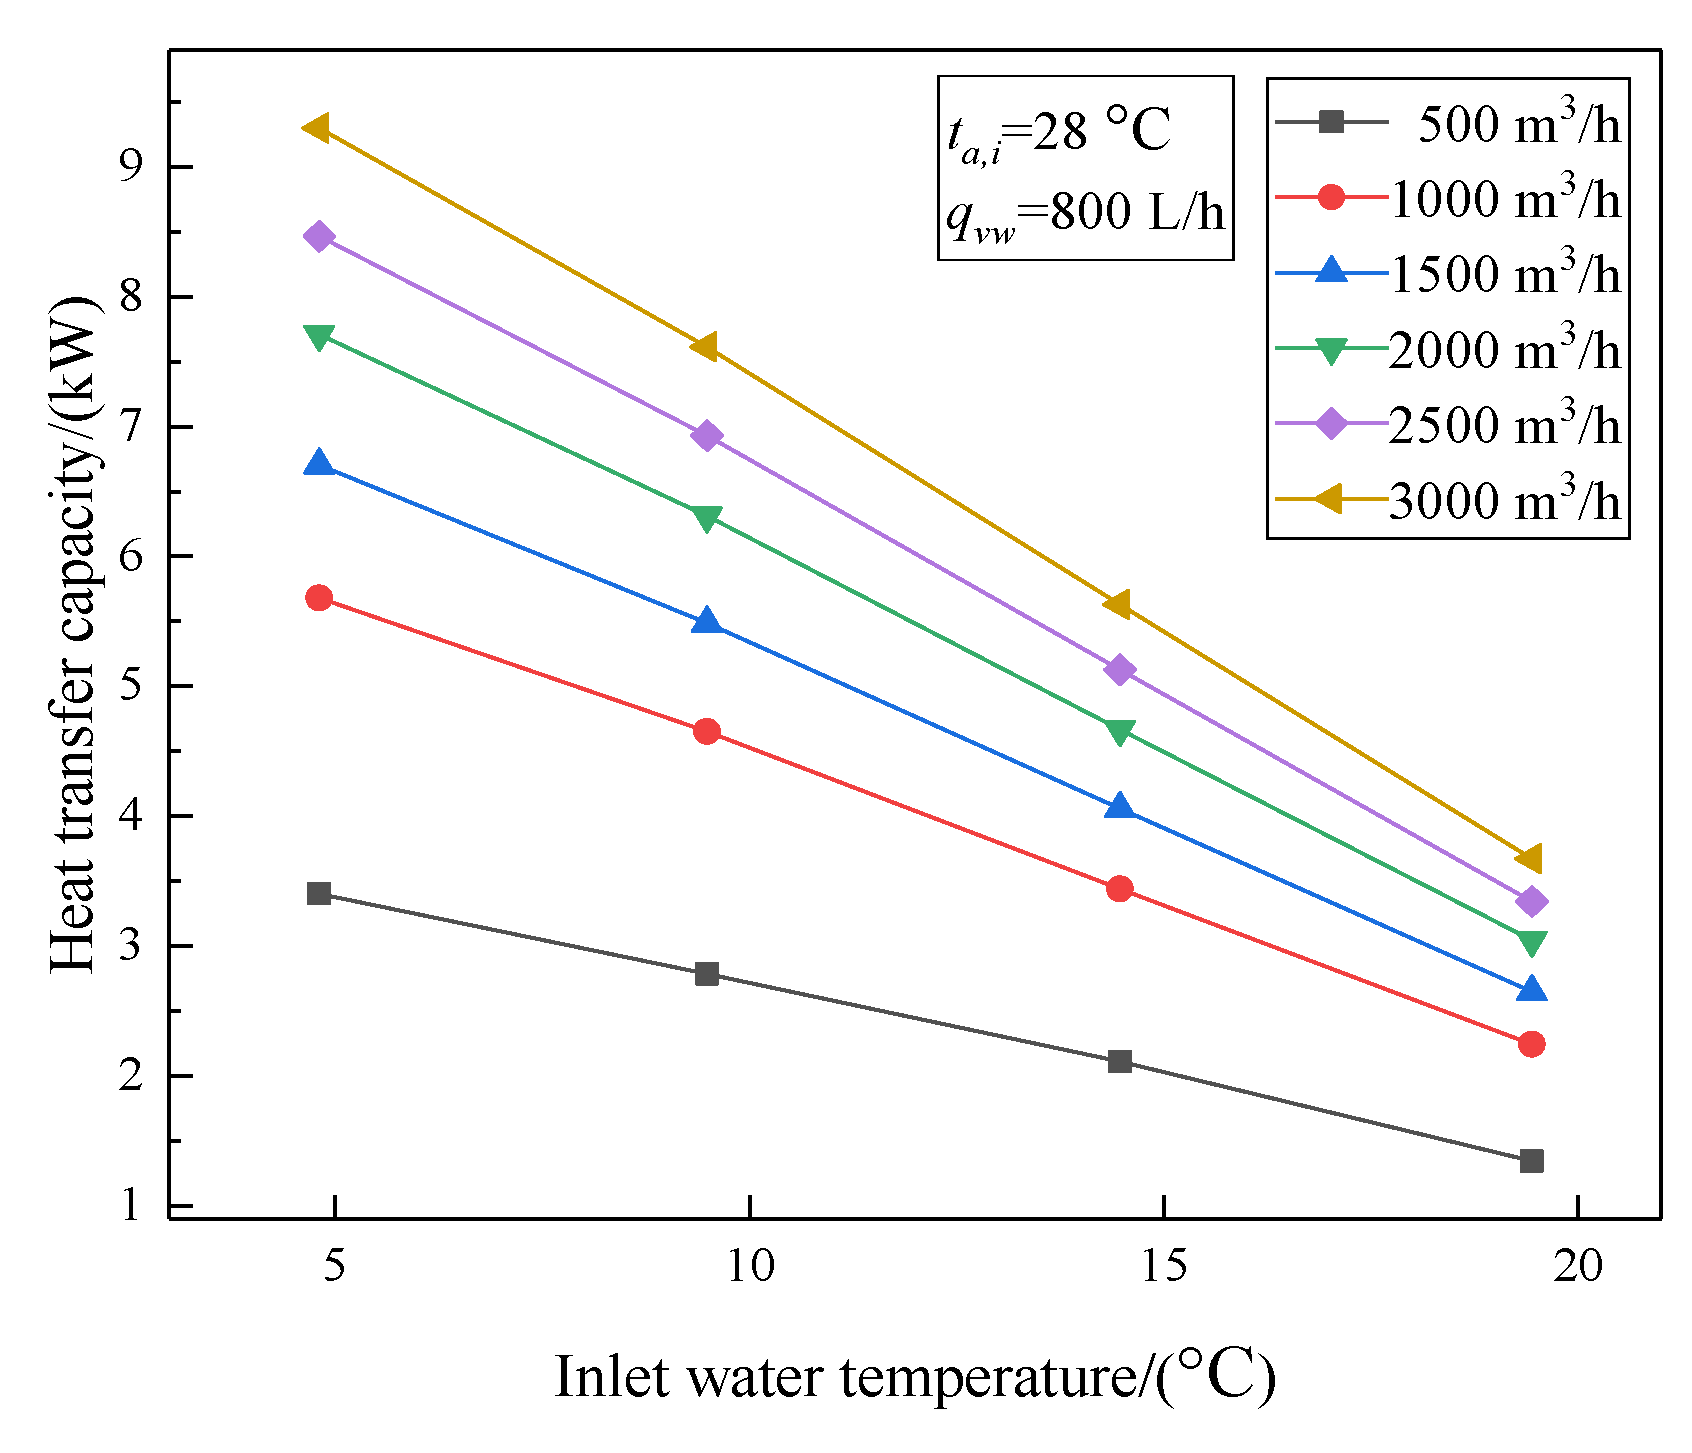
The quantity and efficiency of heat transfer with the inlet water temperature under different air flow rates were studied. As shown in Figure 10, the water flow rate was maintained at 800 L/h. With the increase of inlet water temperature, the temperature difference between the air and water sides decreased. The heat transfer rate decreased linearly for different air flow rates. When the air low rate was 3000 m3/h and the inlet water temperature was 5 °C, the maximum heat transfer rate was 9.29 kW. Meanwhile, with the increase of inlet water temperature, the larger the air flow rate was, the faster the heat transfer rate decreased.
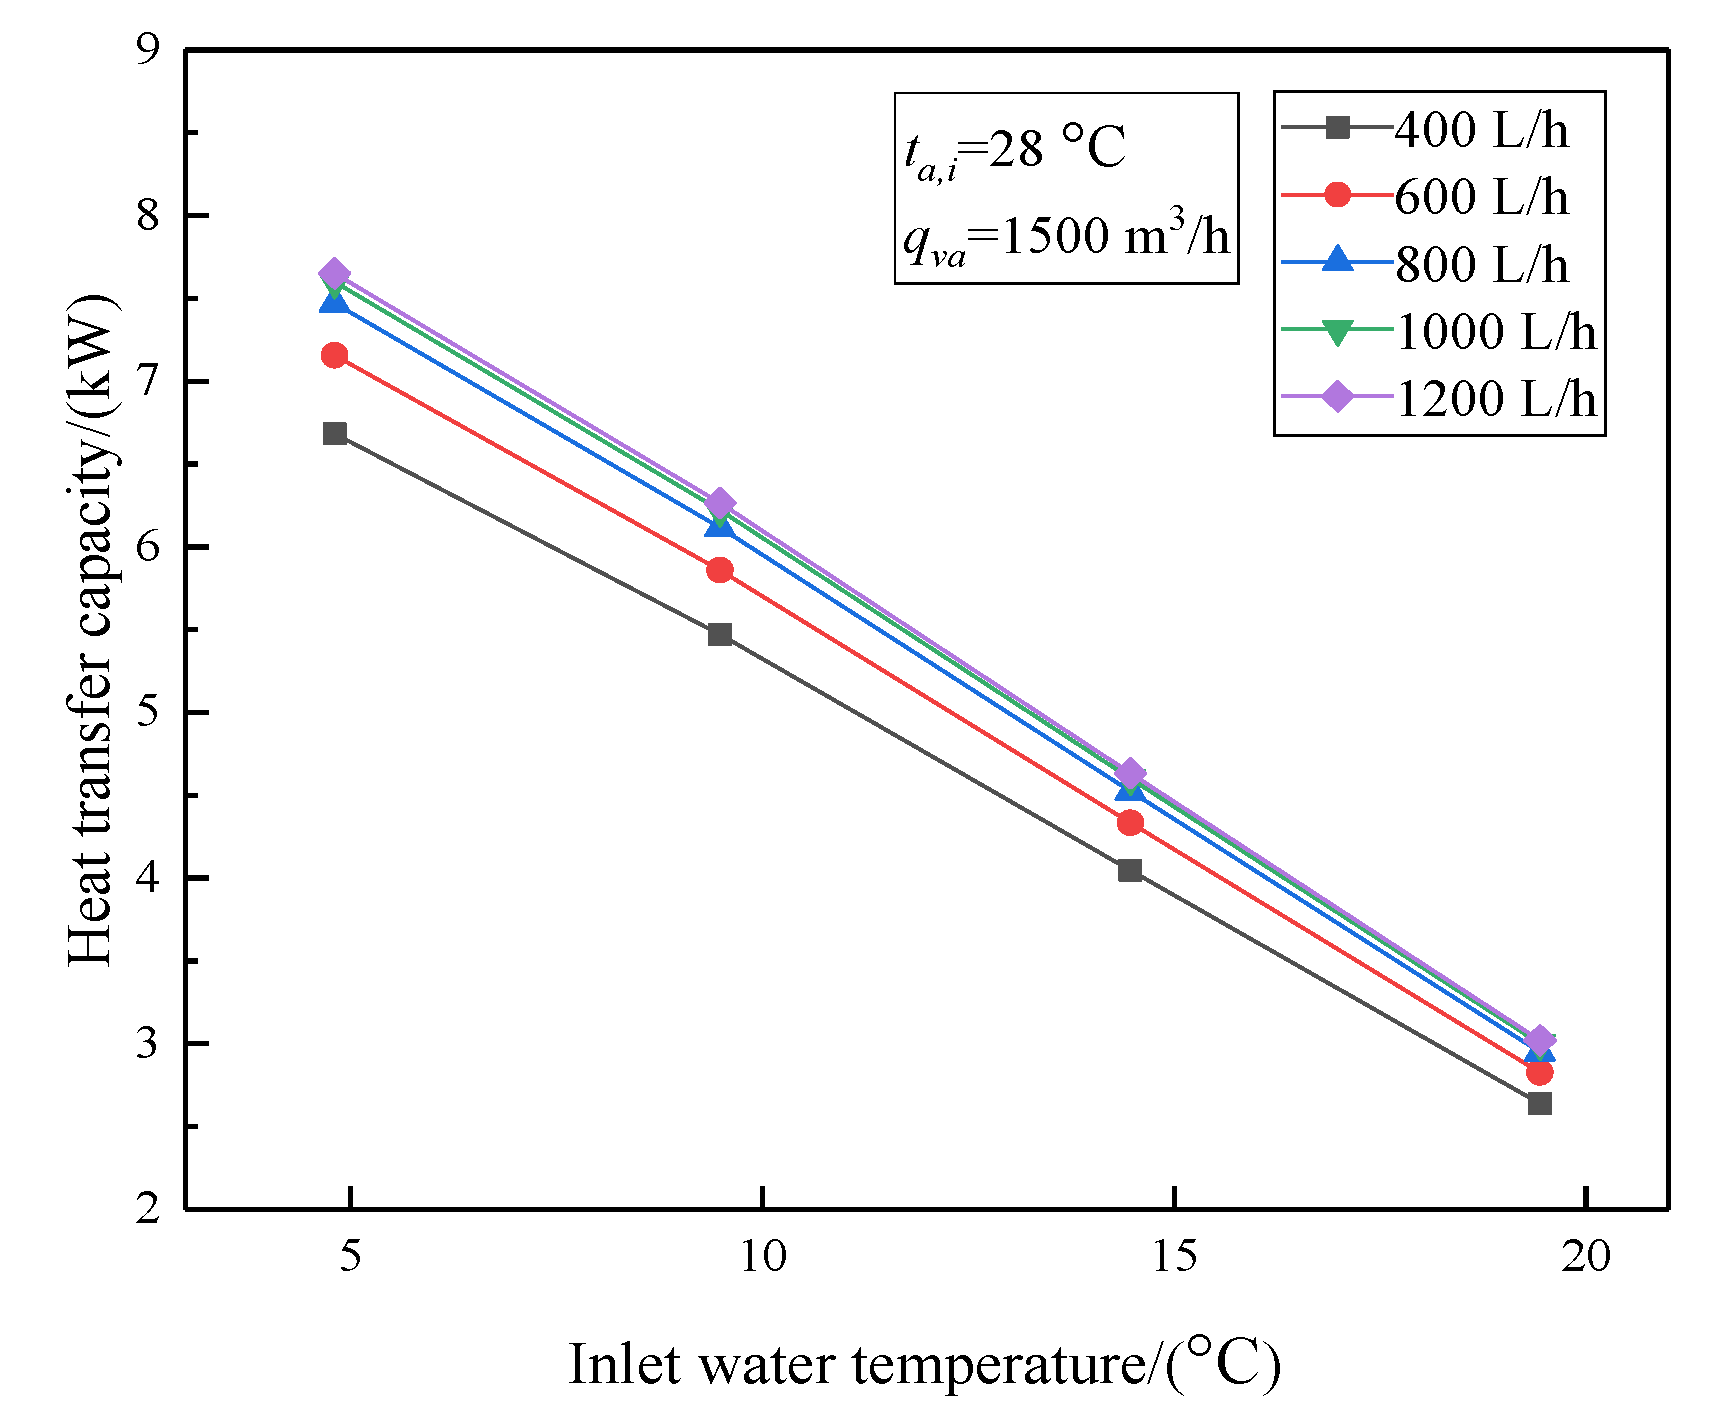
Figure 11 showed the variation of heat transfer rate with the inlet water temperature for different water flow rates with the increase of inlet water temperature, and when the inlet water temperature increased from 5 to 20 °C, the heat transfer rate decreased linearly from 7.65 to 3.02 kW. However, the heat transfer rate increased slightly with the increase of water flow rate under the same inlet water temperature, and the rate of growth decreased.
To analyze the influence of the flow rate on the heat transfer performance of the MHPA-AWHE more intuitively, Figure 12 and Figure 13 show the variation of heat transfer rate. When the inlet water temperature was 5 °C and the air flow rate was less than 500 m3/h, the serrated fins produce fewer disturbances to the air flow, the heat transfer rate remained unchanged at about 3.31 kW, and the corresponding convective heat transfer coefficient was below 35 W/(m2·K). As the air flow rate increased from 500 to 1000 m3/h, the quantity of heat transfer increased quickly and there was a maximum slope1 at this stage, and because the air flow disturbance was enhanced by the serrated fins, the quantity of heat transfer increased to 5.68 kW, which was 70% higher than that of 500 m3/h, and at the same time the convective heat transfer coefficient increased significantly from 35.1 to 53.1 W/(m2·K). As the air flow rate increased to 3000 m3/h, the growth trend of the convective heat transfer coefficient slowed down as shown by slope2. The maximum convective heat transfer coefficient was 78.8 W/(m2·K) when the air volume was 3000 m3/h.
As shown in Figure 13, when the air flow rate was maintained at 1500 m3/h, the heat transfer rate exhibited the same trend for different air flow rates. As the water flow rate increased from 400 to 1200 L/h, the heat transfer rate increased slightly and gradually, because the average Re was 201 during this experiment. This was less than the critical Reynolds number (Re = 2300) for the flow in the tube, and the flow was a typical laminar flow. When the inlet water temperature was 5 °C, the convective heat transfer coefficient fluctuated between 472 and 531 W/(m2·K), The results showed that the air flow rate was the main factor affecting the performance of the MHPA-AWHE.

3.1.3. Efficiency of MHPA-AWHE

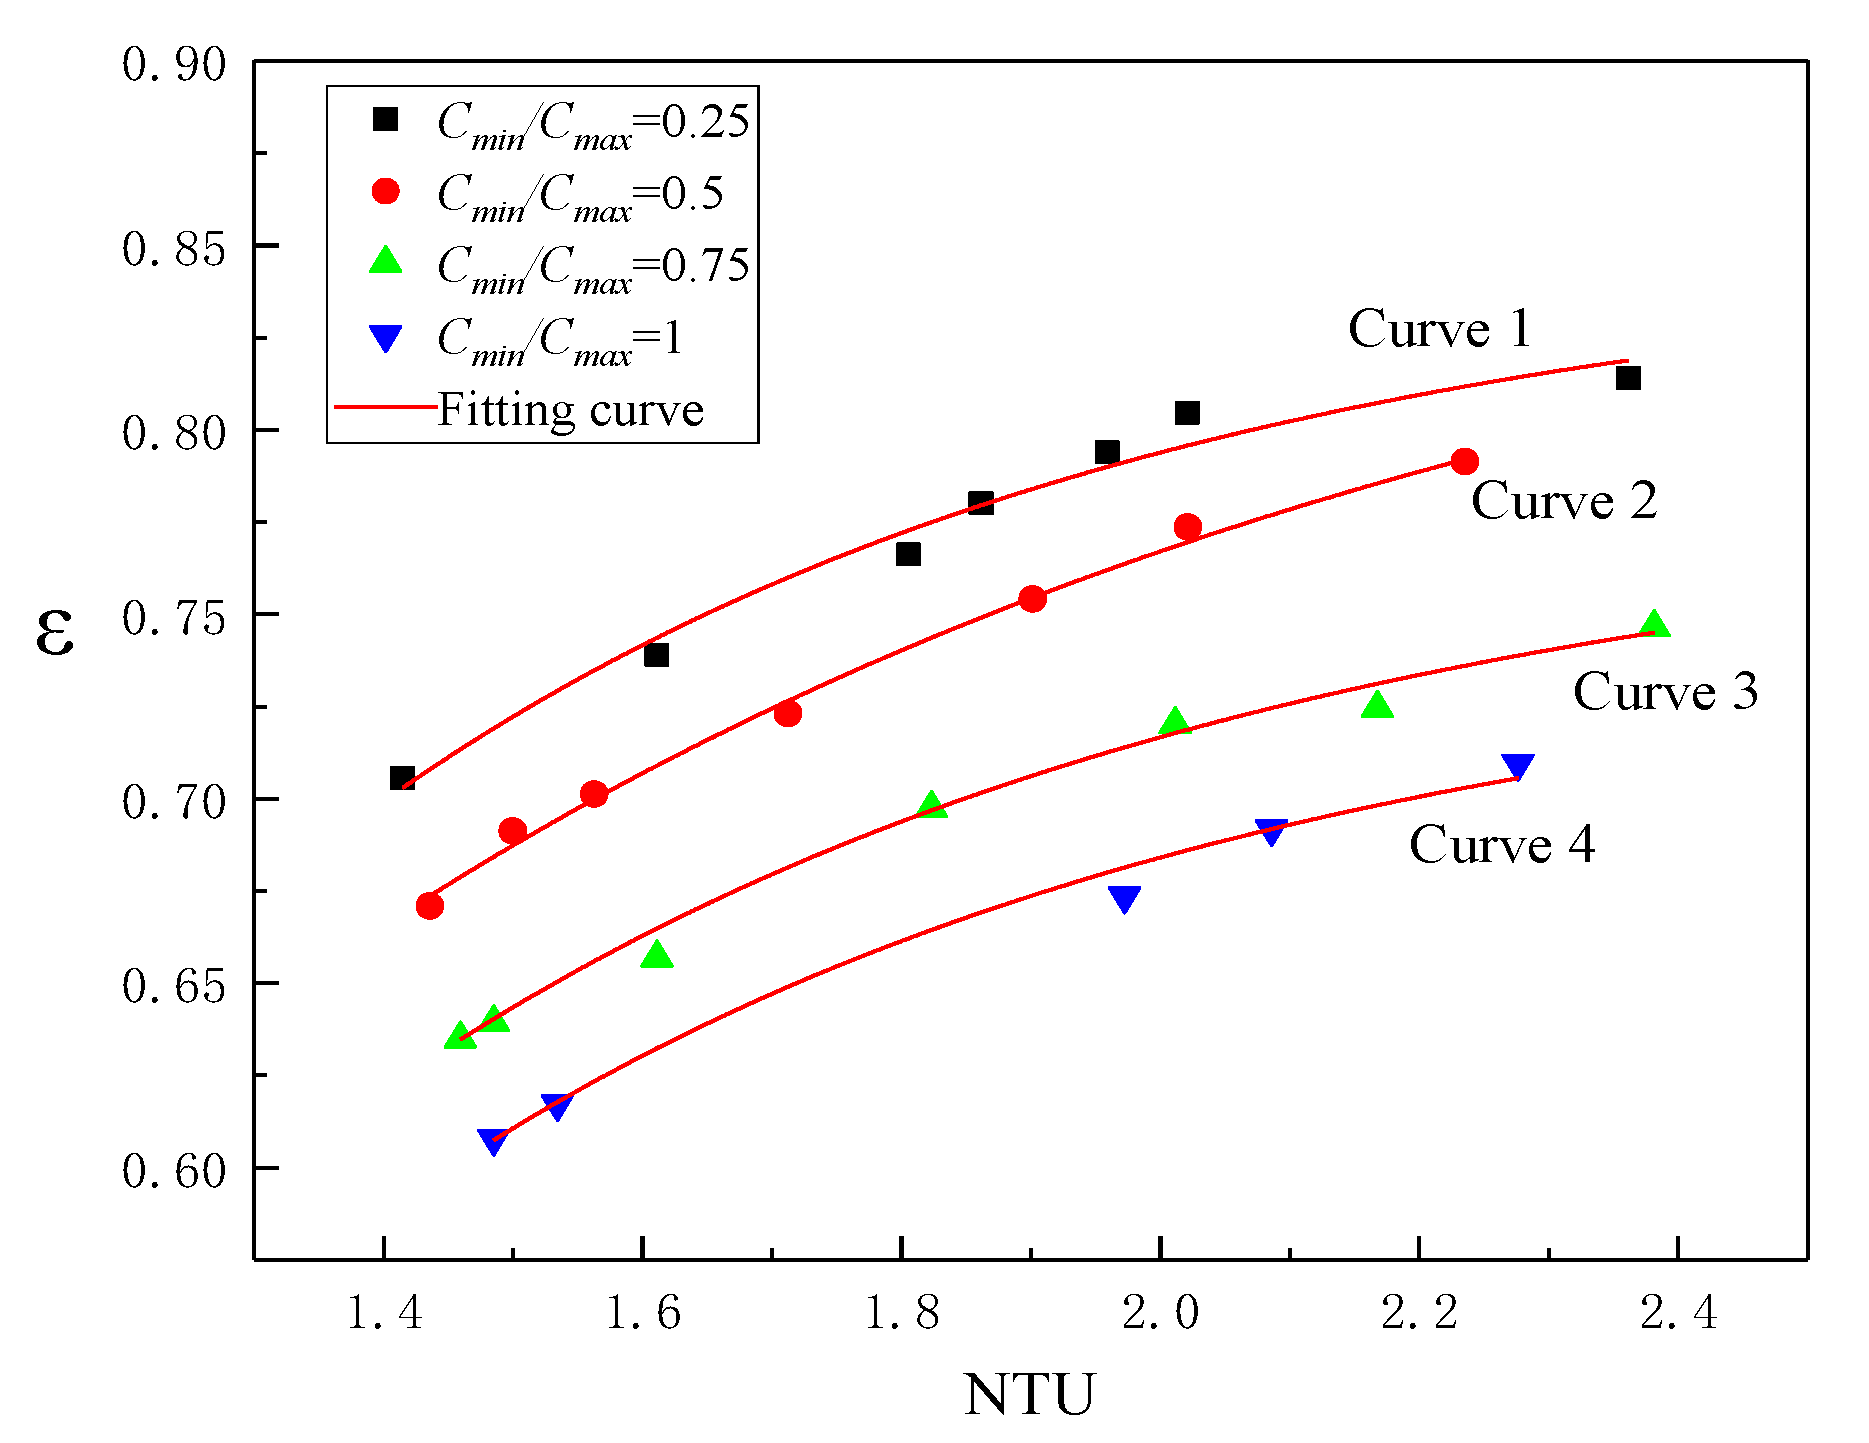
The efficiency of the MHPA-AWHE was evaluated using the ε-NTU method. The factors affecting the efficiency included the ratio of the specific heat capacities, the temperature difference of each side, the heat transfer coefficient, and the heat transfer area of the air side. Figure 14 shows the efficiency under different specific heat capacity ratios at 0.25, 0.5, 0.75 and 1. The larger the ratio of the specific heat capacity ratio (Cmin/Cmax) was, the lower the efficiency of heat exchanger was. When the specific heat capacity ratio was 0.25, the efficiency of the heat exchanger reached the maximum of 81.4% in this experiment. The fitting curve equations of the ε-NTU data for different specific heat capacity ratios of the MHPA-AWHE are shown in Table 3.

3.2. Heat Transfer Performance of MHPA-AWHE

3.2.1. Thermal Performance of Core Components

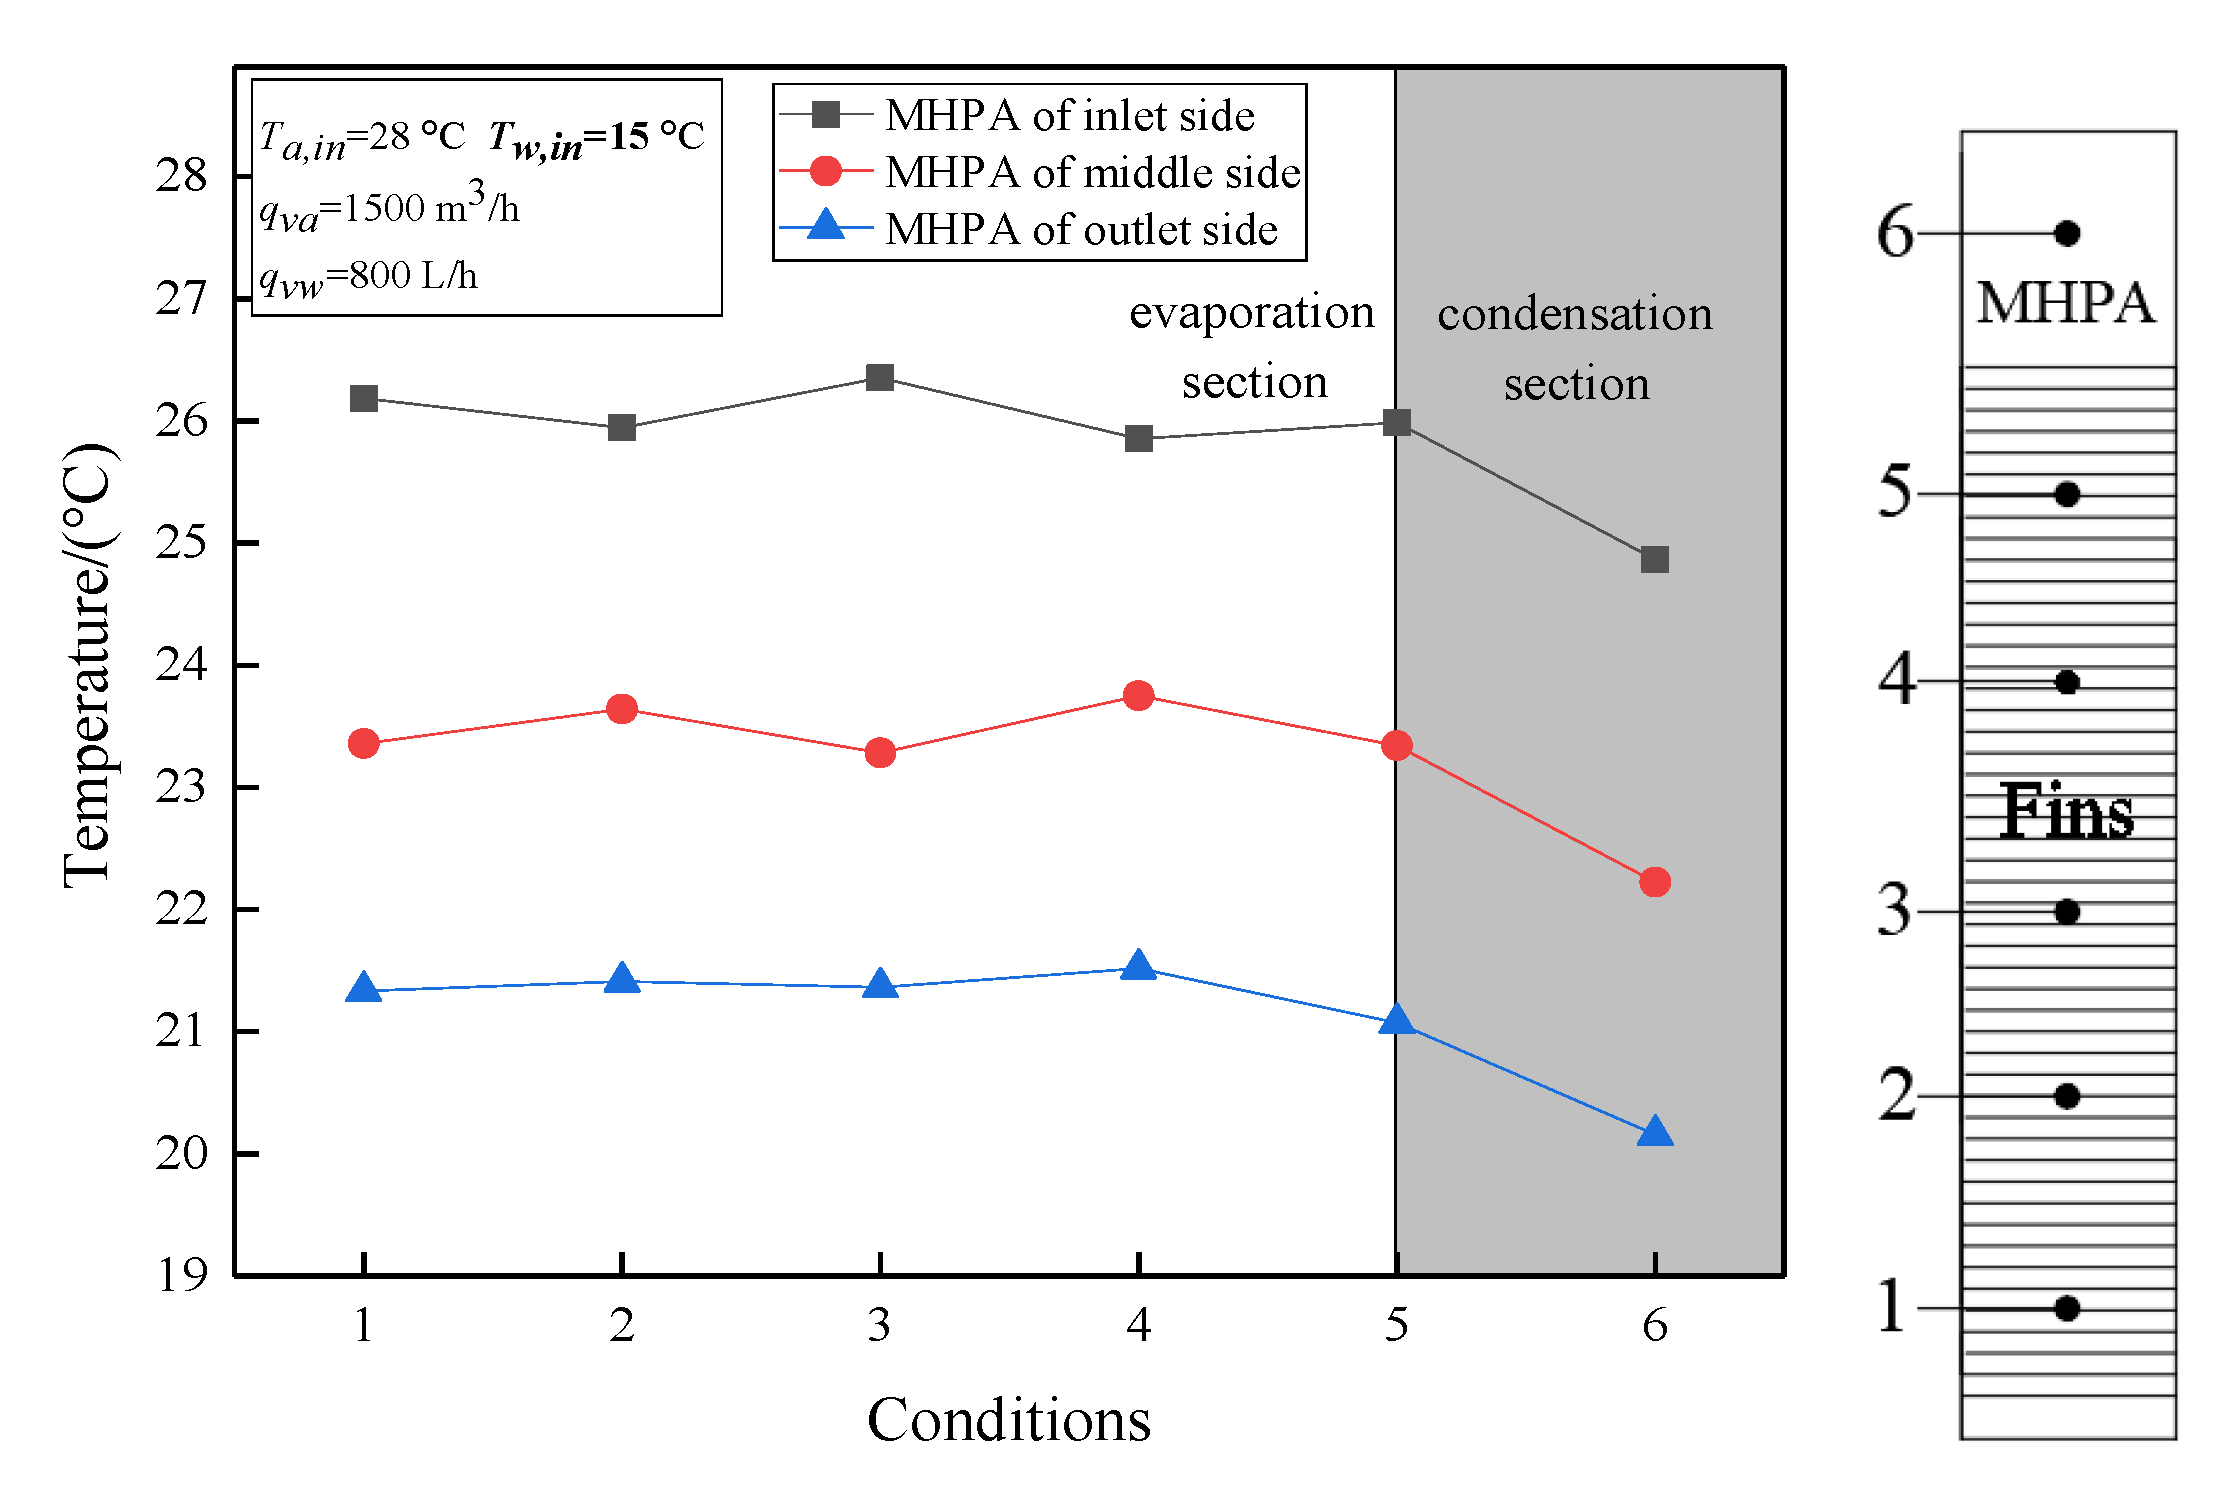
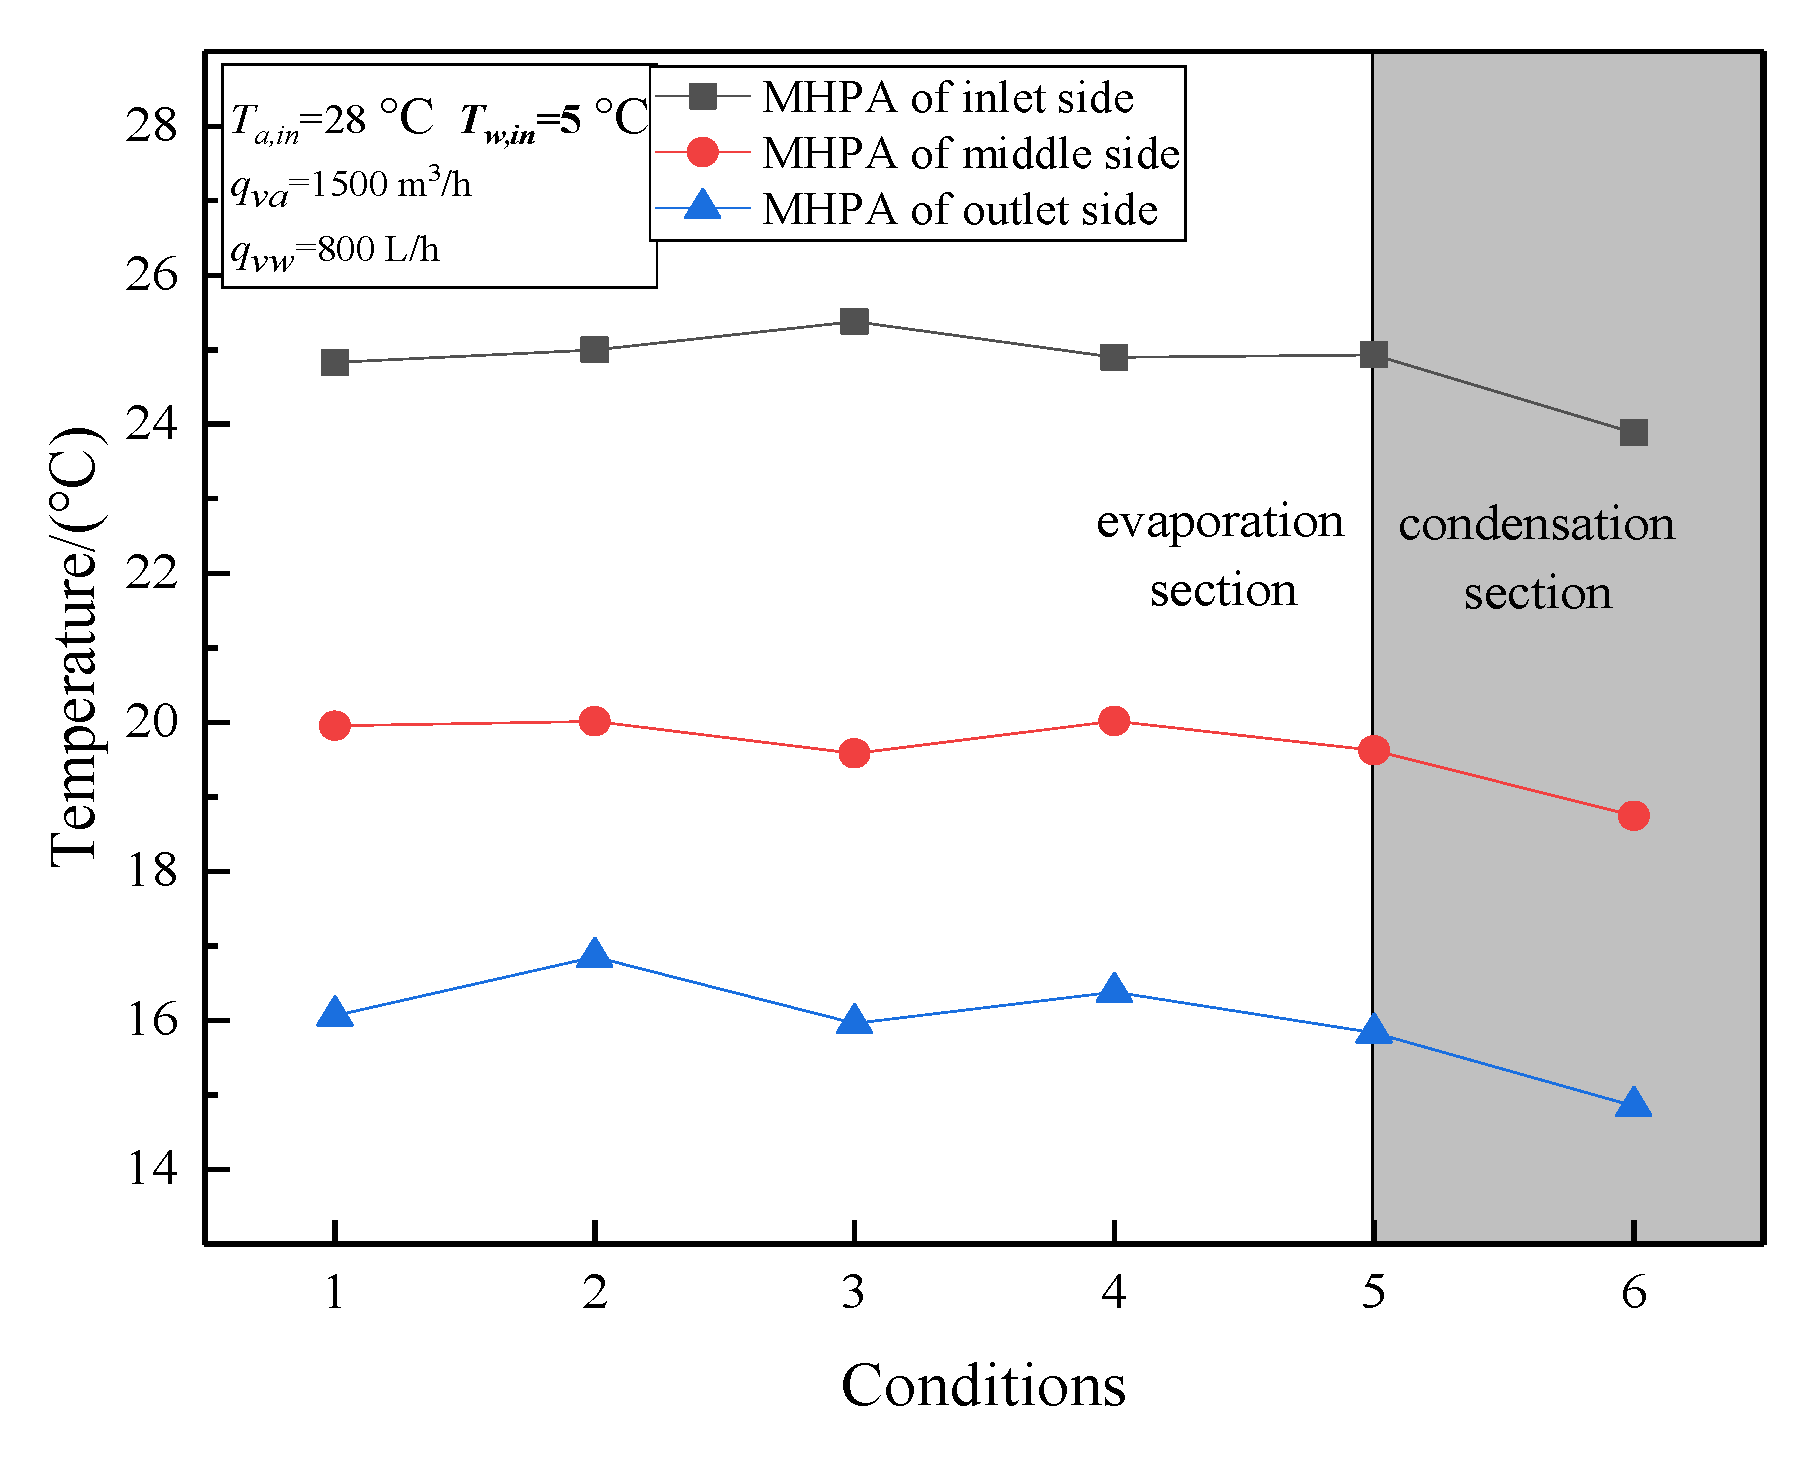
Heat transfer between the air and water sides was realized by the core components, and its performance directly determined the performance of the MHPA-AWHE. Inlet water temperatures of 5 and 15 °C were studied. As shown in Figure 15 and Figure 16, along the direction of air flow, the temperature of the core components exhibited the same trend at the inlet, middle, and outlet sides. The maximum temperature difference from T1 to T5 in the evaporation section of each core component was 0.49 °C. Meanwhile, the temperature difference between the evaporation and condensation sections of the core components at the inlet, middle, and outlet sides were 1.20, 1.25 and 1.18 °C, respectively, when the inlet water temperature was 15 °C. When the inlet water temperature was 5 °C, they were 1.12, 1.09 and 1.35 °C, respectively. During the experiment, there was excellent uniformity of the temperature distributions and thermal conductivities of the core components.
Based on the excellent temperature distributions of the core components, the heat flux and equivalent thermal conductivity were further studied. The performance of the MHPA-AWHE was compared to an air–air heat exchanger based on the micro–heat pipe array studied by Diao [34]. Both used serrated fins with the same sizes, the experimental conditions of the two heat exchangers were selected to ensure that the air side had the same velocity at about 0.95–0.96 m/s. When the inlet temperature difference was 8 °C, the heat flux and equivalent thermal conductivity of the MHPA-AWHE were 1.6-times and 5.72-times larger than that of the air–air heat exchanger, respectively. Moreover, when the inlet temperature difference was 13 °C, the equivalent thermal conductivity of the MHPA-AWHE was 6.6-times larger than that of the air–air heat exchanger. The data comparison is shown in Table 4.

3.2.2. Thermal Resistance Analysis

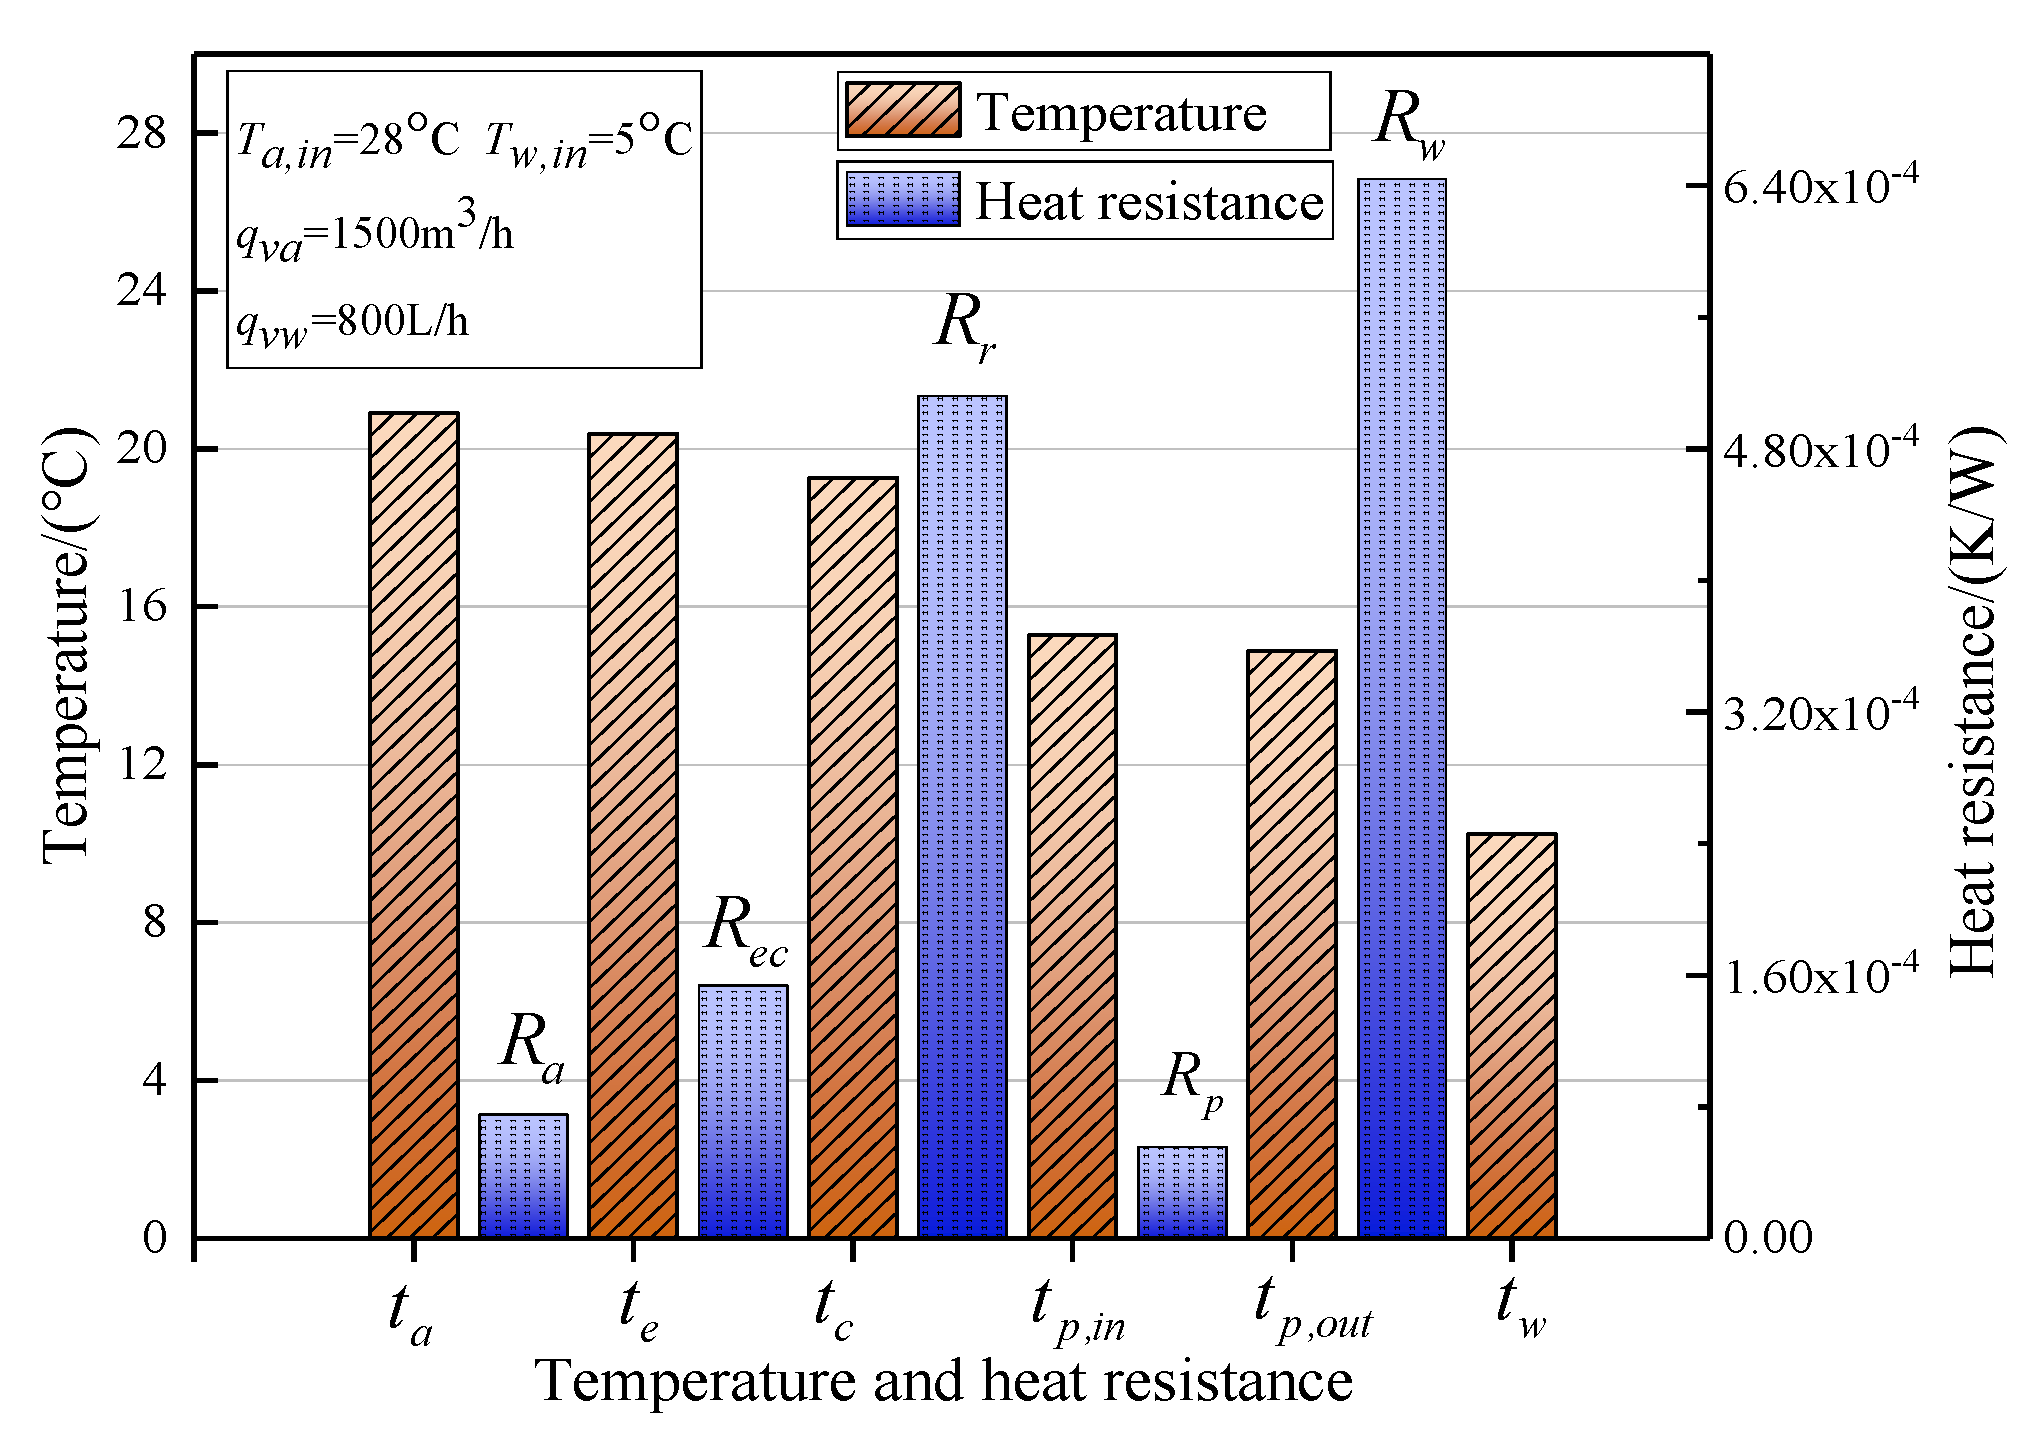
The temperature and thermal resistance distributions of each heat transfer part in the MHPA-AWHE were studied for an air flow rate of 1500 m3/h and water flow rate of 800 L/h. As shown in Figure 17, when the inlet water temperature was maintained at 5 °C, the three parts of the convective heat transfer process on the air side, the equivalent heat conduction process of core components, and the heat conduction process of the PFT exhibited lower temperature differences within 1.2 °C and thermal resistances between 5.54 × 10⁻⁵ and 1.53 × 10⁻⁴ K/W. However, in the process of convective heat transfer on the water side, the maximum temperature difference was 4.64 °C, and the corresponding maximum thermal resistance was 6.4 × 10⁻⁴ K/W. Secondly, a larger thermal resistance occurred in the condensation section between the MHPA components and PFT. The temperature difference between the two parts was 3.99 °C, and the corresponding thermal resistance was 5.12 × 10⁻⁴ K/W.
As shown in Figure 18, when the inlet water temperature was maintained at 15 °C, the maximum temperature difference was 2.96 °C in the process of convective heat transfer on the water side and a larger thermal resistance occurred in the condensation section between the core components and PFT. The temperature difference and thermal resistance of the other three processes were especially low, and the temperature differences were within 1 °C.
The reasons for largest thermal resistance in the process of convective heat transfer on the water side were that the heat transfer occurred without enhancement under laminar flow and the heat transfer area on the water side was much smaller than that on the air side. Furthermore, the reasons for the larger process of the condensation section between the MHPA components and PFT were that there was only one side of PFT to fit with the condensation section of the MHPA components, and there was a certain gap in the surface. In a future study, to reduce water-side thermal resistance is the key to optimize performance by increasing the water flow rate, and MHPA components can be attached to both sides of the PFT.

3.3. Pressure Drop and Power Consumption

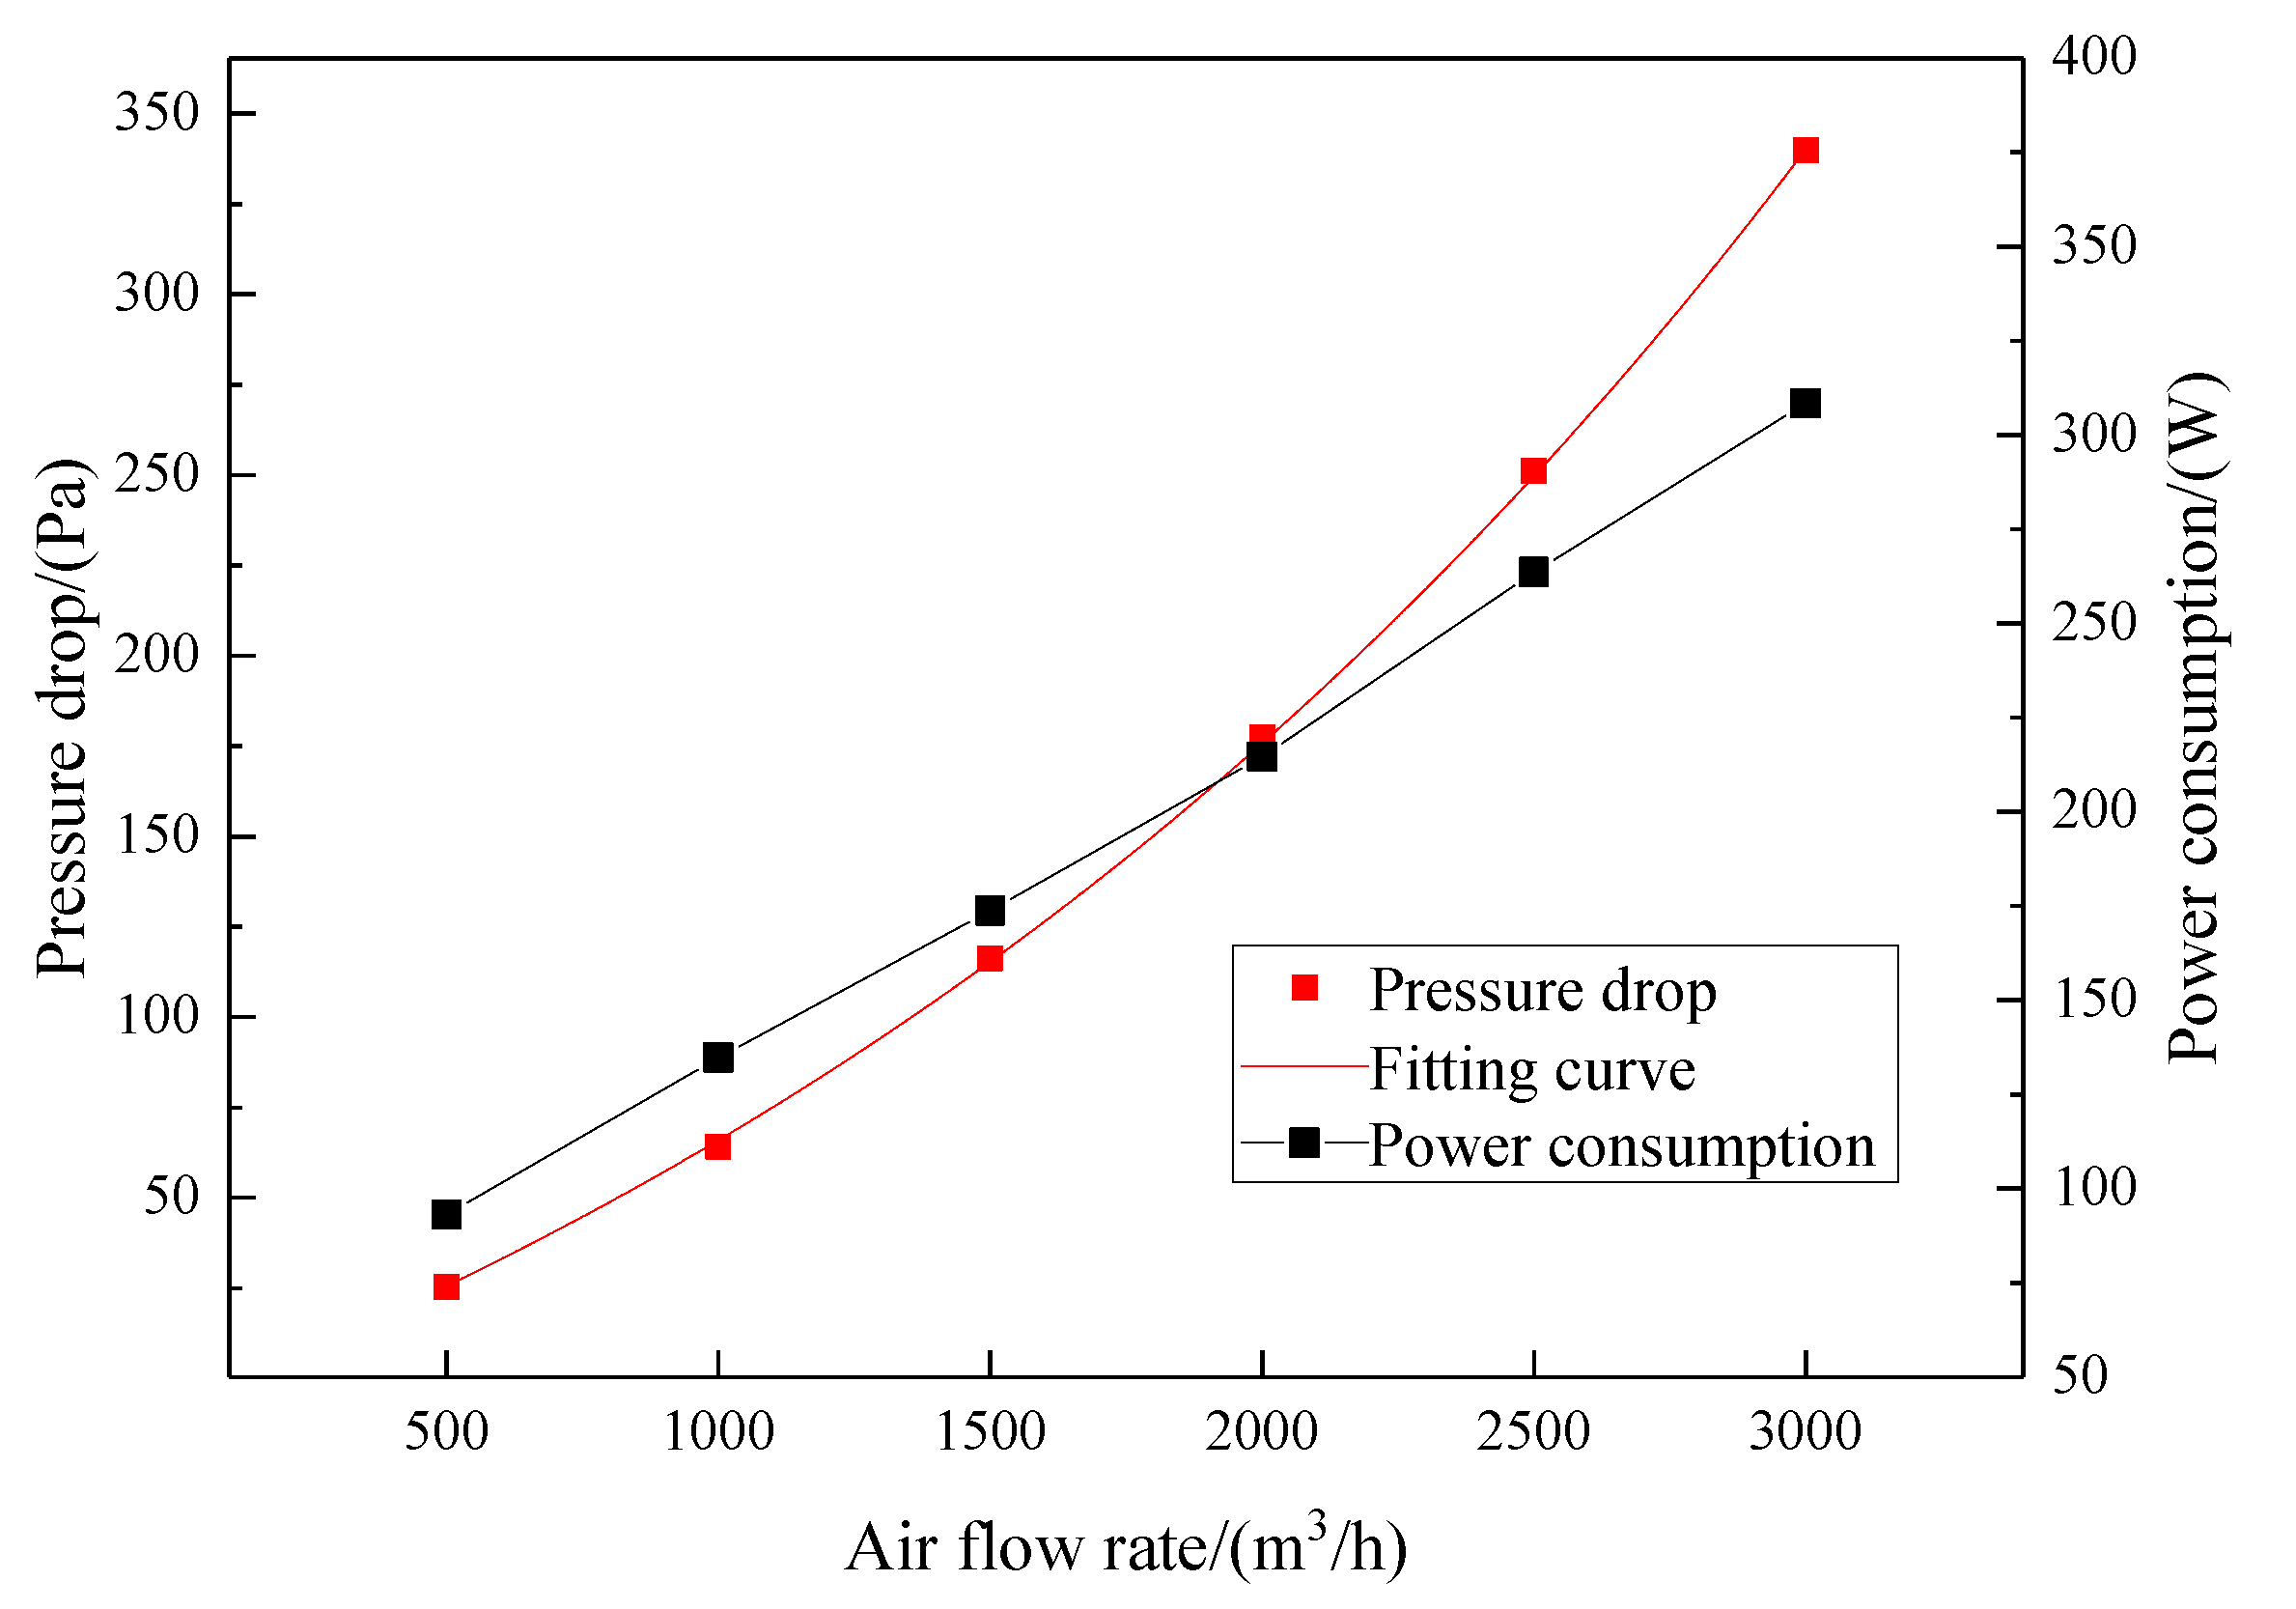
The pressure drop is a valuable parameter of the MHPA-AWHE because it directly determines the energy consumption of the fan or pump. As shown in Figure 19, the pressure drop of the air side increased exponentially with the increase of the air flow rate. The maximum pressure drop was 339.8 Pa when the air flow rate was 3000 m3/h. The average pressure drop on the air side was 162.1 Pa. With the increase of air flow rate, the power consumption of the fan increased linearly from 93 to 308 W.
Figure 20 showed that the pressure drop on the water side increased exponentially with the increase of water flow rate. The maximum pressure drop was 8.86 kPa when the maximum flow rate was 1200 L/h. With the increase in flow rate, the power consumption of the pump increased linearly from 48 to 126 W.
In summary, the air and the water side of the MHPA-AWHE exhibited low pressure drops. Based on the experimental data, the fitting curve equations of the resistance characteristics were obtained as follows:
The fitting curve equation of the pressure drop characteristics on the air aide was as follows:
Δ P a = 147.61 e ( q v a / 2478.7 ) 154.99 .
The fitting curve equation of the pressure drop characteristics on the water aide was as follows:
Δ P w = 0.387 e ( q v w / 669.19 ) + 6.559 .

3.4. Comprehensive Performances of MHPA-AWHE

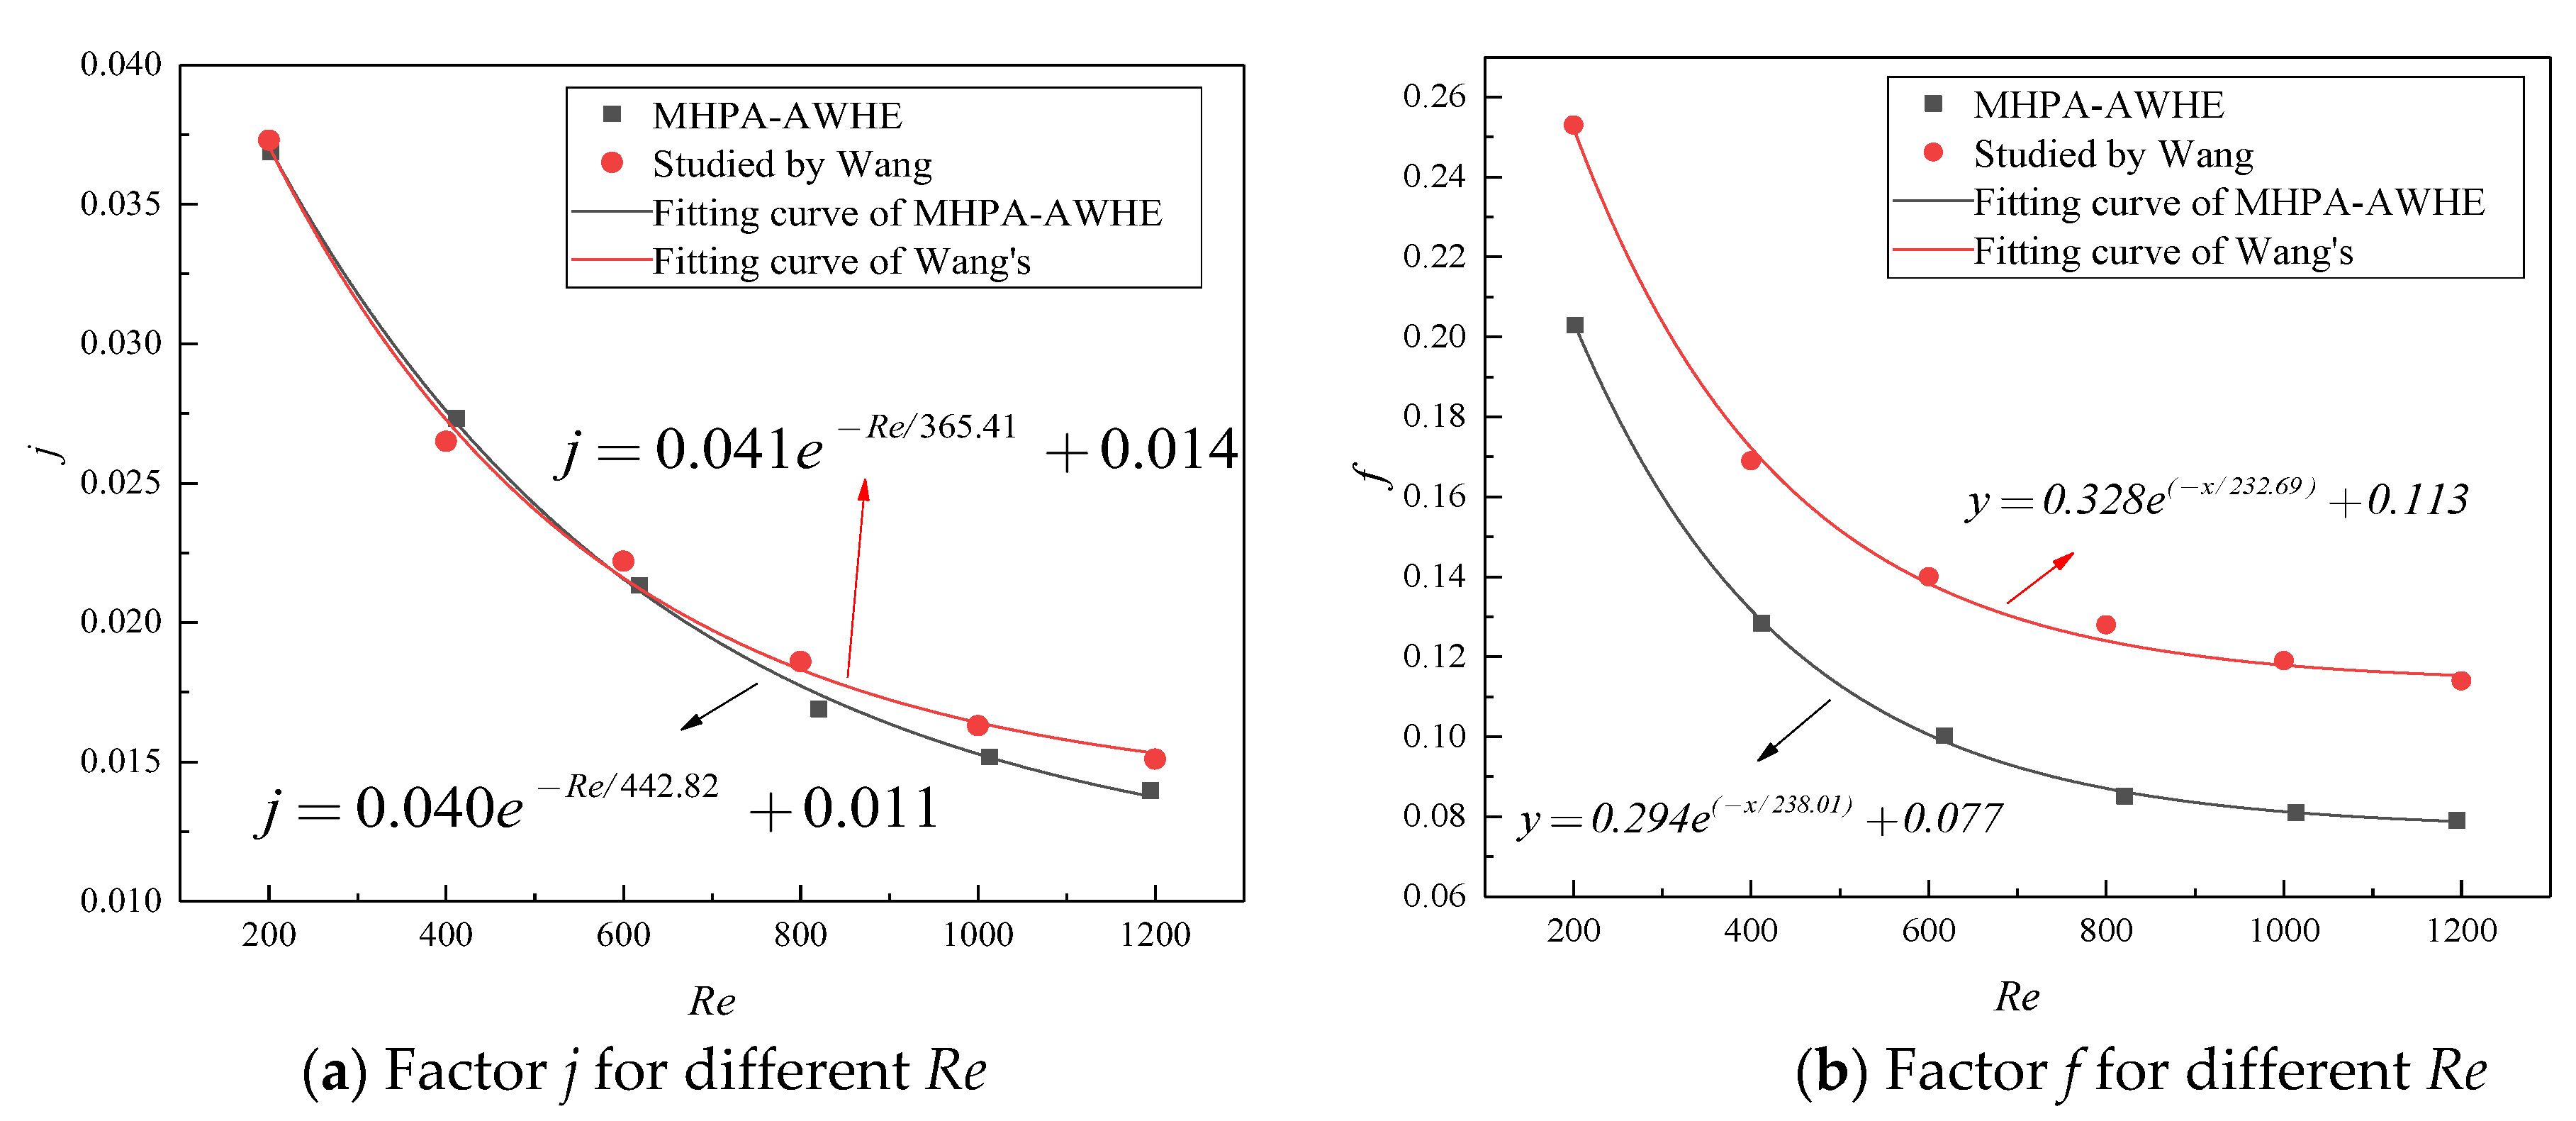
Figure 21a showed the variation of the heat transfer factor j for different values of Re on the air side. The MHPA-AWHE with serrated fins and the plate–fin air–water heat exchanger with louvered fins selected by Wang [18,19,20] were compared. The heat transfer factor j decreased quickly when Re was less than 600, and the two kinds of heat exchangers exhibited similar trends. The heat transfer factor j decreased gently when Re was larger than 600. The average heat transfer factor j studied by Wang increased by 3.3% compared with the MHPA-AWHE. The reason was that the form of the louvered fins was more complicated than that of the serrated fins, and the disturbance of air flow was more significant.
Although the heat transfer factor j of the heat exchanger with louvered fins was better, the friction factor f of the heat exchanger with louvered fins was significantly lower than that of the MHPA-AWHE with serrated fins, as shown in Figure 21b. As Re increased from 200 to 1200, the average friction factor f of the MHPA-AWHE decreased by 34.7% compared to the heat exchanger with louvered fins. In this study, the exponential function of the friction factor f in the Re range from 200 to 1200 also fitted.
According to the experimental data and Wang’s data, the heat transfer factor j and the friction factor f were fit in the Re range from 200 to 1200, in order to modify the accurate j and f values in actual projects.
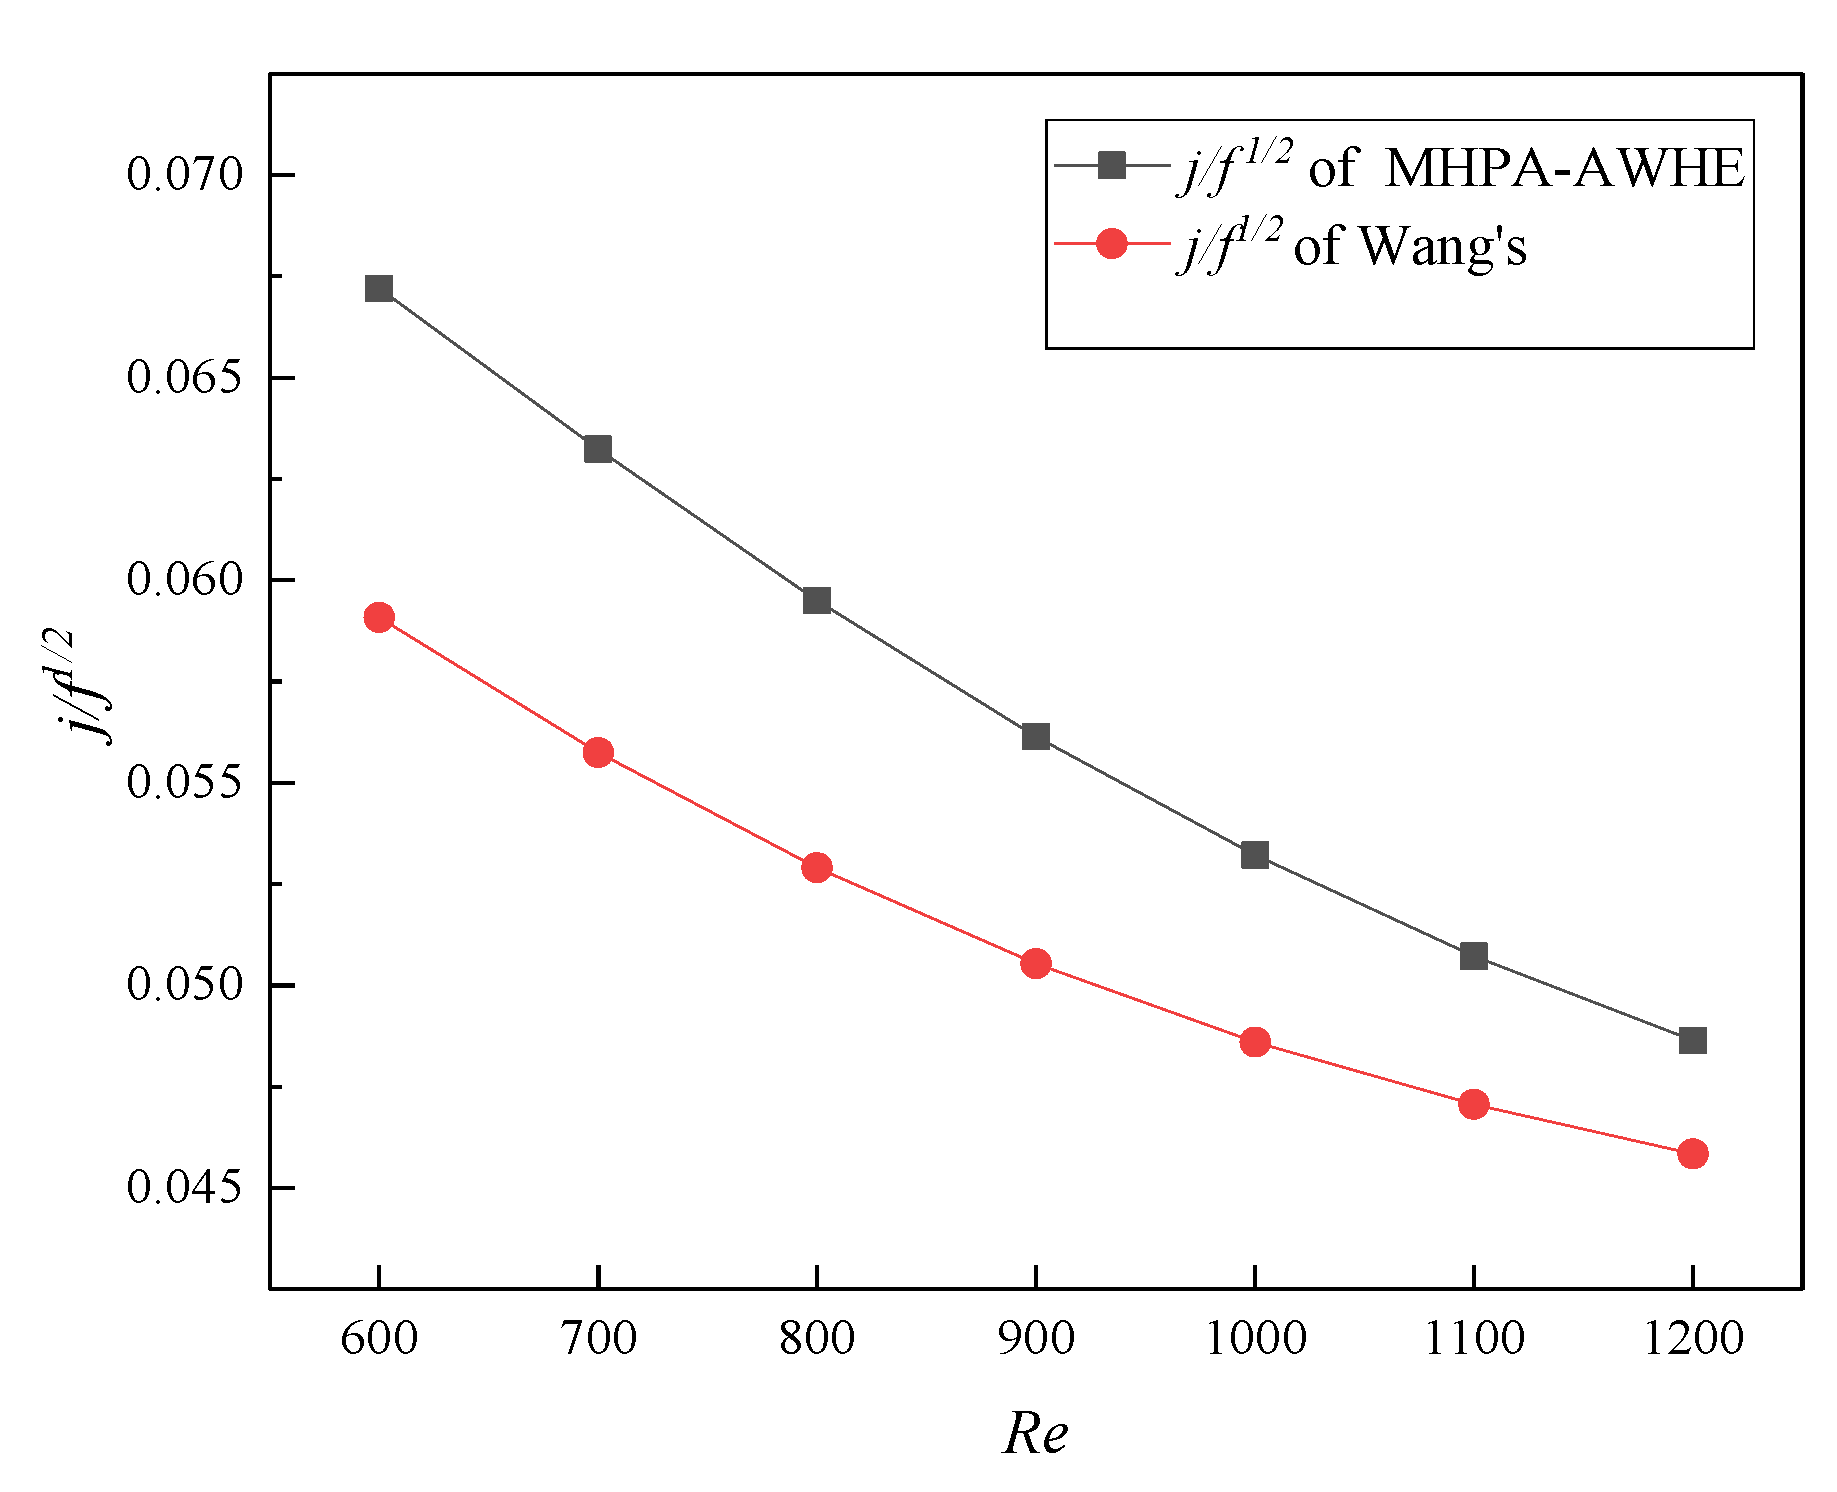
As shown in Figure 22, the average j/f1/2 of the MHPA-AWHE with serrated fins was 10.8% higher than that of the heat exchanger with louvered fins. This showed that the heat transfer rate of the heat exchanger could not be increased simply by changing the fin density and complexity. Furthermore, the resistance of the heat exchanger increased, which led to a decrease in the comprehensive evaluation index of the heat exchanger.

3.5. Energy Saving Analysis

The MHPA-AWHE modules studied by the experiment were proposed to be applied in DCs in Beijing as an example, and the energy saving and payback period of investment were analyzed before and after the transformation. The area of this DC is about 160 m2, the height is 3.2 m, This work assumes that the workload of servers remain unchanged, the total heat dissipation of the DC is assumed as 40 kW, and the heat dissipation of UPS and lights and the heat leakage of doors are not considered. The rated power of the conventional air–cooled AC in this data center is 7.8 kW, and the AC operates continuously for 8760 h all year round. The different number of indoor MHPA-AWHE modules according to the most efficiency operation are placed in DC, as shown in Figure 23.
The outdoor environment temperature is an important factor, which affects the EER and power consumption of the AC, the cooling load of the DC and the heat transfer rate of the MHPA-AWHE. The weather data in typical meteorology year of 2019 was adopted for annual simulation in DeST-c software hourly. As shown in Figure 24a, in winter and transition seasons, the environment temperature is relatively low, which is conducive to the utilization of natural cold energy, and the lowest temperature in January is −12.5 °C. As shown in Figure 24b, the outdoor environment temperature has a certain influence on the cooling load, which varies from 34.61–42.61 kW.
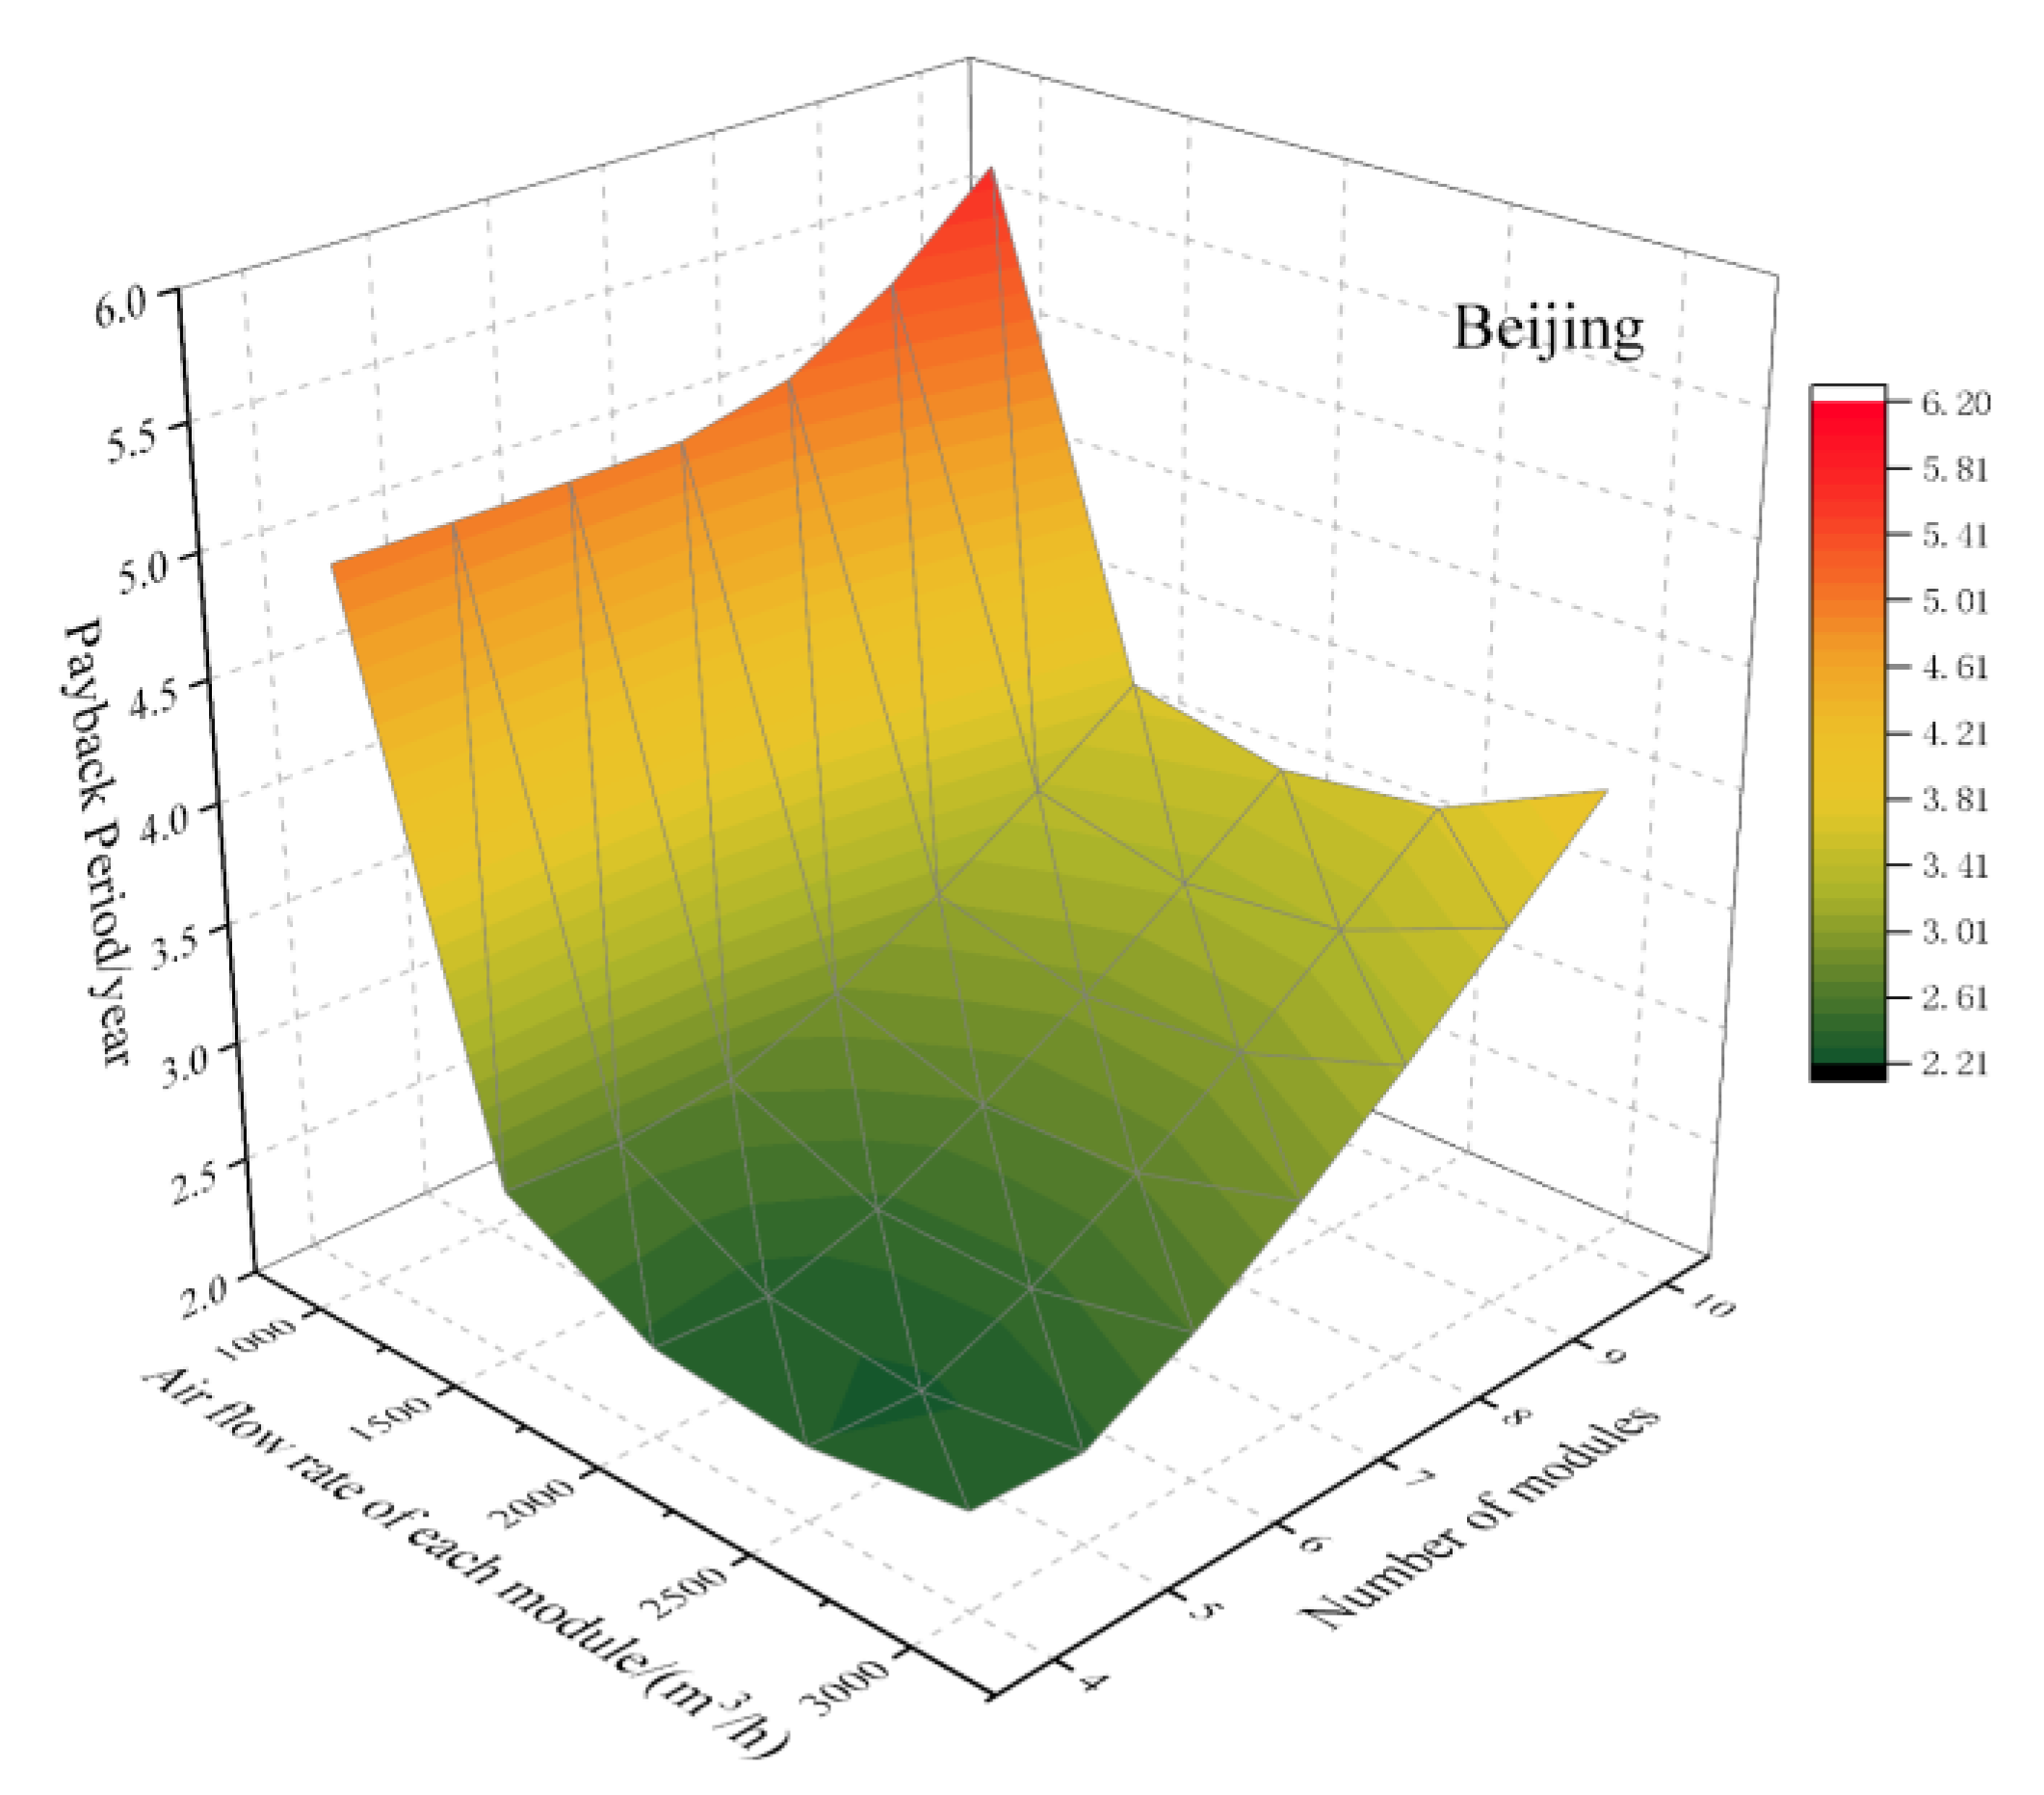
The fitting curve of EER1 of conventional air-cooled AC that varies with environment temperature is obtained as Equation (13), and the annual power consumption of AC can be obtained before the transformation. The MHPA-AWHE module is proposed to use a natural cold source for the transformation of DC, however, with a different air flow rate, number of modules and outdoor environment, the performance of MHPA-AWHE module shows different heat transfer and pressure drop performances, and the electric power of fans and water pumps are also different. During the experiment, different water flow rates had little influence on the comprehensive performance, and the water flow rate and power consumption of pump remained unchanged. According to the annual hourly energy saving and equipment investment, the payback period of investment showed as Equation (15) was analyzed. As shown in Figure 25, when the air flow rate of each module was at 1000–1500 m3/h, the payback period was longer than 3.5 years. When the air volume was more than 1500 m3/h, the payback period first obviously decreased and then increased gradually. The reason is that the power consumption of the fan is relatively large and when the air volume was about 3000 m3/h, the power consumption was almost larger than the AC. With the increase of the number of modules, the investment payback period declined and then increased obviously. It can be seen that when the air flow rate of each module is 2500 m3/h and the number of modules is five, the shortest investment payback period is 2.3 years, which is shortest and the most economical example.
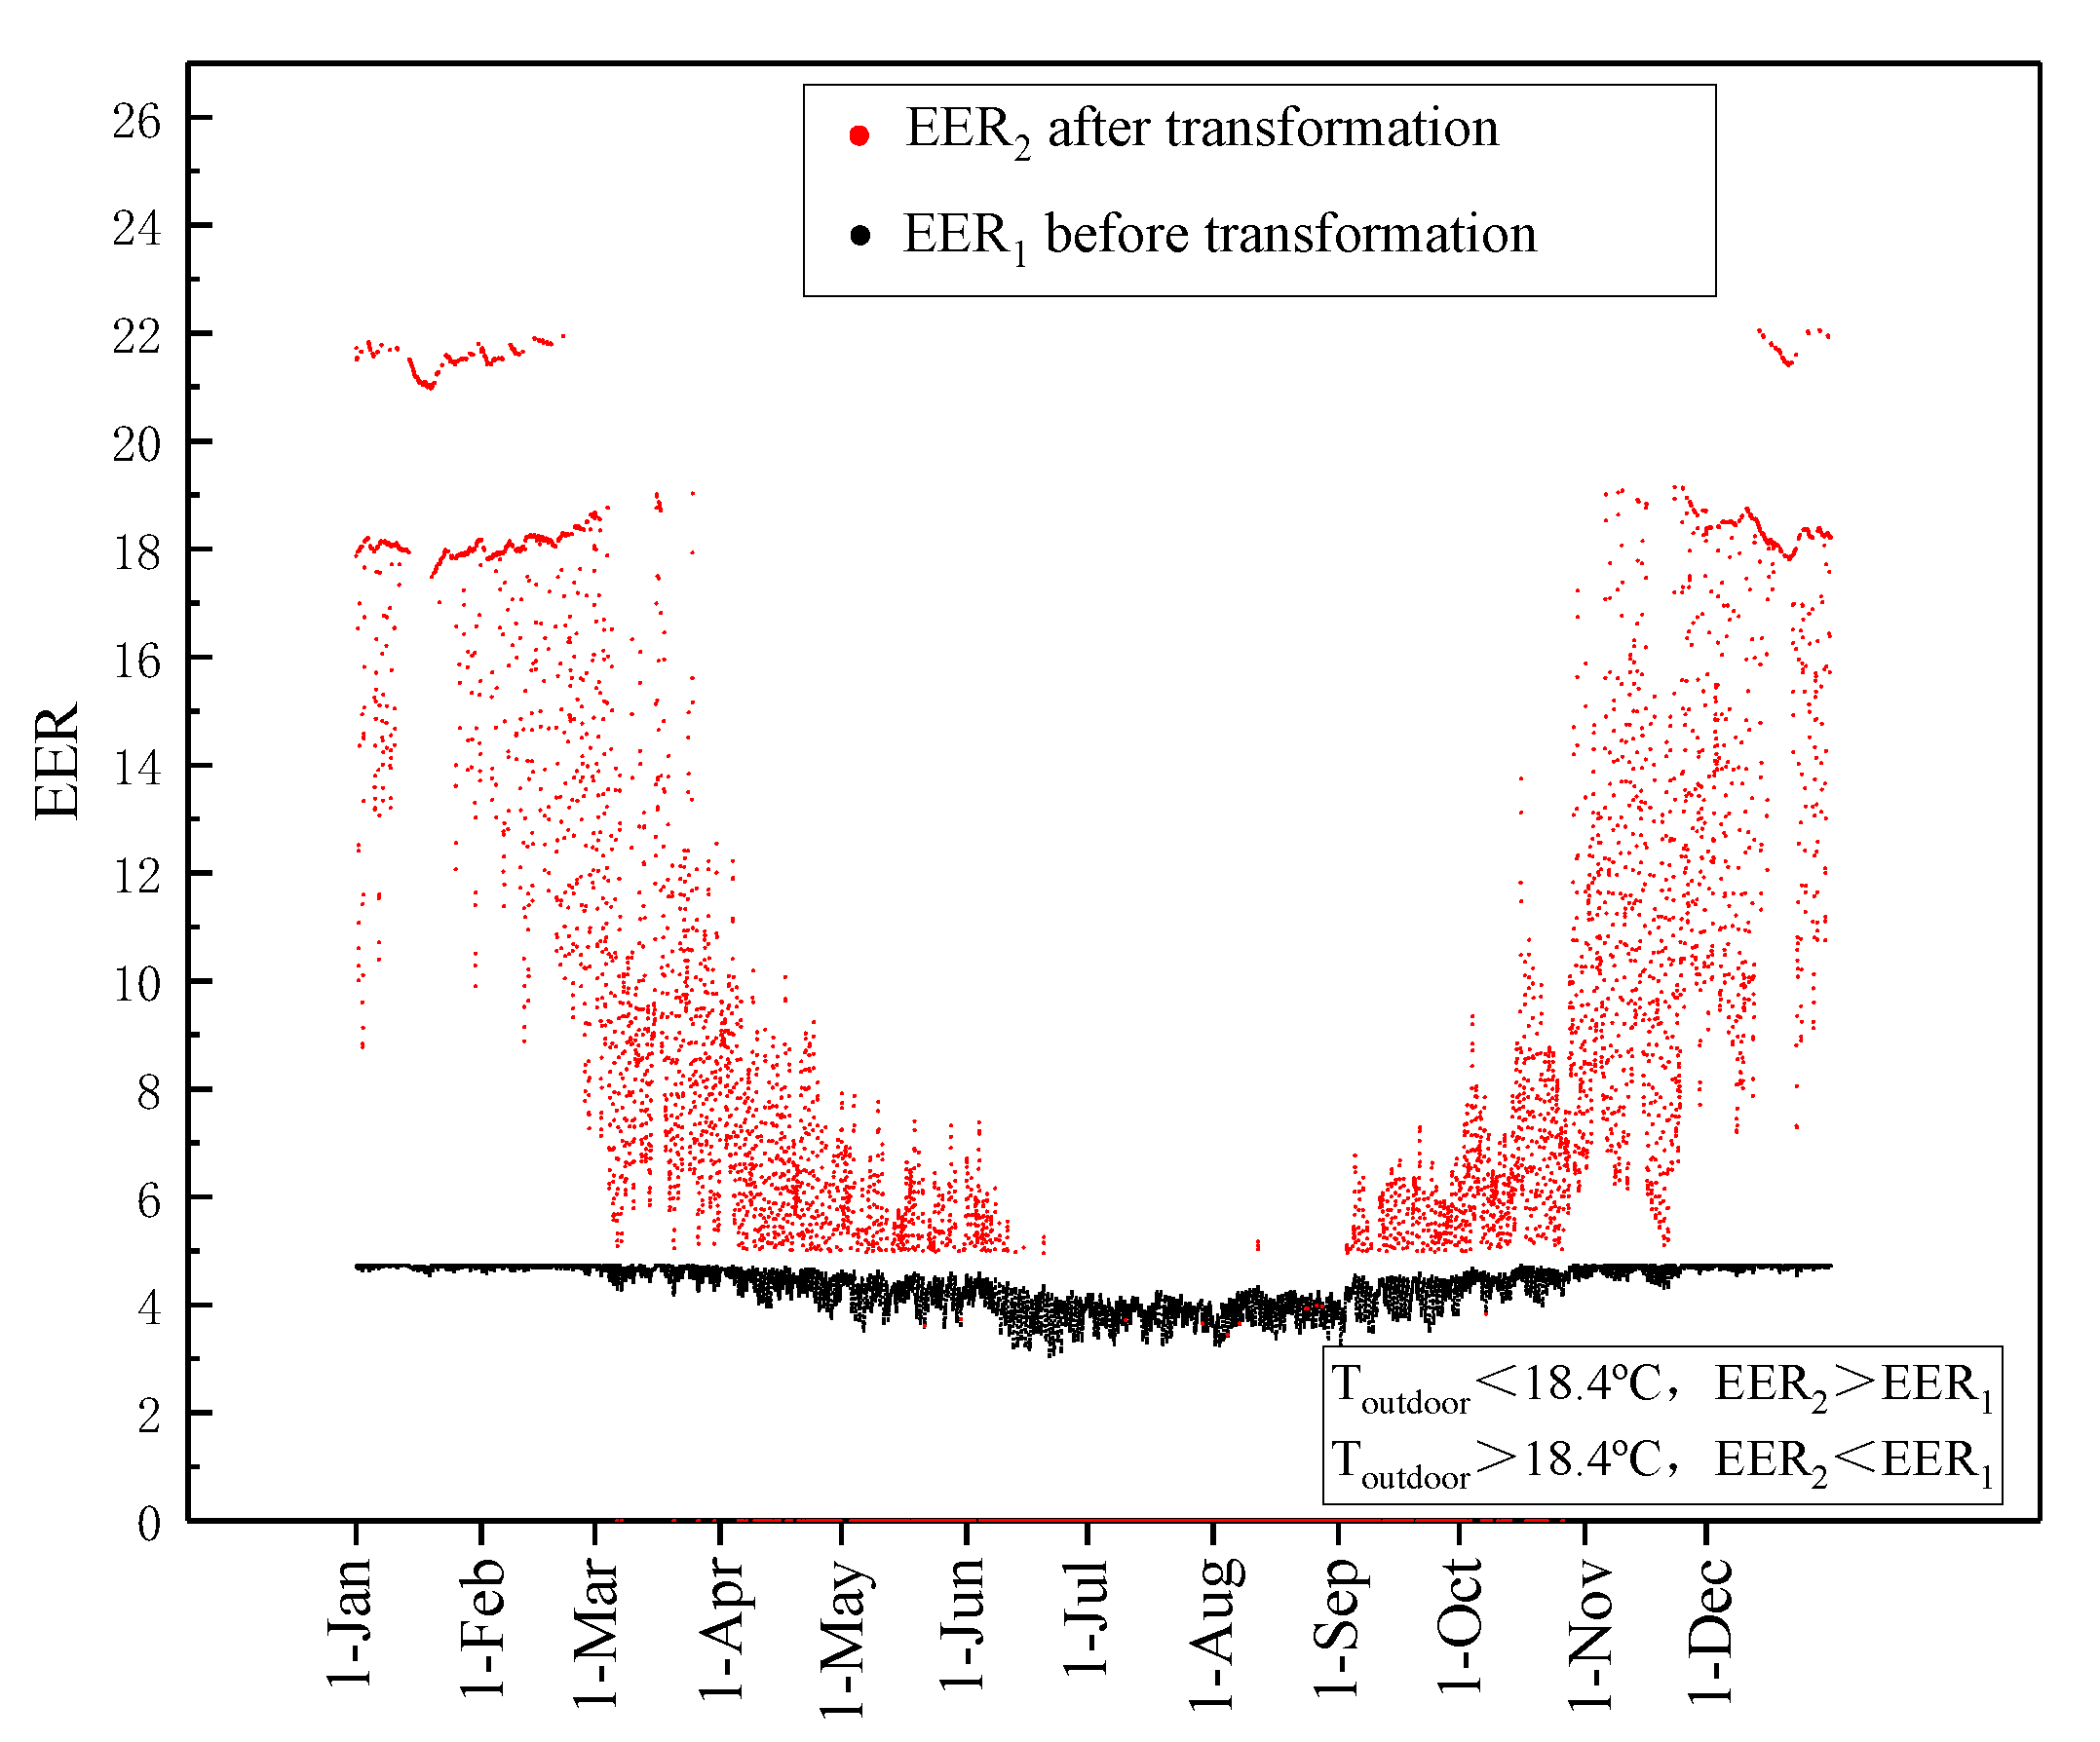
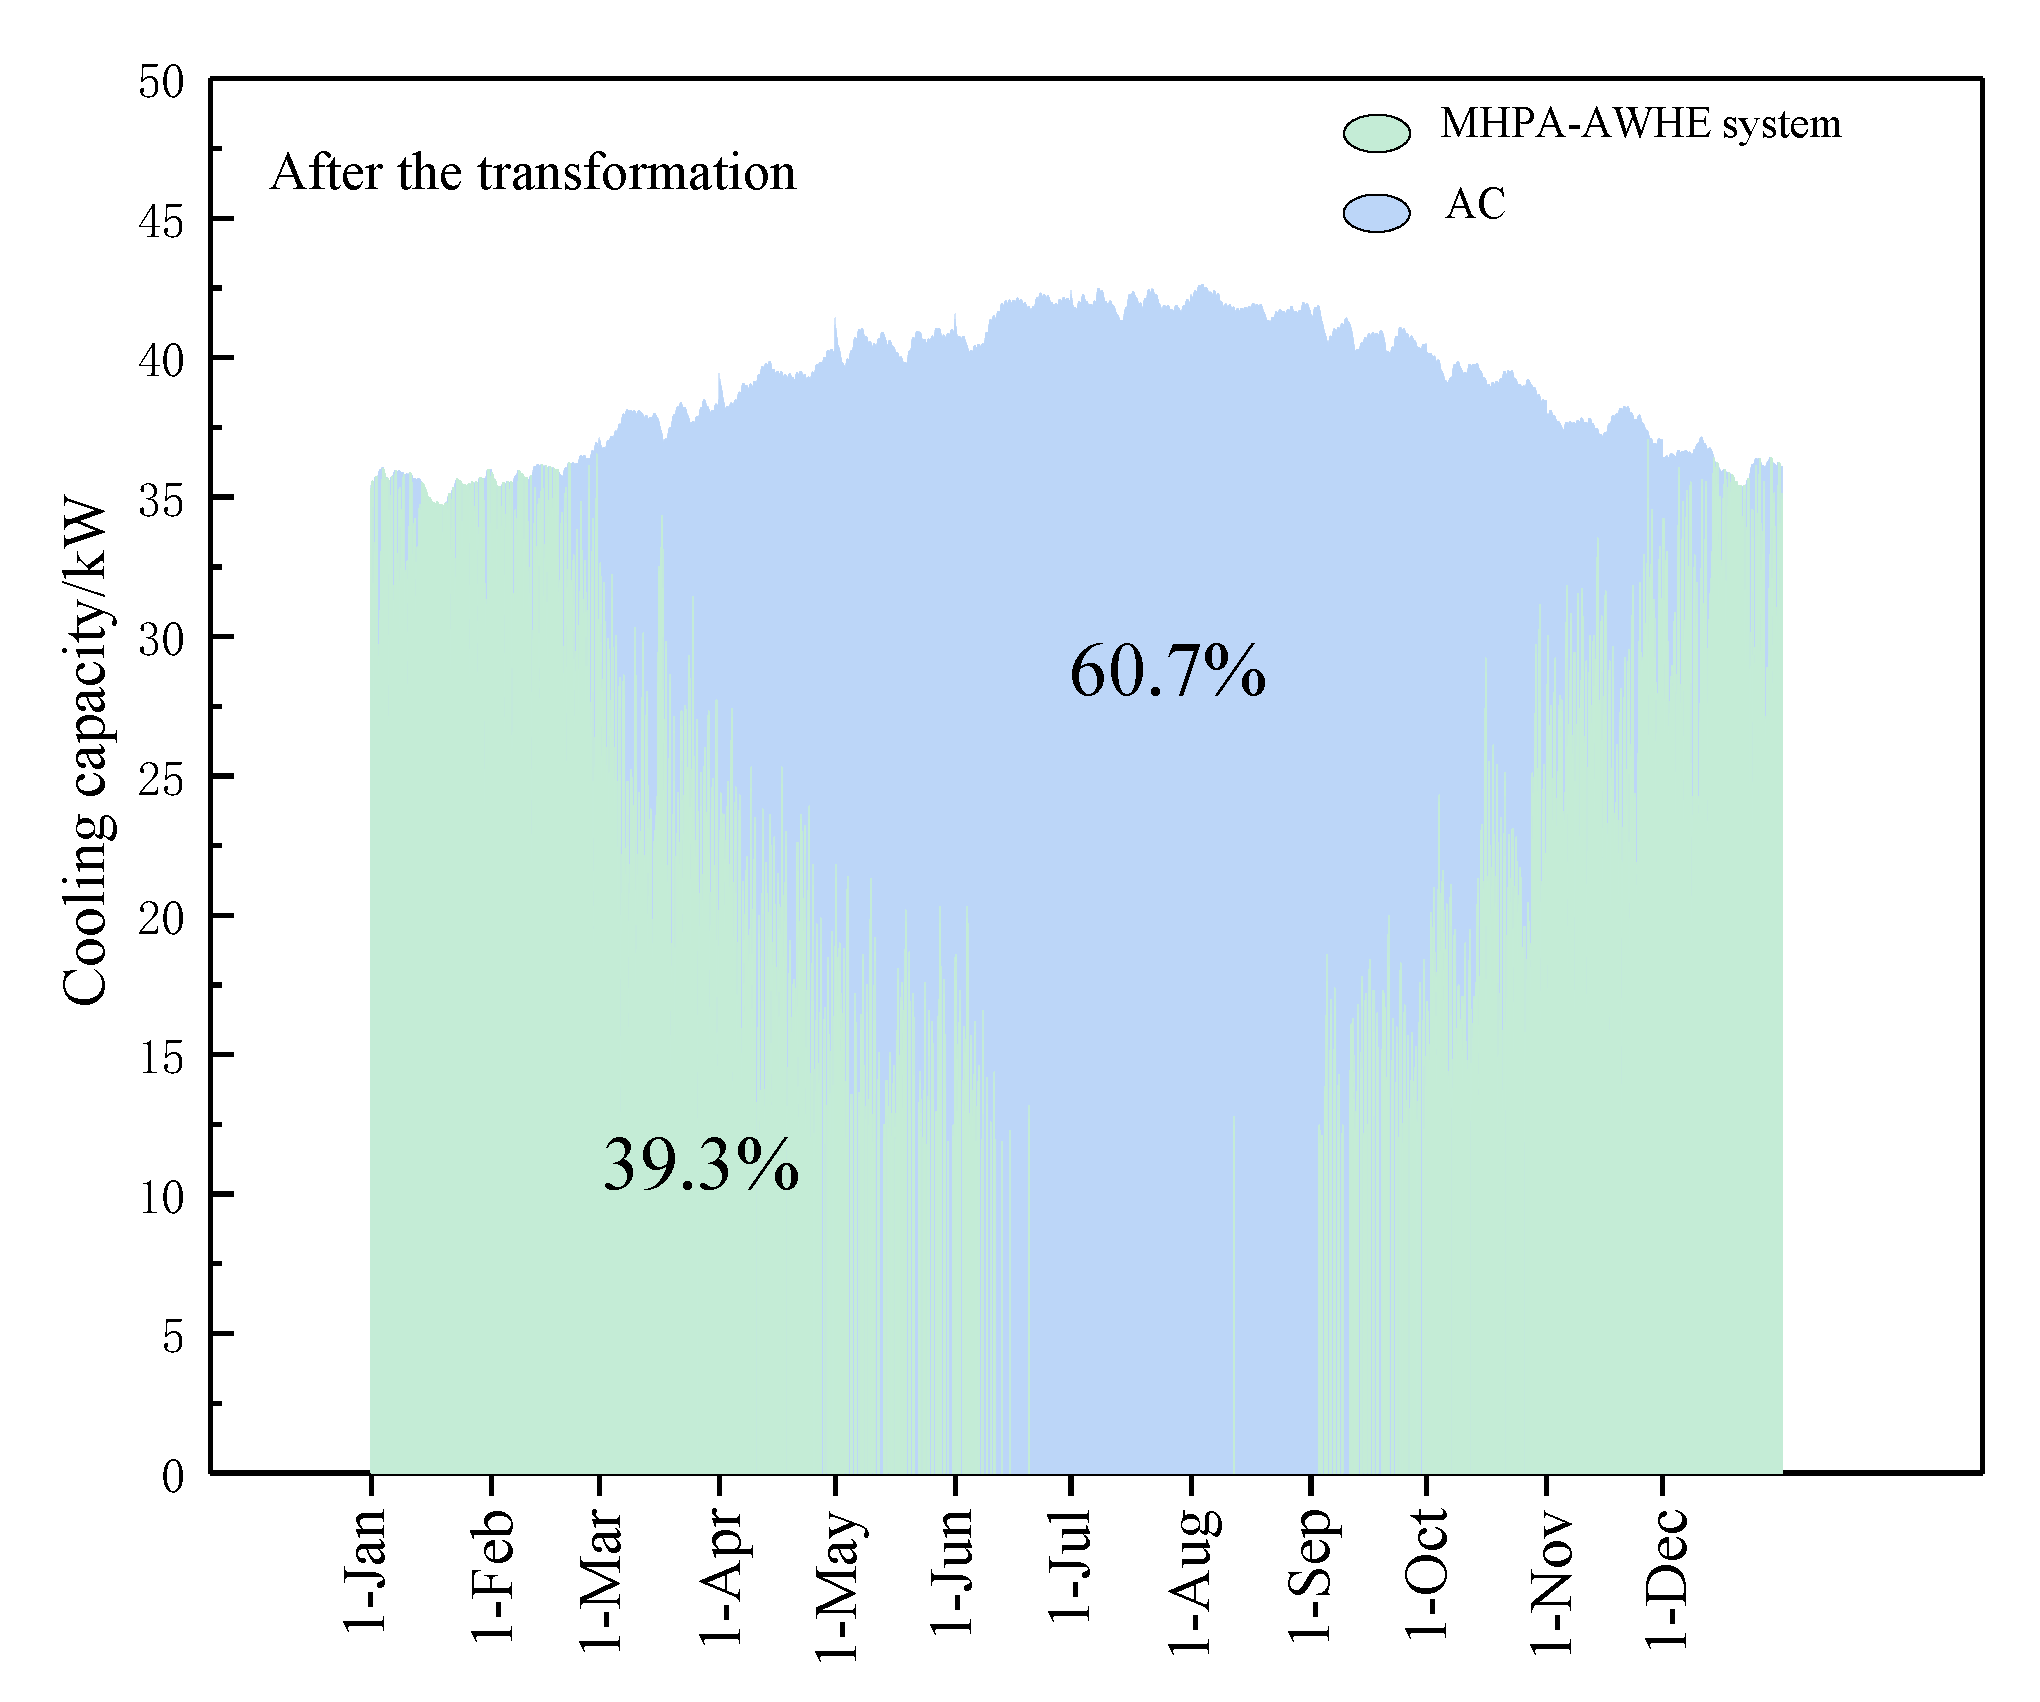
Based on this most efficiency condition, the cooling capacity and power consumption were analyzed. As shown in Figure 26, the average EER1 of the conventional AC is about 4.4 before the transformation. When the temperature was under 0.72 °C, the largest comprehensive EER2 of DCs after the transformation was 21.8, and at this time, as shown in Figure 27, the MHPA-AWHE system satisfied the total cooling load. The larger EER2 distribution was mainly from November to March, and when the outdoor temperature was 18.4 °C, the EER1 was equal to EER2. As the temperature continued to rise, the MHPA-AWHE system could not meet the requirements from June to September. The annual cooling capacity of MHPA-AWHE system accounts for 39.3% of the total cooling capacity after the transformation of DC. Table 5 depicts the control strategy of MHPA-AWHE system and AC in DCs after the transformation, and shows that the MHPA-AWHE system can work for more than 60% time of the year to save energy in DC.
As shown in Figure 28, due to the low outdoor temperature from December to January, the electric power consumption of the MHPA-AWHE system is lower. With the gradual increase of the environment temperature, both the MHPA-AWHE system and AC need to work to meet the total cooling load. The annual electric power consumption after the transformation is reduced by 28.32% compared to before the modification.

4. Conclusions

In this study, the thermal performance and energy efficiency of the MHPA-AWHE system were analyzed and studied comprehensively. The main conclusions were as follows:
(1) The air flow rate had a greater influence on the performance of the MHPA-AWHE than the water flow rate. The maximum heat transfer efficiency was 81.4%, analyzed by the ε-NTU method when Cmin/Cmax was at 0.25. The maximum heat transfer rate was 9.29 kW, when the maximum air flow rate was 3000 m3/h.
(2) The MHPA components showed excellent performances. The temperature difference between the evaporation and condensation sections was within 1.3 °C. The equivalent thermal conductivity reached 5.01 × 10⁴ W/(m·K) when the temperature difference between the air and water side was 13 °C.
(3) The maximum pressure drop of the air side was 339.8 Pa, and the maximum pressure drop of the water side was 8.86 kPa. The pressure drops of both sides were at a low level in the experiment.
(4) The comprehensive evaluation index j/f1/2 represented the comprehensive performance of heat transfer and resistance characteristics, which increased by 10.8% compared to the plate–fin heat exchanger.
(5) The MHPA-AWHE modules were proposed to be applied to a small DC in Beijing, and the method of energy saving analysis can be adopted for further application in DCs. During the annual hours analyzed, the shortest investment payback period was 2.3 years, and the control strategy was carried out. The critical temperature of the MHPA-AWHE system suitable for operation is 18.4 °C in Beijing. The annual power consumption after the transformation was reduced by 28.32% compared with that before the modification.

Author Contributions

Conceptualization, Y.Z. and Z.Q.; Methodology, Z.Q.; Software, H.J.; Validation, Z.Q. and R.R.; Formal Analysis, H.J.; Investigation, Z.L.; Resources, Y.Z.; Data Curation, H.J.; Writing—Original Draft Preparation, H.J.; Writing—Review & Editing, Z.Q.; Supervision, Y.Z.; Project Administration, Z.Q.; Funding Acquisition, Z.Q.; Investigation and Validation, L.W. All authors have read and agreed to the published version of the manuscript.

Funding

This research was funded by the National Natural Science Foundation of China—Optimization design method of BIPV/T and solar heat pump coupled energy supply system. Grant number 51778010.

Conflicts of Interest

The authors declare no conflict of interest.

Nomenclature

AWHEair–water heat exchangerDequivalent diameter of fin: m
MHPAmicro-heat pipe arrayllength of single fin, m
EEREnergy efficiency ratioYpayback period, year
ACair conditionerIinitial investment
DCdata centerB1power consumption before the transformation, kWh
PFTparallel flow tubeB2power consumption after the transformation, kWh
NTUnumber of transfer unitsGreek symbols
Ppower consumption, Wαcommercial electricity price, RMB/kWh
Fheat flux, W/cm2
Nnumberλthermal conductivity, W/(m·K)
cpspecific heat capacity, J/(kg·K)ρdensity, kg/m3
qvvolume flow rate, m3/sΔβheat loss rate
ttemperature, °Cεheat exchanger efficiency
Qheat transfer rate, Wδthickness, m
Q0cooling load, kW
Aarea, m2Subscripts
Prprandtl numberwwater side
ΔPpressure drop, Paaair side
Cquantity of specific heat capacity, W/Kiinlet
ooutlet
jHeat transfer factorscross-section
fFriction factorminminimum
Rthermal resistance, K/Wmaxmaximum
ReReynolds numberpparallel flow tube
vvelocity, m/seEvaporation section of MHPA
hconvective heat transfer coefficient, W/(m2·K)cCondensation section of MHPA
rcontact section
KHeat transfer coefficient, W/(m2·K)ininner surface
outouter surface

References

  1. Hong, T.; Yang, L.; Hill, D.; Feng, W. Data and analytics to inform energy retrofit of high performance buildings. Appl. Energy 2014, 126, 90–106. [Google Scholar] [CrossRef] [Green Version]
  2. Beitelmal, A.H.; Patel, C.D. A steady–state model for the design and optimization of a centralized cooling system. Int. J. Energy Res. 2010, 34, 1239–1248. [Google Scholar] [CrossRef]
  3. Stein, J. Waterside economizing in data Centers: design and control considerations. ASHRAE Trans. 2009, 115, 192–200. [Google Scholar]
  4. Alanazi, S.; Dabbagh, M.; Hamdaoui, B.; Guizani, M.; Zorba, N. Reducing Data Center Energy Consumption Through Peak Shaving and Locked–In Energy Avoidance. IEEE Trans. Green Commun. Netw. 2017, 1, 551–562. [Google Scholar] [CrossRef]
  5. Zhang, X.; Lindberg, T.; Xiong, N.; Vyatkin, V.; Mousavi, A. Cooling Energy Consumption Investigation of Data Center IT Room with Vertical Placed Server. Energy Procedia 2017, 105, 2047–2052. [Google Scholar] [CrossRef]
  6. Tian, H.; He, Z.; Li, Z. A combined cooling solution for high heat density data centers using multi–stage heat pipe loops. Energy Build. 2015, 94, 177–188. [Google Scholar] [CrossRef]
  7. He, Z.; Ding, T.; Liu, Y.; Li, Z. Analysis of a district heating system using waste heat in a distributed cooling data center. Appl. Therm. Eng. 2018, 141, 1131–1140. [Google Scholar] [CrossRef]
  8. Oró, E.; Depoorter, V.; Pflugradt, N.; Salom, J. Overview of direct air free cooling and thermal energy storage potential energy savings in data centres. Appl. Therm. Eng. 2015, 85, 100–110. [Google Scholar] [CrossRef]
  9. Lee, K.P.; Chen, H.L. Analysis of energy saving potential of air–side free cooling for data centers in worldwide climate zones. Energy Build. 2013, 64, 103–112. [Google Scholar] [CrossRef]
  10. Ham, S.W.; Park, J.S.; Jeong, J.W. Optimum supply air temperature ranges of various air–side economizers in a modular data center. Appl. Therm. Eng. 2015, 77, 163–179. [Google Scholar] [CrossRef]
  11. Cho, J.; Lim, T.; Kim, B.S. Viability of datacenter cooling systems for energy efficiency in temperate or subtropical regions: Case study. Energy Build. 2012, 55, 189–197. [Google Scholar] [CrossRef]
  12. Deymi–Dashtebayaz, M.; Namanlo, S.V.; Arabkoohsar, A. Simultaneous use of air–side and water–side economizers with the air source heat pump in a data center for cooling and heating production. Appl. Therm. Eng. 2019, 161, 114–133. [Google Scholar] [CrossRef]
  13. Iyengar, M.; Kamath, V. Energy efficient economizer based data centers with air cooled servers. In Proceedings of the Thermal & Thermomechanical Phenomena in Electronic Systems, San Diego, CA, USA, 30 May–1 June 2012. [Google Scholar]
  14. Fan, W.; Georgios, K.; Ma, Z. Integrative modelling and optimization of a desiccant cooling system coupled with a photovoltaic thermal–solar air heater. Sol. Energy 2019, 193, 929–947. [Google Scholar] [CrossRef]
  15. Kim, M.H.; Ham, S.W.; Park, J.S.; Jeong, J.W. Impact of integrated hot water cooling and desiccant assisted evaporative cooling systems on energy savings in a data center. Energy 2014, 78, 384–396. [Google Scholar] [CrossRef]
  16. Ren, H.; Ma, Z.; Stefan, G. Characterisation and evaluation of a new phase change enhanced working solution for liquid desiccant cooling systems. Appl. Therm. Eng. 2019, 150, 1197–1205. [Google Scholar] [CrossRef]
  17. Durand-Estebe, B.; Le Bot, C.; Mancos, J.N.; Arquis, E. Simulation of a temperature adaptive control strategy for an IWSE economizer in a data center. Appl. Energy 2014, 134, 45–56. [Google Scholar] [CrossRef]
  18. Wang, C.C.; Tao, W.H.; Chang, C.J. An investigation of the airside performance of the slit fin–and–tube heat exchangers. Int. J. Refrig. 1999, 22, 595–603. [Google Scholar] [CrossRef]
  19. Wang, C.C.; Lee, C.J.; Chang, C.T.; Lin, S.P. Heat transfer and friction correlation for compact louvered fin–and–tube heat exchangers. Int. J. Heat Mass Transf. 1998, 42, 1945–1956. [Google Scholar] [CrossRef]
  20. Wang, C.C.; Chi, K.Y.; Chang, Y.J.; Chang, Y.P. An experimental study of heat transfer and friction characteristics of typical louver fin–and–tube heat exchangers. Int. J. Heat Mass Transf. 1998, 41, 817–822. [Google Scholar] [CrossRef]
  21. Hsieh, C.T.; Jang, J.Y. Parametric study and optimization of louver finned–tube heat exchangers by Taguchi method. Appl. Therm. Eng. 2012, 42, 101–110. [Google Scholar] [CrossRef]
  22. Tao, W.Q.; Cheng, Y.P.; Lee, T.S. 3D numerical simulation on fluid flow and heat transfer characteristics in multistage heat exchanger with slit fins. Heat Mass Transf. 2007, 44, 125–136. [Google Scholar] [CrossRef]
  23. Zhu, D.D.; Yan, D.; Li, Z. Modelling and applications of annual energy–using simulation module of separated heat pipe heat exchanger. Energy Build. 2013, 57, 26–33. [Google Scholar] [CrossRef]
  24. Yue, C.; Zhang, Q.; Zhai, Z.; Ling, L. Numerical investigation on thermal characteristics and flow distribution of a parallel micro–channel separate heat pipe in data center. Int. J. Refrig. 2019, 98, 150–160. [Google Scholar] [CrossRef]
  25. Bai, Y.; Wang, L.; Zhang, S.; Xie, N.; Chen, H. Heat transfer characteristics of a natural circulation separate heat pipe under various operating conditions. Int. J. Heat Mass Transf. 2018, 126, 191–200. [Google Scholar] [CrossRef]
  26. Zhang, L.; Liu, Y.; Liu, X.; Meng, X.; Guo, X.; Zhang, L. Experimental Investigation of Gravity Heat Pipe Exchanger Applied in Communication Base Station. Procedia Eng. 2015, 121, 1326–1333. [Google Scholar] [CrossRef] [Green Version]
  27. Liu, D.; Tang, G.F.; Zhao, F.Y.; Wang, H.Q. Modeling and experimental investigation of looped separate heat pipe as waste heat recovery facility. Appl. Therm. Eng. 2006, 26, 2433–2441. [Google Scholar] [CrossRef]
  28. Zhao, Y.H.; Zhang, K.R.; Diao, Y.H. Heat Pipe with Micro–Pore Tubes Array and Making Method Thereof and Heat Exchanging System. U.S. Patent No. 20,110,203,777, 25 August 2011. [Google Scholar]
  29. Zhang, J.; Diao, Y.H.; Zhao, Y.H.; Tang, X.; Yu, W.J.; Wang, S. Experimental study on the heat recovery characteristics of a new–type flat micro–heat pipe array heat exchanger using nano–fluid. Energy Convers. Manag. 2013, 75, 609–616. [Google Scholar] [CrossRef]
  30. Diao, Y.H.; Liu, J.R.; Wang, Y.; Zhao, Y.H. An Experimental Investigation on Heat Transfer Characteristics for Micro–Capillary Evaporator. J. Eng. Thermophys. 2009, 22, 87–98. [Google Scholar] [CrossRef]
  31. Ye, X.; Zhao, Y.; Quan, Z. Thermal management system of lithium–ion battery module based on micro heat pipe array. Int. J. Energy Res. 2018, 42, 648–655. [Google Scholar] [CrossRef]
  32. Wang, Z.; Diao, Y.; Zhao, Y.; Liang, L.; Wang, T. Experimental study on the new type of electrical storage heater based on flat micro–heat pipe arrays. Sci. China Technol. Sci. 2018, 61, 219–231. [Google Scholar] [CrossRef]
  33. Wang, G.; Quan, Z.; Zhao, Y.; Wang, H. Performance of a flat–plate micro heat pipe at different filling ratios and working fluids. Appl. Therm. Eng. 2019, 146, 459–468. [Google Scholar] [CrossRef]
  34. Diao, Y.H.; Liang, L.; Kang, Y.M.; Zhao, Y.H.; Wang, Z.Y.; Zhu, T.T. Experimental study on the heat recovery characteristic of a heat exchanger based on a flat micro–heat pipe array for the ventilation of residential buildings. Energy Build. 2017, 152, 448–457. [Google Scholar] [CrossRef]
  35. Yan, D.; Xie, X.N.; Song, F.T.; Jiang, Y. Building environment design simulation software DeST (1): An overview of developments and information of building simulation and DeST. HV AC 2004, 34, 48–56. [Google Scholar]
  36. Manglik, R.M.; Bergles, A.E. Heat transfer and pressure drop correlations for the rectangular offset strip fin compact heat exchanger. Exp. Therm. Fluid Sci. 1995, 10, 171–180. [Google Scholar] [CrossRef]
  37. Lv, J.X.; Wang, T.J.; Zhao, L.; Wang, J.H.; Hu, L.W.; Liu, G.H.; Zhao, S.B. Energy saving analysis of data center air conditioning system based on application of natural cooling technology. J. Refrig. 2018, 37, 113–118. [Google Scholar]
Figure 1. Core heat transfer component of the micro-heat pipe arrays air–water heat exchanger (MHPA-AWHE).
Energies 13 00393 g001
Figure 2. MHPA-AWHE.
Energies 13 00393 g002
Figure 3. Schematic diagram of experimental system.
Energies 13 00393 g003
Figure 4. Photo of experimental system.
Energies 13 00393 g004
Figure 5. Distribution of the temperature measurement points.
Energies 13 00393 g005
Figure 6. Diagram of the heat transfer process.
Energies 13 00393 g006
Figure 7. Temperature position of the heat transfer unit.
Energies 13 00393 g007
Figure 8. Variation of Δβ with inlet water temperature under different air flow rates.
Energies 13 00393 g008
Figure 9. Variation of Δβ with inlet water temperature under different water flow rates.
Energies 13 00393 g009
Figure 10. Variation of heat transfer rate under different air flow rates.
Energies 13 00393 g010
Figure 11. Variation of heat transfer rate under different water flow rates.
Energies 13 00393 g011
Figure 12. Variation of heat transfer rate and ha.
Energies 13 00393 g012
Figure 13. Variation of heat transfer rate and hw.
Energies 13 00393 g013
Figure 14. ε-NTU plots and fitting curves under different specific heat capacity ratios.
Energies 13 00393 g014
Figure 15. Temperature distribution of core components (Tw,in = 15 °C).
Energies 13 00393 g015
Figure 16. Temperature distribution of the core components (Tw,in = 5 °C).
Energies 13 00393 g016
Figure 17. Distribution of temperature and heat resistance (Tw,in = 5 °C).
Energies 13 00393 g017
Figure 18. Distribution of temperature and heat resistance (Tw,in = 15 °C).
Energies 13 00393 g018
Figure 19. Pressure drop and power consumption of air side.
Energies 13 00393 g019
Figure 20. Pressure drop and power consumption of water side.
Energies 13 00393 g020
Figure 21. Distribution of (a) heat transfer factor j and (b) friction factor f for different Re.
Energies 13 00393 g021
Figure 22. Distribution of comprehensive performance index j/f1/2 for different Re.
Energies 13 00393 g022
Figure 23. Architectural plan and perspective of the case study data center (DC).
Energies 13 00393 g023
Figure 24. Annual hourly (a) outdoor environment temperatures and (b) cooling load of Beijing.
Energies 13 00393 g024
Figure 25. Payback period under different conditions.
Energies 13 00393 g025
Figure 26. Annual hourly energy efficiency ratio (EER) of DCs before and after the transformation.
Energies 13 00393 g026
Figure 27. Annual hourly cooling capacity of DCs after the transformation.
Energies 13 00393 g027
Figure 28. Annual hourly power consumption of DCs before and after the transformation.
Energies 13 00393 g028
Table 1. Information of experimental instruments.
InstrumentModelWorking ScaleAccuracyNumber
Frequency conversion pumpCHL2-306–15 m1
Centrifugal fanPopular9-1.5 kW0–3200 m3/h1
Flow meterMFM-150–3 m3/h0.5%1
Data loggerAgilent 34970A0–300 V1
Thermal resistorPT1000–150 °C±0.1 °C2
ThermocoupleT-Dot contact−35–105 °C±0.1 °C60
Differential pressure Transmitter (air side)3351DP5SM30–30 kPa0.5%1
Different pressure Transmitter (water side)3351DP5SM50–50 kPa0.5%1
Power MonitorHY-0010–10 A1%1
Table 2. Uncertainty of the main parameter variables.
Physical QuantityNumerical RangeRelative Uncertainty
Qa632–9298 W±3.16–6.61%
Qw695–8738 W±3.13–6.30%
Δβ2.6–13.8%±2.17–6.11%
ε51.1–90.0%±2.87–6.36%
γ6.65–24.42±3.01–5.71%
j0.014–0.037±2.32–5.18%
f0.206–0.079±2.23–4.72%
Table 3. Fitting equations of ε-NTU.
CurvesCmin/CmaxFitting Equation of ε-NTUVariance/R2
Curve 10.25 ε = 1.53 e ( N T U / 0.603 ) + 0.849 0.9698
Curve 20.5 ε = 0.9654 e ( N T U / 0.9256 ) + 0.878 0.99658
Curve 30.75 ε = 1.34 e ( N T U / 0.66 ) + 0.781 0.99956
Curve 41 ε = 1.449 e ( N T U / 0.63 ) + 0.745 0.99995
Table 4. Performance of two kinds of heat exchangers based on MHPA.
Type of Heat ExchangerVelocity of Air Flow (m/s)Inlet Temperature Difference (°C)Heat Flux (W/cm2)Equivalent Thermal Conductivity (W/(m·K))
Air–air heat exchanger based on MHPA0.9584.795.98 × 103
137.977.59 × 103
MHPA-AWHE0.9688.483.42 × 104
1313.035.01 × 104
Table 5. Control strategy of equipment in DCs after the transformation.
Environment TemperatureACMHPA-AWHE SystemHours (Total: 8760 h)
≤0.72 °COffOn1723 h (19.7%)
0.72–18.4 °COnOn3803 h (43.4%)
≥18.4 °COnOff3234 h (36.9%)