Article

Online Bearing Clearance Monitoring Based on an Accurate Vibration Analysis

1
School of Mechanical Engineering, Inner Mongolia University of Science and Technology, Baotou 014010, China
2
State Key Laboratory of Mechanical Transmission, Chongqing University, Chongqing 400044, China
3
Centre for Efficiency and Performance Engineering, University of Huddersfield, Huddersfield HD1 3DH, UK
4
School of Industrial Automation, Beijing Institute of Technology, Zhuhai 519088, China
*
Authors to whom correspondence should be addressed.
Energies 2020, 13(2), 389; https://doi.org/10.3390/en13020389
Submission received: 5 December 2019 / Revised: 1 January 2020 / Accepted: 8 January 2020 / Published: 13 January 2020

Abstract

:
Accurate diagnosis of incipient faults in wind turbine (WT) assets will provide sufficient lead time to apply an optimal maintenance for the expensive WT assets which often are located in a remote and harsh environment and their maintenance usually needs heavy equipment and highly skilled engineers. This paper presents an online bearing clearance monitoring approach to diagnose the change of bearing clearance, providing an early and interpretable indication of bearing health conditions. A novel dynamic load distribution method is developed to efficiently gain the general characteristics of vibration response of bearings without local defects but with small geometric errors. It shows that the ball pass frequency of outer race (BPFO) is the primary exciting source due to biased load distribution relating to bearing clearance. The geometric errors, including various orders of runouts on different bearing parts, can be the secondary excitation source. Both sources lead to compound modulation responses with very low amplitudes, being more than 20 dB lower than that of a small local defect on raceways and often buried by background noise. Then, Modulation Signal Bispectrum (MSB) is identified to purify the noisy signal and Gini index is introduced to represent the peakness of MSB results, thereby an interpretable indicator bounded between 0 and 1 is established to show bearing clearance status. Datasets from both a dedicated bearing test and a run-to-failure gearbox test are employed to verify the performance and reliability of the proposed approach. Results show that the proposed method is capable to indicate a change of about 20 µm in bearing clearance online, which provides a significantly long lead time compared to the diagnosis method that focuses only on local defects. Therefore, this method provides a big opportunity to implement more cost-effective maintenance works or carry out timely remedial actions to prolong the lifespan of bearings. Obviously, it is applicable to not only WT assets, but also most rotating machines.

1. Introduction

Bearing is one of the critical and precise components of rotating machinery. Due to various reasons, including normal wears and abnormal operations, faults and failures frequently occur, which influences not only the operational performance of machines, but also can often lead to interruption of productivity or even catastrophic disasters [1,2]. Especially with a rapid increase of wind turbine (WT) units, their fault rates and volumes are significantly high due to harsh operational environments, which leads to the high cost of WT maintenance [3,4,5]. To prevent these negative influences, great attention has been paid to developing effective bearing fault diagnosis techniques for many years, which have resulted in many useful tools, such as the most common vibration analysis based approach that is capable of detecting local defects in bearing race ways at early stages [6,7,8,9]. These tools provide good leading time for industries to take necessary and adequate maintenance actions to minimize down time and maintenance costs, consequently avoiding severe consequences and maximizing production.
Based on vibration analysis, a large volume of works has concentrated on developing techniques for accurate detection, diagnosis, and prognosis of the local defects on bearing raceways. In addition to the references of [6,7,8,9], significant progress is found in recent publications. A new method is presented in [10] to detect rolling bearing faults based on the local curve roughness. Considering the difficulty in extracting fault features from a rolling bearing vibration signal with strong background noises, a novel approach is presented in [11] to detect the weak fault signal of a rolling bearing, which is based on vibrational mode decomposition and phase space parallel factor analysis. A new model-based approach was suggested in [12] for the integrated fault diagnosis of WT bearings, especially in the cases with limited degradation data. In [13], the largest amplitude impact transients are based to denoise signal for more reliable detection of defected rolling elements, which is more challenging as the fault has a relative motion to the sensor. These works provide more effective data processing techniques to a great degree and result in success in detecting the local defects of interest.
Comparatively, limited works have been found that investigate tribology-focused techniques for early bearing fault diagnosis. Investigations show that various parts of the bearing inevitably suffer from wear and tear in their lifetime [14], which increases the radial clearance and shortens bearing life by about 30% [15]. Therefore, it can be more effective for early bearing condition monitoring if a tribological effect is taken into account. Pioneer works in [16,17] have verified the effectiveness of tribology-focused techniques in monitoring rolling bearings. An interesting study by Rehab et al. [18] investigated the impact of wear induced clearances on diagnostic characteristics, which confirms the general understanding of increased amplitudes with clearance for the outer race defects. However, a decreased amplitude has been found for the inner race defects, which is probably out of general understandings. Unfortunately, these efforts are still focusing on improving the performance of diagnosing local defects. In particular, there is no research on the subject of directly diagnosing the changes in bearing clearance.
To fill the gap, this paper proposes an online bearing clearance monitoring approach to monitoring the changes of bearing clearance. Firstly, the dynamic effect of a ball bearing under radial load is analytically studied to gain an understanding of vibration responses when there are no local defects on raceways. Then, the adequate data processing method: envelope analysis and modulation signal bispectrum (MSB) analysis are employed to accurately characterize the weak vibrations that are often submerged in noises. Furthermore, a novel indicator, denoted as an MSB-Gini index, is introduced to represent MSB results and taken as a quantitative measure for the change in bearing clearance. Finally, the analysis results including the data processing methods are verified by two experiments.

2. Modelling the Effect of Bearing Clearance on Vibrations

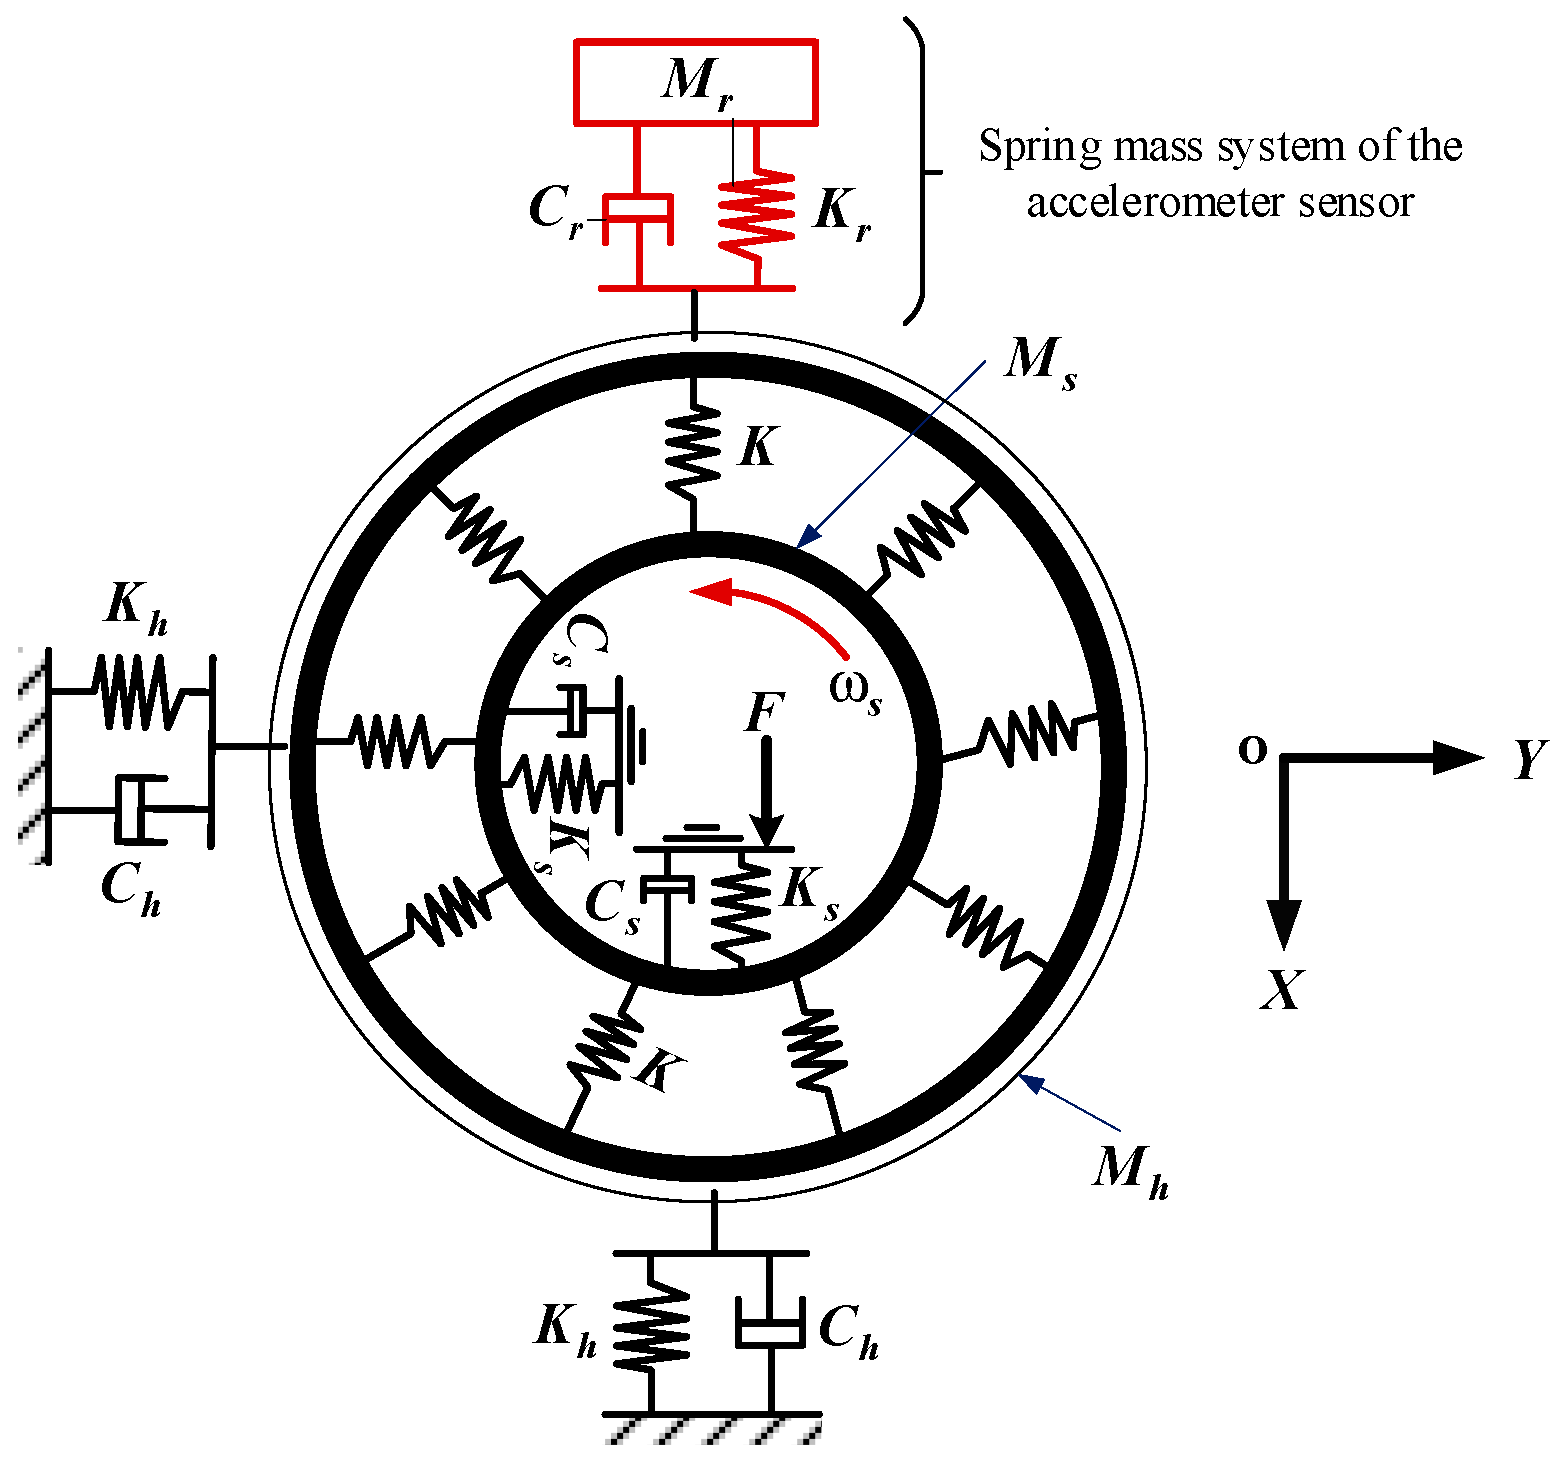
2.1. Bearing Vibration Model

For bearing fault detection, a vibration model is commonly developed for a typical shaft-house system, as shown in Figure 1 [18,19]. The model contains four Degrees of Freedom (DOFs), representing the motions of the shaft and the housing in the horizontal and vertical directions, respectively. In addition, it includes one additional DOF to represent the vibration sensor output in the vertical direction, whose parameters can be tuned to different values so as to show the magnification of structural resonances. To realize an efficient numerical simulation, the model is usually developed based on perfect bearing operation that does include various effects such as geometric errors and slippage.
The governing equations for the mass of the shaft, housing, and the sensor can be developed. According to the direction and coordinates of the motion shown in Figure 1, the bearing vibration model is presented in Equations (1)–(5), which correspond to vibrations in x and y directions for the shaft (subscripted as s ), housing (subscripted as h ), and sensor (subscribed as r ), respectively:
M s X s ¨ + C s X s ˙ + K s X s + i = 1 N b K [ δ i ] 3 / 2 c o s ϕ i = F ,
M s Y s ¨ + C s Y s ˙ + K s Y s + i = 1 N b K [ δ i ] 3 / 2 s i n ϕ i = 0 ,
M h X h ¨ + C h X h ˙ + K h X h i = 1 N b K [ δ i ] 3 / 2 c o s ϕ i = 0 ,
M h Y h ¨ + C h Y h ˙ + K h Y h i = 1 N b K [ δ i ] 3 / 2 s i n ϕ i = 0 ,
M r X r ¨ + C r X r ˙ + K r X r C h X h ˙ K h X h = 0 ,
where M s , M h and M r denote the mass of shaft, housing and sensor, respectively. In addition, K s , K h , and K r respectively represent the stiffness of shaft, housing, and sensor; C s , C h , and C r are the damping of shaft, housing, and sensor, respectively; K represents the contact stiffness, δ represents the nonlinear deformation and ϕ i denotes the ball position, and N b denotes the number of rolling elements. It can be seen in the model that the primary dynamic forces are:
F X = i = 1 N b K [ δ i ] 3 / 2 c o s ϕ i ,
F Y = i = 1 N b K [ δ i ] 3 / 2 s i n ϕ i ,
which are the main excitations that determine the vibration characteristics. Once the stiffness K is obtained according to bearing geometry parameters using Hertz contact theory, the forces are obtained based on the relative deformation δ i for each element:
δ i = ( X s X h ) c o s ϕ i + ( Y s Y h ) s i n ϕ i c ,
where c denotes radial clearance. Moreover, it shows that the model must be solved numerically for the relative displacements, respectively. This approach is very effective for understanding the vibration behavior when there is a defect on raceways as proved by many studies such as [18,19]. However, it usually takes considerable computing efforts to find the solutions, especially for this tribology-focused study, it can take much longer to have adequate solutions as it needs higher accuracy for non-defective case studies. Therefore, this study uses a load distribution based approach to gain the general dynamic behavior of bearings under different clearances.

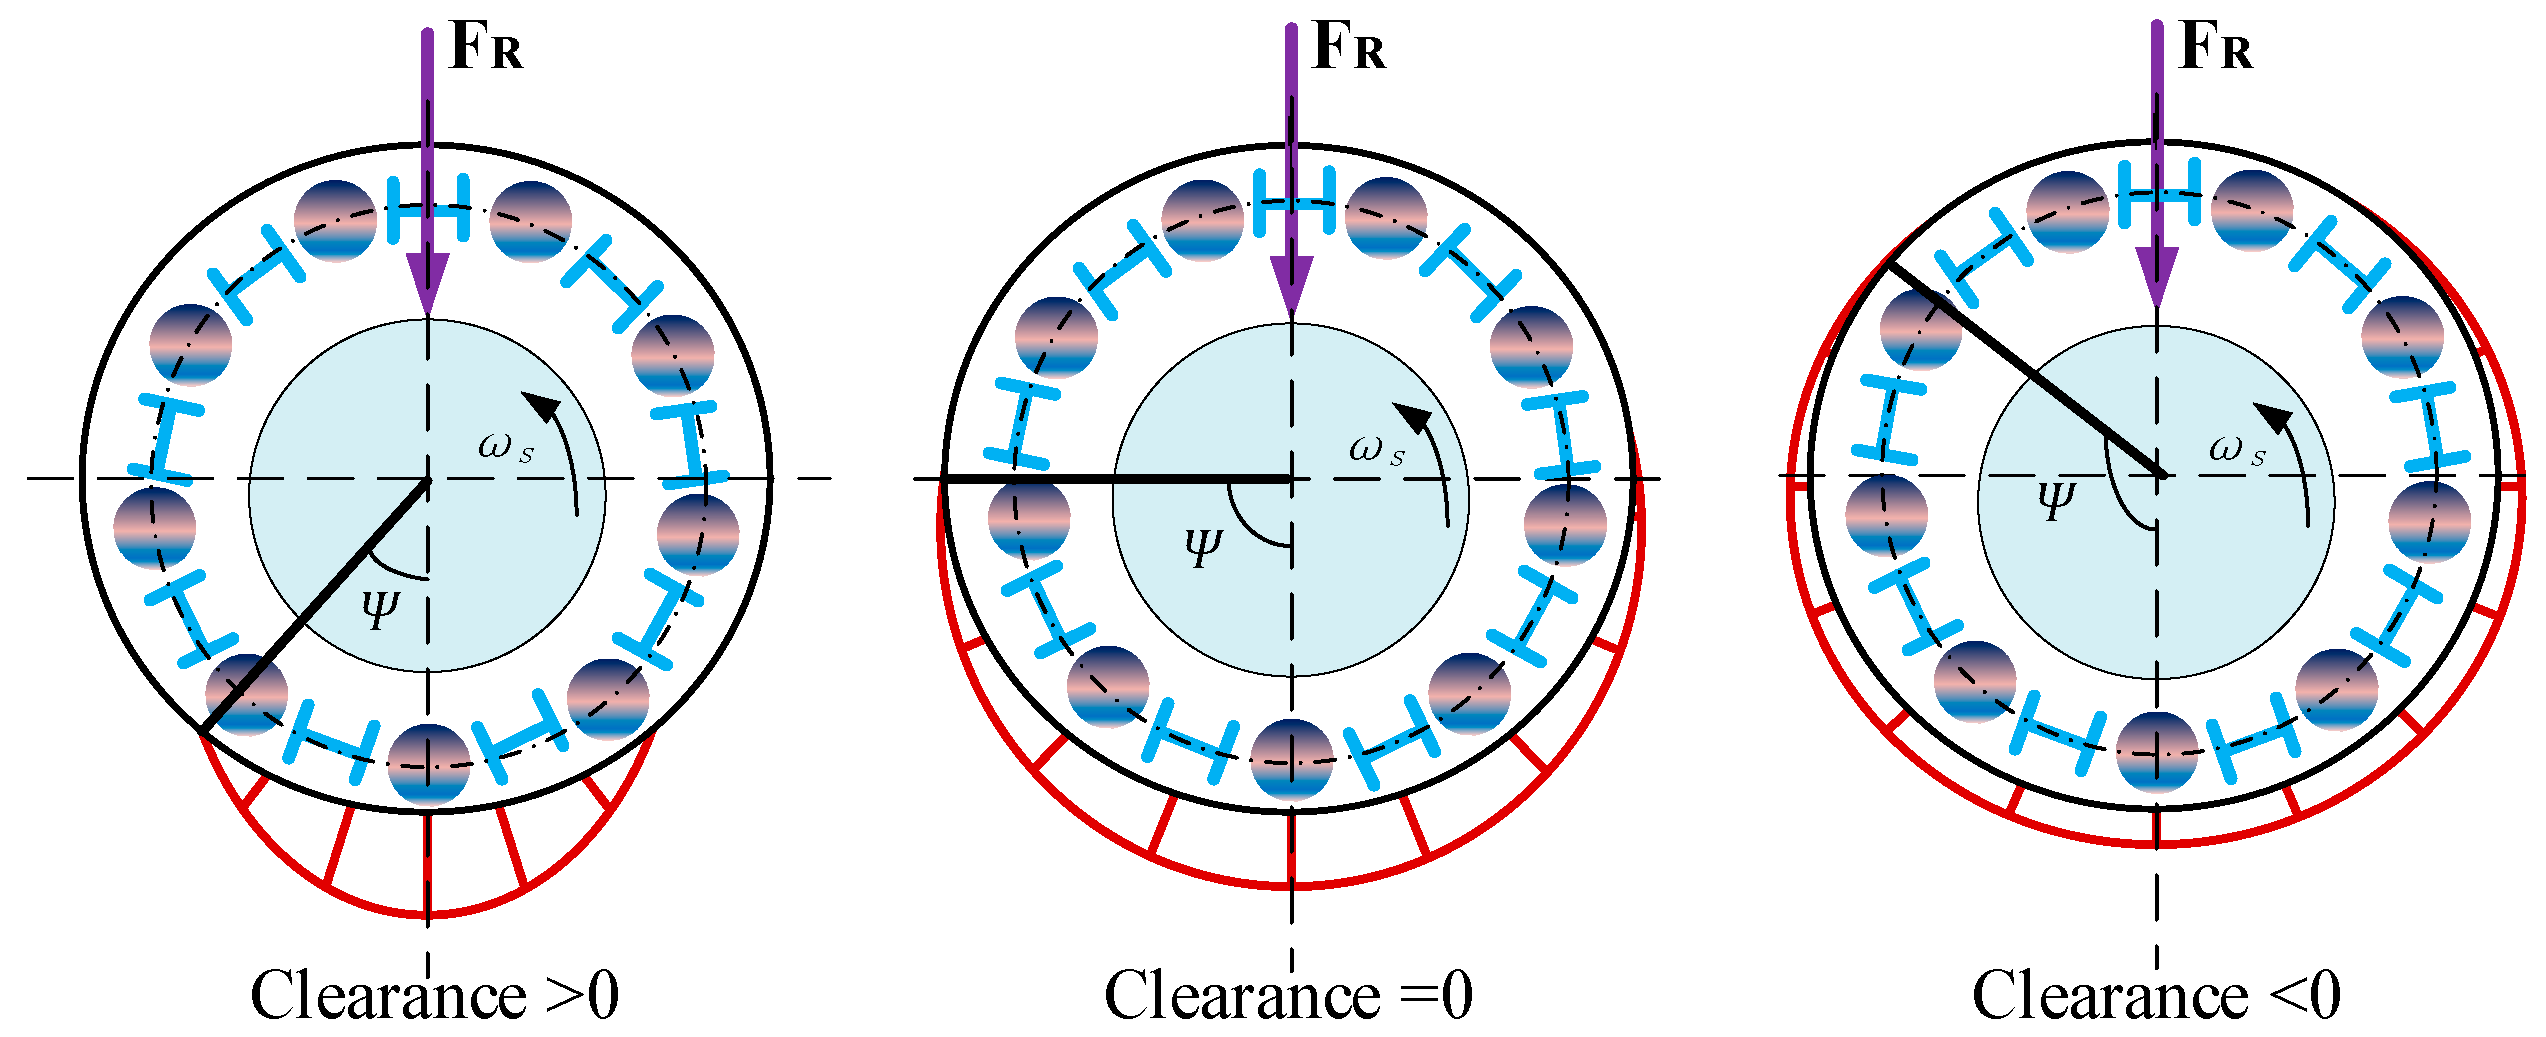
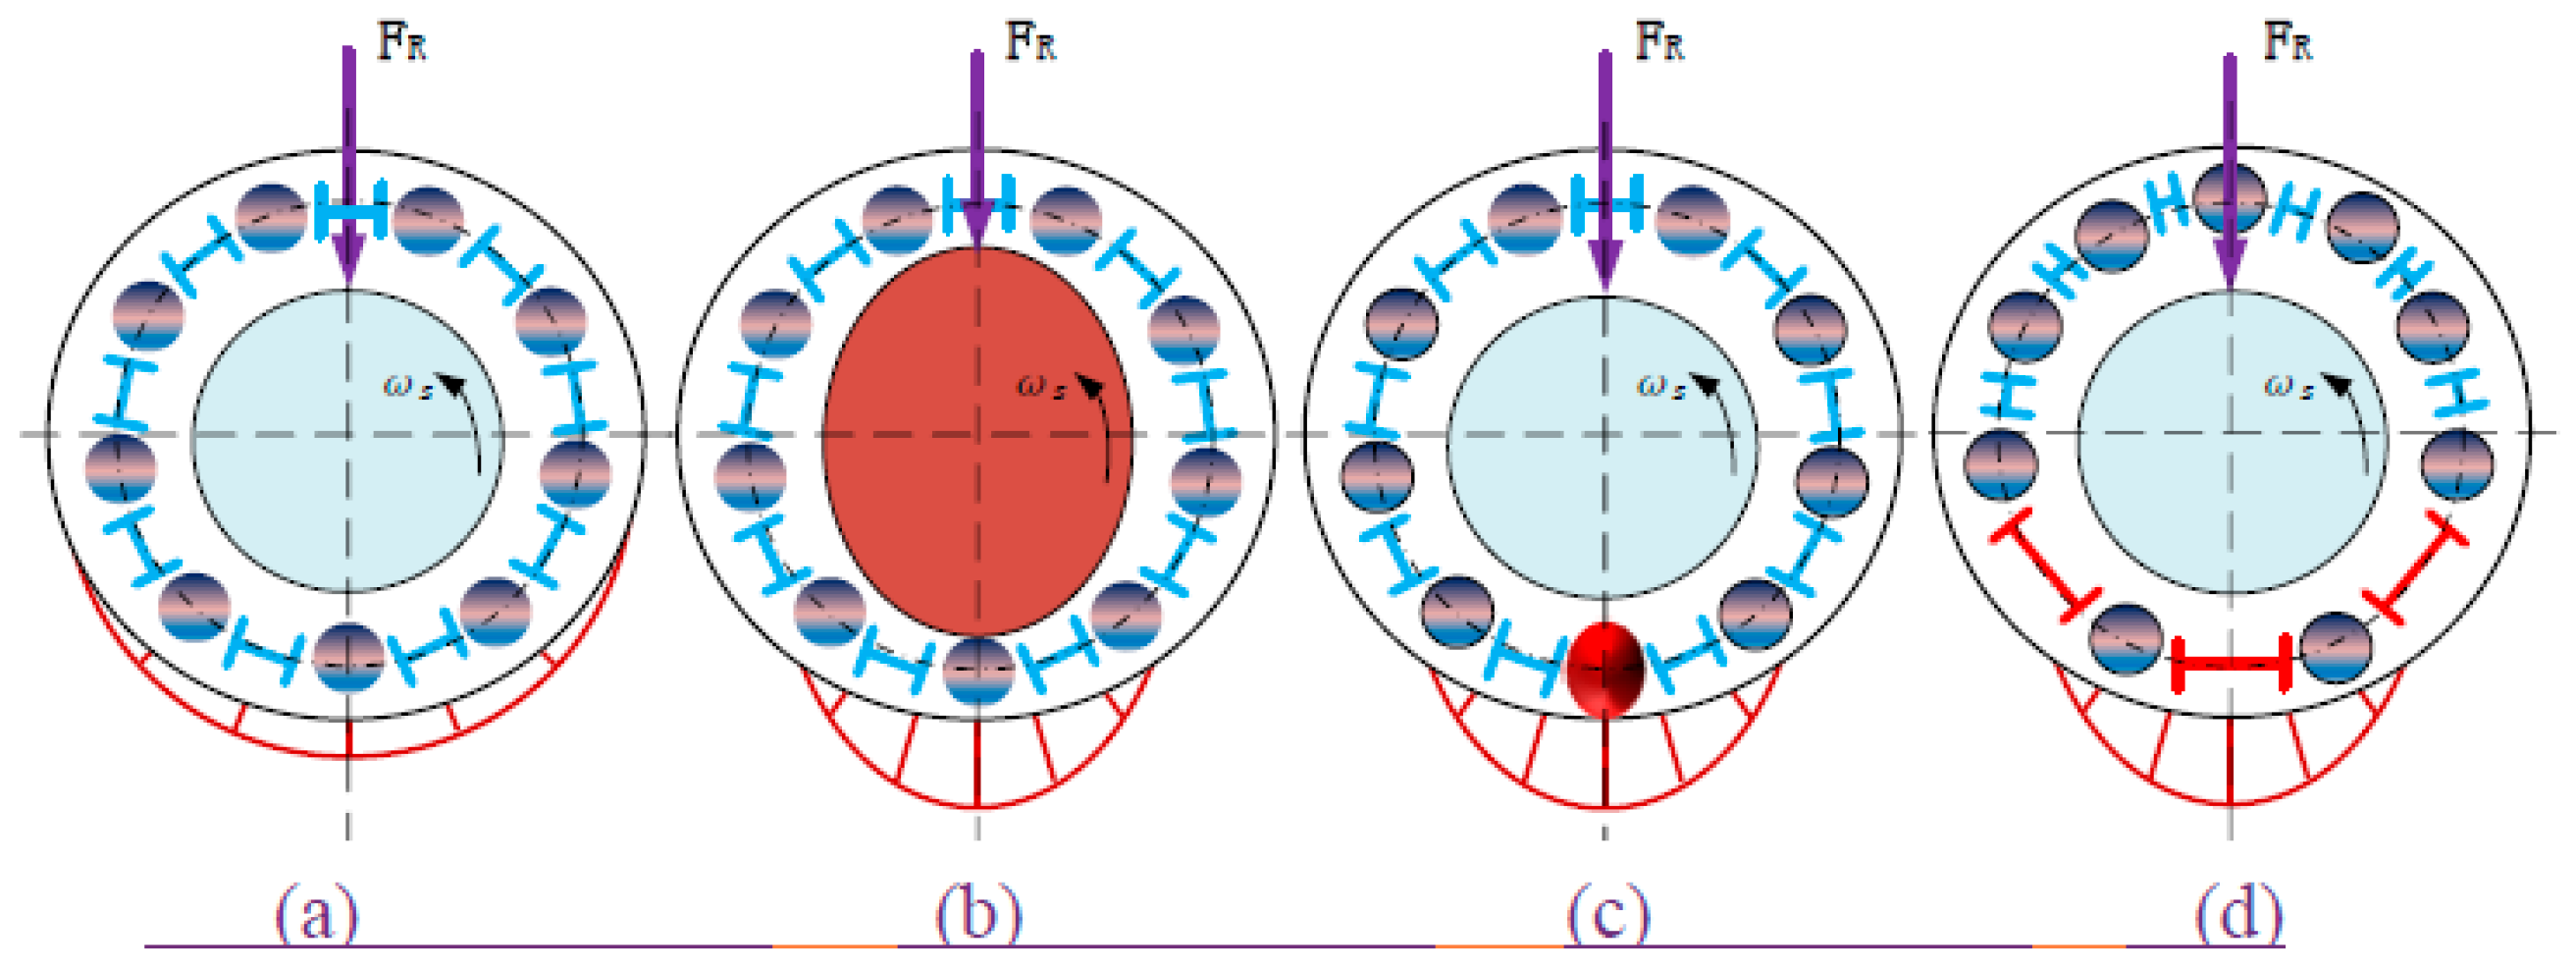
2.2. Radial Clearance and Load Distribution

Internal radial clearance is defined as the geometrical clearance between the outer race, inner race, and the ball, whereas radial clearance is the movement between the ball and the raceway, perpendicular to the bearing axis. The internal clearance significantly affects the thermal, vibrational, noise, and fatigue life of bearings. To extend the bearing’s lifetime and improve the machine’s reliability, it is expected that the internal clearance at operational conditions is as close to zero as possible. As the bearing ages, the clearance will increase due to the inevitable wear. Thus, for the purposes of fault detection and diagnosis, it is important to understand the effect of different clearances on characteristic vibration features.
As illustrated in Figure 2, the size of the stressed area of the rings, i.e., the load zone, is directly affected by changes in the bearing internal clearance. The smaller the clearance (or the more the preload), the more the rolling elements share the externally applied forces. Note that preload may reduce the lifetime of the bearing due to the increased fatigue stress in the rolling elements.
Figure 2 illustrates the load distribution for different bearing clearance conditions. When the external radial load F R is known, the load distribution can be determined in an angular position ψ of the loaded zone:
F ( ψ ) = k r ( ψ ) F R ,
where the load distribution factor is obtained according to the clearance and the extreme deformation δ 0 that is calculated when only one rolling element undertakes all the external load [20]:
k r ( ψ ) = ( 1 ( 1 + c 2 δ 0 ) ( 1 c o s ψ ) ) 3 2 z 2 π ψ 0 ψ 0 ( 1 ( 1 + c 2 δ 0 ) ( 1 c o s ψ ) ) 3 2 c o s ψ d ψ .
Figure 3 shows the load distribution characteristics at different ratios r = c 2 δ 0 . It can be seen that the maximum load becomes higher when increasing clearance c for a given δ 0 or external load. In the same way, the load also increases with increasing in δ 0 for a given clearance.
Supposing that there is a dynamic deformation by the load and introducing a deformation coefficient ϵ , the relative displacement of Equation (8) can be expressed as
δ i = δ i r c = ϵ k r ( ψ )   i F R c .
In this way, Equations (6) and (7) can be used to obtain a dynamic force function when K = 1 :
F x * = i = 1 N b [ ϵ k r ( ψ )   i F R c ] 3 / 2 c o s ϕ i ,
F y * = i = 1 N b [ ϵ k r ( ψ )   i F R c ] 3 / 2 s i n ϕ i ,
F r * = ( F x * ) 2 + ( F y * ) 2 ,
where the angular displacement ϕ i of i t h rolling element is a function of the previous element position ϕ 0 and cage speed ω c :
ϕ i = 2 π N b ( i 1 ) + ω c t + φ 0 , i = 1 , , N b .
For a slippage-free case, cage speed can be calculated from bearing geometry and shaft speed ω s :
ω c = ( 1 d b d p ) ω s 2 ,   ω s = 2 π f s ,
where f s is the shaft frequency, d b is ball diameter, and d p is pitch circle diameter.
With these equations, the dynamic force function for each element of a bearing with nine rolling elements can be calculated. Figure 4 illustrates the force function for two typical clearance cases. It can be seen that the force distribution becomes more impulsive due to the nonlinear effect of 3/2 power in Equations (12) and (13). Moreover, for the same external load, the dynamic forces are even more impulsive when clearance is larger, resulting in a higher dynamic load on raceways.
According to Equations (12)–(14), the combined forces can be obtained for three increment clearances, as shown in Figure 5, which presents the dynamic forces in both the time domain and frequency domain for the bearing with nine elements. For the ease of analysis, the cage speed is set at 1 Hz. It can be seen from the figure that
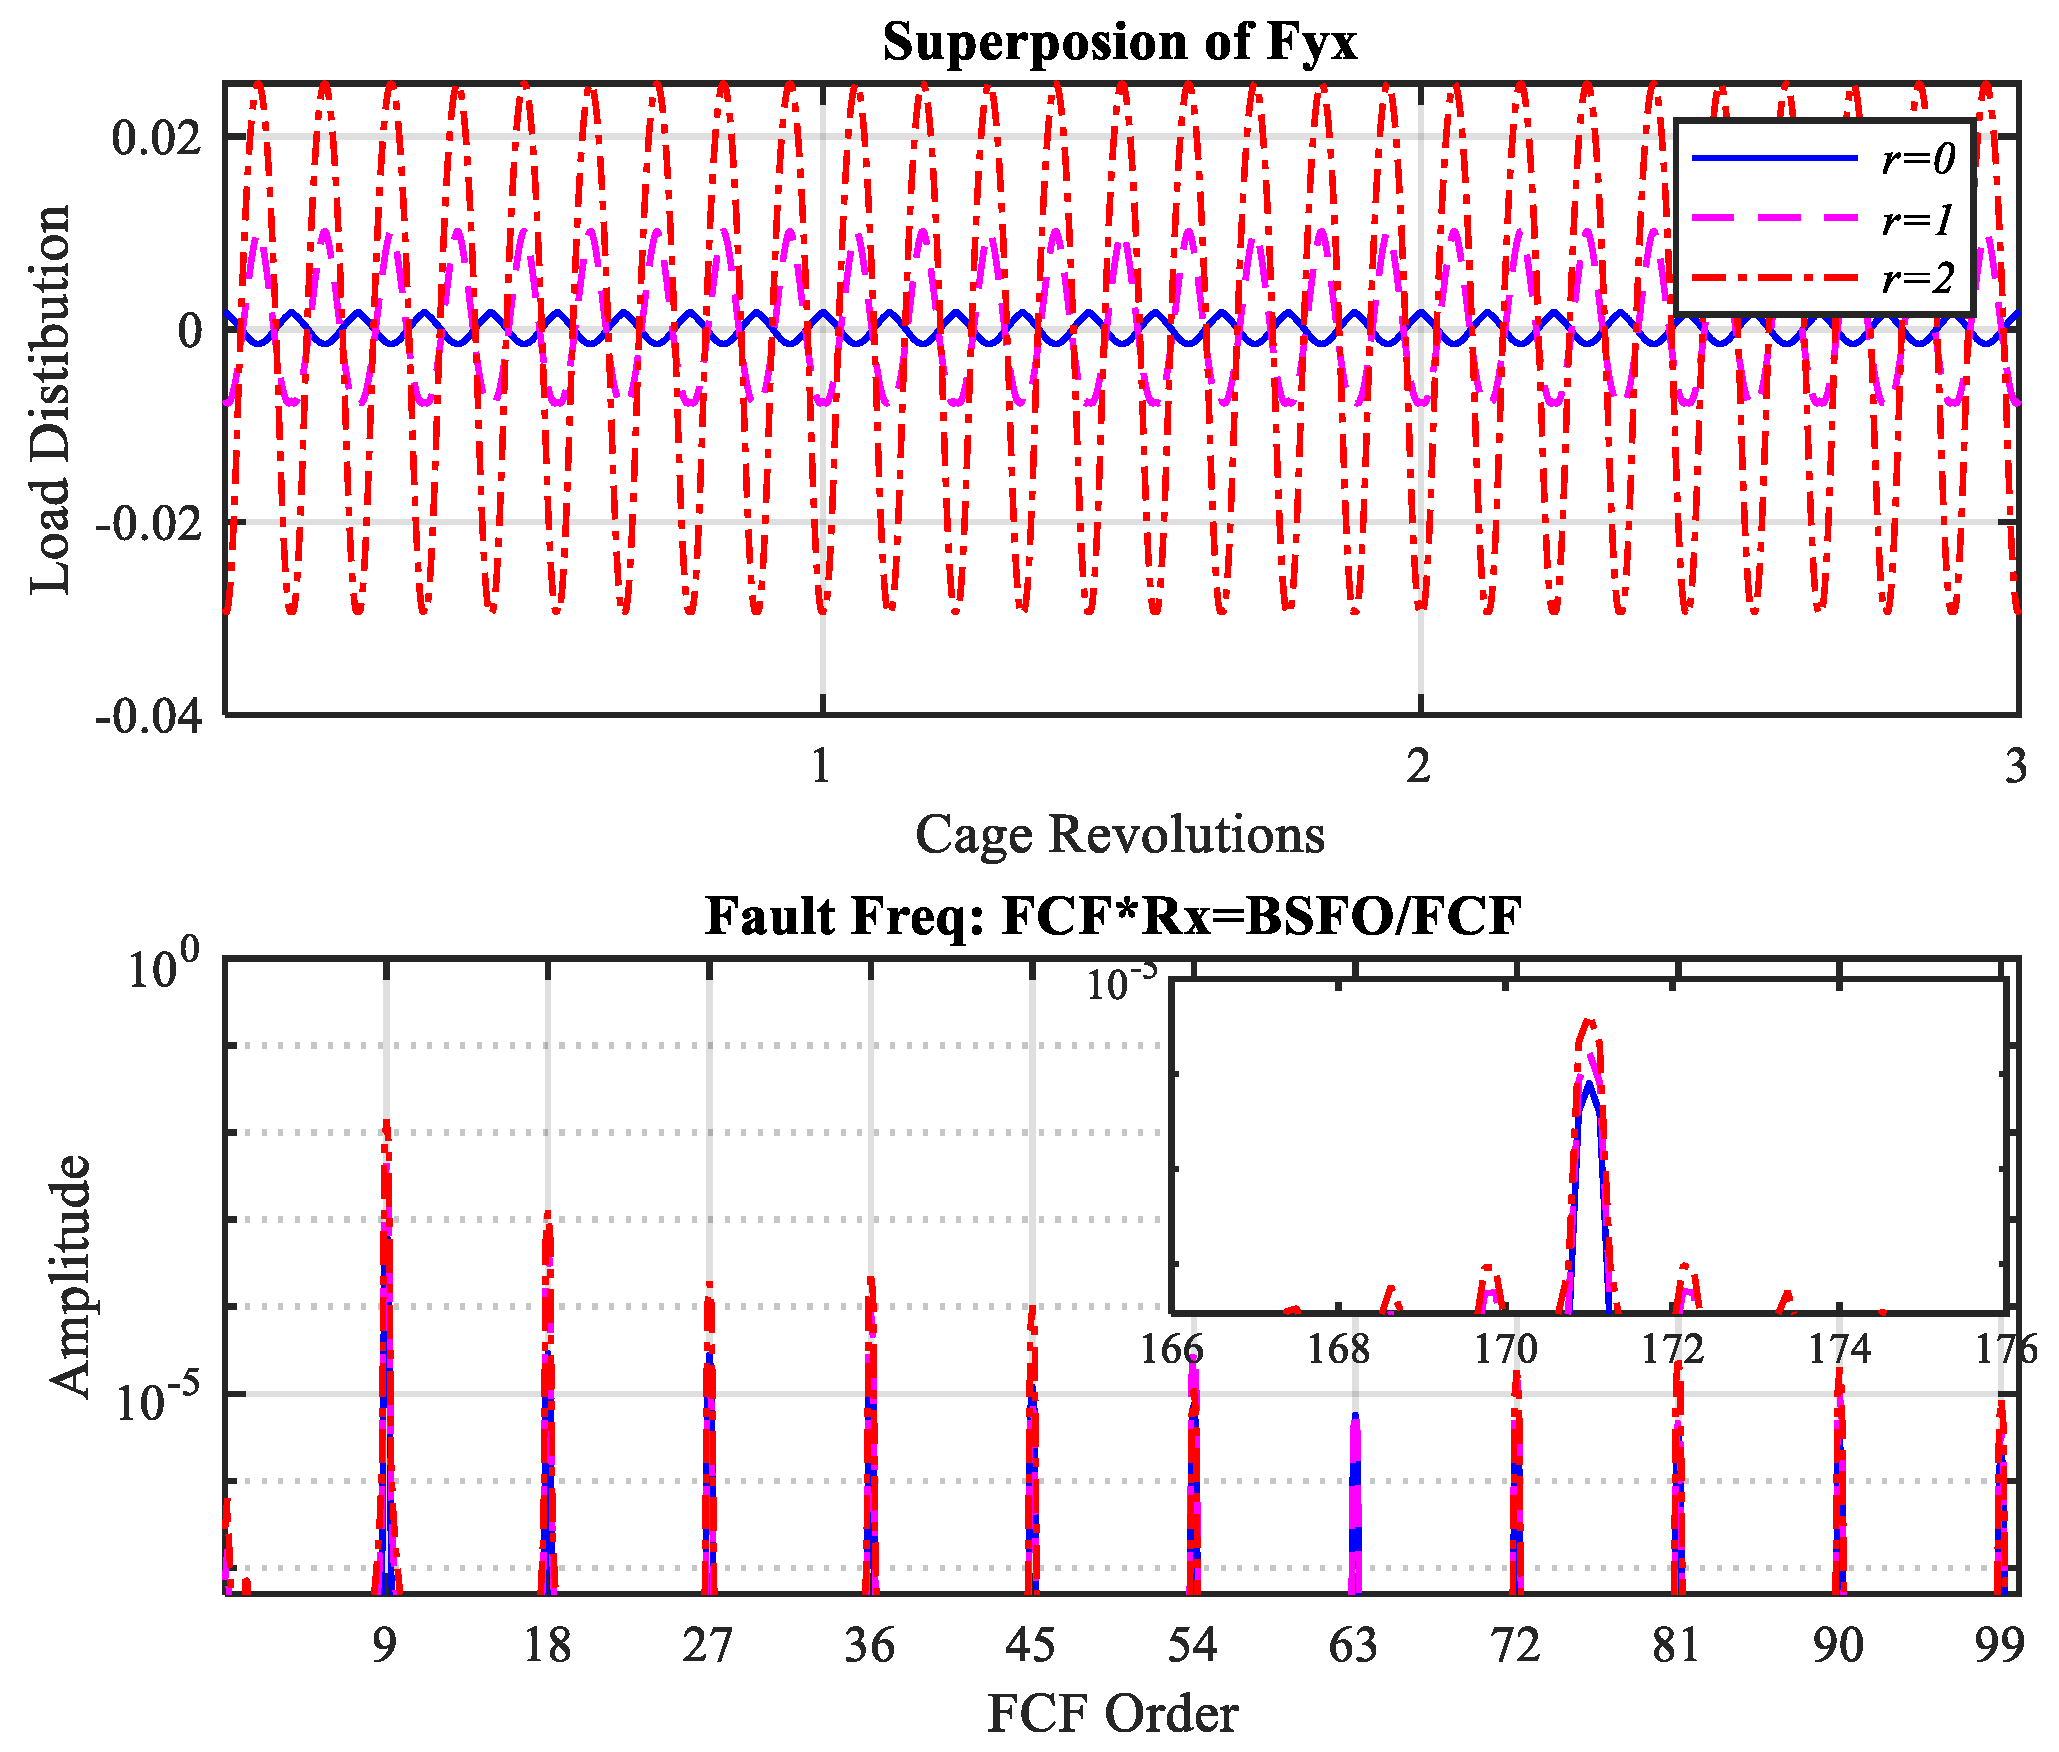
  • the forces exhibit a periodic waveform with the periodicity corresponding to the time that a ball passes the maximum load.
  • The force is also impulsive as it is linearly combined with the impulsive one, and thus the harmonics of Ball Pass Frequency of Outer race (BPFO) existed in a broad band, which can induce vibrations in the high frequency range where structural resonances are located.
  • Both characteristics become more significant with increased clearance, as shown in the magnified graph.
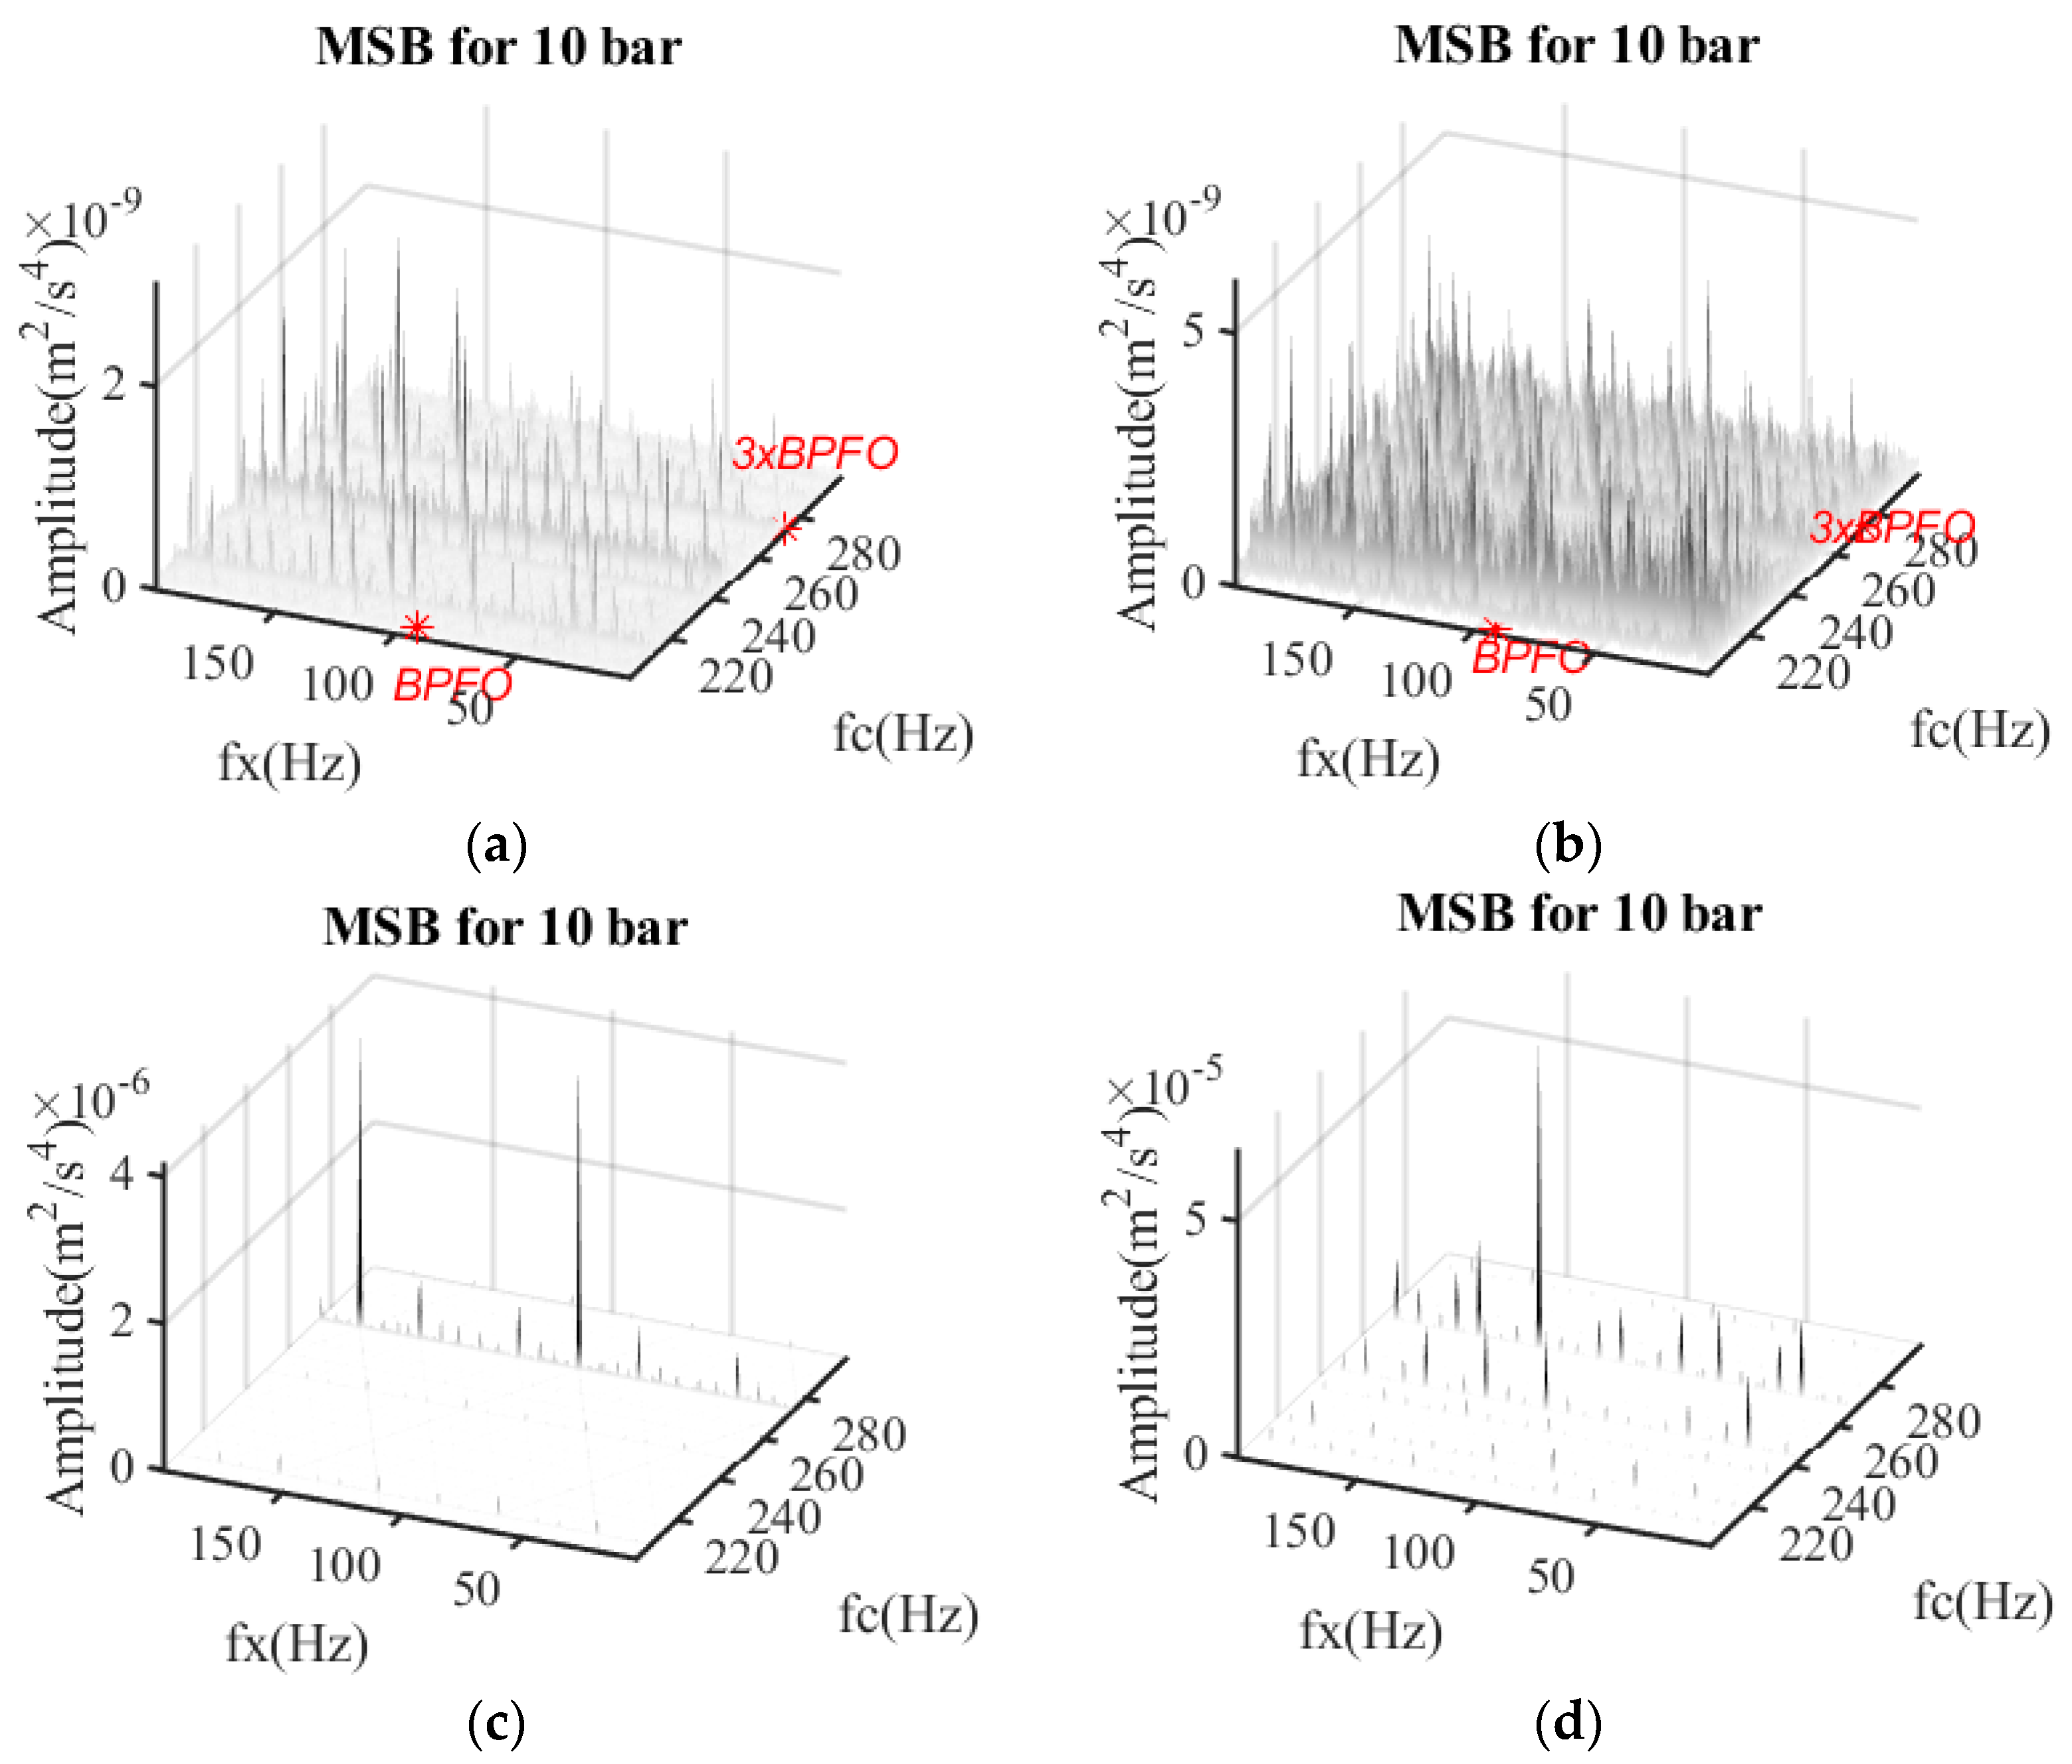
  • There are also modulation sidebands appearing at k × BPFO ± FCF (Fundamental Carrier Frequency) due to the power factor of 3/2, though the amplitudes are very low, as shown in the magnified spectra.
Moreover, it shows that a rolling element bearing will have instinct vibrations due to this foreseeable dynamic force; therefore, this force is known as the primary dynamic force to stress its differences from dynamic effects caused by various imperfections such as bearing geometric errors or eccentric installations which inevitably exist in practice.

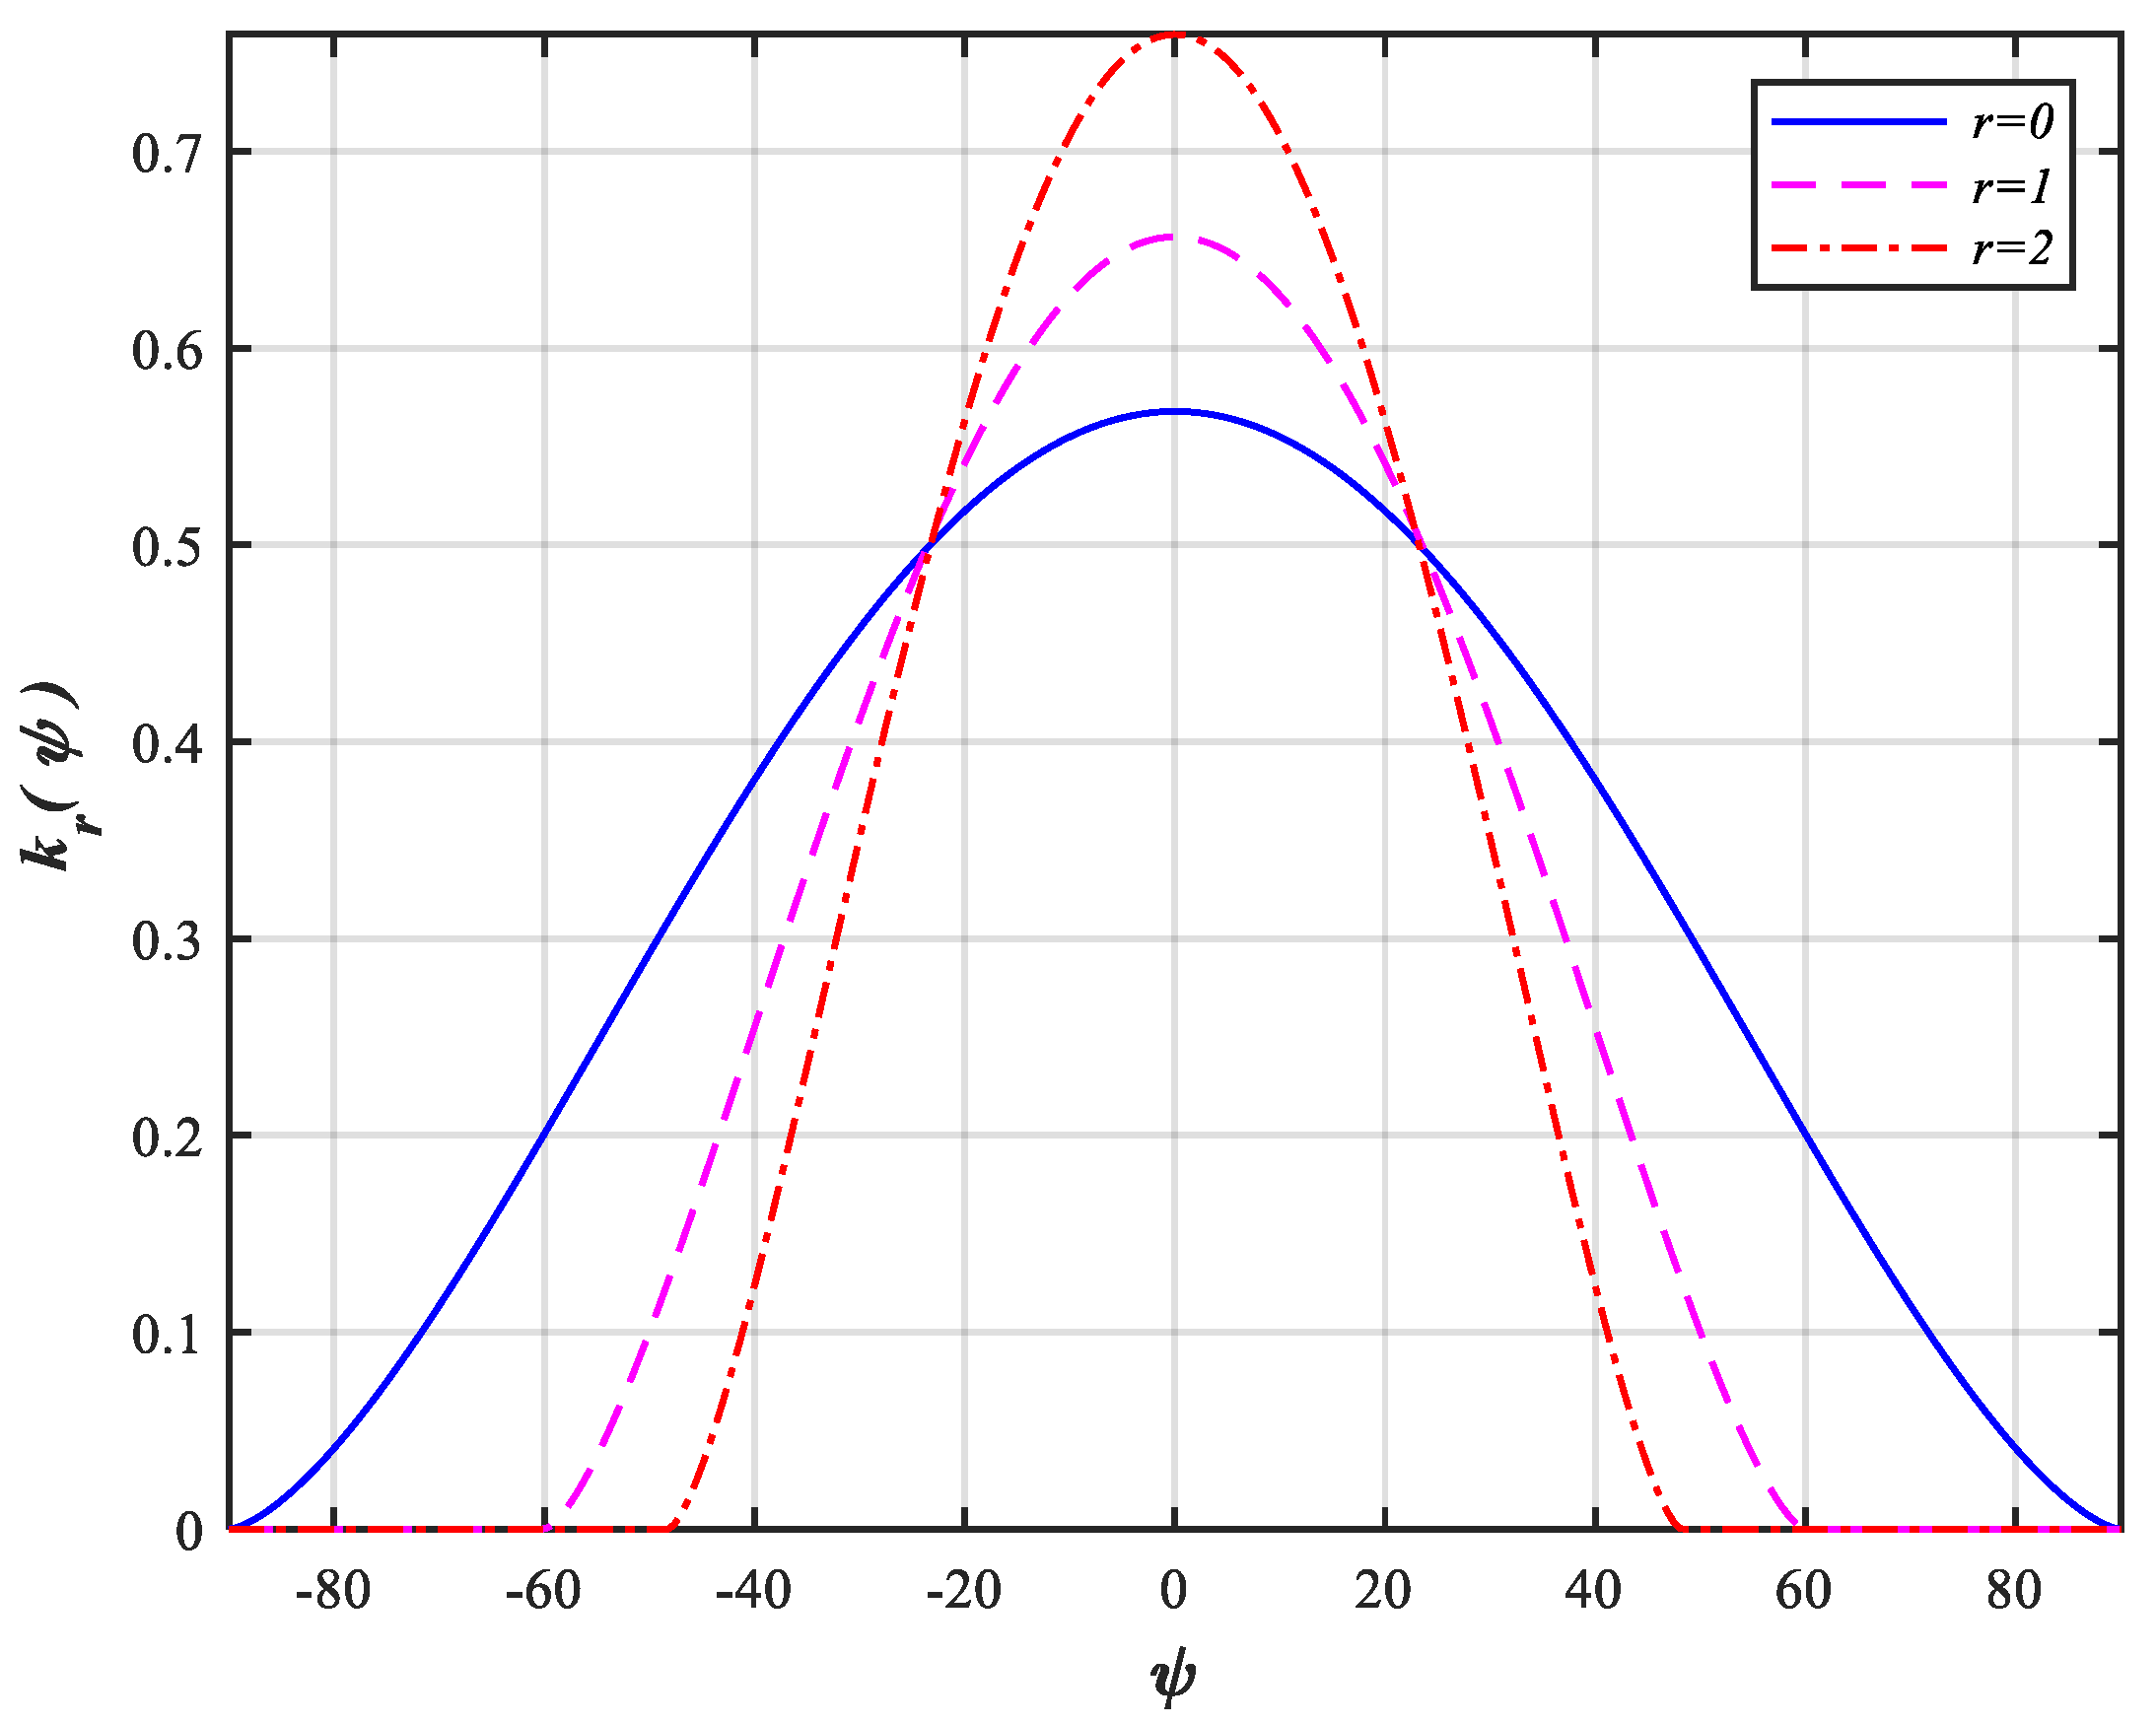
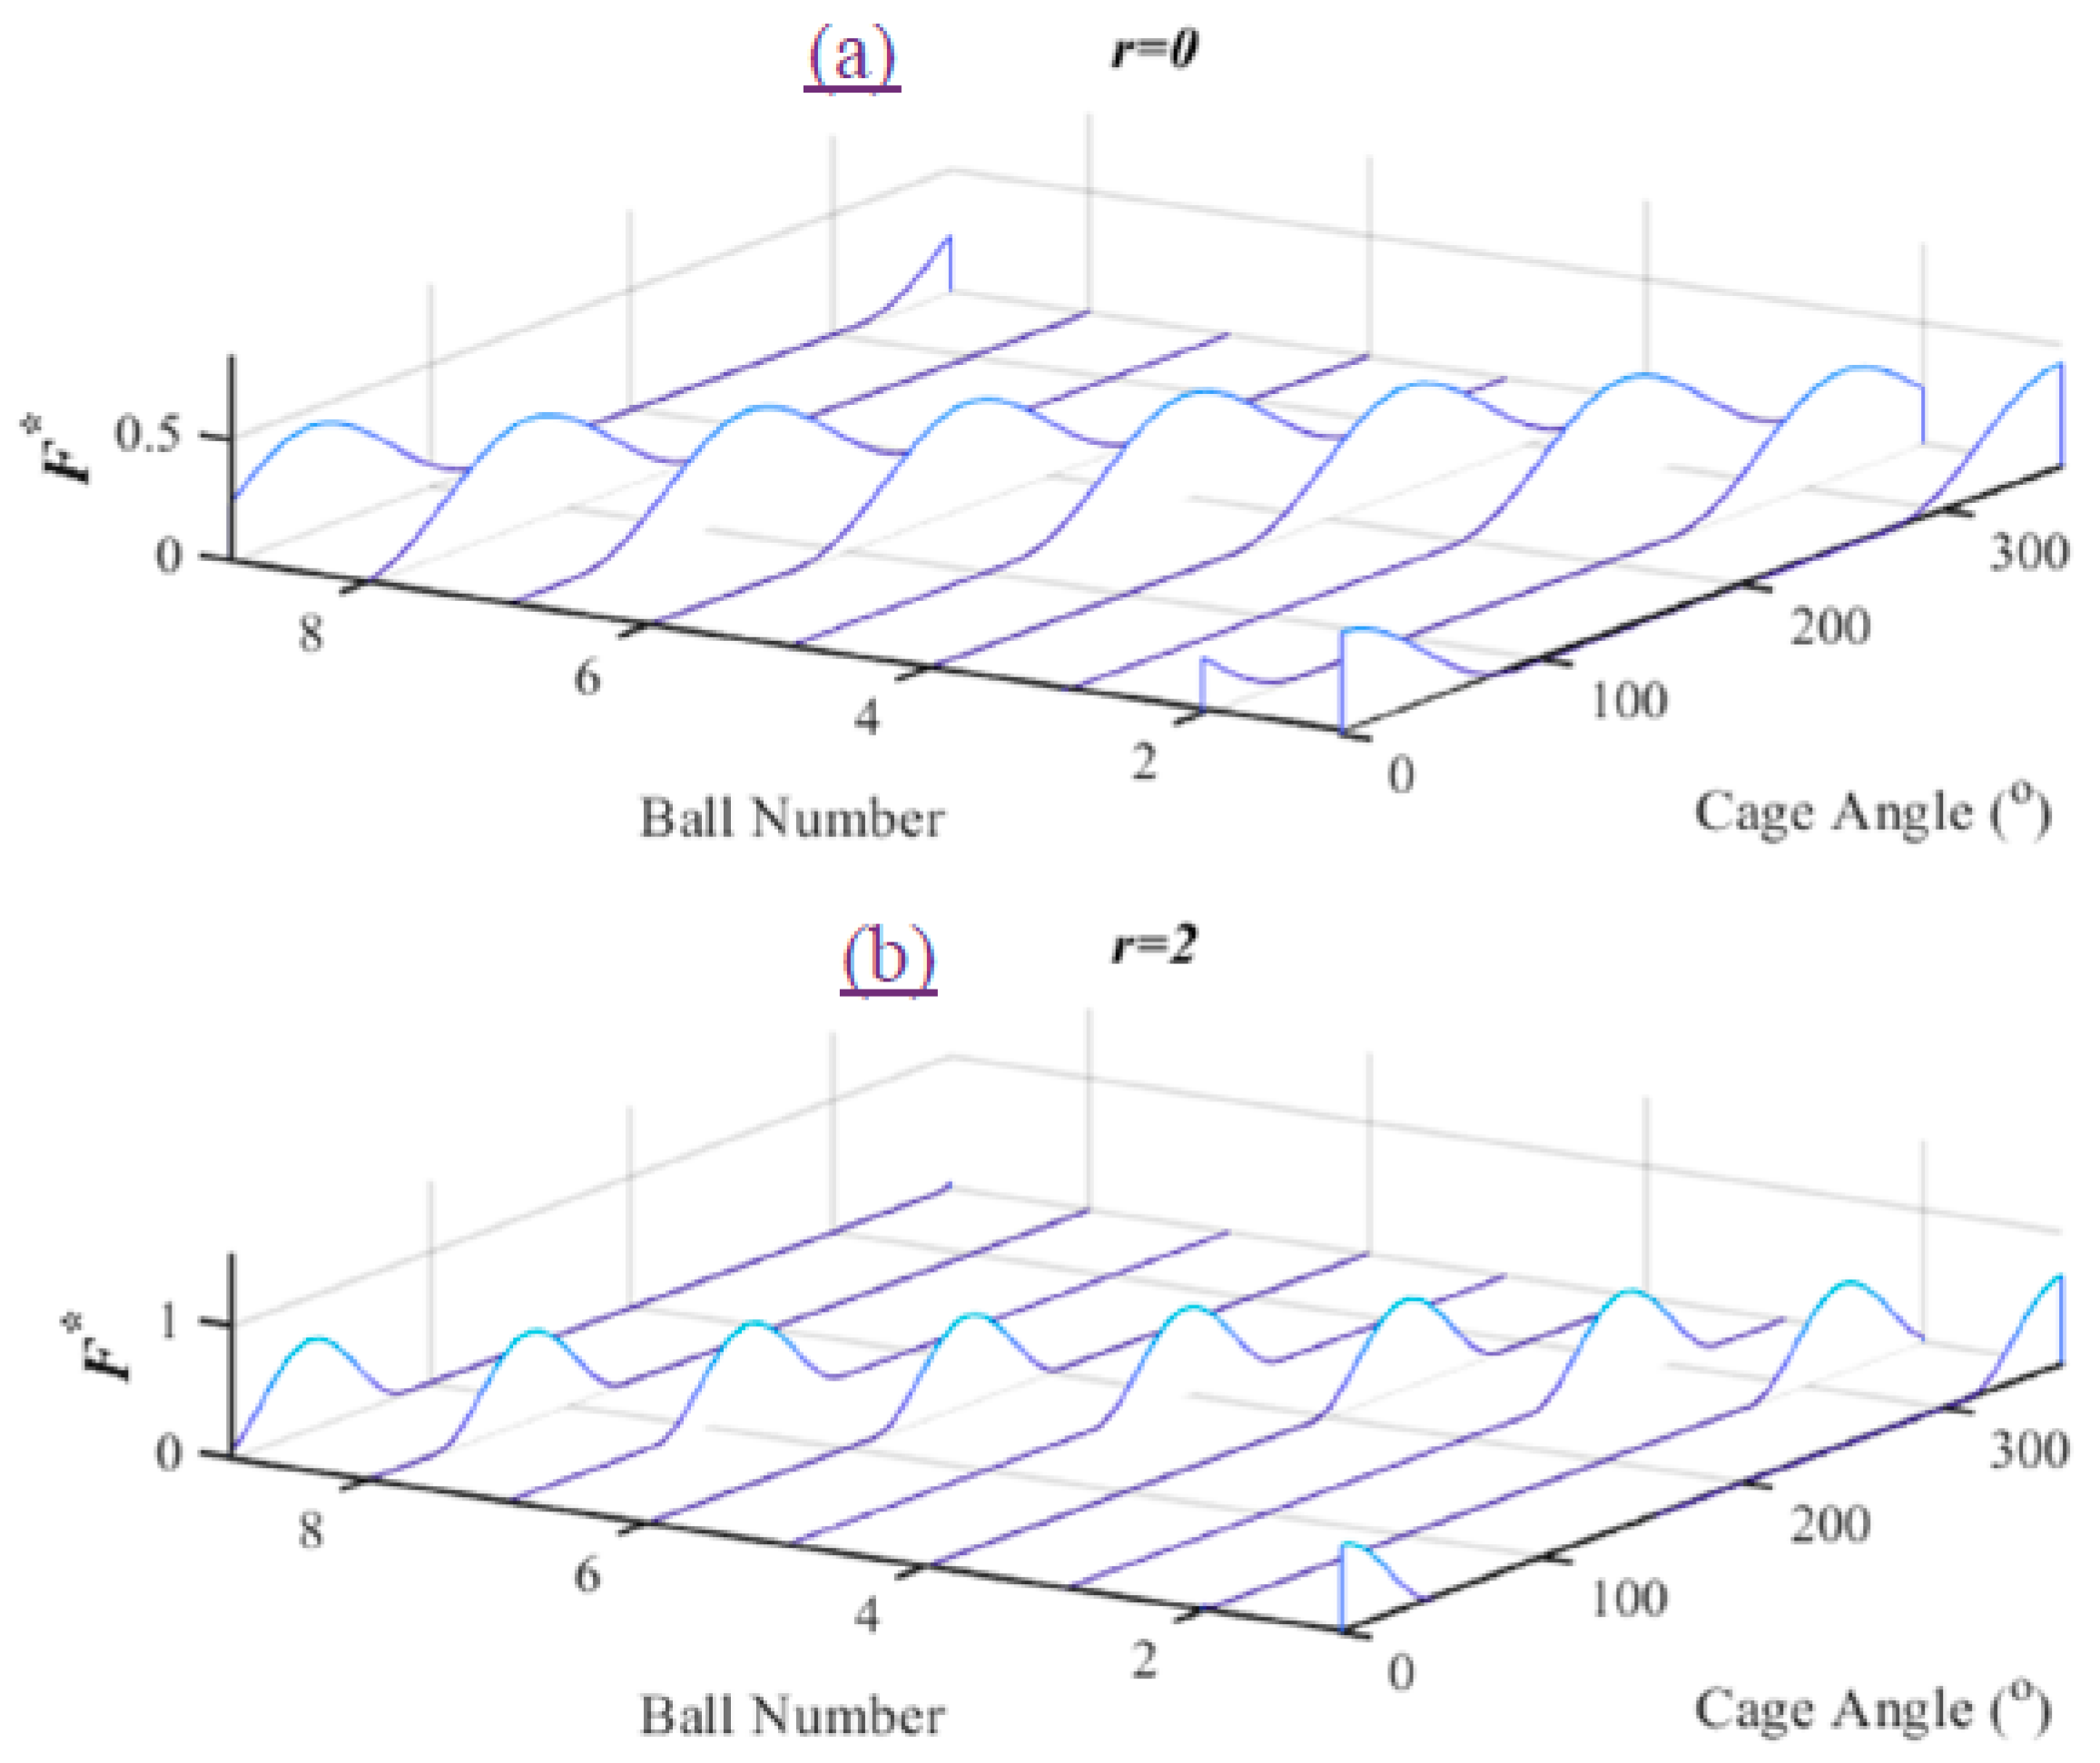
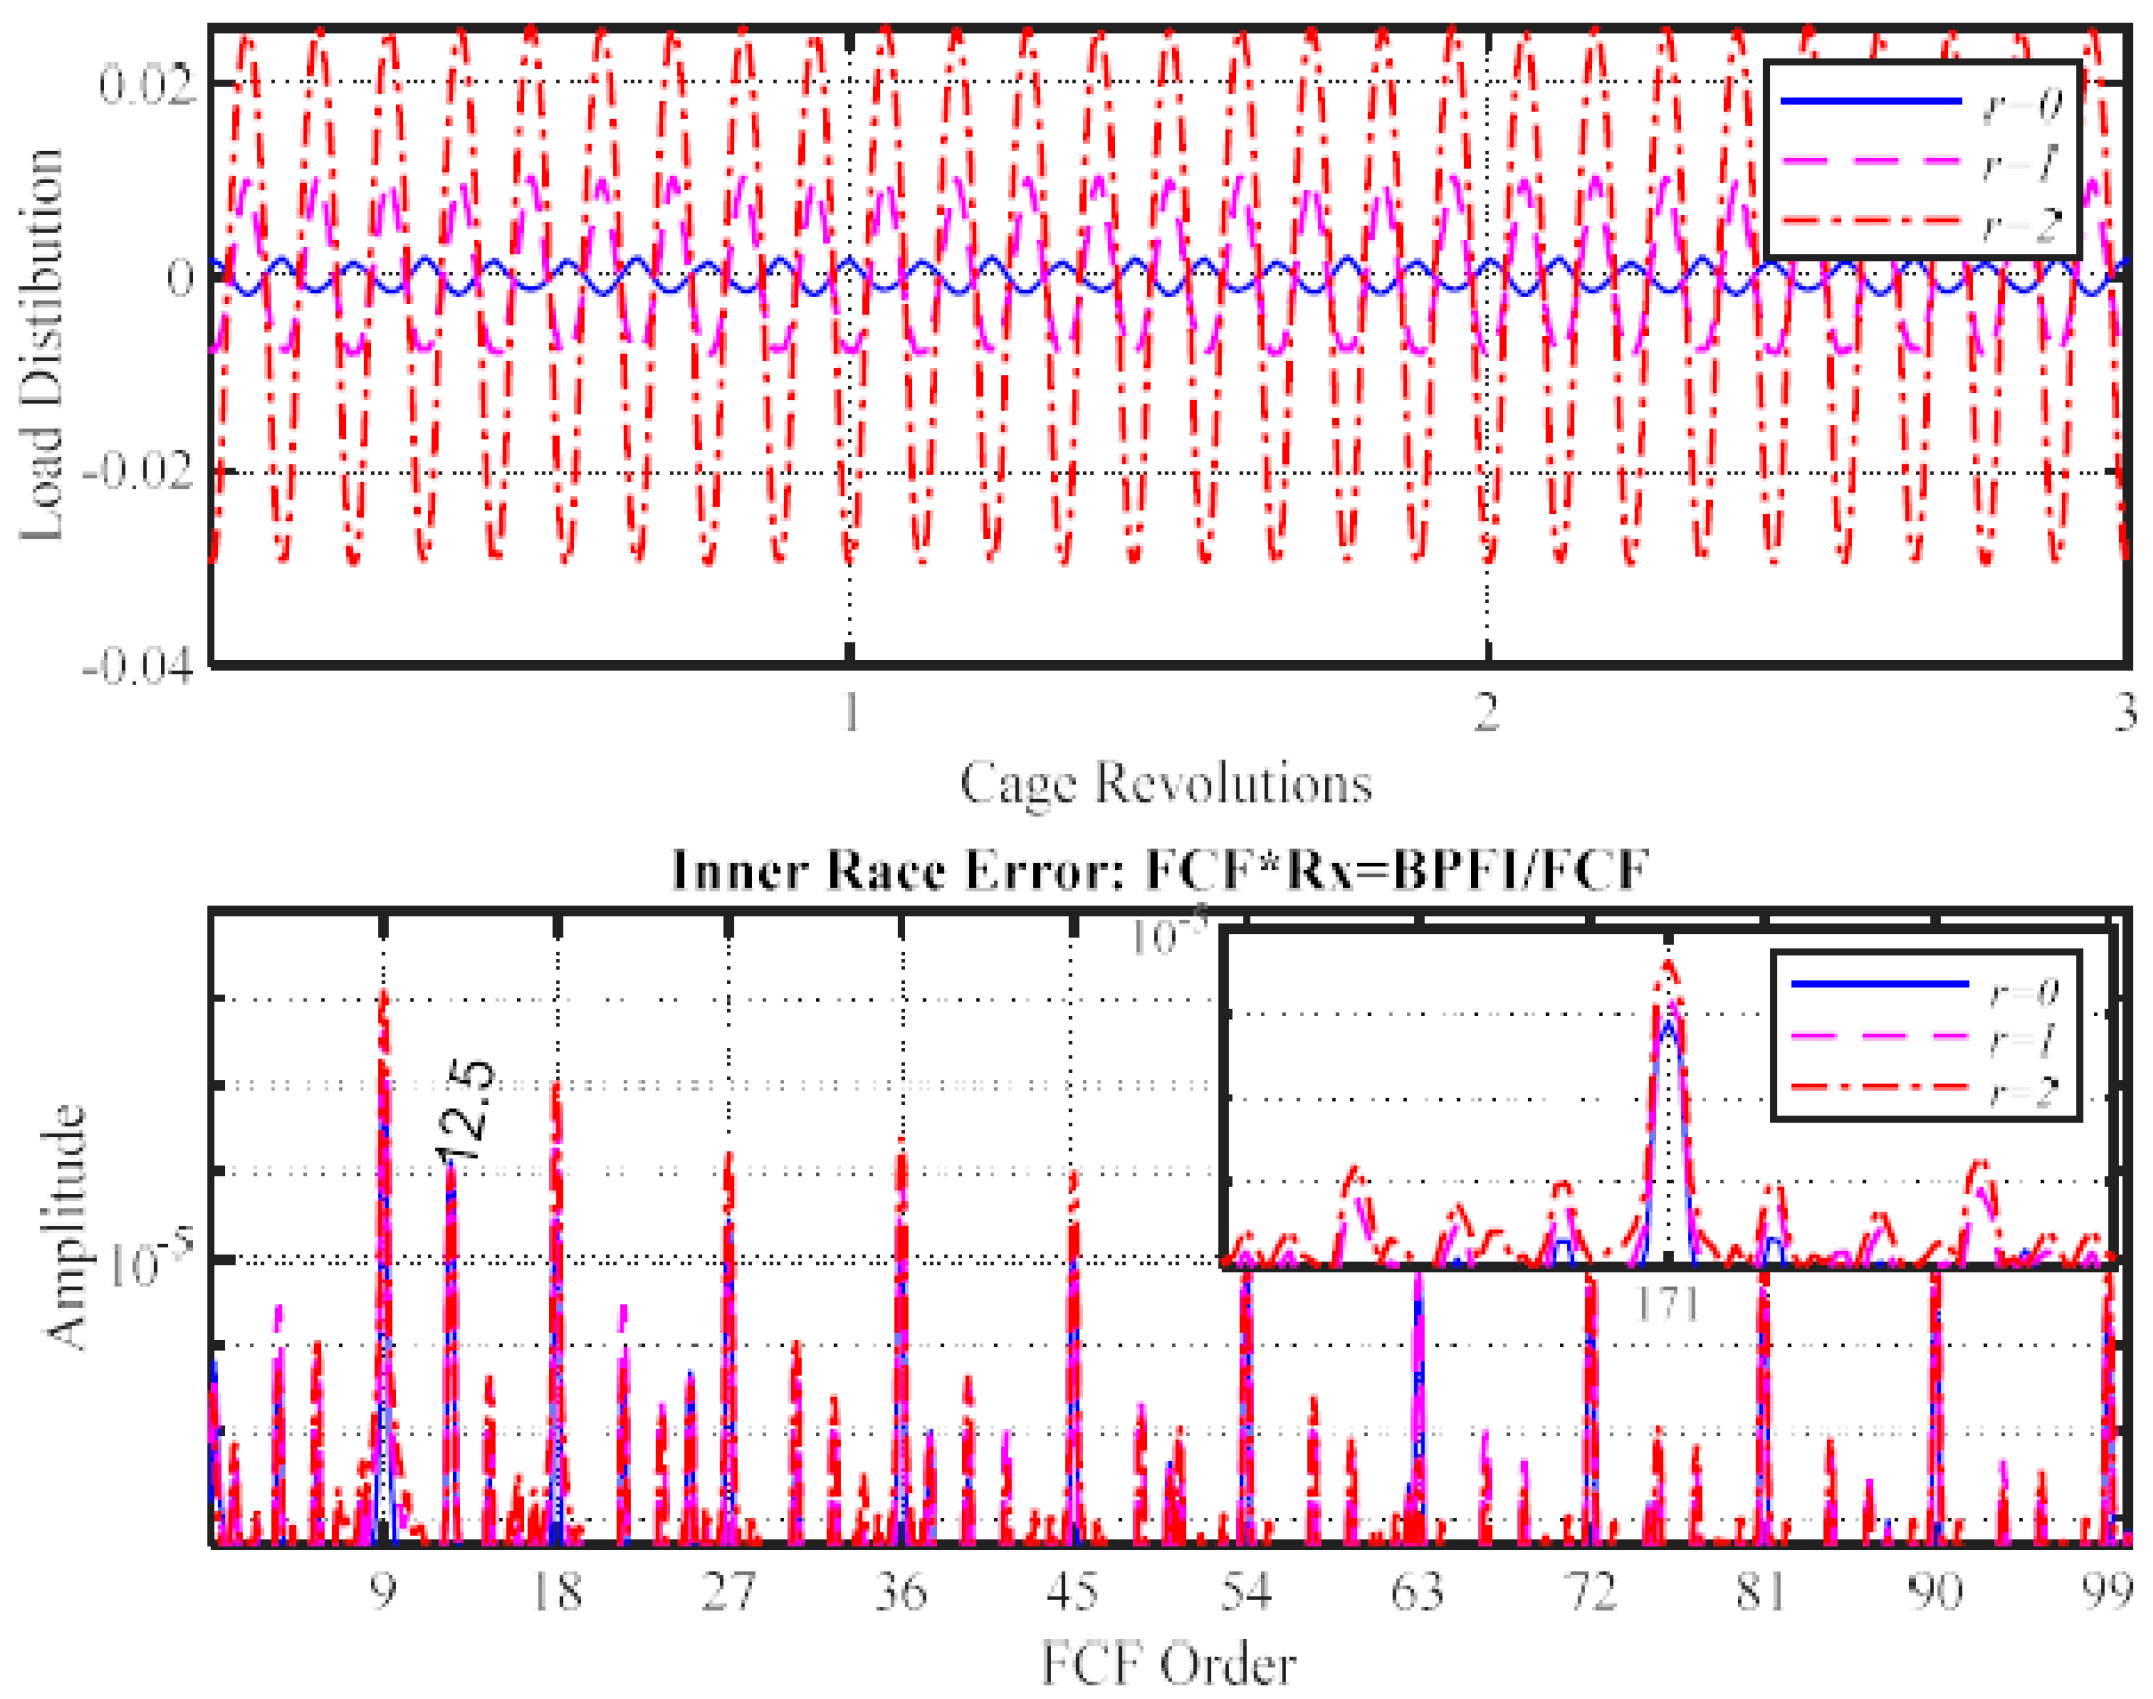
2.3. Influences of Runout Errors on Load Distribution

Geometric errors always exist in manufactured bearing components [21,22], which are one of the significant factors that cause the motion error and affect the lifetime of assembled bearings. Figure 6 illustrates the typical changes of load distributions when there is a radial runout on inner ring, outer ring, balls, and cage (non-uniform cage pocket distribution). In these cases, the maximum load becomes larger and the load region is narrower. As the changes are caused in a similar way to that of external load, it can be easily taken into account by adding the errors on the clearance.
For different orders of errors in different bearing components including shaft eccentricities, the total clearance with error c e can be accumulated as:
δ i ( t ) = ϵ k r ( ψ )   i c c e = ϵ k r ( ψ )   i c j k A k , j c o s ( k R j ϕ i + ϕ 0 , j ) ,
where j 1 ,   2 ,   3 ,   4 ,   5 represents shaft eccentricity, outer ring, inner ring, rolling and cage runouts, respectively; k 0 ,   1 ,   2 , Is the order of a runout error; R j denotes the frequency ratio of bearing characteristic frequencies: Ball Pass Frequency of Outer race (BPFO), Ball Pass Frequency of Inner race (BPFI), Ball Spin Frequency (FSF), f s with respect to the Fundamental Carrier Frequency (FCF), and A k . j is the amplitude for different errors at jth order. According to Equations (12) and (13), the normalized dynamic forces will be
F x * = i = 1 N b [ ϵ k r ( ψ )   i c j k A k , j c o s ( k R j ϕ i + ϕ 0 , j ) ] 3 / 2 c o s ϕ i ,
F y * = i = 1 N b [ ϵ k r ( ψ )   i c j k A k , j c o s ( k R j ϕ i + ϕ 0 , j ) ] 3 / 2 s i n ϕ i .
It shows that the geometric errors cause an amplitude modulation to the primary dynamic forces due to the power factor of 3/2, which agrees with the same mechanism as that of vibration model with the relative displacement in Equation (8). However, it gives an insightful understanding that the vibration signal of a healthy bearing can also have different modulation components due to bearing imperfection. Figure 7 presents the typical scenario when inner race has the 1st order runout. As R j = 12.5 or BPFI = 12.5, abundant sidebands appear around primmer harmonics of BPFO. Moreover, the vibration amplitudes can increase with clearance and extend to a wide band that can be amplified by system resonances to produce high frequency responses.

3. Evaluation with Data from an In-House Bearing Test Rig

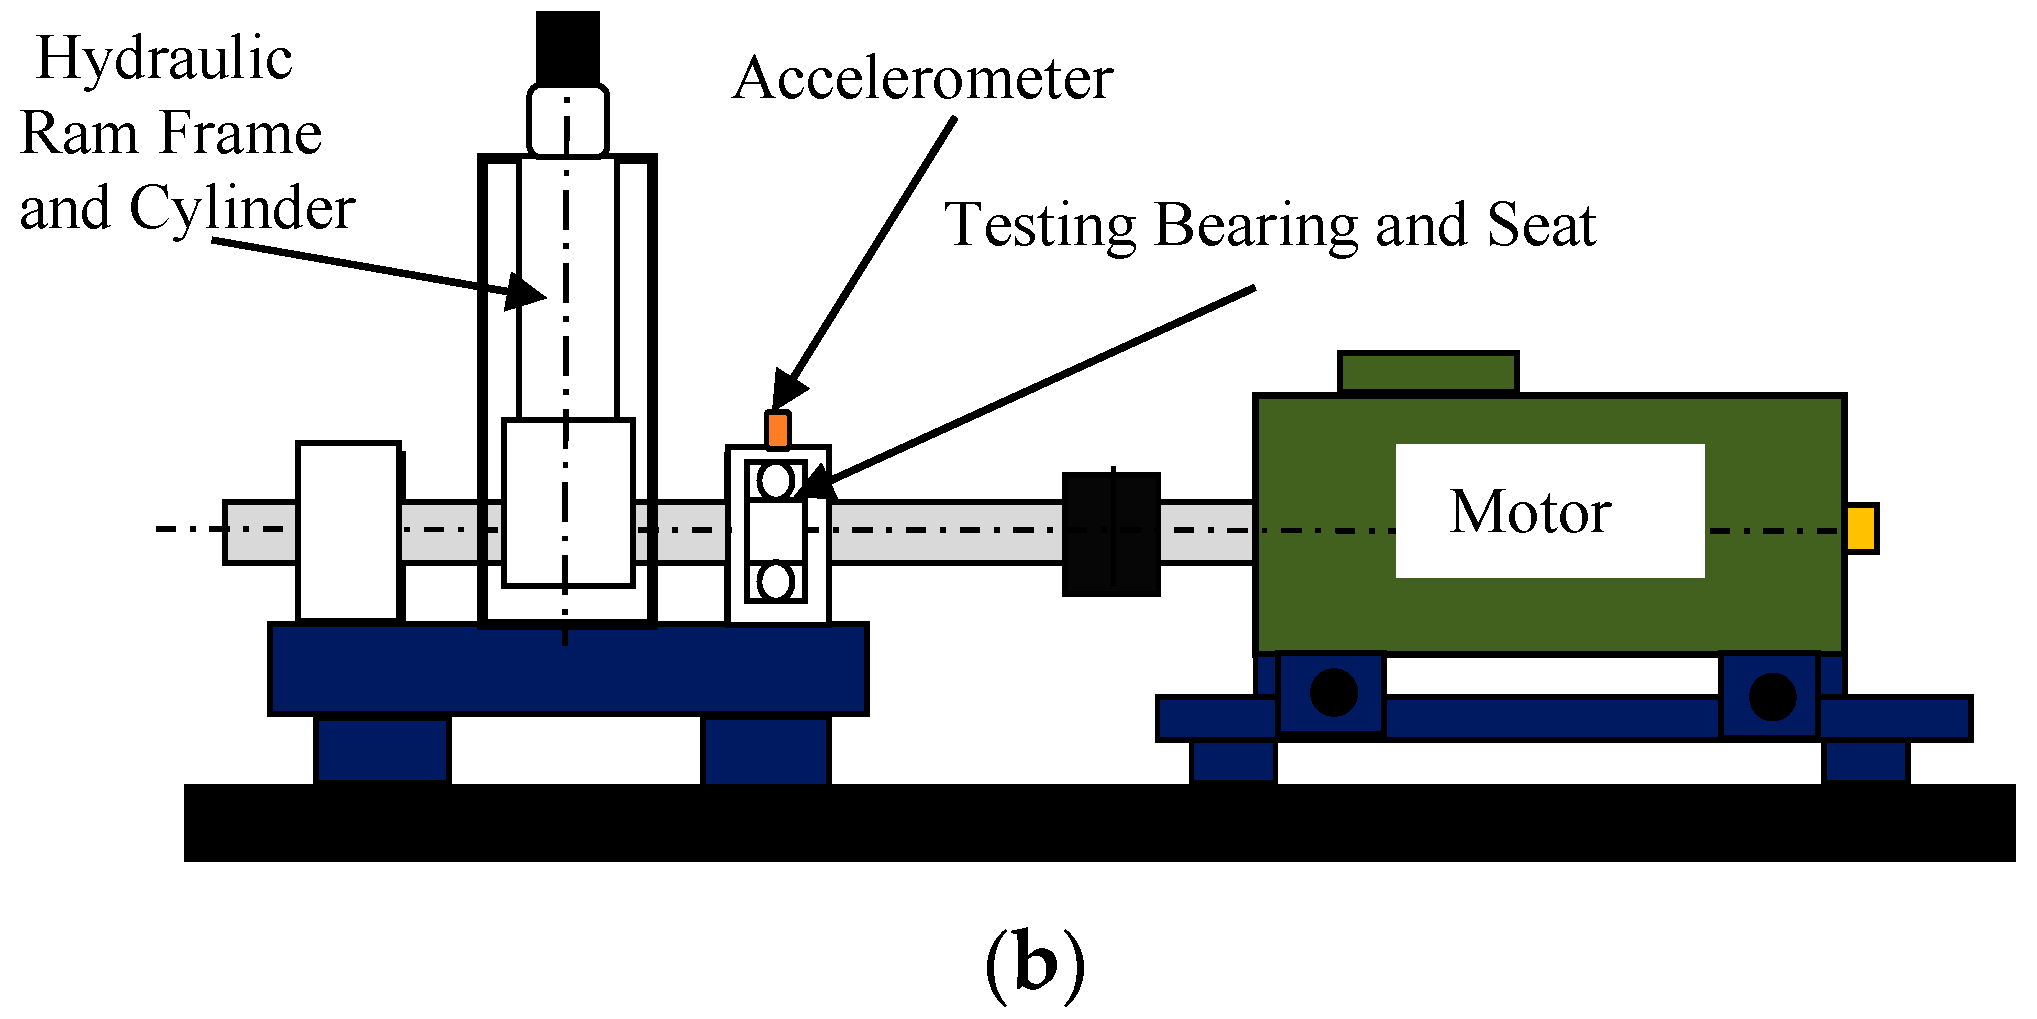
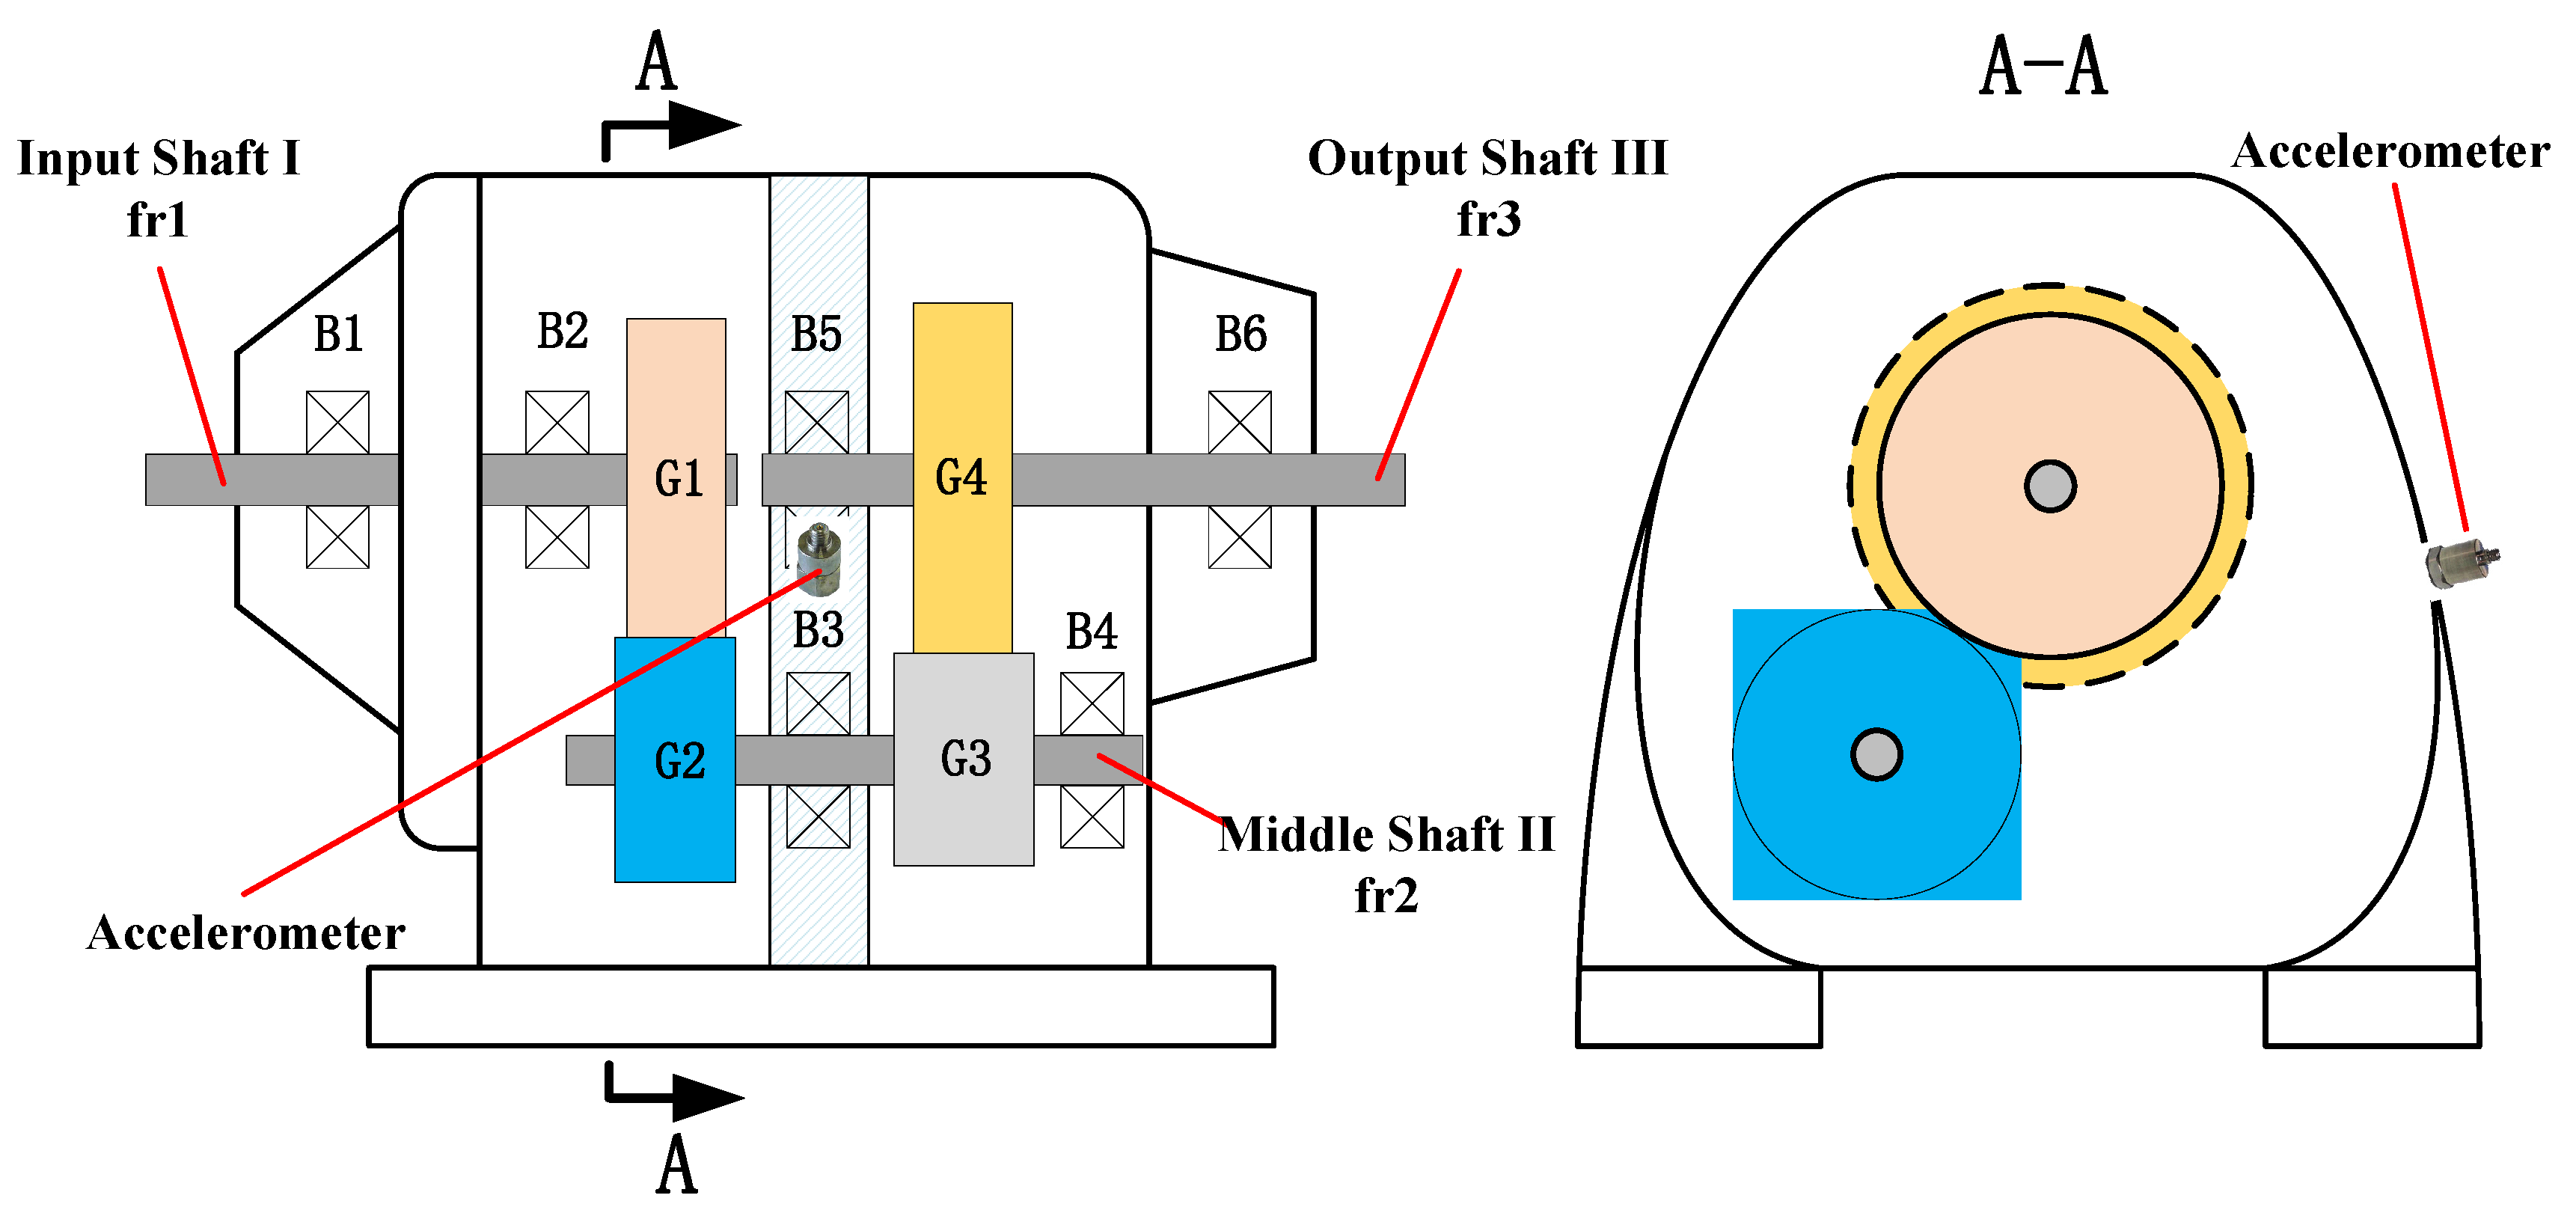
3.1. Test Facilities and Data Set
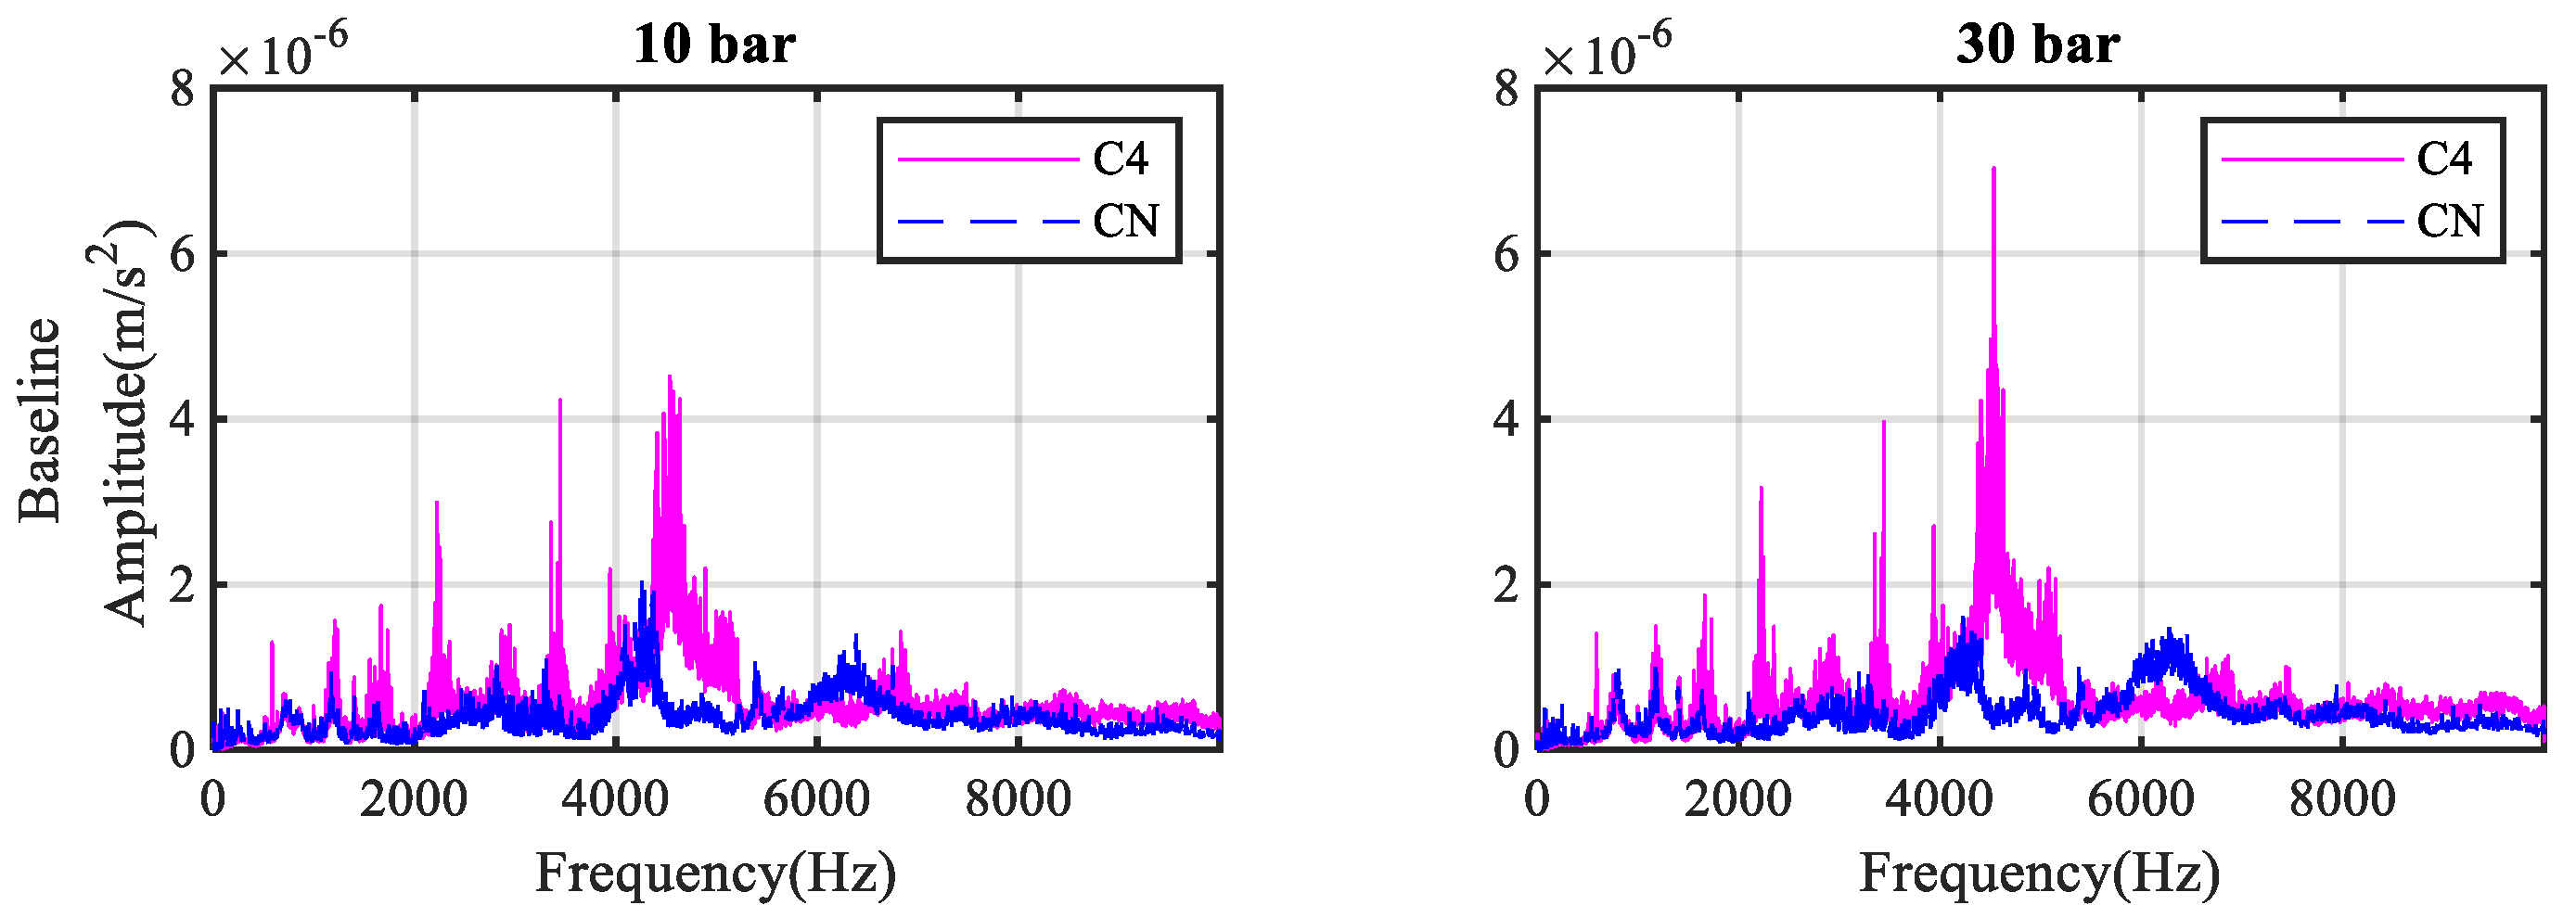
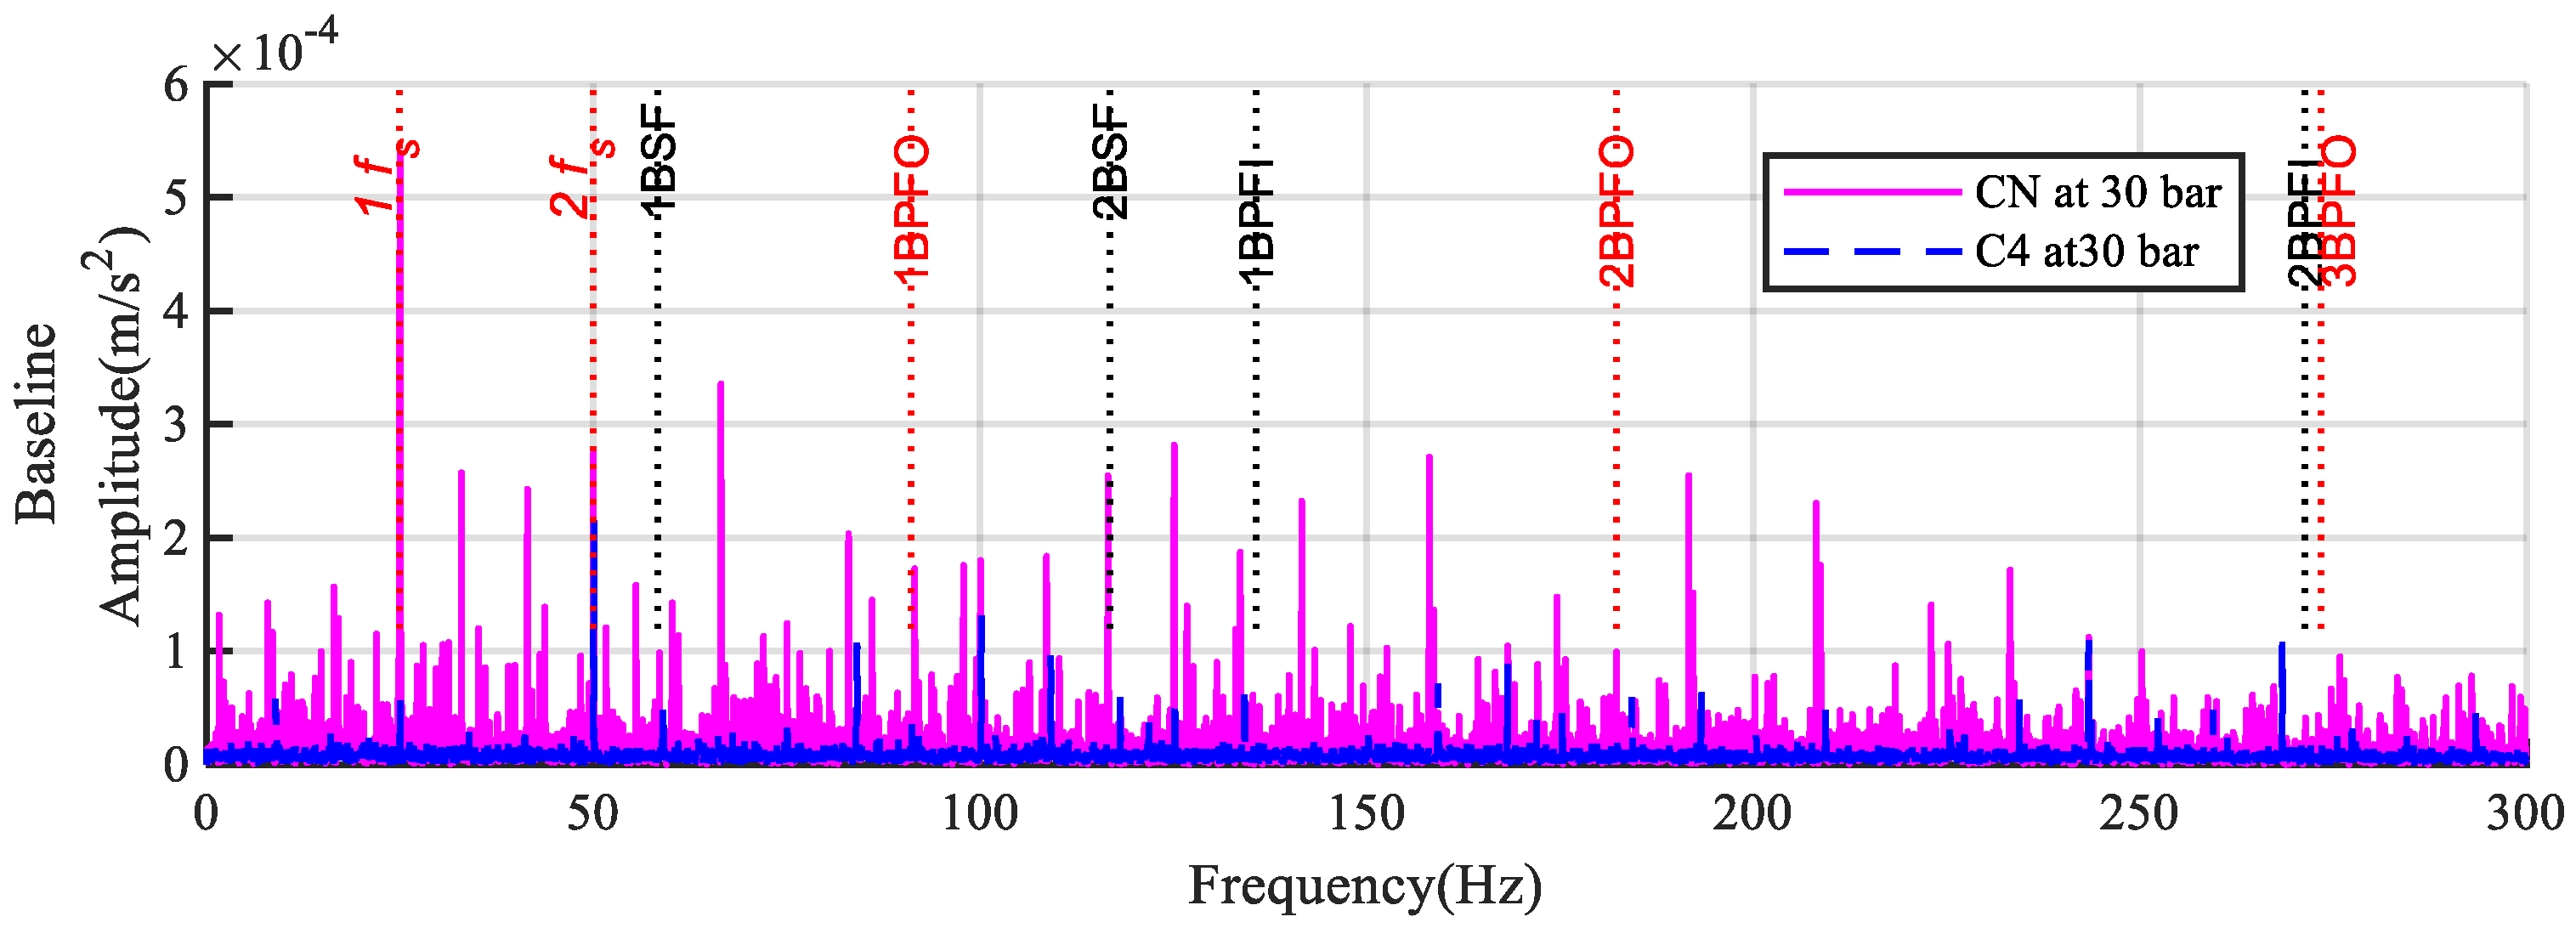
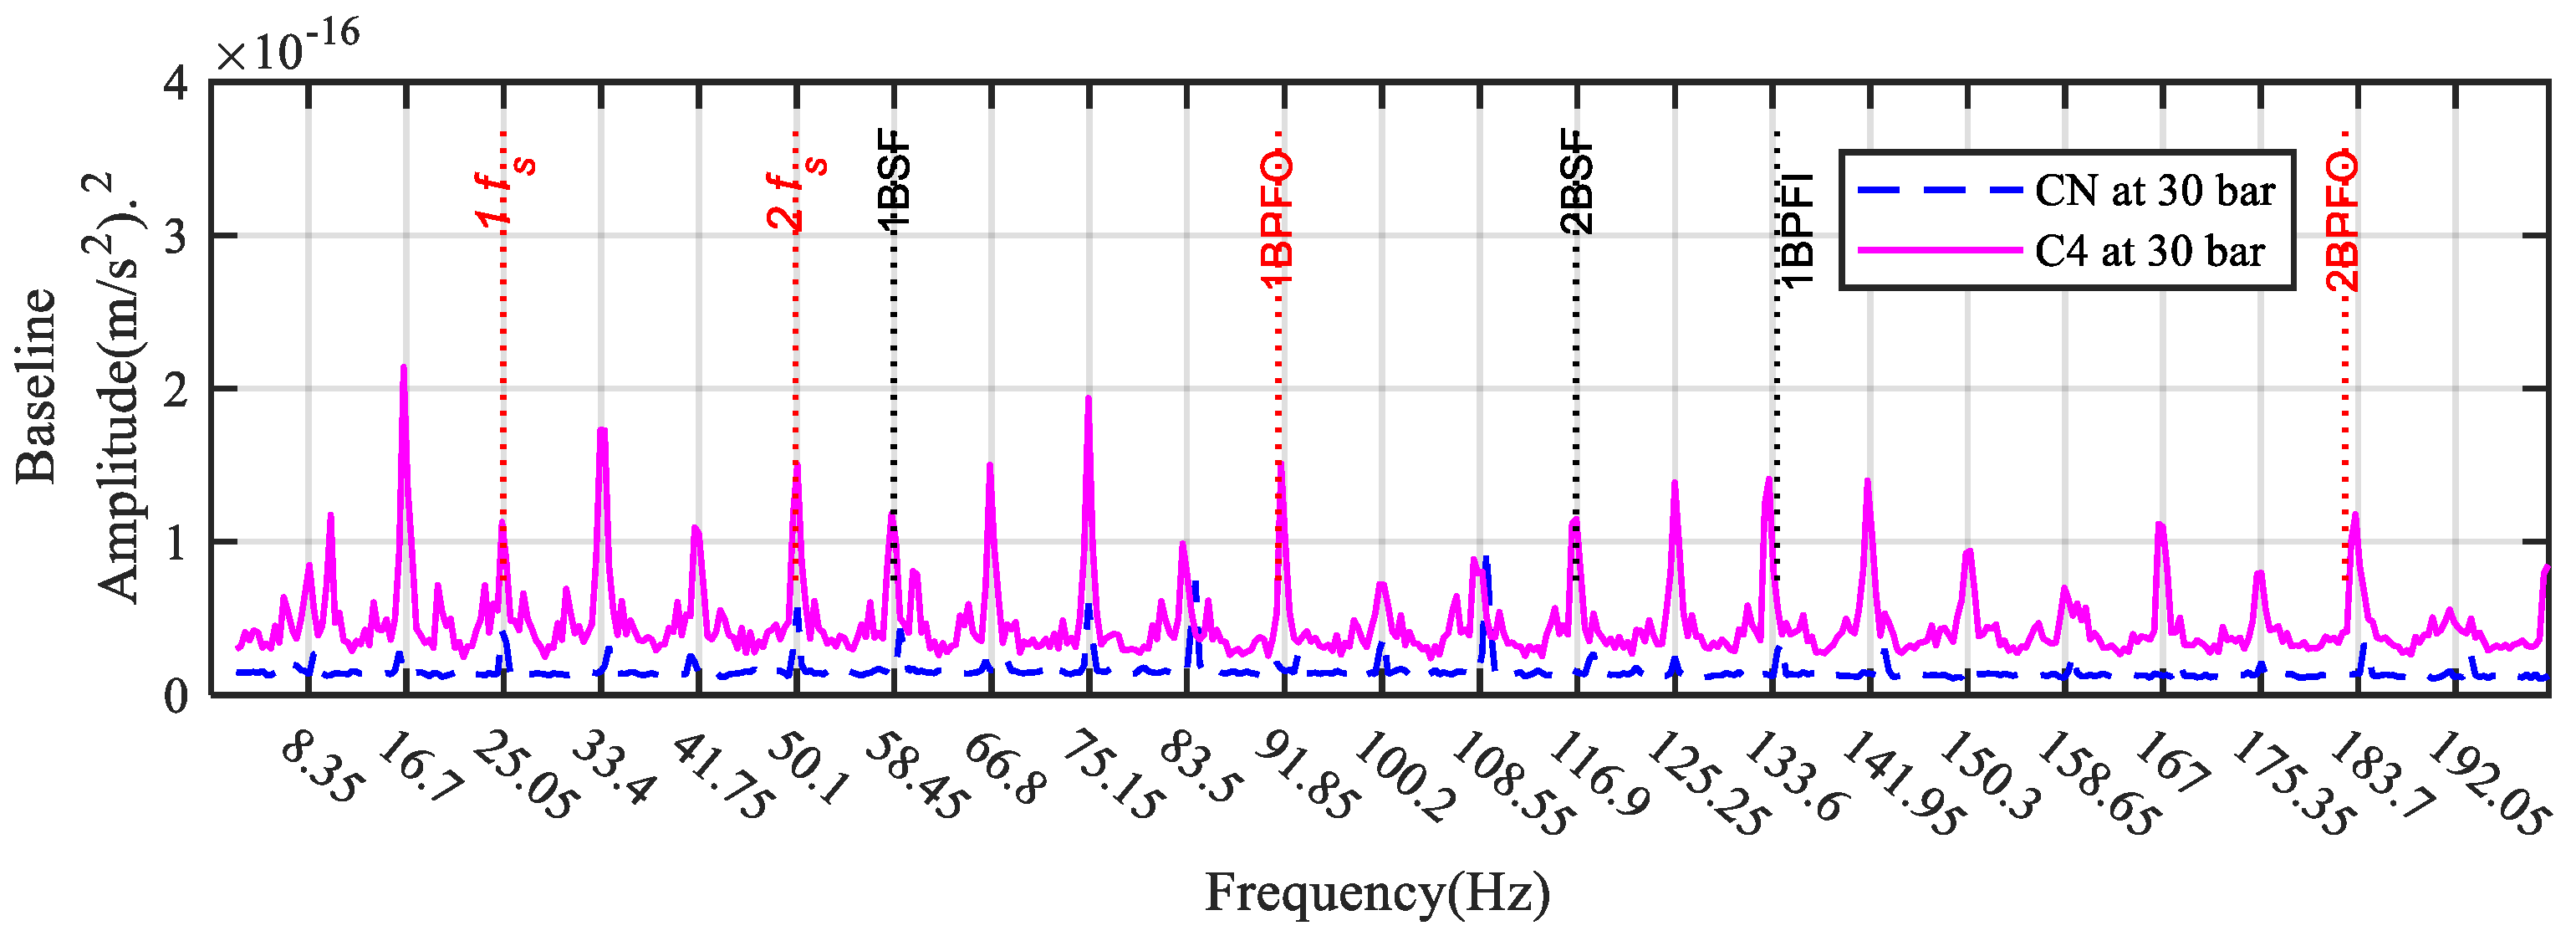
Vibration signals were obtained from a dedicated bearing test rig, as shown in Figure 8. The test rig has two bearings that support a shaft driven by a variable speed motor. The bearing under test is a single-row deep groove ball bearing of type 6206ZZ, which is mounted at the drive end of the shaft, while a single-row self-aligning ball bearing is placed at the non-drive end side of the shaft, as illustrated in Figure 8b. This test rig layout allows signals to be obtained with a better signal to noise ratio (SNR), compared with an industrial system like a multiple stage gearbox, hence reliably verifying the analysis conducted in Section 2. Other details, such as the measurement system, load system, data acquisition procedure, and defects induced, can be found in [18].
The datasets for all test cases are summarized in Table 1. Each signal was acquired at a sample rate of 96 kHz, which allows for an accurate estimate of operating speed. The signal length is of 20 s, allowing sufficient averages to be performed during spectrum calculation for noise reduction.
To study the characteristics of vibration signatures, the test bearings have two groups of clearance values, namely CN and C4, as detailed in Table 1. These two groups of bearings refer to ‘normal’ and ‘large’ clearance, respectively. Bearings with such accuracy are widely used in many machines such as pumps, motors, gearboxes, and so on.
For each group, one bearing was randomly selected as a baseline one, and others were induced with artificial local defects on the inner race and the outer race, using electrical discharge machining. The induced defects are the same with rectangular slots of a depth of 0.1 mm and a width of 0.2 mm, as depicted in Table 1. These sizes are relatively smaller, compared with that simulated in [23].
The experiments were performed at a shaft speed of 1500 rpm, at which different radial loads, i.e., 0 bar, 10 bar, 20 bar and 30 bar, are applied, in which the higher load of 30 bar is equal to 2400 N, corresponding to 12% of the rated dynamic load. This allows the diagnostic capability to be evaluated under low load conditions to avoid any other defects that may be induced under higher load operations. Based on the operating speed, bearing characteristic frequencies are calculated and listed in Table 1.

3.2. Data Analysis

Firstly, the spectra of the raw signals were calculated to check the signal quality. Figure 9 presents the spectra for the baseline case under different loads and clearances. It can be seen that vibration amplitudes are higher for the larger clearance bearing of C4 with a higher load of 30 bar. Especially, vibration responses are more distinctive in the frequency range from 4000 Hz to 8000 Hz in which the system resonances are located. These agree well with the theoretical analysis in Section 2.2, showing that the tests were carried out adequately. With these observations, it seems that the clearance status could be diagnosed. However, these changes can also be caused by other factors, such as the loading bearing systems, shaft resonances, and so on. This will lead to an unreliable diagnosis unless it can be confirmed that the responses mainly fall in the bearing characteristic frequencies discussed in Section 2.
To find the vibrations related to bearing characteristic frequencies, the envelope analysis or high-frequency resonance technique are used, which has been widely accepted as a reliable technique to detect and diagnose local defects on rolling-element bearings [24]. This technique is derived by Hilbert based on the demodulation of a band pass filtered signal in the high frequency range [25]. The demodulation will simplify the complexity of compound modulations, resulting in a clear spectrum pattern for identifying the characteristic frequencies. Moreover, it can greatly reduce the inevitable slippage effect. Therefore, this study applies this technique to find the bearing related vibration components.
When implementing envelope analysis, an optimal frequency band should be firstly determined, for which researchers have paid abundant efforts and a large number of methods have been developed, such as the Kurtogram [26], Protrugram [27], and Autogram [28], in order to improve the performance of envelope analysis. These methods are effective for diagnosing local defects where SNR is relatively high due to very sharp impulses. Comparatively, the non-defective bearings investigated in this study will have a very low SNR signal because their impulses of the primary dynamic loads are much smoother. Therefore, wide frequency bands from 4000 Hz and 8000 Hz are selected for envelope analysis, aiming at obtaining an envelope signal that can be used to consistently reflect the effect of not only clearance changes but also load variations.
Figure 10 shows the envelope spectra obtained for the baseline cases with high load conditions (30 bar). The spectra allow spectral components at 1 × BPFO, 2 × BPFO of the primary excitations to be observed. Meanwhile, components of the secondary excitations can be also observed at 1 × f s , 1 × BSF and 2 × BSF. Moreover, such components show higher amplitudes for the larger clearance bearing, indicating good consistency with the theoretical analysis. Based on these amplitudes along with that of BPFIs, it is possible to show the changes in bearing clearance. However, the envelope signals are still very noisy, and its spectrum has many unresolved components as shown, particularly by the spectrum with the larger clearance bearing of C4. This noise effect will definitely influence the final diagnostic results and must be suppressed in order to obtain a consistent and reliable diagnosis.
As an effective noise reduction and sparsity representation method, Modulation Signal Bispectrum (MSB) has been proven to be particularly effective in demodulating small components in motor current signals [29] and very noisy bearing signals [30,31]. Particularly, it is also effective to clean envelope signals to obtain consistent diagnostic results for gearbox monitoring [32]. Therefore, it is used to analyze the vibration data to accurately extract the fault signatures from noisy data, especially for the cases of defect-free bearings.
Figure 11a,b present typical results of MSB magnitudes for CN and C4 bearings, respectively, in which the f c and f x denote the carrier frequency and modulating frequency, respectively. From the results, many peaks are observed to be associated with bearing frequencies. However, the expected BPFO and its harmonics are not very distinctive. This is because the effect of bearing errors is more significant. In addition, C4 bearing still has more background noise, indicating the strong influences of larger clearance being hardly removed by the limited average in this study. Nevertheless, it can be demonstrated that the MSB implemented is very effective as MSB peaks are significantly high and background noise levels are very low for bearings with small defects on the outer race and inner race, as shown in Figure 11c,d, respectively.
To gain more understanding of MSB results, Figure 12 presents MSB slices for the baseline cases that are the spectral slices at the modulation carrier frequency of f c = 3 × BPFO. It can be seen that nearly all distinctive spectral peaks corresponding to the characteristic frequencies are enhanced to be distinctive. The peaks at FCF (8.35 Hz) and its harmonics dominate the full spectrum, showing that the cages have high errors. In addition, as spectral peaks at BPFOs and harmonics of f s are aligned with that of the high orders of FCFs, it is hard to differentiate their effects from that of cage errors. Nevertheless, the spectrum for the larger clearance case is higher, allowing the difference between two bearings to be reliably determined, hence paving a good foundation to develop a qualitative indicator.

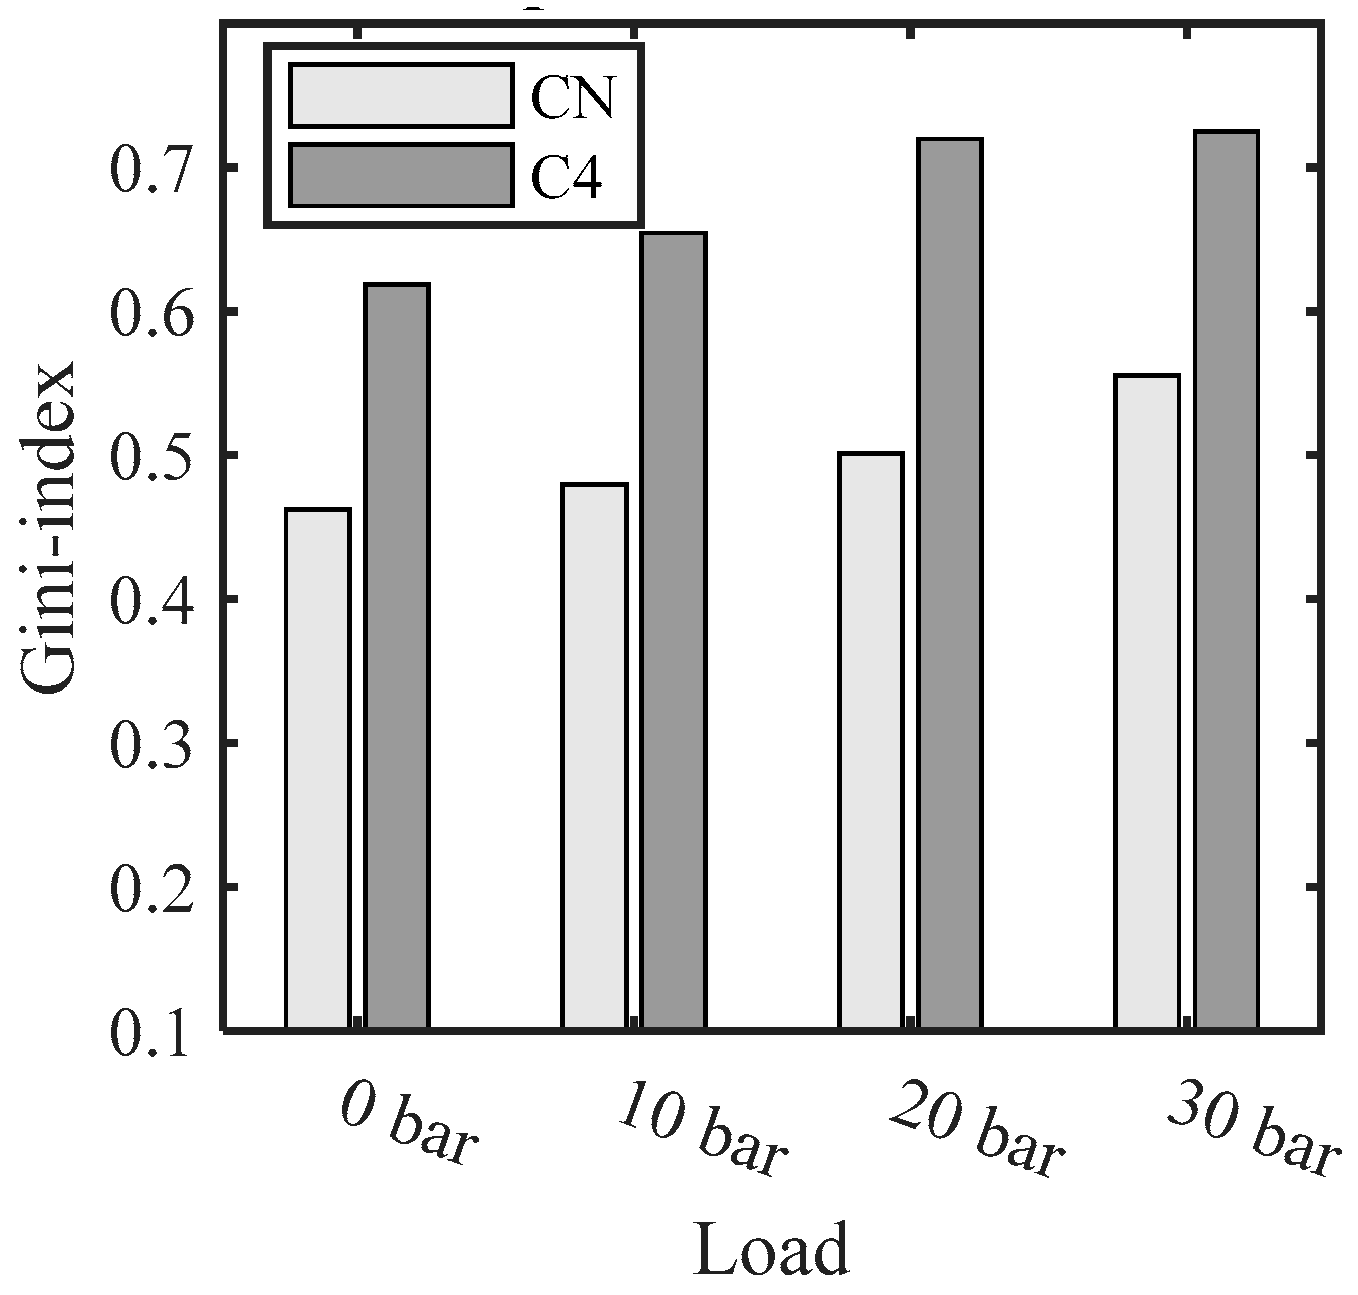
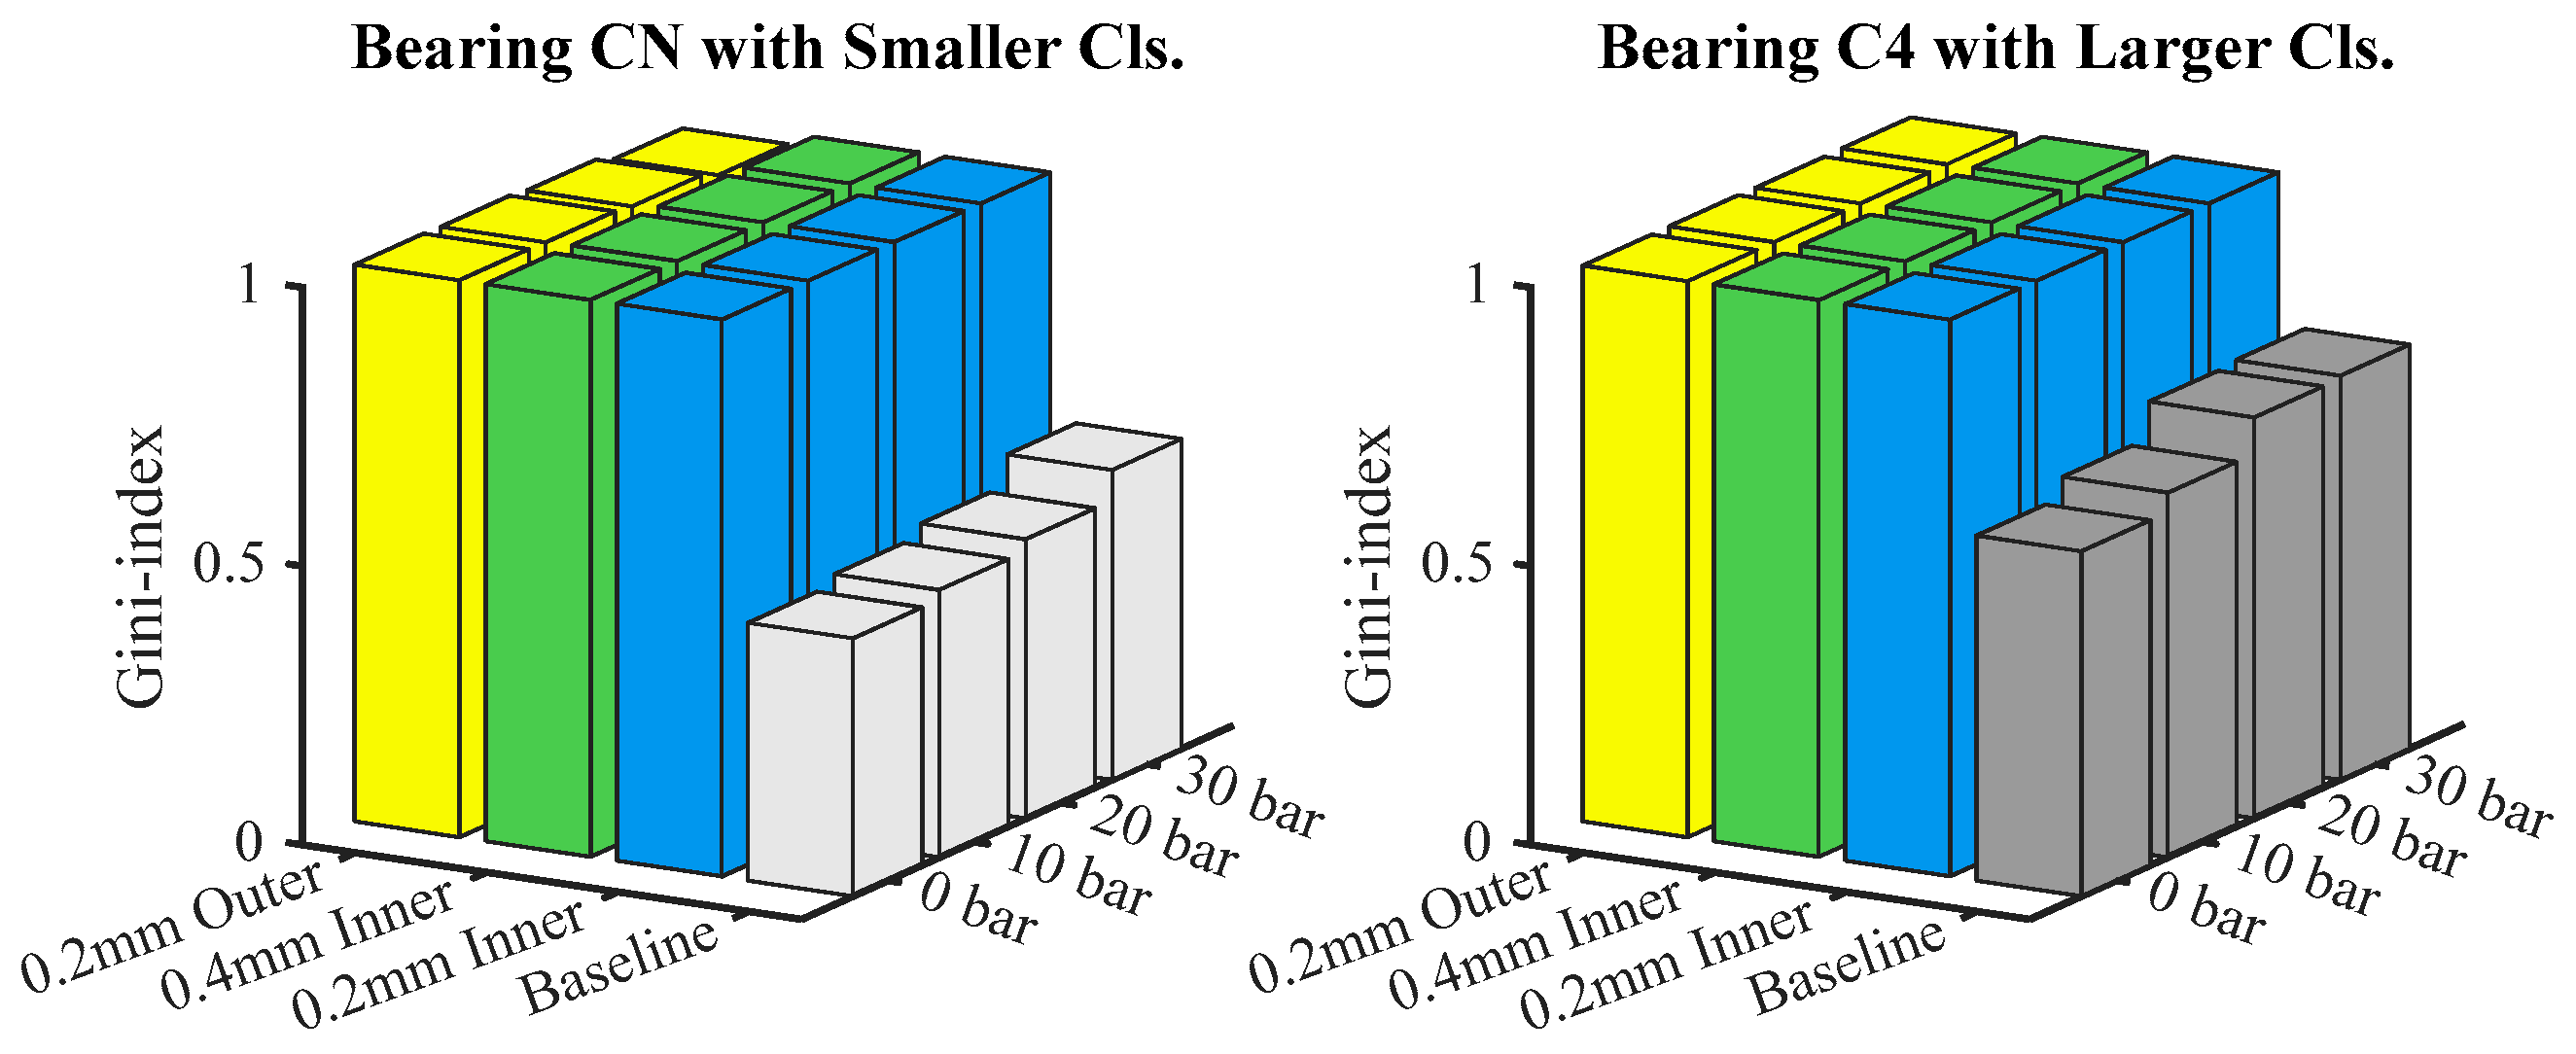
3.3. Bearing Clearance Indicator

Another important observation obtained from the above analysis is that the spectral peaks become more distinctive when the inherent periodic signals are increased. In other words, the noise floor becomes relatively smaller and smoother when the signal component becomes higher. To represent this observation along with more spectral lines in baseline cases and higher spectral amplitudes for larger bearings, the Gini Index [33] is introduced in this study as a measure to indicate the changes of MSB results. The Gini index is often a measure of statistical dispersion to represent the income or wealth distribution of a nation’s residents. Recently, it was used as a guideline to select a bearing fault band [34], showing reliable and robust performance in diagnosing local defects in bearings. Moreover, Gini Index values are bounded between 0 and 1, which can result in a quantitative indication that can be more interpretable for bearing health conditions. Comparatively, many other commonly used features in condition monitoring, such as peak values, spectral kurtosis, and entropy values, are very hard to be explained as they do not have such an upper limit.
According to the definition of Gini index, the MSB-Gini Index is calculated for its magnitudes of Z n x × n c in the frequency range of n x × n c , which are the frequency indices for f x and f c directions, respectively, as presented in Figure 11. In this study, n x was set to include up to f x = 2 × BPFI ± 5 Hz and n c covers the bands of f c = 3 × BPFO ± 5 Hz so that MSB peaks at characteristic frequencies can be included regardless of bearing slippage and spectral leakage effects. In the meantime, it excludes any spectral peaks not relating to bearings:
MSB Gini   Index = 1 2 i = 1 N z i z 1 ( N i 1 / 2 N ) ,
where the MSB spectral vector z = [ z 1 , z 2 , z 3 z N ] can be obtained by casting the matrix z into a vector z , of which the elements are ordered from the smallest amplitude to the largest one. N = n x × n c is the number of vector elements, and z 1 is the l 1 norm of z .
Figure 13 shows MSB-Gini Index values for the baseline bearings. It shows that the indicator increases slightly with loads, which is consistent with the load effect analyzed. Moreover, they are nearly 0.2 higher for the larger clearance bearing, quantitatively showing the effect of changes in bearing clearance.
To further show the useful property of an MSB-Gini Index, Figure 14 presents MSB-Gini Index values for all test cases. It shows that the values for the defective bearings are nearly unity under all load conditions. Therefore, it can be summarized that
  • Gini Index being close to unity means bearings already have defects and replacement actions should be taken regardless of small or large defects in order to avoid catastrophic failures.
  • The difference of Gini index values between the non-defective and defective bearings can show how far the non-defective ones form the defective ones. The larger the loads and the clearance, the nearer to unity or defect conditions.
  • The baseline values of MSB-Gini Index depend not only on clearance values but also can be influenced by signal processing efficiency. Thus, the relative comparison should be made based on the same signal analysis configurations.

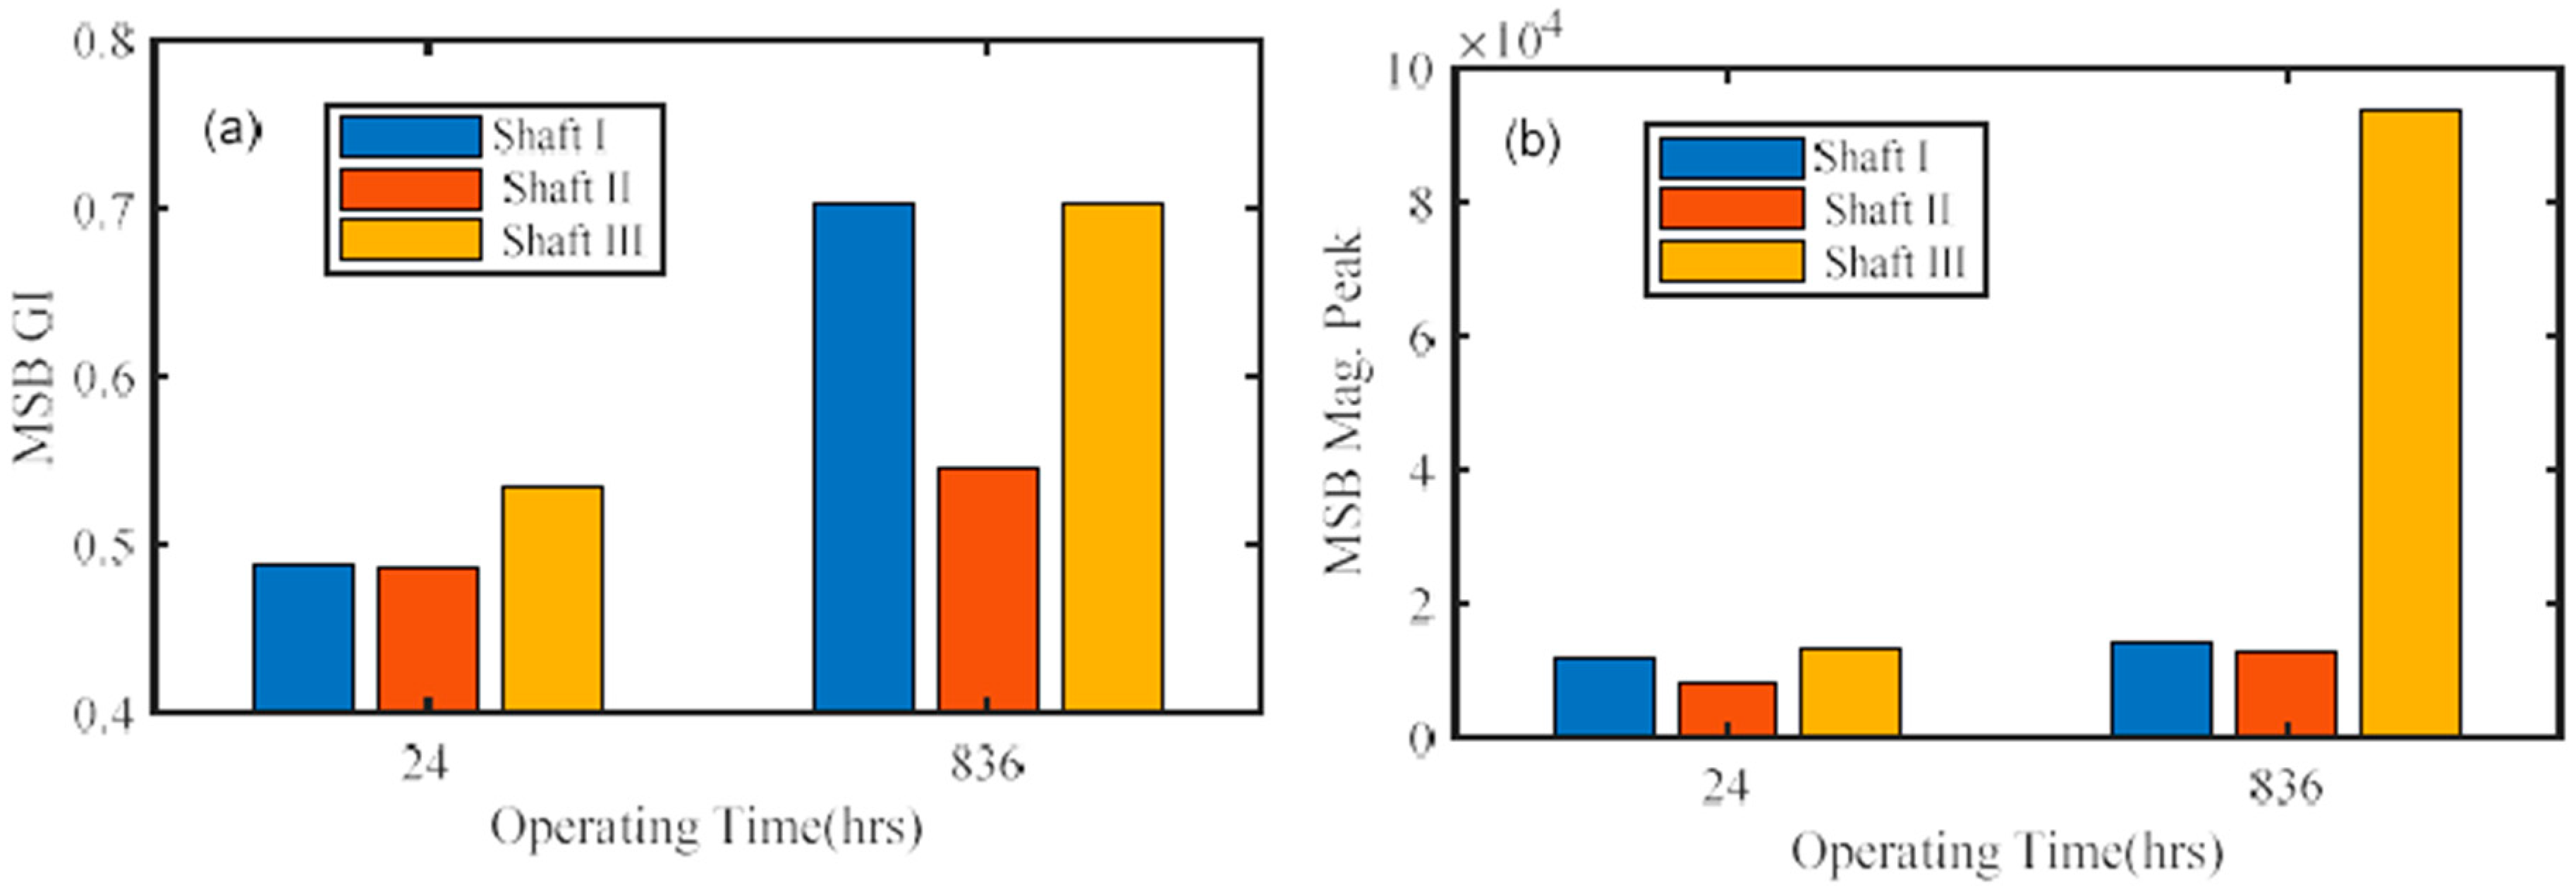
4. Evaluation with Data from the Run-to-Failure of an Industrial Gearbox

To verify the performance of this clearance-focused method, the dataset from a run-to-failure test of an industrial 10 kW gearbox is analyzed to determine the health condition of the bearings in the gearbox. There are, in total, six deep groove ball bearings on three gear shafts, whose configuration is detailed in Figure 15. Only one accelerometer was placed on the housing but far away from bearings B1, B2, B4, and B6, compared with the data from the test rig. This means that the data have lower SNR and provide more challenges to the monitoring method, even though the radial clearance for C3 grade bearings in the gearbox are in the middle level between the two types of bearings (CN and C4) tested in Section 3.
The primary purpose of the test, carried out in the Condition Monitoring Laboratory at University of Huddersfield, is to evaluate different condition monitoring techniques, including vibration, acoustics, instantaneous angular speed, electrical signatures, and temperature, and monitor the progressive deteriorations of gearbox like the scenarios in real applications. In addition, the speed was kept nearly constant, but the load had high fluctuations in order to mimic WT operations. The test operated continuously for 838 h until a significant increase in vibrations was found at the gear meshing frequency of the two-stage helical gearbox. Offline inspections show that clear abrasive wear marks on the gear surfaces [35], which is identified to be the root cause of the increased mesh components. However, bearing health conditions could not be assessed adequately as there were no characteristic vibrations found during the tests, and no local defects were identified by the offline inspection, even though some mild wear markers were observed on the raceways.
By using the same method, the MSB-Gini Index for the three shafts is obtained at the beginning and end of the test, as shown in Figure 16a. It can be seen that MSB-Gini Index values for Shaft I and III increase significantly at 836 hours compared with their baselines, indicating that there is an increase in the clearance of these bearings or deterioration. In particular, there is nearly 0.2 increment from the baseline. As this value is similar to that of the two bearings studied in Section 3, it indicates that clearance of these bearings was enlarged by at least 20 µm according to the differences of bearing clearance values in Table 1, showing severe deteriorations in bearing health conditions due to the wear occurring inevitably during operation.
On the other hand, Gini Index values for bearings on Shaft II only have a 0.05 increment, three times smaller than other bearings, indicating that the condition of these two bearings are still sufficiently good. The smaller change may attribute to the better alignment of Shaft II achieved by the manufacturing assembly. Comparatively, the alignments of the input shaft and output shaft cannot be as good as Shaft II due to he fact that the installation facilities are less accurate in assembling the gearbox on the rig.
In addition, the peak values are also obtained from MSB results shown in Figure 16b. Comparatively, these values are much less indicative due to their large differences between the time instants and different shafts. In addition, although the values in later operations are clearly high for the bearing of Shaft III, it could not have an estimate of the time when the bearing could be defective as these values do not have an upper boundary like the Gini Index.

5. Conclusions

To assess the bearing health conditions at early stages, this study has investigated the dynamic effect of bearing clearances. A novel dynamic load distribution method is introduced to efficiently gain insightful understandings of vibration responses when a bearing has no local defects but has small manufacturing geometric errors. It shows that BPFO is the primary exciting source due to the existence of bearing clearance and elastic deformations, and the geometric errors, including various orders of runouts on different bearing components, can be the secondary ones, which lead to compound modulation excitations and thus responses with very low amplitudes often submerged in noises.
To accurately extract these small signatures and indicate bearing health conditions online, MSB analysis of the envelope signal is suggested as the effective tool to suppress strong noises. Moreover, the introduced novel indicator, MSB-Gini Index, allows for the quantitative indication of bearing clearance changes, especially with consistent engineering elucidations. Its performance has been evaluated by a dedicated bearing test and an industrial gearbox under a run-to-failure test. The indicative results for the bearings of the gearbox can be based on for the early health condition monitoring of WT assets.

Author Contributions

Conceptualization and validation by J.W., B.H., and F.G.; methodology development and literature review by C.Z.; the preparation of data, programming, and diagrams by M.X. All authors participated in the drafting and discussion of the manuscript. All authors have read and agreed to the published version of the manuscript.

Funding

This research was funded by the National Natural Science Foundation of China, Grant No. 51865045, 51965052, and 51565046, and the Science and Technology Plan Project of Inner Mongolia Autonomous Region, China, Grant No. KJJH007.

Acknowledgments

The authors gratefully acknowledge the support of the Centre for Efficiency and Performance Engineering (CEPE), University of Huddersfield, United Kingdom.

Conflicts of Interest

The authors declare no conflict of interest.

References

  1. Nandi, S.; Toliyat, H.A.; Li, X. Condition monitoring and fault diagnosis of electrical motors—A review. IEEE Trans. Energy Convers. 2005, 20, 719–729. [Google Scholar] [CrossRef]
  2. Zhen, D.; Guo, J.; Xu, Y.; Zhang, H.; Gu, F. A Novel Fault Detection Method for Rolling Bearings Based on Non-Stationary Vibration Signature Analysis. Sensors 2019, 18, 3994. [Google Scholar] [CrossRef] [Green Version]
  3. Billinton, R.; Chen, H. Determination of the optimum site-matching wind turbine using risk-based capacity benefit factors. IEEE Proc. Gener. Transm. Distrib. 1999, 146, 96–102. [Google Scholar] [CrossRef]
  4. Hansen, A.D.; Hansen, L.H. Wind turbine concept market penetration over 10 years (1995–2004). Wind Energy Int. J. Prog. Appl. Wind Power Convers. Technol. 2007, 10, 81–97. [Google Scholar] [CrossRef]
  5. Wang, T.; Han, Q.; Chu, F.; Feng, Z. Vibration based condition monitoring and fault diagnosis of wind turbine planetary gearbox: A review. Mech. Syst. Signal Process. 2019, 126, 662–685. [Google Scholar] [CrossRef]
  6. de Azevedo, H.D.M.; Araújo, A.M.; Bouchonneau, N. A review of wind turbine bearing condition monitoring: State of the art and challenges. Renew. Sustain. Energy Rev. 2016, 56, 368–379. [Google Scholar] [CrossRef]
  7. Zhao, D.; Li, J.; Cheng, W.; Wen, W. Compound faults detection of rolling element bearing based on the generalized demodulation algorithm under time-varying rotational speed. J. Sound Vib. 2016, 378, 109–123. [Google Scholar] [CrossRef]
  8. Yu, J.; Xu, Y.; Liu, K. Planetary gear fault diagnosis using stacked denoising autoencoder and gated recurrent unit neural network under noisy environment and time-varying rotational speed conditions. Meas. Sci. Technol. 2019, 30, 095003. [Google Scholar] [CrossRef]
  9. Osman, S.; Wang, W. A morphological Hilbert-Huang transform technique for bearing fault detection. IEEE Trans. Instrum. Meas. 2016, 65, 2646–2656. [Google Scholar] [CrossRef]
  10. Behzad, M.; Bastami, A. A new method for detection of rolling bearing faults based on the Local Curve Roughness approach. Pol. Marit. Res. 2011, 18, 44–50. [Google Scholar] [CrossRef] [Green Version]
  11. Yang, C.; Jia, M. A novel weak fault signal detection approach for a rolling bearing using variational mode decomposition and phase space parallel factor analysis. Meas. Sci. Technol. 2019, 30, 115004. [Google Scholar] [CrossRef]
  12. Wang, J.; Liang, Y.; Zheng, Y.; Gao, R.X.; Zhang, F. An integrated fault diagnosis and prognosis approach for predictive maintenance of wind turbine bearing with limited samples. Renew. Energy 2020, 145, 642–650. [Google Scholar] [CrossRef]
  13. Hu, L.; Zhang, L.; Gu, F.; Hu, N.; Ball, A. Extraction of the largest amplitude impact transients for diagnosing rolling element defects in bearings. Mech. Syst. Signal Process. 2019, 116, 796–815. [Google Scholar] [CrossRef] [Green Version]
  14. Halme, J.; Andersson, P. Rolling contact fatigue and wear fundamentals for rolling bearing diagnostics-state of the art. Proc. Inst. Mech. Eng. Part J J. Eng. Tribol. 2010, 224, 377–393. [Google Scholar] [CrossRef]
  15. Oswald, F.B.; Zaretsky, E.V.; Poplawski, J.V. Effect of internal clearance on load distribution and life of radially loaded ball and roller bearings. Tribol. Trans. 2012, 55, 245–265. [Google Scholar] [CrossRef]
  16. Halme, J. Condition monitoring of oil lubricated ball bearing using wear debris and vibration analysis. In Proceedings of the International Tribology Conference (AUSTRIB’02), Frontiers in tribology, Perth, Australia, 2–5 December 2002. [Google Scholar]
  17. Ocak, H.; Loparo, K.A.; Discenzo, F.M. Online tracking of bearing wear using wavelet packet decomposition and probabilistic modeling: A method for bearing prognostics. J. Sound Vib. 2007, 302, 951–961. [Google Scholar] [CrossRef]
  18. Rehab, I.; Tian, X.; Gu, F.; Ball, A.D. The influence of rolling bearing clearances on diagnostic signatures based on a numerical simulation and experimental evaluation. Int. J. Hydromechatronics 2018, 1, 16–46. [Google Scholar] [CrossRef]
  19. Sawalhi, N.; Randall, R.B. Simulating gear and bearing interactions in the presence of faults: Part I. The combined gear bearing dynamic model and the simulation of localised bearing faults. Mech. Syst. Signal Process. 2008, 22, 1924–1951. [Google Scholar] [CrossRef]
  20. Lazović, T.; Ristivojević, M.; Mitrović, R. Mathematical model of load distribution in rolling bearing. FME Trans. 2008, 36, 189–196. [Google Scholar]
  21. Yu, Y.; Chen, G.; Li, J.; Xue, Y.; Pang, B. Prediction Method for the Radial Runout of Inner Ring in Cylindrical Roller Bearings. Math. Probl. Eng. 2017, 2017, 1–13. [Google Scholar] [CrossRef]
  22. Li, C.S.; Mao, F.H. The impact of geometrical errors of deep-groove ball bearings on non-repetitive run-out. Modul. Mach. Tool Autom. Manuf. Tech. 2013, 1, 9–13. [Google Scholar]
  23. Lei, Y.; He, Z.; Zi, Y. A new approach to intelligent fault diagnosis of rotating machinery. Expert Syst. Appl. 2008, 35, 1593–1600. [Google Scholar] [CrossRef]
  24. Tandon, N.; Choudhury, A. A review of vibration and acoustic measurement methods for the detection of defects in rolling element bearings. Tribol. Int. 1999, 32, 469–480. [Google Scholar] [CrossRef]
  25. Ho, D.; Randall, R.B. Optimisation of bearing diagnostic techniques using simulated and actual bearing fault signals. Mech. Syst. Signal Process. 2000, 14, 763–788. [Google Scholar] [CrossRef]
  26. Antoni, J. Fast computation of the kurtogram for the detection of transient faults. Mech. Syst. Signal Process. 2007, 21, 108–124. [Google Scholar] [CrossRef]
  27. Barszcz, T.; JabŁoński, A. A novel method for the optimal band selection for vibration signal demodulation and comparison with the Kurtogram. Mech. Syst. Signal Process. 2011, 25, 431–451. [Google Scholar] [CrossRef]
  28. Moshrefzadeh, A.; Fasana, A. The Autogram: An effective approach for selecting the optimal demodulation band in rolling element bearings diagnosis. Mech. Syst. Signal Process. 2018, 105, 294–318. [Google Scholar] [CrossRef]
  29. Huang, B.; Feng, G.; Tang, X.; Gu, J.X.; Xu, G.; Cattley, R.; Gu, F.; Ball, A.D. A Performance Evaluation of Two Bispectrum Analysis Methods Applied to Electrical Current Signals for Monitoring Induction Motor-Driven Systems. Energies 2019, 12, 1438. [Google Scholar] [CrossRef] [Green Version]
  30. Tian, X.; Gu, J.X.; Rehab, I.; Abdalla, G.M.; Gu, F.; Ball, A.D. A robust detector for rolling element bearing condition monitoring based on the modulation signal bispectrum and its performance evaluation against the Kurtogram. Mech. Syst. Signal Process. 2018, 100, 167–187. [Google Scholar] [CrossRef]
  31. Guo, J.; Zhen, D.; Li, H.; Shi, Z.; Gu, F.; Ball, A.D. Fault feature extraction for rolling element bearing diagnosis based on a multi-stage noise reduction method. Measurement 2019, 139, 226–235. [Google Scholar] [CrossRef] [Green Version]
  32. Rehab, I.; Tiana, X.; Hu, N.; Yan, T.; Zhang, R.; Gu, F.; Ball, A. A study of two bispectral features from envelope signals for bearing fault diagnosis. In Proceedings of the 1st International Conference on Maintenance Engineering, Manchester, UK, 30–31 August 2016. [Google Scholar]
  33. You, K.J.; Noh, G.J.; Shin, H.C. Spectral Gini Index for quantifying the depth of consciousness. Comput. Intell. Neurosci. 2016, 2016. [Google Scholar] [CrossRef] [PubMed] [Green Version]
  34. Miao, Y.; Zhao, M.; Lin, J. Improvement of kurtosis-guided-grams via Gini index for bearing fault feature identification. Meas. Sci. Technol. 2017, 28, 125001. [Google Scholar] [CrossRef]
  35. Sun, X.; Zhang, R.; Lu, K.; Ahmaida1, A.; Gu, F.; Wang, T. Monitoring of Gear Wear Progressions based on a Modulation Signal Bispectrum Analysis of Vibration Response. In Proceedings of the 16th International Conference on Condition Monitoring and Asset Management, Glasgow, UK, 25–27 June 2019. [Google Scholar]
Figure 1. Free-body diagram of a shaft-housing vibration system [18].
Energies 13 00389 g001
Figure 2. Rolling element load distribution for different amounts of clearances.
Energies 13 00389 g002
Figure 3. Load distribution with different clearances.
Energies 13 00389 g003
Figure 4. Load distribution for each element (a) clearance ratio r = 0 and (b) r = 2.
Energies 13 00389 g004
Figure 5. Dynamic force waveforms and spectrum for error-free cases.
Energies 13 00389 g005
Figure 6. Influence of different runouts on load distributions: (a) normal, (b) inner race runout, (c) ball runout, and (d) non-uniform cage.
Energies 13 00389 g006
Figure 7. Dynamic force waveforms and spectra under different clearances and errors.
Energies 13 00389 g007
Figure 8. Experimental setup: (a) illustrative diagram; and (b) schematic drawing [18].
Energies 13 00389 g008aEnergies 13 00389 g008b
Figure 9. Spectrum of signals under different clearances and loads.
Energies 13 00389 g009
Figure 10. Comparison of envelope spectra between different clearances.
Energies 13 00389 g010
Figure 11. MSB magnitudes for (a) CN and (b) C4 bearings; MSB magnitudes for small defects on the (c) outer race and (d) inner race.
Energies 13 00389 g011
Figure 12. MSB slices for different clearances and local defects.
Energies 13 00389 g012
Figure 13. MSB bearing Gini Index for different clearances.
Energies 13 00389 g013
Figure 14. MSB-Gini Index for different clearances and different local faults under different loads.
Energies 13 00389 g014
Figure 15. The schematic diagram of bearings in the 10 kW two-stage helical gearbox.
Energies 13 00389 g015
Figure 16. MSB-Gini Index and peak values of bearings in gearbox versus operating time, (a) MSB-Gini Index and (b) MSB magnitude peak under different operating time.
Energies 13 00389 g016
Table 1. 6206 deep groove ball bearing clearance values and local defect sizes.
Bearing Grade: CN with Clearance of 6–20 µmCharacteristic Frequencies:
Bearing ConditionClearanceWidth of Sparked Groove
Bearing for health8.3 (µm) Shaft speed
f s = 25 Hz
Bearing for Outer race fault6.0 (µm)0.2 mm on outer race
Bearing for Inner race fault13 (µm)0.2 mm and 0.4mm on inner races
Bearing Grade: with Clearance of (28–46 µm)
Bearing conditionClearance Width of sparked groove (mm)BPFO = 89.4 (Hz)
Bearing for health bearing40.8 (µm) BPFI = 135.6 (Hz)
Bearing for outer race fault35.7 (µm)0.2 mm on outer raceBSF = 58.3 (Hz)
Bearing for inner race fault43.5 (µm)0.2 mm and 0.4 mm on inner racesFCF = 9.9 (Hz)

