Article

Intelligent Recognition of Insulator Contamination Grade Based on the Deep Learning of Ultraviolet Discharge Image Information

College of Automation & Electronic Engineering, Qingdao University of Science and Technology, Qingdao 266042, China
*
Author to whom correspondence should be addressed.
Energies 2020, 13(19), 5221; https://doi.org/10.3390/en13195221
Submission received: 19 August 2020 / Revised: 27 September 2020 / Accepted: 30 September 2020 / Published: 7 October 2020

Abstract

:
In order to achieve the noncontact detection of the contamination grade of insulators and to provide guidance for preventing the contamination flashover of insulators based on the pollution state, we propose a contamination grade recognition method based on the deep learning of ultraviolet discharge images using a sparse autoencoder (SAE) and a deep belief network (DBN). Under different humidity conditions, we filmed and preprocessed the ultraviolet discharge images of insulators at different contamination grades and we obtained the ultraviolet spot area sequence as original data for contamination grade recognition. A double-layer sparse autoencoder was used to extract sparse features that could characterize different contamination grades from the ultraviolet spot area sequence. Using the extracted features, a DBN composed of three layers of restricted Boltzmann machine was trained to provide contamination grade recognition. To verify the effectiveness of the method proposed in this paper, high-voltage experiments were performed on contaminated insulators at relative humidity levels of 80%, 85%, and 90%, and ultraviolet images were recorded. The proposed SAE–DBN method was used to identify the ultraviolet images of the insulators with different contamination grades. The recognition accuracy rates at the three humidity levels were 91.25%, 93.125%, and 92.5%. The experimental results showed that this method could accurately recognize the contamination grade of the insulator and provide guidance for the prevention of contamination flashover based on the pollution severity.

1. Introduction

With the expansion of power grids and the intensification of environmental pollution, insulator flashover accidents pose a serious threat to the safe operation of a power system [1,2,3,4,5]. As an indispensable part of a power system, insulators are widely used in different portions of transmission lines, power plants, and substations. Due to the presence of various contaminants in natural environments, the accumulation of surface contaminants cannot be avoided. This has prevented contamination flashover accidents from being fundamentally eliminated. Contamination flashovers can cause large-scale power outages in a power system and seriously threaten the reliable operation of a power grid. Currently, damages due to insulator flashover have exceeded the damages due to lightning, and this type of damage has become the greatest threat to the safe and reliable operation of power systems. It is therefore of important to take effective measures to prevent contamination flashover accidents and to ensure the safety of a power grid [6,7,8,9,10].
The conventional procedure for maintaining the safe and stable operation of a power system is to formulate a cleaning plan for the distribution of different polluted areas and to regularly clean the transmission and transformation equipment, including insulators. This type of method can ensure the electrical insulation strength of an insulator to a certain degree and reduce the probability of contamination flashover events. However, the disadvantage of this approach is that it is largely untargeted. Without a timely and accurately grasp of the degree of contamination on the surface of the insulator in operation, this method involves cleaning lines and equipment that do not need to be cleaned, which results in wasted manpower and material resources. Another disadvantage of this method is that due to the complexity of meteorological environments and onsite contamination scenarios, the possibility of contamination flashover remains even if the cleaning task is carried out according to the plan. In addition, in order to clean the lines and equipment, it is generally necessary to have extended power outages. The usual practice is to take turns when cleaning the power lines. With the increasing shortage of electric power, this can lead to major economic losses for the power industry and the users of electric power. Moreover, the power transmission lines cover long distances and they are widely distributed, often passing through farmland, forests, mountains, rivers, and lakes, and the cleaning operation must be done at elevated heights. All of these factors have increased the labor intensity and the risks of the cleaning crew. With the growing pollution in the environment and the frequent occurrence of acid rain and acid fog, it has become increasingly difficult to guarantee the quality of a cleaning operation and to maintain operation over the long term. Contamination flashover incidents due to improper cleaning have indeed occurred. Relying on large-scale scheduled cleaning for power grid safety and contamination flashover prevention requires a vast investment of maintenance costs and human resources. This can no longer meet the management requirements of a modern power grid. The fundamental reason why the current flashover prevention measures are unsatisfactory is that a maintenance crew cannot determine the contamination accumulation conditions in a timely and accurate manner. By monitoring the contaminant accumulation status on an insulator surface with online inspection methods and providing a maintenance crew with timely information on the contaminant conditions, the insulators can be swept or flushed clean in a timely manner. Such a system would not only reduce the labor of blindly cleaning, but can prevent the occurrence of flashover incidents to the maximum degree possible.
To address the problem of insulator flashover, researchers have conducted extensive investigations and made considerable progress [11,12,13,14,15,16,17]. However, there is still a lack of mature, reliable, accurate, and economical online monitoring technology for insulator decontamination. At an operating voltage, the uneven distribution of leakage currents on the surface of a wet contaminated insulator will lead to an uneven distribution of the temperature rise on the insulator surface, which will in turn cause the nonuniform drying of the pollutant layer. During specific environmental humidity, the uneven distribution of the surface conductivity of a nonuniformly dried insulator surface is highly prone to local discharge. Due to the differences in surface conductivity, insulators with different contamination grades will have different discharge intensities. An ultraviolet imager may be used to detect the 240–280 nm solar-blind ultraviolet rays emitted by the discharge. Due to the differences in the ultraviolet images of insulators with different discharge intensities, these types of ultraviolet images can be used to recognize insulators with different contamination grades. Compared to thermal imaging cameras, ultraviolet images are less affected by environmental factors such as sunlight, ambient temperature, and wind, and ultraviolet images are more suitable for the onsite detection of power equipment failures. Compared with the equivalent salt density testing, leakage current monitoring, and acoustic signal monitoring, the use of ultraviolet images for insulator pollution grade monitoring has the following advantages: (1) it is a noncontact and nondestructive form of testing, (2) it does not require powering off, (3) the operator does not need to work at an elevated height, (4) there is no need to install detection equipment on the transmission line, and (5) it can directly locate the position where a discharge occurs. A miniaturized ultraviolet imager can be installed on platforms such as inspection robots and inspection drones. Artificial intelligence and deep learning modeling can be combined with ultraviolet imaging to achieve the intelligent recognition of the insulator contamination status, provide guidance for insulator cleaning, and elevate the current system of schedule-based contamination flashover prevention to a condition-based form of maintenance.
As an emerging field of machine learning, deep learning is more capable of discovering and characterizing the complex internal structural features of a problem when compared to conventional shallow learning. A deep learning model is composed of multiple layers of nonlinear computing units, and the output of the lower layer is used as the input of the higher layer. The final feature expression contains many types of structural information for the input data, which expresses the data abstractly, thereby improving the accuracy of the identification. Due to its powerful feature learning capabilities, deep learning can directly learn deep features from raw data. With its powerful feature learning capability, deep learning can directly extract deep features from original data. The features extracted by deep learning are not designed or chosen artificially, but are instead more abstract higher-level expressions that are formed from lower level features for the purpose of approximating complex functions and classifying complex problems [18]. The autoencoder (AE) and deep belief network (DBN) are two deep learning methods that have been successfully used in the field of condition monitoring and fault diagnosis. The AE and DBN methods can be used in feature extraction and classification tasks, respectively. Feature extraction is an important part of recognition and diagnosis and it can directly affect the validity and accuracy of recognition and diagnosis. An autoencoder algorithm is an unsupervised learning algorithm that is mainly used for data dimensionality reduction and feature extraction. Compared with conventional feature extraction methods such as principal components analysis (PCA), self-encoders can effectively characterize nonlinear transformations. By adding sparse constraints to the self-encoder model and allowing only some of the nodes to activate, one can construct a sparse autoencoder (SAE) that provides a better description of sample characteristics, reduces the dimension of the data effectively, and improves the generalization ability and classification accuracy of a model. The DBN model is a representative deep learning model that consists of multiple restricted Boltzmann machines (RBMs). It can discover the deep structural information of data and it can achieve the learning of complex nonlinear features.
Our ultimate research goal is to provide an automatic and intelligent information processing method for insulator pollution condition monitoring in power inspection. The miniaturized UV imager can be installed on the inspection robot, inspection vehicle, UAV and other platforms. Combined with the results of this paper and our follow-up research results, the monitoring of insulator pollution status can be realized. The inspection robot, inspection vehicle and UAV are reusable platforms. In addition, considering the huge loss caused by contamination flashover, this method has good economic performance. In current research, image storage and processing are carried out on a computer. In future applications, images can be captured and stored on a UAV or inspection robot, read after returning to the base, or use wireless data transmission network to send images back to the base for processing on the computer.
The research objectives of this study were the cap and pinsuspension insulators that are widely used on transmission lines. First, high-voltage experiments and ultraviolet imaging were performed on artificially contaminated insulators under different humidity conditions. Second, the ultraviolet images were preprocessed to obtain the ultraviolet spot area sequence. Then, sparse features that were representative of the contamination status were extracted from an ultraviolet spot area sequence using SAE. Finally, the extracted features were used to train a DBN to accomplish the contamination status recognition for the insulators. The rest of this article includes the following sections. Section 2 introduces the theory of SAE and DBN in detail. In Section 3, the high-voltage experiment and the ultraviolet imaging of the artificially contaminated insulators are described. Section 3 also describes how the contamination grade identification methods based on SAE and DBN that are proposed in this paper were used to achieve contamination grade recognition for insulators at different humidities. Finally, Section 4 summarizes the conclusions of this study.

2. Theories of SAE and DBN

2.1. Extraction of Sparse Features with Sparse Autoencoder

An autoencoder consists of a three-layer feed forward neural network. Unsupervised training is performed using the approximate optimization condition between the features that are reconstructed by the autoencoder and the original features. This allows unlabeled samples to be used for training and it solves the difficulty of requiring a large number of labeled training samples when classifying high-dimensional data. A sparse autoencoder is the restriction condition for adding sparseness in the representation of the encoding process [19]. The algorithm has the following specific steps:
(1) The original data x R n 1 ( n 1 represents the number of nodes on the input layer) are mapped to the encoding results x R n 2 of the hidden layer through the linear function and the activation function f ( · ) in order to obtain the coding result ( n 2 represents the number of nodes of the hidden layer). Therefore:
X = f ( W 1 x + B 1 ) = 1 / [ 1 + e ( W 1 x + B 1 ) ]
Through the same process, X is mapped to the reconstruction layer to obtain Z R n 1 . Therefore:
Z = f ( W 2 X + B 2 )
In the formula, X is a characteristic expression of the original data, W 1 , W 2 , B 1 , and B 2 are the weights and biases from the input layer to the hidden layer, and from the hidden layer to the reconstruction layer.
(2) By approximating x and Z via adjusting W 1 , W 2 , B 1 , and B 2 , and by adding the restriction sparse representation, the following mathematical expression is arrived at:
ρ i 1 N K = 1 N X j ( K ) = ρ  
In the expression, N is the number of samples, ρ i is the fraction of nonzero elements in the j-th component of N data sets, and ρ is the settable hyperparameter. The loss function is then obtained as:
J ( W 1 , B 1 , W 2 , B 2 ) = 1 N K = 1 N Z ( K ) x ( K ) 2
+ λ ( W 1 F 2 + W 2 F 2 )
+ μ j = 1 n 2 K L ( ρ ρ i )
K L ( ρ ρ i ) = ρ log ρ ρ i + ( 1 ρ ) log 1 ρ 1 ρ i
where W 1 F 2 + W 2 F 2 is a regular term, j = 1 n 2 K L ( ρ ρ i ) is a sparse penalty term, and λ and μ are the weight coefficients of the regular term and the sparse penalty term.
(3) The training parameters   W 1 , W 2 , B 1 , and B 2 are the updated optimization of the loss function via an iterative algorithm until the algorithm converges. The following training parameters and encoding results are obtained:
J ( W , B ) W k = [ 1 N k = 1 N J ( W , B , Z ( k ) , x ( k ) ) W k ] + 2 λ W k
J ( W , B ) B k = 1 N k = 1 N J ( W , B , Z ( k ) , x ( k ) ) B k
W k = W k α J ( W , B ) W k
B k = B k α J ( W , B ) B k
In the formula, x ( k ) and Z ( k ) represent the k-th original data set and the reconstructed data set and α represents the learning rate.
By stacking multiple sparse autoencoders, one obtains a stacked sparse autoencoder. Each hidden layer learns a greater amount of abstract features from the previous layer in order to obtain high-dimensional feature information. The training process of each layer in the multilayer sparse autoencoder is the same as that of the single-layer sparse autoencoder; that is, each layer minimizes the loss function and at the same time obtains the optimized weights and biases. After all the layers have been properly trained, the multilayer stacked sparse autoencoder can learn a greater number of abstract expressions of the original data features.

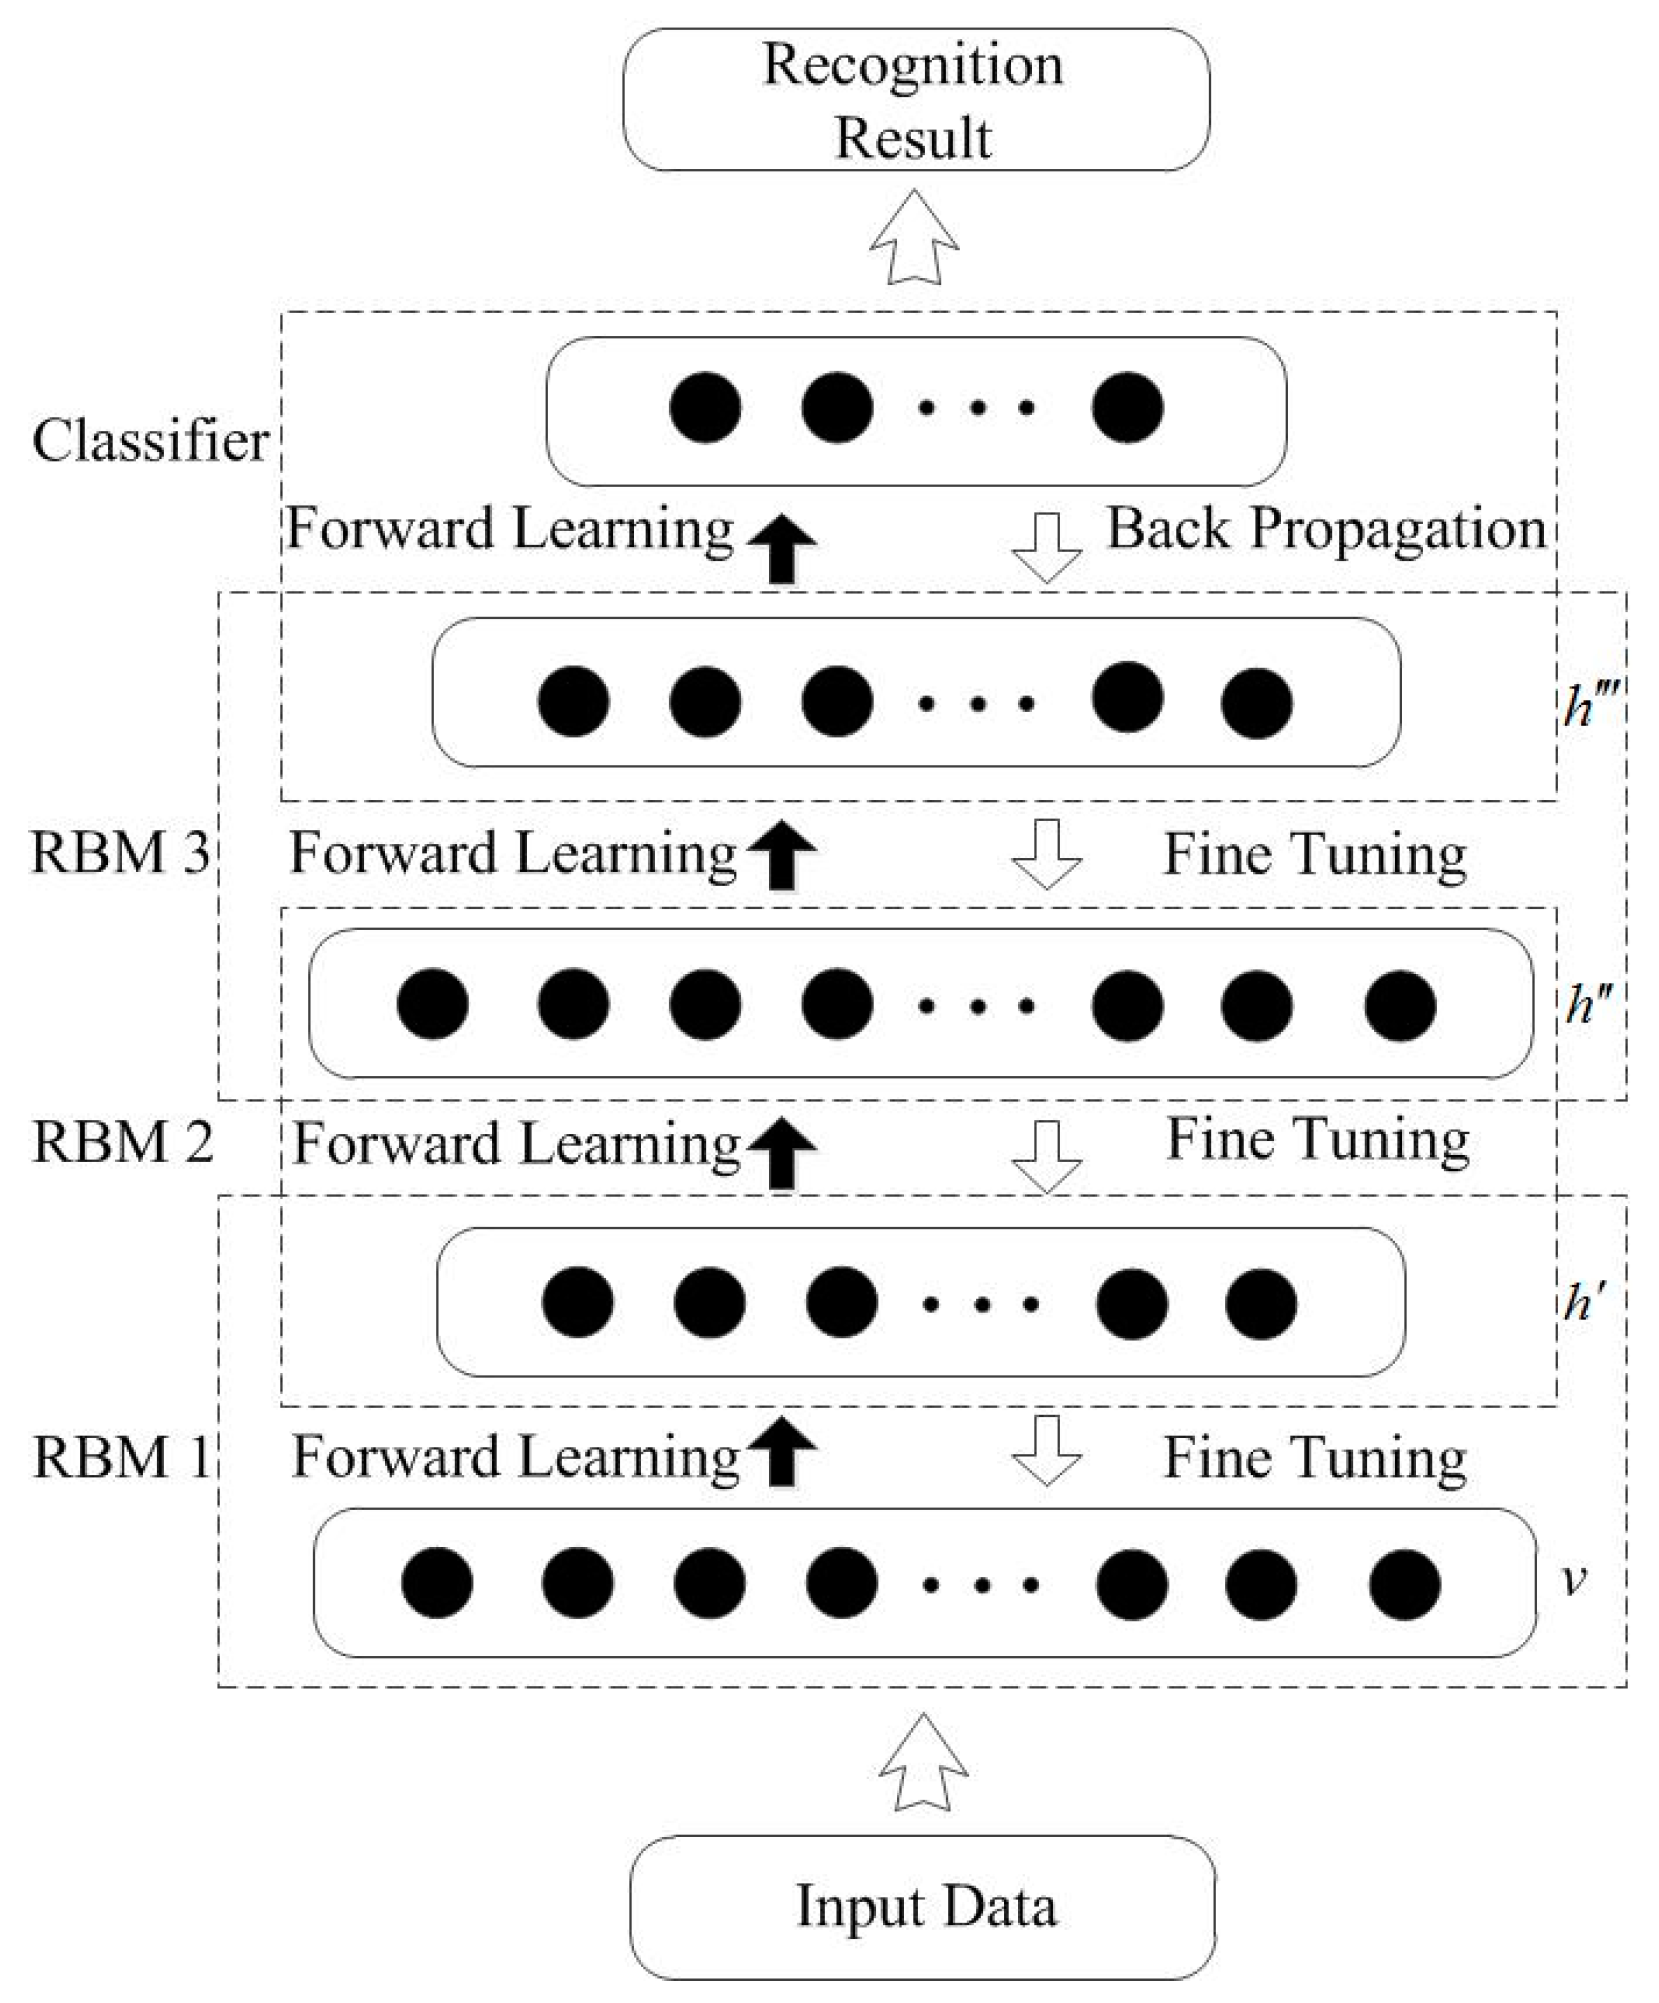
2.2. Deep Belief Network

The contamination grade recognition of insulators is achieved by training a DBN using the sparse features extracted by an SAE. The essence of a deep belief network is a multilayered perceptron neural network composed of multiple restricted Boltzmann machines (RBM). Figure 1 shows a DBN model composed of three RBM. The core idea of DBN is layer-by-layer greedy learning. The initial training method is unsupervised layer-by-layer learning. Unsupervised layer-by-layer training can lead to learning some complex signal functions with high-dimensional nonlinearity, nonstationary characteristics, and weak state signals. Through lower layer RBM, the output results of the input data serve as the input of higher level RBM, and then, in a layer-by-layer fashion, a more abstract and feature-capable representation is formed at the upper layer than the lower layer. Subsequently, by adding a classifier and using supervised reverse fine-tuning, the fault-recognition capability of the DBN is optimized.

2.2.1. Forward Unsupervised Layer-by-Layer Learning of RBM

RBM use an energy-based model. There are a number of neurons in each layer of an RBM network, and each neuron has only two states: activated and inactive, represented by {1,0}. Letting there be n   visual elements in an RBM with their states represented by v = ( v 1 , v 2 , , v n ) , and letting there be m invisible elements with their states represented by h = ( h 1 , h 2 , , h m ) , the energy function of the RBM can then be defined as:
E ( v , h ; θ ) = i = 1 n a i v i j = 1 m b j h j i = 1 n j = 1 m v i w i j h j
In the expression, v i is the state of the i-th element of the visible layer, h j is the state of the j-th element of the hidden layer, θ = ( w i j , a i , b j ) is the value of the reference parameter for training the RBM, w i j is the connecting weight between the i-th neuron of the visible layer and the j-th neuron of the hidden layer, a i and b j are the bias values of the i-th element of the visible layer and the j-th element of the hidden layer, respectively. Based on this energy function, the joint probability distribution of ( v , h ) is obtained:
P ( v , h ; θ ) = 1 Z ( θ ) e E ( v , h ; θ )
The conditional probabilities of the visible layer and the hidden layer are:
P ( v | h ; θ ) = P ( v , h ; θ ) P ( h ; θ ) = i P ( v i | h ; θ )
P ( h | v ; θ ) = P ( v , h ; θ ) P ( v ; θ ) = j P ( h j | v ; θ )
Since there is no connection between the independent elements of a layer, the activation probability may be derived as:
P ( v i = 1 | h ; θ ) = 1 [ 1 + e ( a i j w i j h j ) ]
P ( h j = 1 | v ; θ ) = 1 [ 1 + e ( b j i v i w i j ) ]
The parameter θ can be obtained by maximizing the logarithmic-likelihood function, i.e.,
L ( θ ; v ) = v L ( θ | v ) = v P ( v )
Generally, the maximum value of L ( θ ) is obtained with the method of gradient ascent, but due to the existence of the normalization factor ( θ ) , it is difficult to calculate the result directly. To that end, Hinton [20] proposed a contrastive divergence (CD) fast algorithm to obtain the parameter θ . Using Equations (14)–(16) with the CD fast algorithm, the update criterion for parameter θ is obtained:
{ w i j k + 1 = w i j k + ε ( v i h j d a t a v i h j r e c o n ) a i k + 1 = a i k + ε ( v i d a t a v i r e c o n ) b j k + 1 = b j k + ε ( h j d a t a h j r e c o n )
where ε is the learning rate, · d a t a is the expectation defined by the observation data model, and · r e c o n is the expectation defined by the reconstructed model.

2.2.2. Backward Supervised Fine-Tuning Learning

The model parameters are obtained from forward unsupervised RBM layer-by-layer learning. The parameters are then used as the initialization values for the backward supervised fine-tuning. The training results of the entire model can be further improved through backward supervised fine-tuning learning. The optimization process begins with the last layer of the network, and the optimization process uses the known labels to fine-tune the parameters to the lower layers in a step-by-step fashion. The last layer of the network uses a soft-max multiclass logistic regression model as a classifier model. Assuming that the DBN network is composed of l layers of an RBM stack with x being the initial input sample, the last layer output vector is u l ( x ) :
u l ( x ) = 1 1 + e [ a l + w l u l 1 ( x ) ]
After the i-th sample undergoes forward l-layer unsupervised RBM learning, it belongs to the category y i ( 1 , 2 , , c ) with a probability of
P ( y i = k | u l ( x i ) , V l , c l ) = e [ V k l u l ( x i ) + c l ] k = 1 c e [ V k l u l ( x i ) + c l ]
In the expression, V is the parameter coefficient, and the category corresponding to the maximum probability is selected as the category determined by the soft-max classifier. The expression of the error function of the l-th layer is
J ( λ l ) = 1 m [ i = 1 m k = 1 c 1 { y i = k } log ρ ]
where ρ is the weight decay rate and λ l = { w l , a l , c l , V l } , 1 { y i = k } is the logic indication function, which has a value of 1 when y i = k and is otherwise zero:
𝛻 λ l J ( λ l ) = 1 m i = 1 m [ u l ( x ^ i ) ( 1 { y i = k } h l ( x ^ i ) ) ]
The fine-tune parameter is:
λ l ˜ = λ l ε 𝛻 λ J ( λ l )
In the formula above, ε is the rate of learning. Similarly, in going to the lower layers, each layer is fine-tuned until the relevant parameters of the initial layer are reached.

3. Experimental Results and Analysis

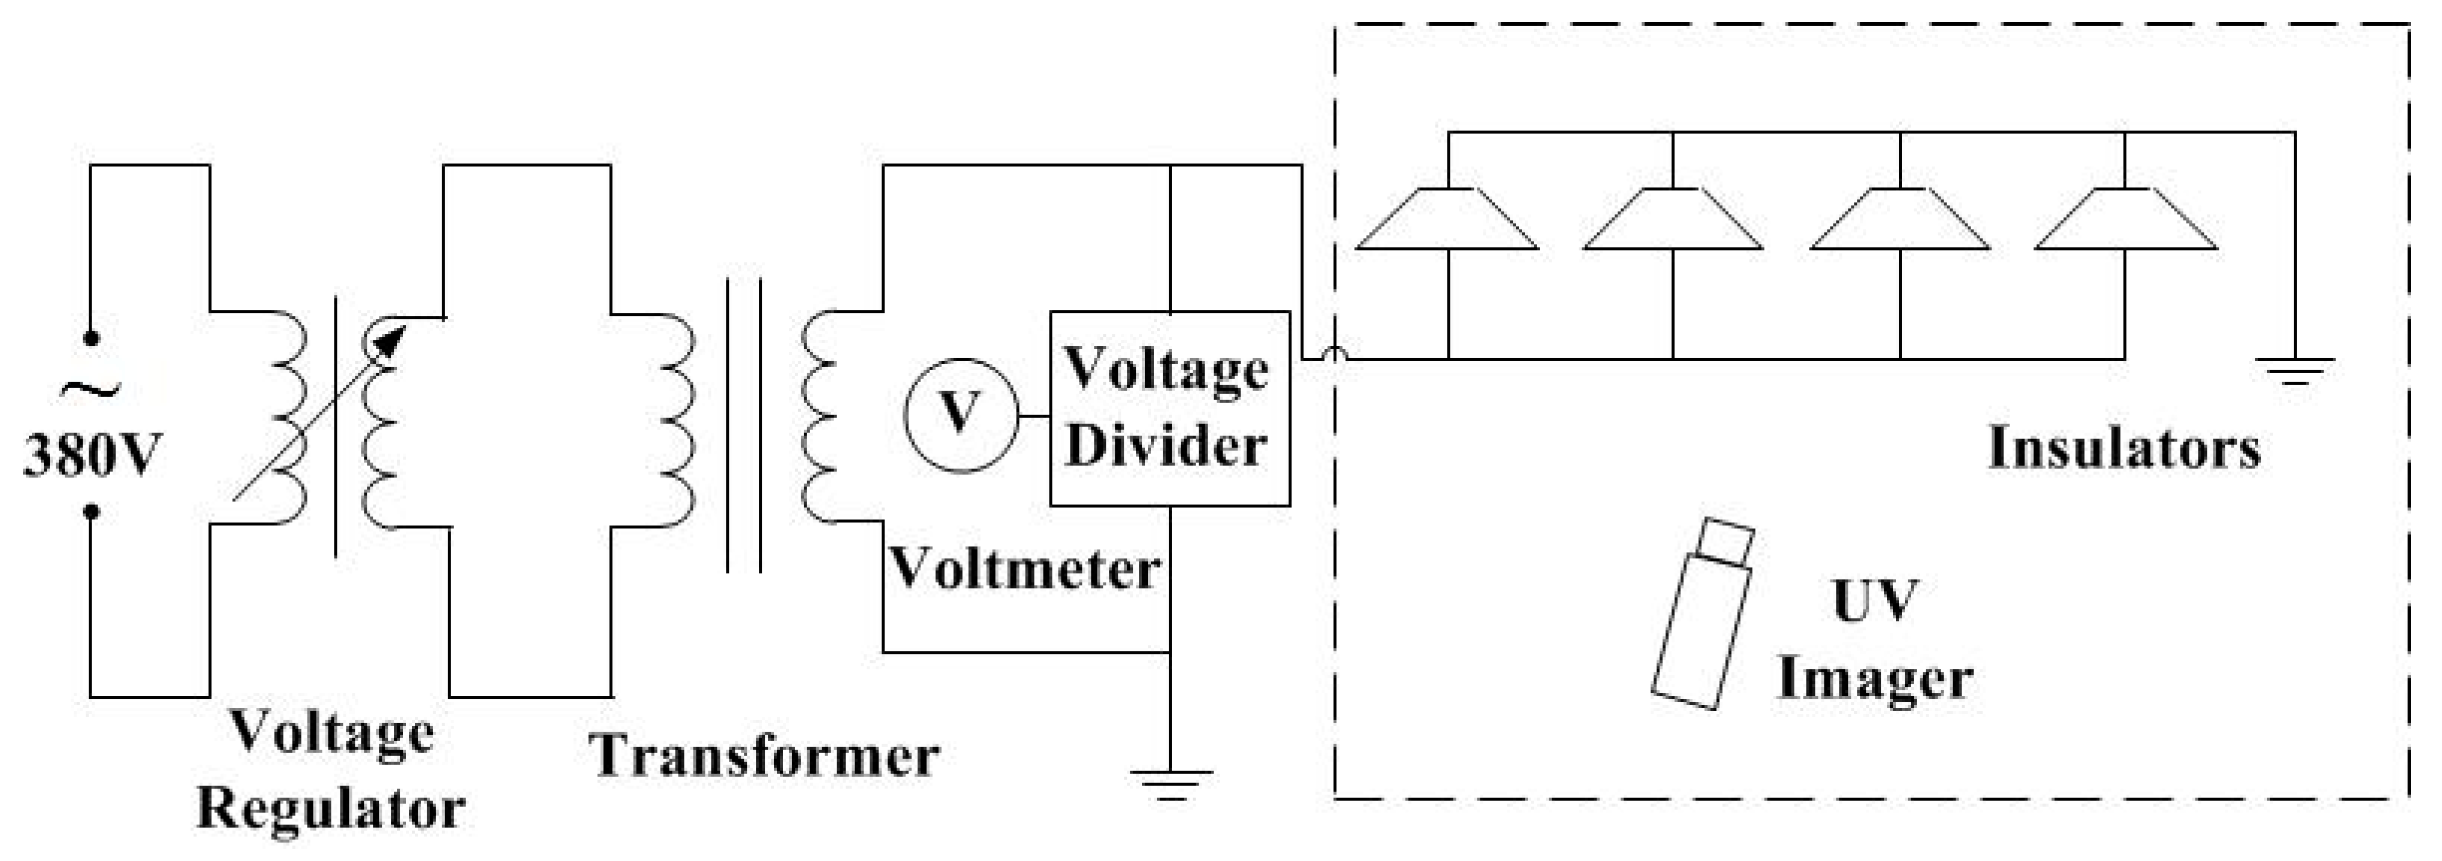
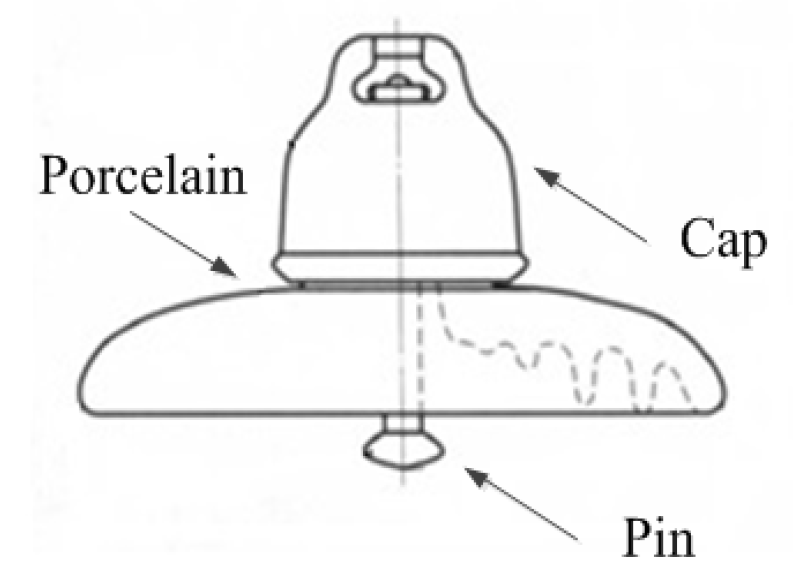
3.1. High Voltage Experiment for Contaminated Insulators

In order to obtain ultraviolet images of insulators with different levels of contamination while they were in service, we carried out high-voltage tests on manually smeared insulators. The test subjects of the experiment were the widely used model XP-70 disc suspension ceramic insulators for power systems. Their main parameters are shown in Table 1.
Insulator coating and high-voltage experiments were carried out in accordance with the IEC60507 standard. After the insulator was cleaned, it was coated uniformly with a solid coating method. NaCl was used to simulate conductive materials in the contamination, and kaolin was used to simulate insoluble materials in the contamination. To simulate the four contamination grades of I, II, III, and IV, equivalent salinity deposit density (ESDD) was selected from the four ranges shown in Table 2. The nonsoluble deposit density (NSDD) was uniformly 1 mg/cm2.
The experimental wiring was as shown in Figure 2. When the relative humidity was lower than 75%, the soluble salts on the surface of the insulator were not sufficiently dissolved, so the leakage current was very low and the surface discharge was either not obvious or nonobservable. When the ambient humidity was higher than 90%, the discharge phenomenon on the surface of the insulator was intensified and discharge arcing may have even been observable with the naked eye. The vigorous discharge phenomenon saturated the ultraviolet image, so that ultraviolet images taken at high humidity conditions were not suitable for subsequent processing and recognition. In order to simulate the operation of contaminated insulators at elevated relative humidity, the high-voltage experiments were conducted at relative humidities of 80%, 85%, and 90%. The allowable tolerance of the relative humidity was ± 2 % . The structure of a cap and pin insulator is shown in Figure 3.
Due to the small radius of the area underneath the cap and pin insulator where the pin was connected to the porcelain surface of the insulator, the current density was very high and the heating effect was pronounced. Since the heating was concentrated in the area around the pin on the bottom, the water content in the contamination layer was evaporated vigorously and this drying zone enhanced the intensity of the local electric field and made discharge extremely likely. In the experiment, stable discharge was concentrated in this area and the primary form of discharge was corona discharge. At the same time, no stable discharge was found in other parts of the insulator. Therefore, the filming of the ultraviolet image was captured on the lower surface of the disk. For each humidity condition, five insulators with each of the four contamination grades, I, II, III, and IV, were selected and tested separately. The voltage that was applied to each insulator was the rated operating voltage of model XP-70 insulators, 10 kV. Generally speaking, each insulator on the same string had the same contamination grade. The contamination grade of the whole insulator string could be described by identifying the pollution state of one insulator. Five groups of samples were tested under three different humidity conditions, and the experimental results were basically the same, indicating that the test had good repeatability. The training samples and test samples were extracted from five groups of experimental samples.

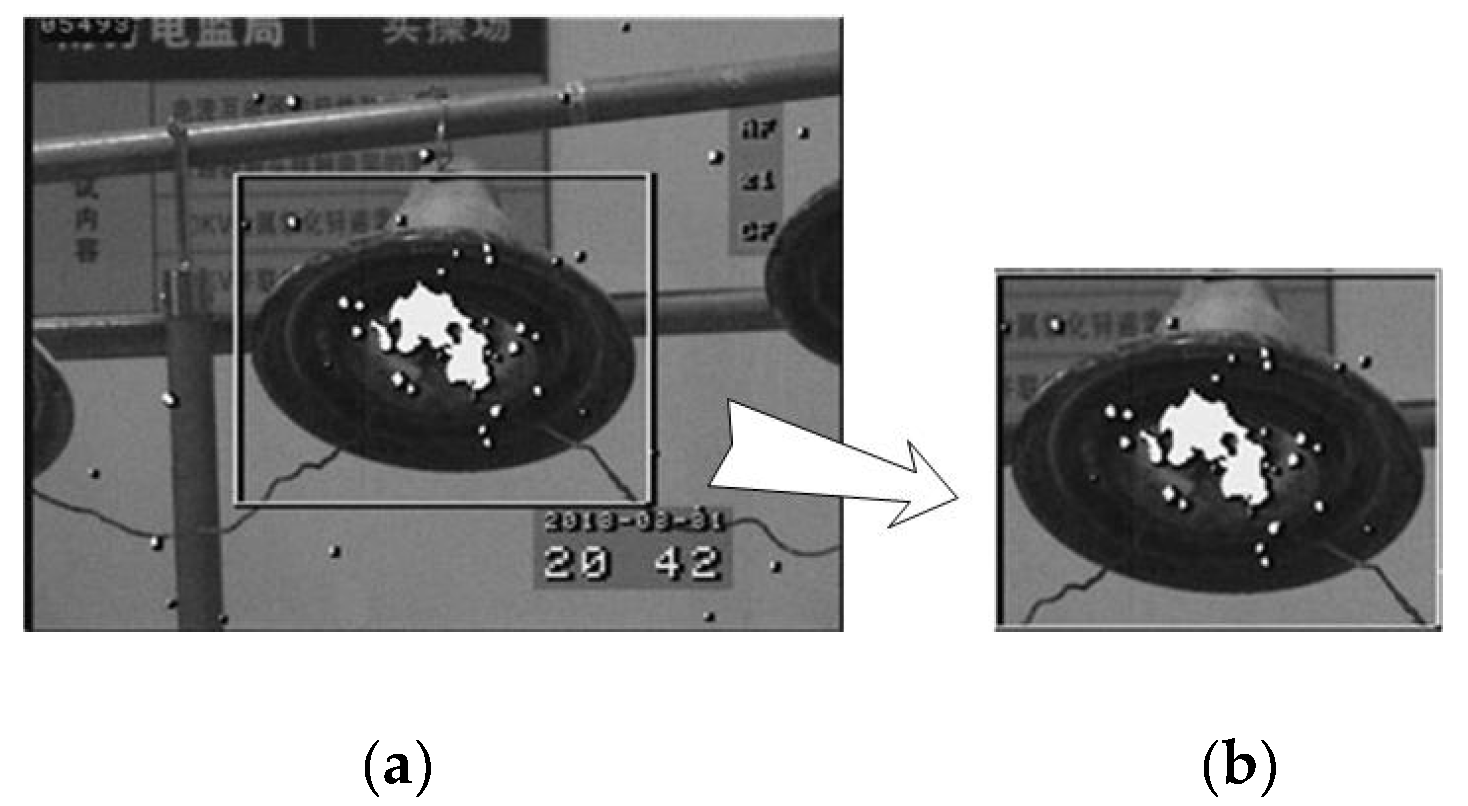
3.2. Preprocessing of the Ultraviolet Images

The ultraviolet imager model was a CoroCAM-504. The ultraviolet imager was capable of recording ultraviolet images and video. The video recorder used SONY VDR-MC3 and each second of video was composed of 25 frames. The video was converted into a string of frames for subsequent processing. The ultraviolet filming distance was 4 m, the gain was 70%, and the threshold was 40%. Figure 4 shows an image of the obtained ultraviolet video. The insulator was placed at the center of the white framed area (as shown in Figure 4b).The white discharge spot was located mainly in this central area and the subsequent research focused on this part. Figure 5 shows the typical images of the ultraviolet discharge when the relative humidity was 85%.
The discharge area in the ultraviolet image was displayed as a white light spot. By calculating the number of pixels in the white spot, i.e., the area of the white spot, the strength of the discharge could be characterized. First, the color image was converted to a grayscale image represented by 256 levels of gray from 0 to 255, where 0 represented black and 255 represented white. Then all areas except the white pixels were set to black and the grayscale image was converted into a binary image. In the binary map shown in Figure 6 and Figure 7, the area of the light spot is white and the background area is black. This accomplished the extraction of the discharge spot area.
The result in Figure 8 shows the distribution curve of the spot pixels of the UV images within 10 s (250 frames) of each insulator with different contamination grades for different humidities. It can be seen that as the contamination grade increased, the value of the spot pixels also increased. By using an ultraviolet imager, we could therefore display the differences in the discharge intensity of the insulators with different contamination grades. Since there were overlaps in the ultraviolet spot area curves for the insulators with different contamination grades, the area of the spot changed at the same time that the ambient humidity changed. Generally speaking, the discrimination of UV spot area curves of insulators with different contamination grades was not as obvious as the typical curves shown in Figure 8. It is difficult to get the ideal effect by simply comparing the spot area value to distinguish the contamination grade, and the result is easily affected by the environmental humidity. Therefore, artificial intelligence methods were utilized to achieve the accurate and efficient recognition of contamination grades.
Each second of video was composed of 25 image frames. The video was converted into a string of frames for subsequent processing. In addition, the ultraviolet image sequences were partitioned in groups of 100 frames (four seconds long) to calculate the light spot area of each image. Each set of images served as a sample. That is to say, every four seconds of video was taken as one sample. The number of test samples was 160, of which the four contamination grades of I, II, III, and IV each had 40 samples. In our current research, the test sample set corresponds to 160 s of video. The images were processed at an interval of 160 s (4000 image frames). The number of samples for training and testing can be adjusted according to the actual application.

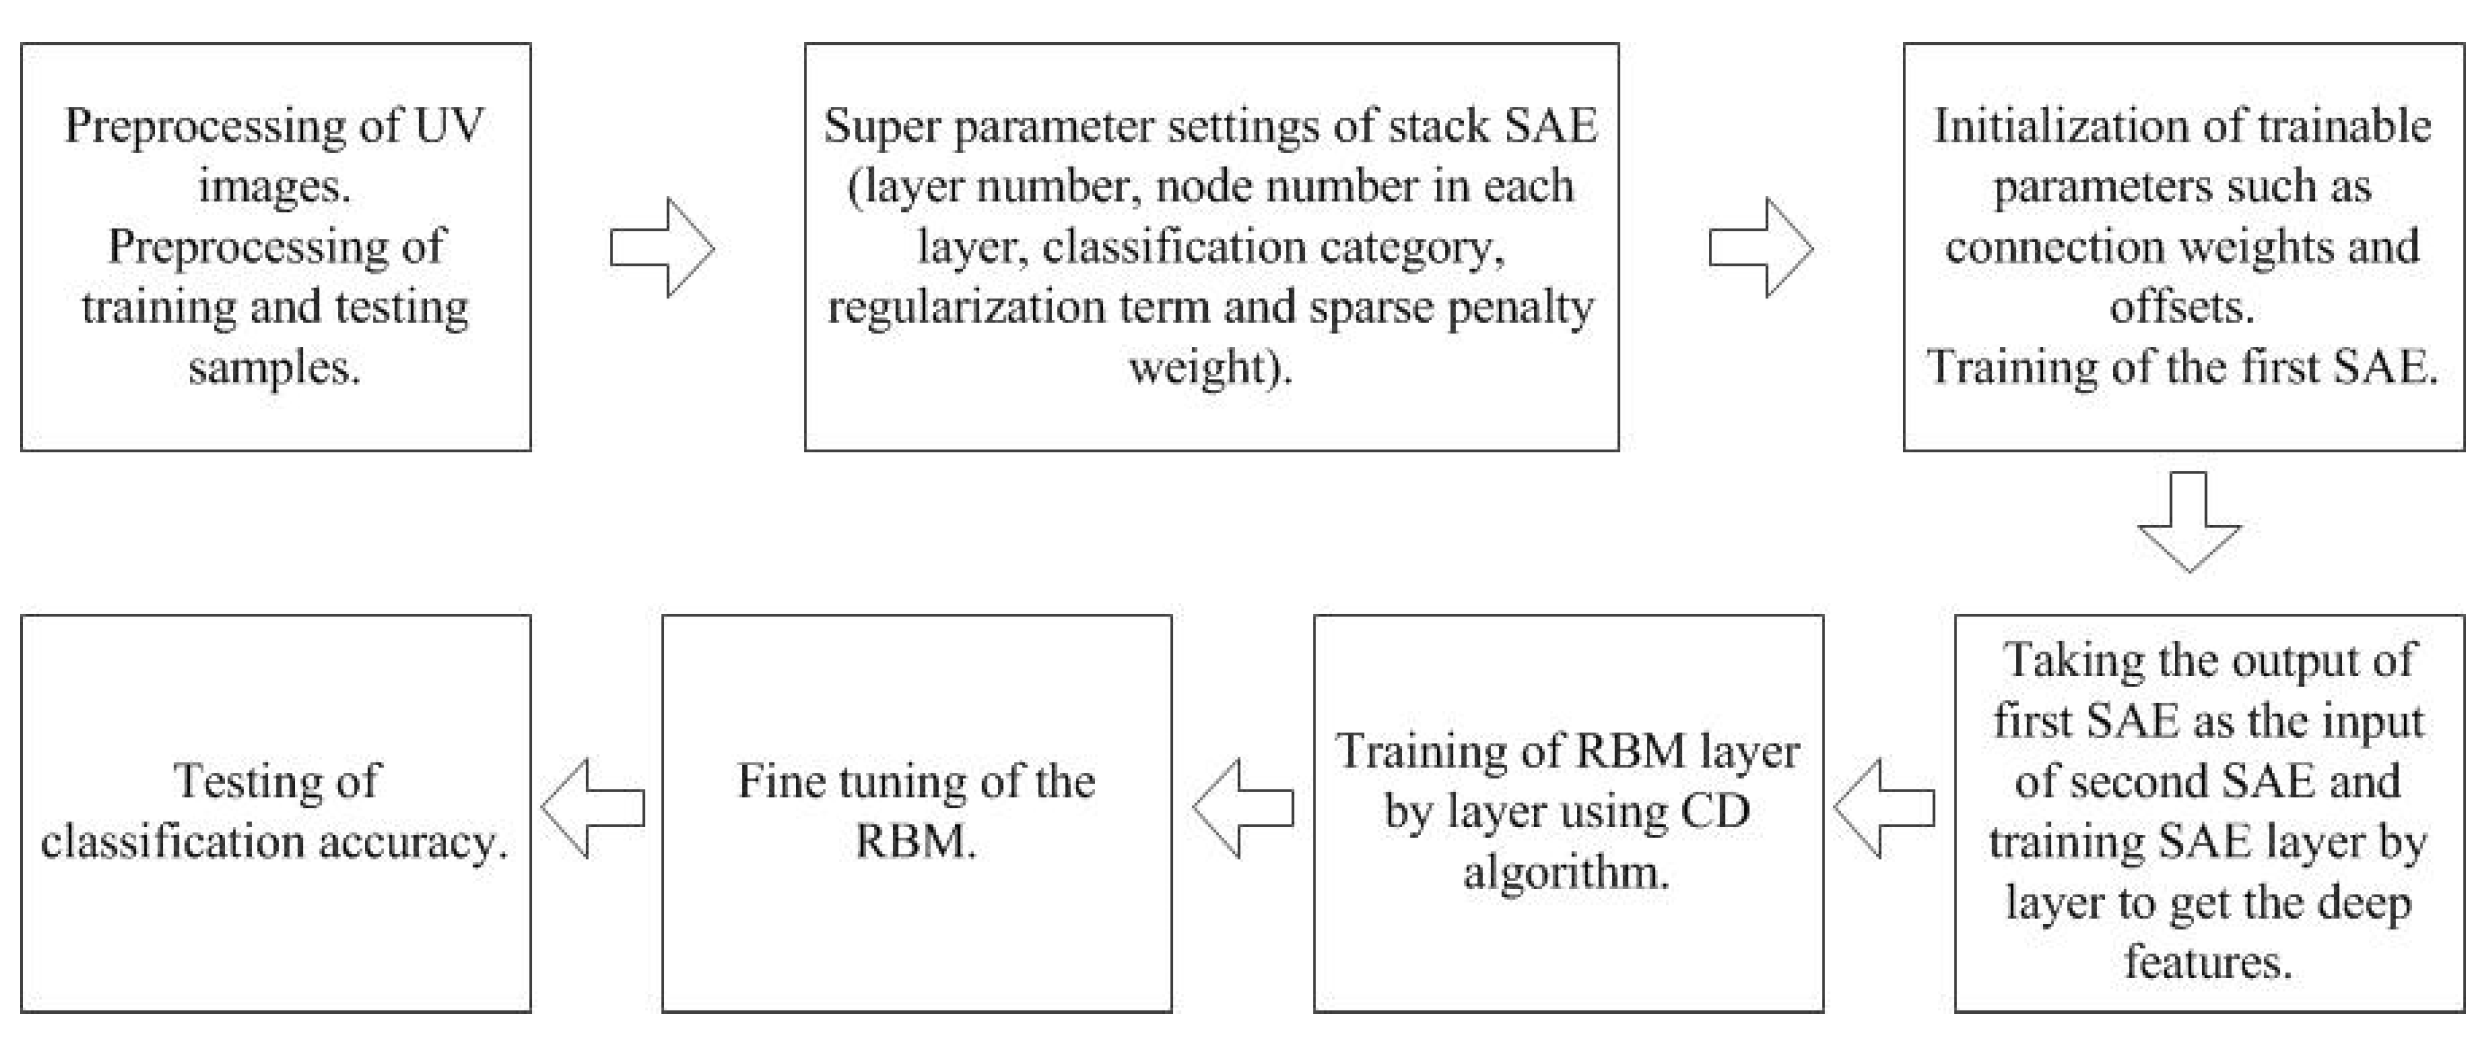
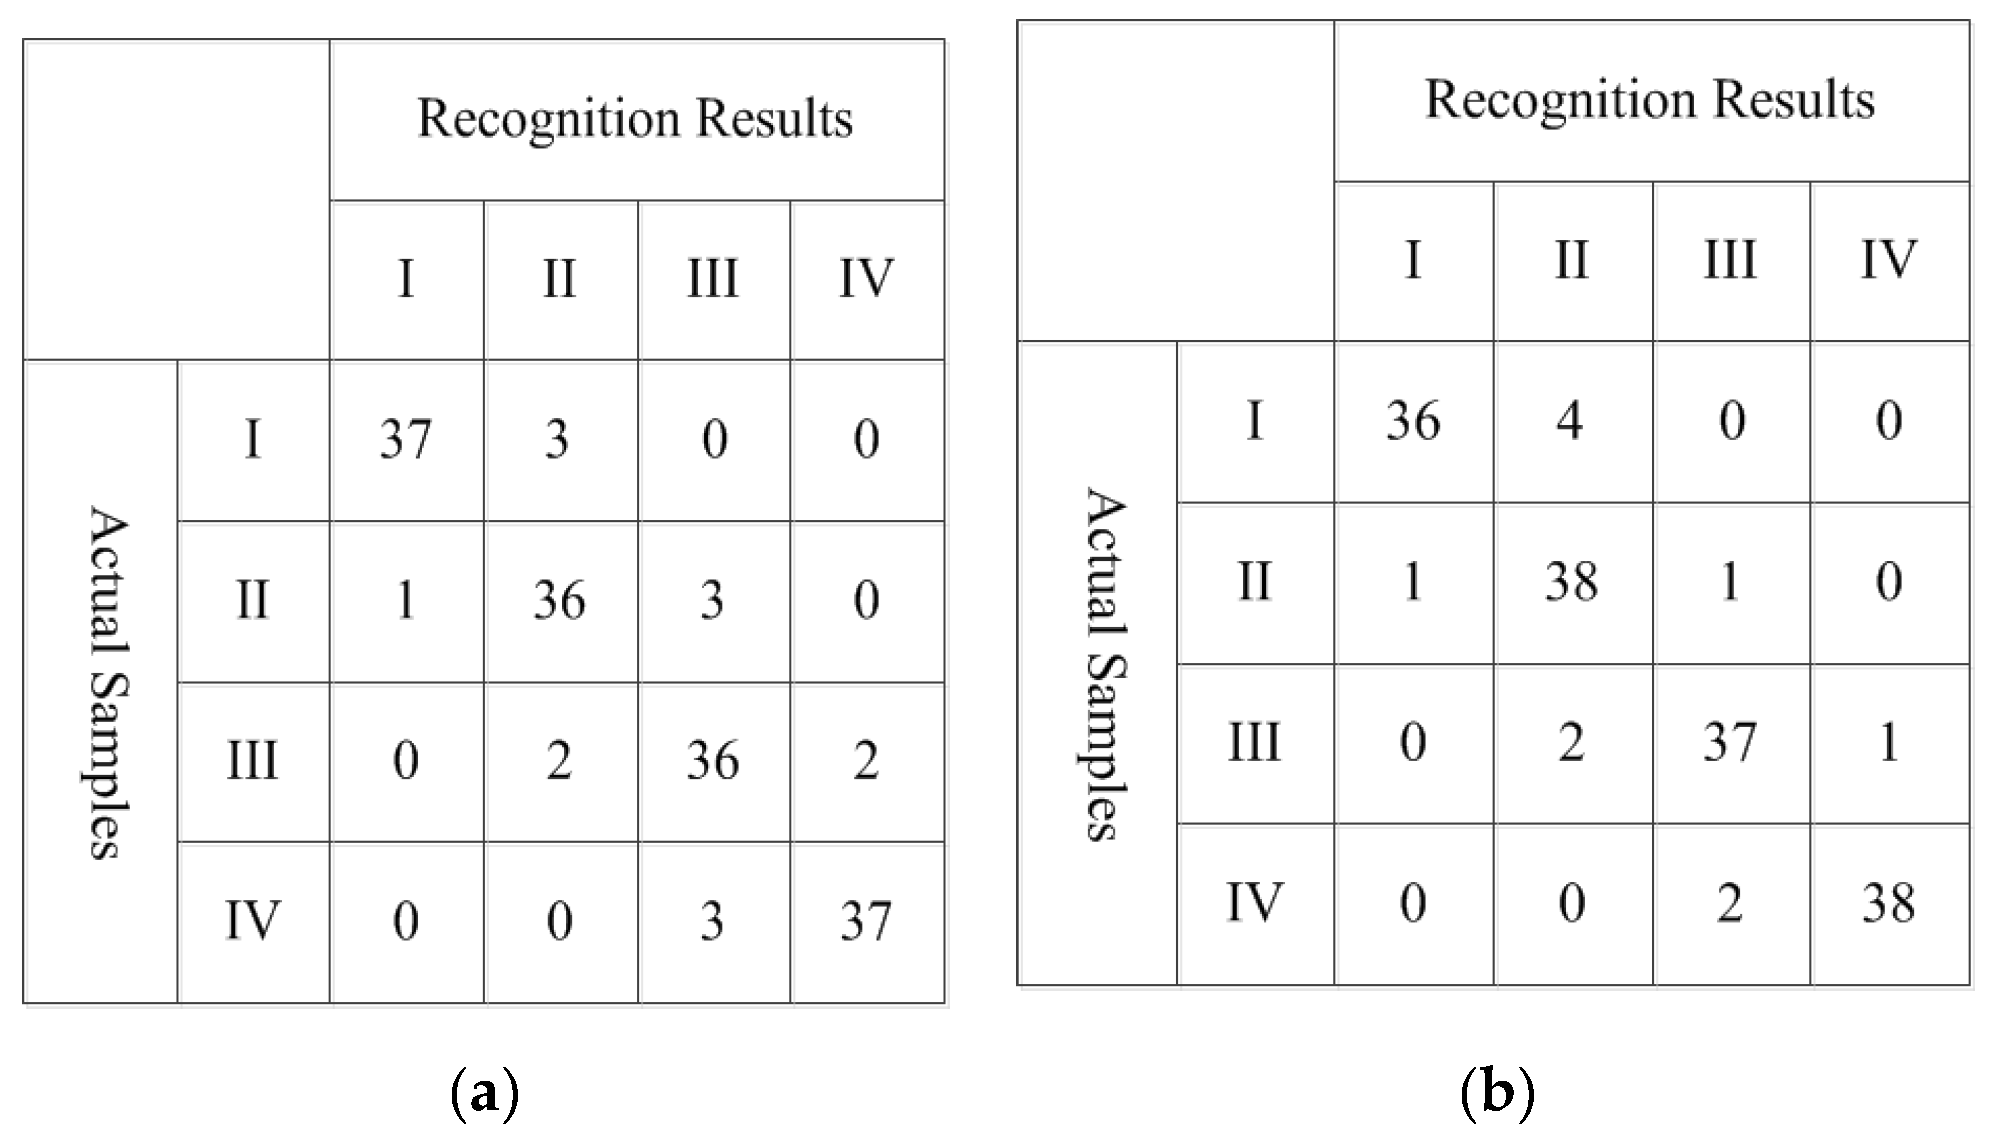
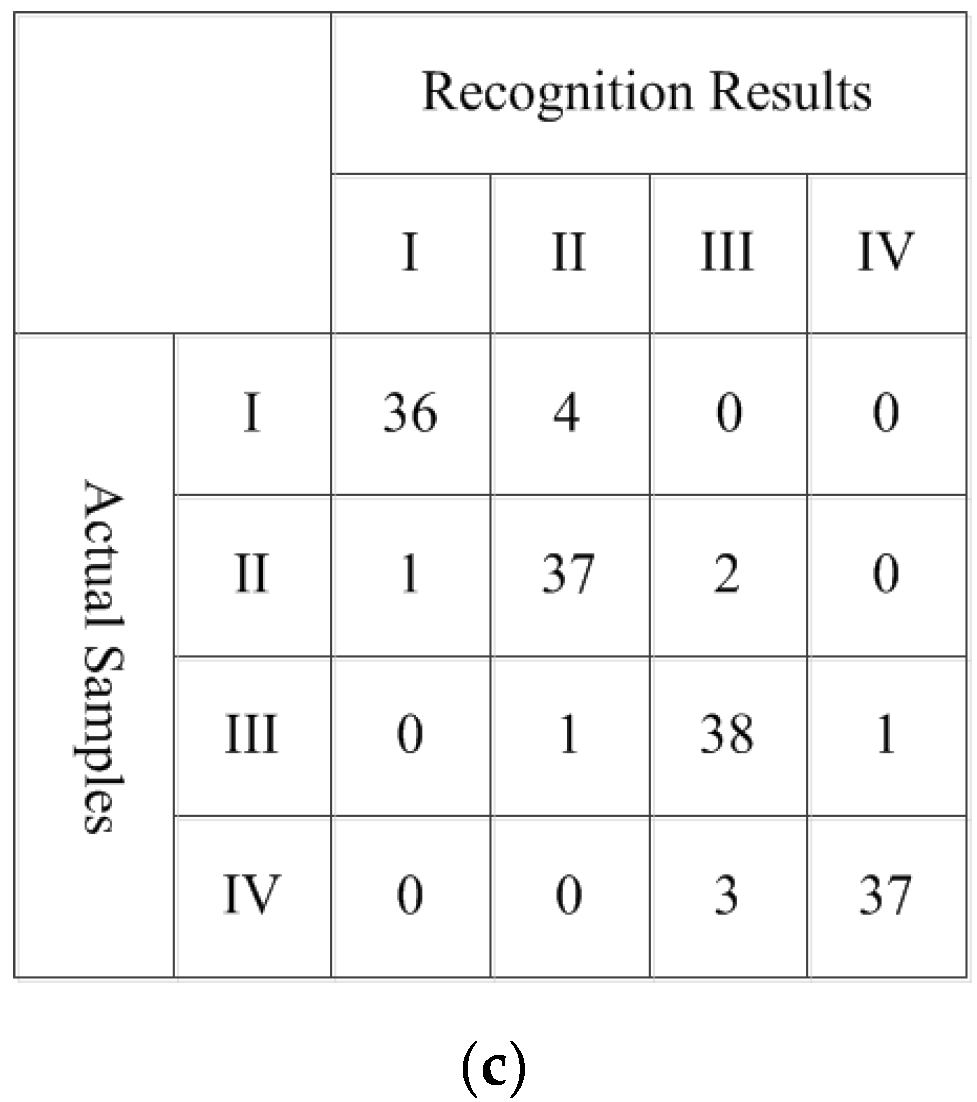
3.3. Recognition of Contamination Grades

Having comprehensively considered the efficacy of feature extraction and the complexity of the operation, we chose to use a stacked sparse autoencoder with two layers. The sparse features that were extracted with the SAE were categorized using a DBN with three layers of RBM, and the sparse features were finally classified using a soft-max multiple logistic regression model as a classifier. The feature extraction and the classification method proposed in this paper consisted of the following five steps.
(1) Data preprocessing: The ultraviolet image sequences that were captured at relative humidities of 80%, 85%, and 90% were partitioned in groups of 100 frames (four seconds long) to calculate the light spot area of each image. Each set of images served as a sample. At 80%, 85%, and 90% relative humidity, the number of training samples was 320, of which the four contamination grades I, II, III, and IV each had 80 samples. The number of test samples was 160, of which the four contamination grades of I, II, III, and IV each had 40 samples.
(2) Data normalization: The area of the light spot in each ultraviolet image was normalized to an interval of [0,1]. The normalization formula was as follows:
x i ¯ = x i x m i n x m a x x m i n
where x i is the area of the light spot in each image, i is the serial number of the image, x m i n is the minimum value of the spot area, and x m a x is the maximum value of the spot area.
(3) SAE initialization: The stack type SAE was initialized. The connecting weight and the bias coefficient of each layer of the stack SAE were initialized randomly, and the learning rate and the sparse parameters were set.
(4) Feature extraction: The two-layer SAE was trained to minimize reconstruction errors and to use the output of the last hidden layer as the extracted sparse feature.
(5) Deep belief network identification: At relative humidities of 80%, 85%, and 90%, the sparse features that were obtained with the SAE were used to train the DBN that consisted of three layers of RBN to obtain the insulator contamination grade recognition model for different humidity conditions. The SAE–DBN method proposed in this paper was verified with the test samples.
For the SAE, the number of nodes in the input layer and the dimension of the input sample were consistently 100. The number of nodes in both hidden layers was 50, the number of nodes in the output layer was 100, and the average active node parameter in the hidden layer was 0.05. The weight of the regularization term was set to 0.001, and the weight of the sparse penalty term was set to 0.02. For the DBN, the number of nodes in the input layer and the feature dimension of the input were consistently 100. The amounts of the nodes for the three hidden layers were 80, 60, and 40, and the number of nodes in the output layer corresponding to the four contamination grades was 4. The learning rate was 0.1, and the weight decay rate was 0.0001. In the training of the network, the output [0, 0, 0, 1] of the DBN represented a level I contamination, the output [0, 0, 1, 0] represented a level II contamination, the output [0, 1, 0, 0] represented a level III contamination, and the output [1, 0, 0, 0] represented a level IV contamination. Figure 9 shows a flowchart of the SAE–DBN identification method proposed in this paper.
In order to compare the effectiveness of the proposed algorithm, AE–DBN is also used to recognize the above samples. Except that the sparse method is not used in AE, the other parameters and steps are the same as SAE–DBN.
The contamination grade recognition results of SAE–DBN and AE–DBN are shown separately in Table 3 and Table 4. For SAE–DBN, the proposed method in this paper, the accuracies of the contamination grade recognition were 91.25%, 93.125%, and 92.5% at 80%, 85%, and 90% relative humidity. For AE–DBN, the accuracies of the contamination grade recognition were 80.625%, 82.5%, and 83.125% at 80%, 85%, and 90% relative humidity. Compared with the features obtained by AE, the sparse features extracted by SAE can better distinguish insulators with different contamination grades. Therefore, the SAE–DBN algorithm improved the accuracy of ultraviolet image recognition of insulator contamination grade significantly. The calculation formula for the accuracy rate was as follows:
P i = N i N s u m × 100 %
In the formula, N i is the number of correctly identified samples, N s u m is the total number of samples, and i = 1 ,   2 ,   3 represent 80%, 85%, and 90% relative humidity, respectively. Recognition errors occurred in samples that fell near the classification standard of adjacent contamination grades. For example, at 80% relative humidity, two grade III samples were misidentified as grade II and grade IV, and the corresponding samples had ESDDs of 0.12 and 0.24 mg/cm2, respectively. They fell in the vicinity of the classification standards that separated grade III contamination from grade II and grade IV contamination. The distribution of recognition results is shown in confusion matrixes in Figure 10.
In future research, the recognition accuracy can be improved by increasing the number of samples in the vicinity of the classification standard of adjacent contamination grades in the training samples. To improve the practicality of the proposed method, experiments and tests can be conducted for more relative humidities (such as at 82% and 88% relative humidity).

4. Conclusions

In order to provide accurate guidance for insulator contamination flashover prevention based on the contamination state, we proposed an ultraviolet image recognition method for the contamination grade based on SAE and DBN. A sparse autoencoder was constructed by adding a sparse constraint to the encoding process of the autoencoder. A double-layer stacked SAE was used to extract the sparse features from the spot area sequence of the ultraviolet image of the insulator discharge. These sparse features were used to train the DBN that was composed of three layers of RBM to achieve contamination grade recognition. High-voltage experiments were carried out on contaminated insulators at 80%, 85%, and 90% relative humidities, and the ultraviolet discharge images of insulators with different contamination grades were recorded. The experimental data were used to verify the method proposed in this paper. The results showed that, compared with AE, the sparse features obtained by SAE had better capability to describe the differences of UV images of insulators with four contamination grades. In addition, the use of the DBN to identify the sparse features extracted by the SAE could achieve accurate classification of insulator contamination grades at three different relative humidity levels. The research conducted in this study provided an accurate and reliable method for the noncontact detection of insulator contamination grade.

Author Contributions

Conceptualization, D.Z.; Formal analysis, D.Z.; Funding acquisition, D.Z.; Investigation, D.Z.; Methodology, D.Z.; Project administration, D.Z.; Validation, S.C.; Writing—original draft, D.Z.; Writing—review & editing, D.Z. All authors have read and agreed to the published version of the manuscript.

Funding

This research was funded by National Natural Science Foundation of China, grant number 61803219.

Conflicts of Interest

The authors declare no conflict of interest.

References

  1. He, J.; Gorur, R.S. Flashover of insulators in a wet environment. IEEE Trans. Dielectr. Electr. Insul. 2017, 24, 1038–1044. [Google Scholar] [CrossRef]
  2. Zhang, D.; Meng, F.C. Research on the Interrelation between temperature distribution and dry band on wet contaminated insulators. Energies 2019, 12, 4289. [Google Scholar] [CrossRef] [Green Version]
  3. Qiao, X.H.; Zhang, Z.J.; Jiang, X.L.; Tian, L. Influence of DC electric fields on pollution of HVDC composition insulator short samples with different environmental parameters. Energies 2019, 12, 2304. [Google Scholar] [CrossRef] [Green Version]
  4. Deb, S.; Choudhury, N.R.; Ghosh, R.; Chatterjee, B.; Dalai, S. Short time modified Hilbert transform-aided sparse representation for sensing of overhead line insulator contamination. IEEE Sens. J. 2018, 18, 8125–8132. [Google Scholar] [CrossRef]
  5. Li, L.; Li, Y.; Lu, M.; Liu, Z.; Wang, C.; Lv, Z. Quantification and comparison of insulator pollution characteristics based on normality of relative contamination values. IEEE Trans. Dielectr. Electr. Insul. 2016, 23, 965–973. [Google Scholar] [CrossRef]
  6. Cao, B.; Wang, L.; Yin, F. A low-cost evaluation and correction method for the soluble salt components of the insulator contamination layer. IEEE Sens. J. 2019, 19, 5266–5273. [Google Scholar] [CrossRef]
  7. Jiang, Y.; McMeekin, S.G.; Reid, A.J.; Nekahi, A.; Judd, M.D.; Wilson, A. Monitoring contamination level on insulator materials under dry condition with a microwave reflectometer. IEEE Trans. Dielectr. Electr. Insul. 2016, 23, 1427–1434. [Google Scholar] [CrossRef]
  8. Banik, A.; Dalai, S.; Chatterjee, B. Autocorrelation aided rough set based contamination level prediction of high voltage insulator at different environmental condition. IEEE Trans. Dielectr. Electr. Insul. 2016, 23, 2883–2891. [Google Scholar] [CrossRef]
  9. Lv, Y.; Zhao, W.; Song, Q. Simulation on deposition characteristics of contamination particles in fog-haze environment. IEEE Access 2020, 8, 26119–26128. [Google Scholar] [CrossRef]
  10. Wang, J.; Wang, K.; Zhou, M.; Zhao, L.; Yao, S.; Fang, C. The natural contamination of XP-70 insulators in Shenzhen, China. IEEE Trans. Dielectr. Electr. Insul. 2016, 23, 349–358. [Google Scholar] [CrossRef]
  11. Cao, B.; Wang, L.; Li, X.; Guan, Z. Influence of partial electric arc on the contamination degree monitoring system in view of leakage current. IEEE Trans. Dielectr. Electr. Insul. 2018, 25, 1545–1552. [Google Scholar] [CrossRef]
  12. Zhang, Z.J.; Yang, S.H.; Jiang, X.L.; Qiao, X.H.; Xiang, Y.Z.; Zhang, D.D. DC flashover dynamic model of post insulator under non-uniform pollution between windward and leeward sides. Energies 2019, 12, 2345. [Google Scholar] [CrossRef] [Green Version]
  13. Cao, B.; Wang, L.; Yin, F. Measurement of saturated water absorption of the contamination layer deposited on insulator surface. IEEE Sens. J. 2019, 19, 10804–10811. [Google Scholar] [CrossRef]
  14. Yang, D.; Yin, F.; Mei, H.; Wang, L.; Guo, C. In-situ monitoring of electrolytic corrosion on the caps of HVDC insulators. IEEE Sens. J. 2018, 18, 8569–8577. [Google Scholar]
  15. Albano, M.; Haddad, A.M.; Bungay, N. Is the dry-band characteristic a function of pollution and insulator design? Energies 2019, 12, 3607. [Google Scholar] [CrossRef] [Green Version]
  16. Salem, A.A.; Abd-Rahman, R.; Al-Gailani, S.A.; Kamarudin, M.S.; Ahmad, H.; Salam, Z. The leakage current components as a diagnostic tool to estimate contamination level on high voltage insulators. IEEE Access 2020, 8, 92514–92528. [Google Scholar] [CrossRef]
  17. Boulanouar, H.; Bayadi, A.; Haddad, A. Analysis of textured silicone rubber performance under contaminated conditions. IET Sci. Meas. Technol. 2019, 13, 461–468. [Google Scholar] [CrossRef]
  18. Li, Y.B.; Zou, L.; Jiang, L.; Zhou, X.Y. Fault diagnosis of rotating machinery based on combination of deep belief network and one-dimensional convolutional neural network. IEEE Access 2019, 7, 165710–165723. [Google Scholar] [CrossRef]
  19. Ian, G.; Courville, A.; Bengion, Y. Large scale featurelearning with spike and slab sparse coding. In Proceedings of the 29th International Conference of Machine Learning, Edinburgh, UK, 26 June–1 July 2012; pp. 1439–1446. [Google Scholar]
  20. Hinton, G.E. Training products of experts by minimizing contrastive divergence. Neural Comput. 2002, 14, 1771–1800. [Google Scholar] [CrossRef] [PubMed]
Figure 1. The structure of a deep belief network (DBN).
Energies 13 05221 g001
Figure 2. Schematic diagram of high voltage experiment.
Energies 13 05221 g002
Figure 3. Structure of a cap and pin insulator.
Energies 13 05221 g003
Figure 4. UV discharge image of a contaminated insulator: (a) original UV image and (b) image of the center area.
Energies 13 05221 g004
Figure 5. UV images of contaminated insulators in 85% relative humidity: (a) contaminated insulator of grade I, (b) contaminated insulator of grade II, (c) contaminated insulator of grade III, and (d) contaminated insulator of grade IV.
Energies 13 05221 g005
Figure 6. Extraction of the discharge spot: (a) grayscale image and (b) binary image.
Energies 13 05221 g006
Figure 7. Binary images of grade I to IV contaminated insulators: (a) grade I, (b) grade II, (c) grade III, and (d) grade IV.
Energies 13 05221 g007
Figure 8. Curves of the spot pixels of UV images: (a) in 80% relative humidity, (b) in 85% relative humidity, and (c) in 90% relative humidity.
Energies 13 05221 g008
Figure 9. Flowchart of the algorithm.
Energies 13 05221 g009
Figure 10. Confusion matrix of the recognition results: (a) in 80% relative humidity, (b) in 85% relative humidity, and (c) in 90% relative humidity.
Energies 13 05221 g010aEnergies 13 05221 g010b
Table 1. Parameters of the XP-70 insulator.
Rated Voltage (kV)Top Surface (cm2)Bottom Surface (cm2)Creepage Distance (mm)Structural Height (mm)Diameter (mm)
10674917295146255
Table 2. Selection of ESDD for artificially contaminated insulators.
Contamination GradeIIIIIIIV
ESDD Range
(mg/cm2)
0.03–0.060.06–0.10.1–0.250.25–0.35
Table 3. Recognition results of SAE–DBN.
Relative HumidityRecognition Accuracy (%)
Grade IGrade IIGrade IIIGrade IVTotal Accuracy
80%92.5909092.591.25
85%909592.59593.125
90%9092.59592.592.5
Table 4. Recognition results of AE–DBN.
Relative HumidityRecognition Accuracy (%)
Grade IGrade IIGrade IIIGrade IVTotal Accuracy
80%80808082.580.625
85%8082.58582.582.5
90%82.58582.582.583.125

