1. Introduction
Belt conveyor (BC) systems, due to their high efficiency, durability, and reliability, are widely used for bulk material transportation in mines [
1]. Moreover, when compared to trucks, conveyors are considered more environmentally friendly with respect to overall energy usage, as well as to noise and dust emissions. However, as far as energy issues are concerned, BCs are still significant consumers of electric energy in mines. According to [
2], the energy cost of a BC system constitutes even up to 40% of the operational cost. Taking into account sustainable development rules and energy policies, the mining industry has been forced to improve the energy management systems and the technologies of energy-intensive operations. Amongst the processes with high electricity demand, material handling is identified as one of the main causes of energy inefficiency [
3], and it is estimated to constitute at least 20% of the total energy consumption at a mine site [
1].
Generally, energy efficiency of belt conveyors is greatly improved with regards to equipment and operational levels [
4]. Starting at the equipment level, theoretical and experimental research into efficient BC components includes idlers, conveyor belts, and drive systems [
5,
6,
7]. The main focus is put on the rotational resistance of idlers, and also their arrangement and design [
8]; the rolling resistances of the belt and of its rubber compounds [
9]; energy efficient motors and variable speed drives [
2].
With respect to the operational level, a widely known solution for the optimization of energy consumption of BCs is the implementation of speed control systems [
10,
11], which allow the material loading rate of a belt conveyor to be kept at a certain level, or even be improved. It is worth noting the fact that the energy models of belt conveyors are the crucial element for solving optimization problems, as they enable simulations of electric power consumption [
12,
13,
14].
In the case of belt conveyors, organizational and technical improvements are recommended for energy-effective and ecologically friendly operation. Nevertheless, energy efficiency of a belt conveyor is improved on a case-by-case basis by analyzing the actual transportation task. Since every belt conveyor system in a mine has its limitations and constraints, the authors investigated improvements in energy efficiency of the conveyor transportation system in specific conditions by proposing multiple-drive belt conveyors, or by modeling and simulating different operating conditions (belt speed, filling rate) or conveyor design parameters (e.g., idler parameters, trough angle) [
15,
16,
17].
The continuous development of transportation systems has served as the basis for analyzing possibilities to improve their energy efficiency. The article presents a multiparameter analysis of a specific medium-distance belt conveyor operated in a Polish continuous surface lignite mine and proposes various modernizations of the entire existing transportation system, in order to achieve both energy savings and environmental benefits.
2. Materials and Methods
An analysis of possible improvements in the efficiency of a conveyor belt should be based not only on the reduction of its energy consumption but, above all, on the Specific Energy Consumption (SEC) index [
14]. Its value depends on the parameters and the layout of the actual belt conveyor, as well as on its specific operational conditions. This index is defined as the amount of energy required to move 1 kg of material a distance of 1 m, and it can be determined from the equation
After transforming Equation (1), we obtain
where
Ne—electric power of the drive delivered to the conveyor, W;
Qm—actual mass capacity, ;
L—length of the conveyor route, m;
RTM—motion resistances, N;
—total mass of the transported bulk material, kg;
—drive unit efficiency.
Since the SEC index presents an amount of energy, it can be seen to be appropriate for the analysis of energy efficiency and for modernization projects of belt conveyor systems. A reduction in the energy consumption of any machine system is valuable in itself. Modern transportation systems should be both effective and energy efficient. The retrofitting of belt conveyor systems does not require configuring conveyors with maximum capacity abilities. The motion resistances of BCs determine the energy consumption of the transportation system. Motion resistance can be divided into primary resistance, secondary resistance, and lift resistance (occurring on the sloping sections of a conveyor). Secondary resistance occurs at the drive station, pulleys, feed, and discharge chute, while primary resistance appears along the whole conveyor route (on each idler set) and determines the motion resistance for conveyors longer than 80 m. Primary resistance consists of idler rotational resistance, belt rolling (indentation) resistance, belt bending resistance, flexure resistance of bulk material, and sliding resistance of the belt on idlers. With increasing mass of transported material per time unit, the components of primary resistance will also increase, due to their direct dependence on the unit load. The Specific Energy Consumption index shows that energy consumption is relatively less important for a larger mass capacity. Energy-saving solutions should be based on multiparameter simulations of a specific transport task. Modifications to those design parameters that influence the main primary resistances can reduce the resistances without reducing the required mass capacity. In the case of retrofitting belt conveyor systems, the main goal should be decreasing the SEC index by reducing motion resistances.
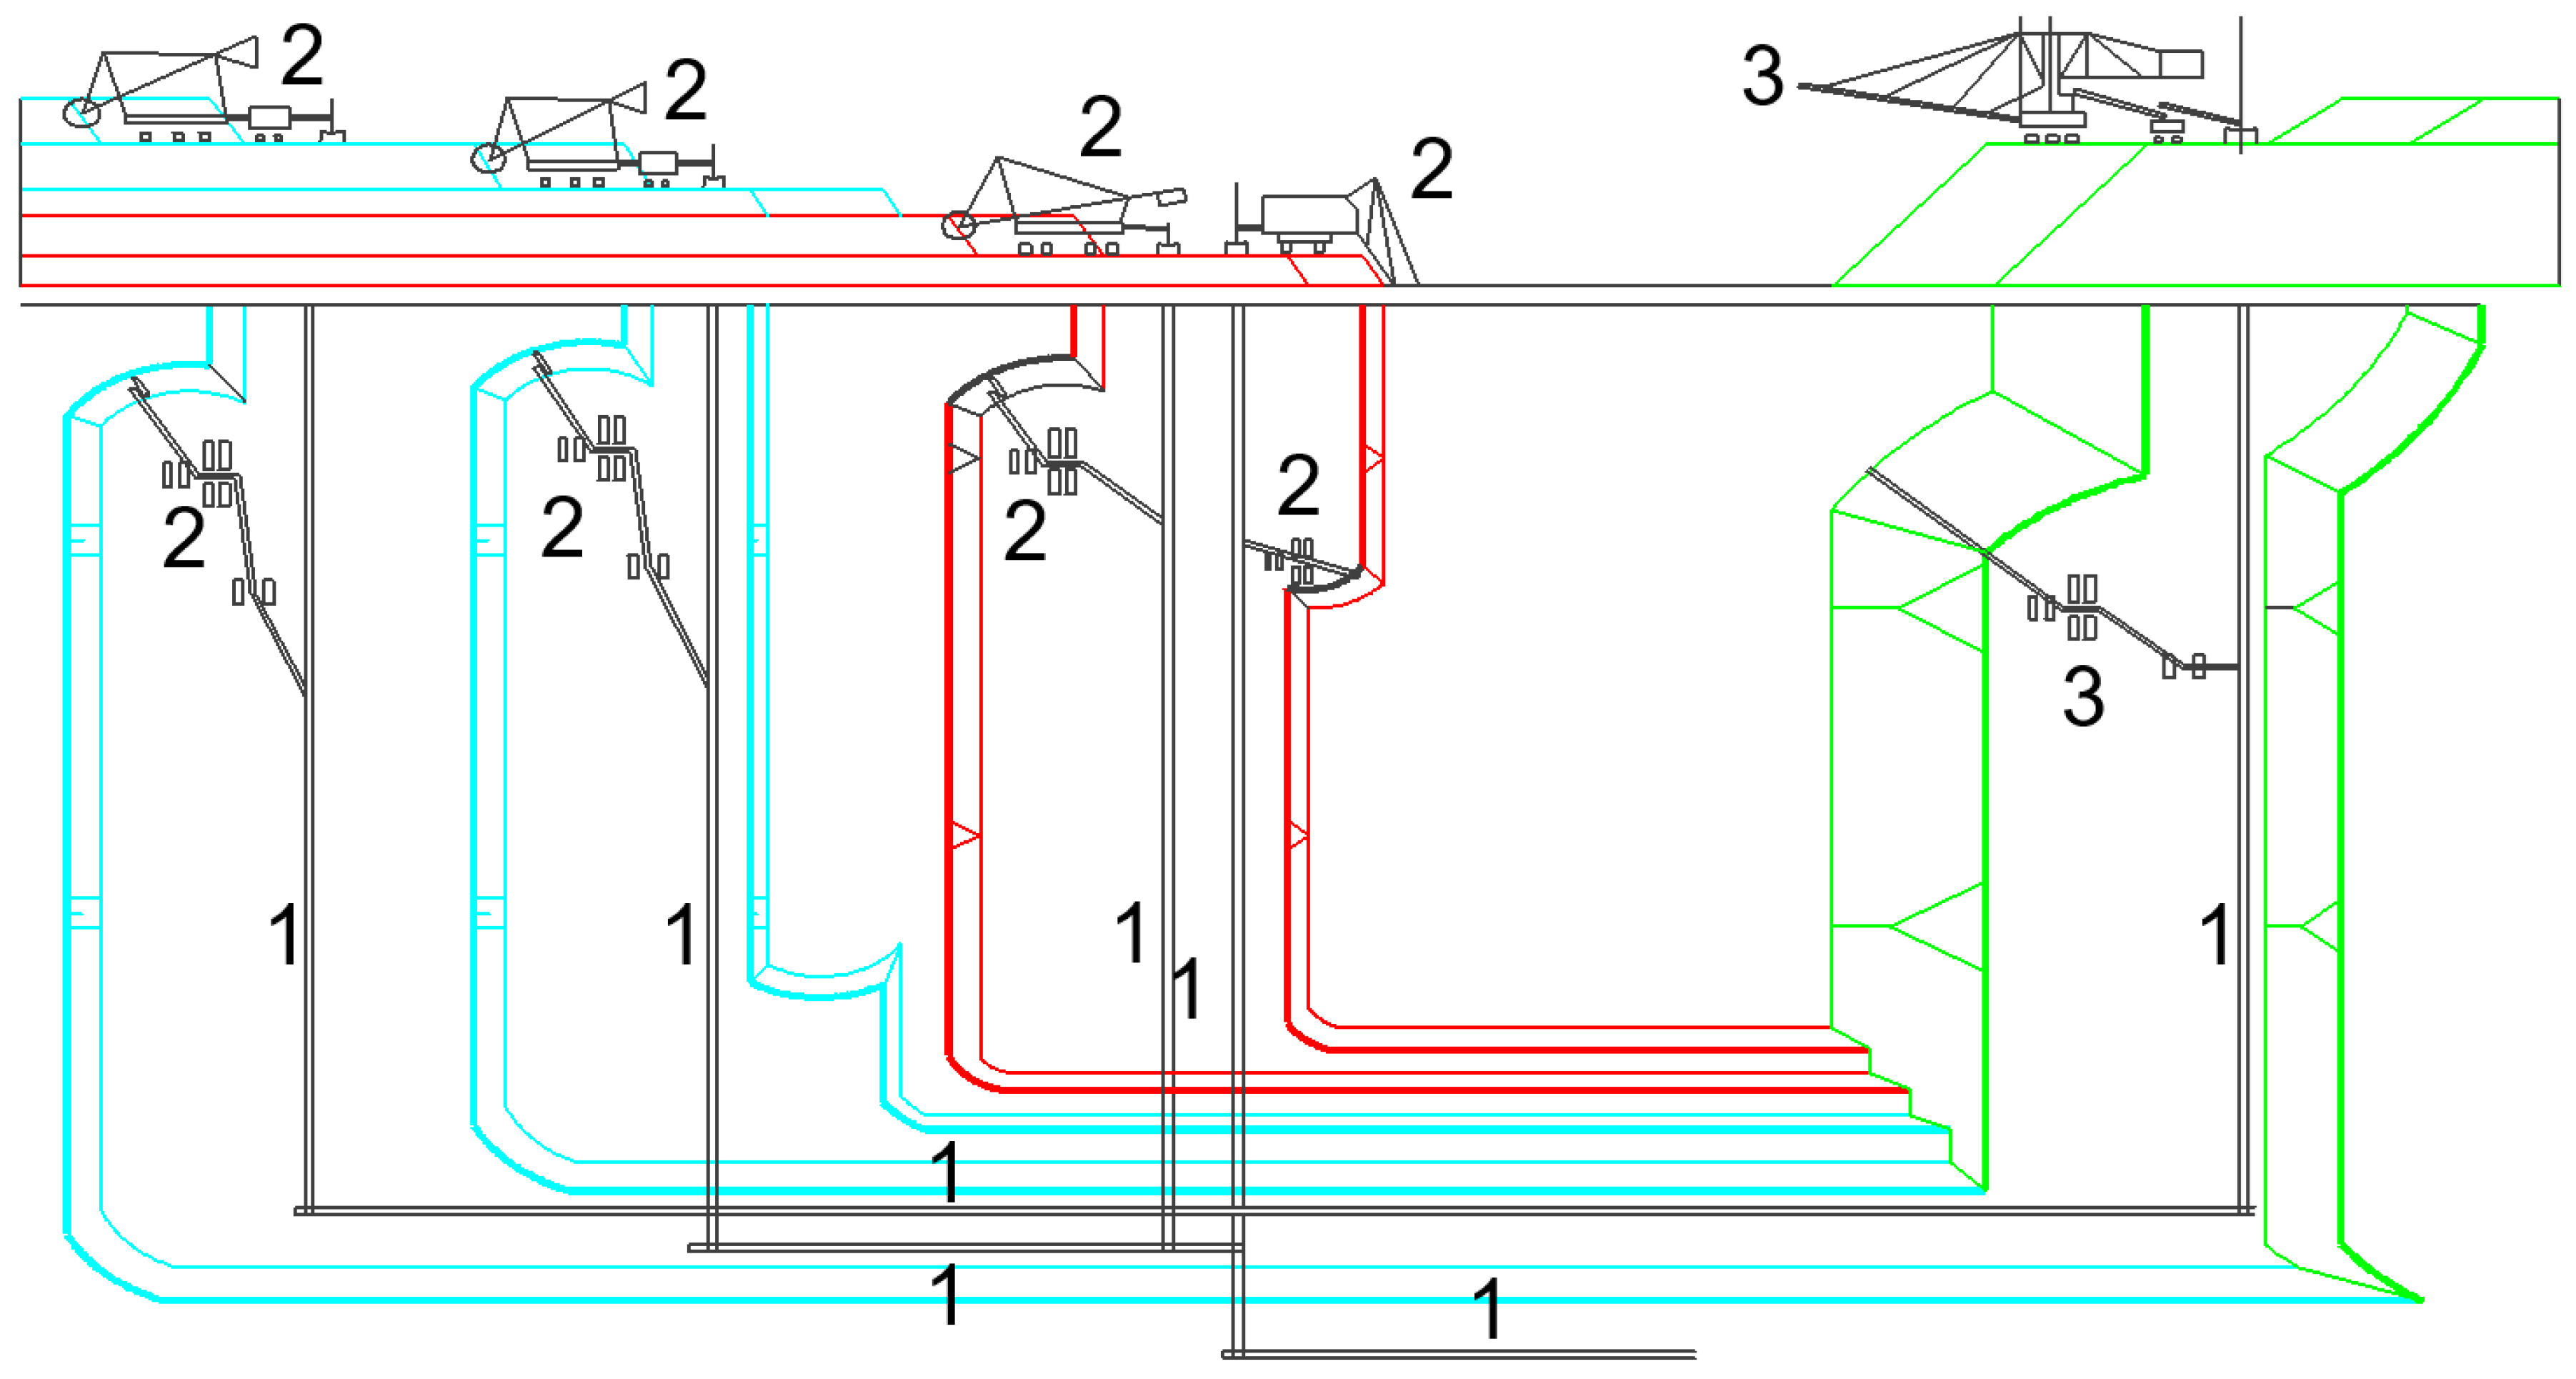
This paper presents an analysis of the energy consumption of a belt conveyor system used to transport 25.9 million metric tons of overburden annually (on average, 6500 t/h) in a Polish continuous surface lignite mine. A schematic cross-section and a plan view of the continuous surface lignite mine is presented in
Figure 1, while the general scheme of a belt conveyor is shown in
Figure 2. The main aim of this research is to investigate a method for decreasing the energy consumption of the transportation system, while also paying attention to any environmental benefits that may be achieved.
The research is divided into two main parts. Firstly, an analysis of the conveyor’s specific energy consumption value was carried out, using specialised software for designing belt conveyors. The aim of the analysis was to investigate the influence of the conveyor’s design parameters, such as belt width (m), belt speed (m/s), trough angle (°), and the material flow rate (t/h), on SEC values. SEC values were calculated for a 1000 m long conveyor with fixed parameters that reflect its real working conditions. The variable parameters used in the simulation and analyses are presented in
Table 1.
Secondly, an analysis of electric energy consumption (EEC) of both the existing and the improved conveyor transportation systems was performed with four different distributions of material flow rate that simulate actual mining conditions.
This part of the work is divided into four steps:
Step 0—real operating conditions—EEC of five belt conveyors;
Step 1—the decrease in the number of conveyors from five to three by a change in conveyors’ length—two alternative solutions (different belt width and speed), referred to as 1a and 1b;
Step 2—the decrease in time of idle operation;
Step 1 + 2—the combination of Steps 1 and 2
The analyzed transportation system consisted of five belt conveyors (A–E), while the alternative system consisted of three conveyors (F–H). Their basic parameters are presented in
Table 2. Four different distributions of material flow rate, presented in
Table 3, were referred to as variants and were estimated in accordance with the published data from lignite mines [
5,
19]. Because conveyors work under different loads, presented variants showed theoretical capacity distribution (Variant 1), which is assumed by the dispatcher who controls the actual capacity of the excavator, and the real distribution (Variants 2–4), which is based on the measurements made in mines. It was assumed that the average annual effective work time (the time when material is being transported) for the BC system was equal to 4000 h (83.33% of total working time is the effective work time), while its idle operation actually accounted for 800 h, which could be reduced to 400 h.
3. Results
This section presents the results of the theoretical investigations and a case study based on QNK—in-house software released by Entertech [
20]. The name “QNK” is built from annotations commonly used for the main belt conveyor design parameters: “Q”—actual output, “N”—required drive power, and “K”—required belt tensile strength. QNK software uses an accurate method for calculating the components of the main resistances to motion. This is done by analyzing the energy dissipation processes in a conveyor belt and in the material load stream, and by analyzing the interaction between the belt and the idlers. These processes depend on a large set of technical, physical, and operational data of the belt, the transported bulk material, and the design characteristics of the conveyor and also its specific operating conditions. Consequently, the calculation results reflect a large set of input data, and QNK software can be seen as a suitable tool for analyzing the impact of selected parameters on the power requirements of the belt conveyor drive [
18,
21].
Calculations in the QNK program were made using the unit resistance method. Unlike the basic method (ISO 5048), the calculations were made for all the groups of resistances according to the primary resistance factor f (also known as the fictive friction factor) and the concentrated (secondary) resistance factor C. The unit resistance method required each component of resistance to be determined individually. The algorithm in the QNK program, developed upon [
18], was improved, mainly in the area of rolling resistance, which is the main component of primary resistance [
22]. The new method takes a different approach to the damping factor. The algorithm was validated by conducting measurements in real conditions [
23]. As a result, advanced and more accurate estimations of the resistance were possible, enabling more accurate predictions of energy consumption.
3.1. Analysis of the Specific Energy Consumption for Different Conveyor Design Parameters
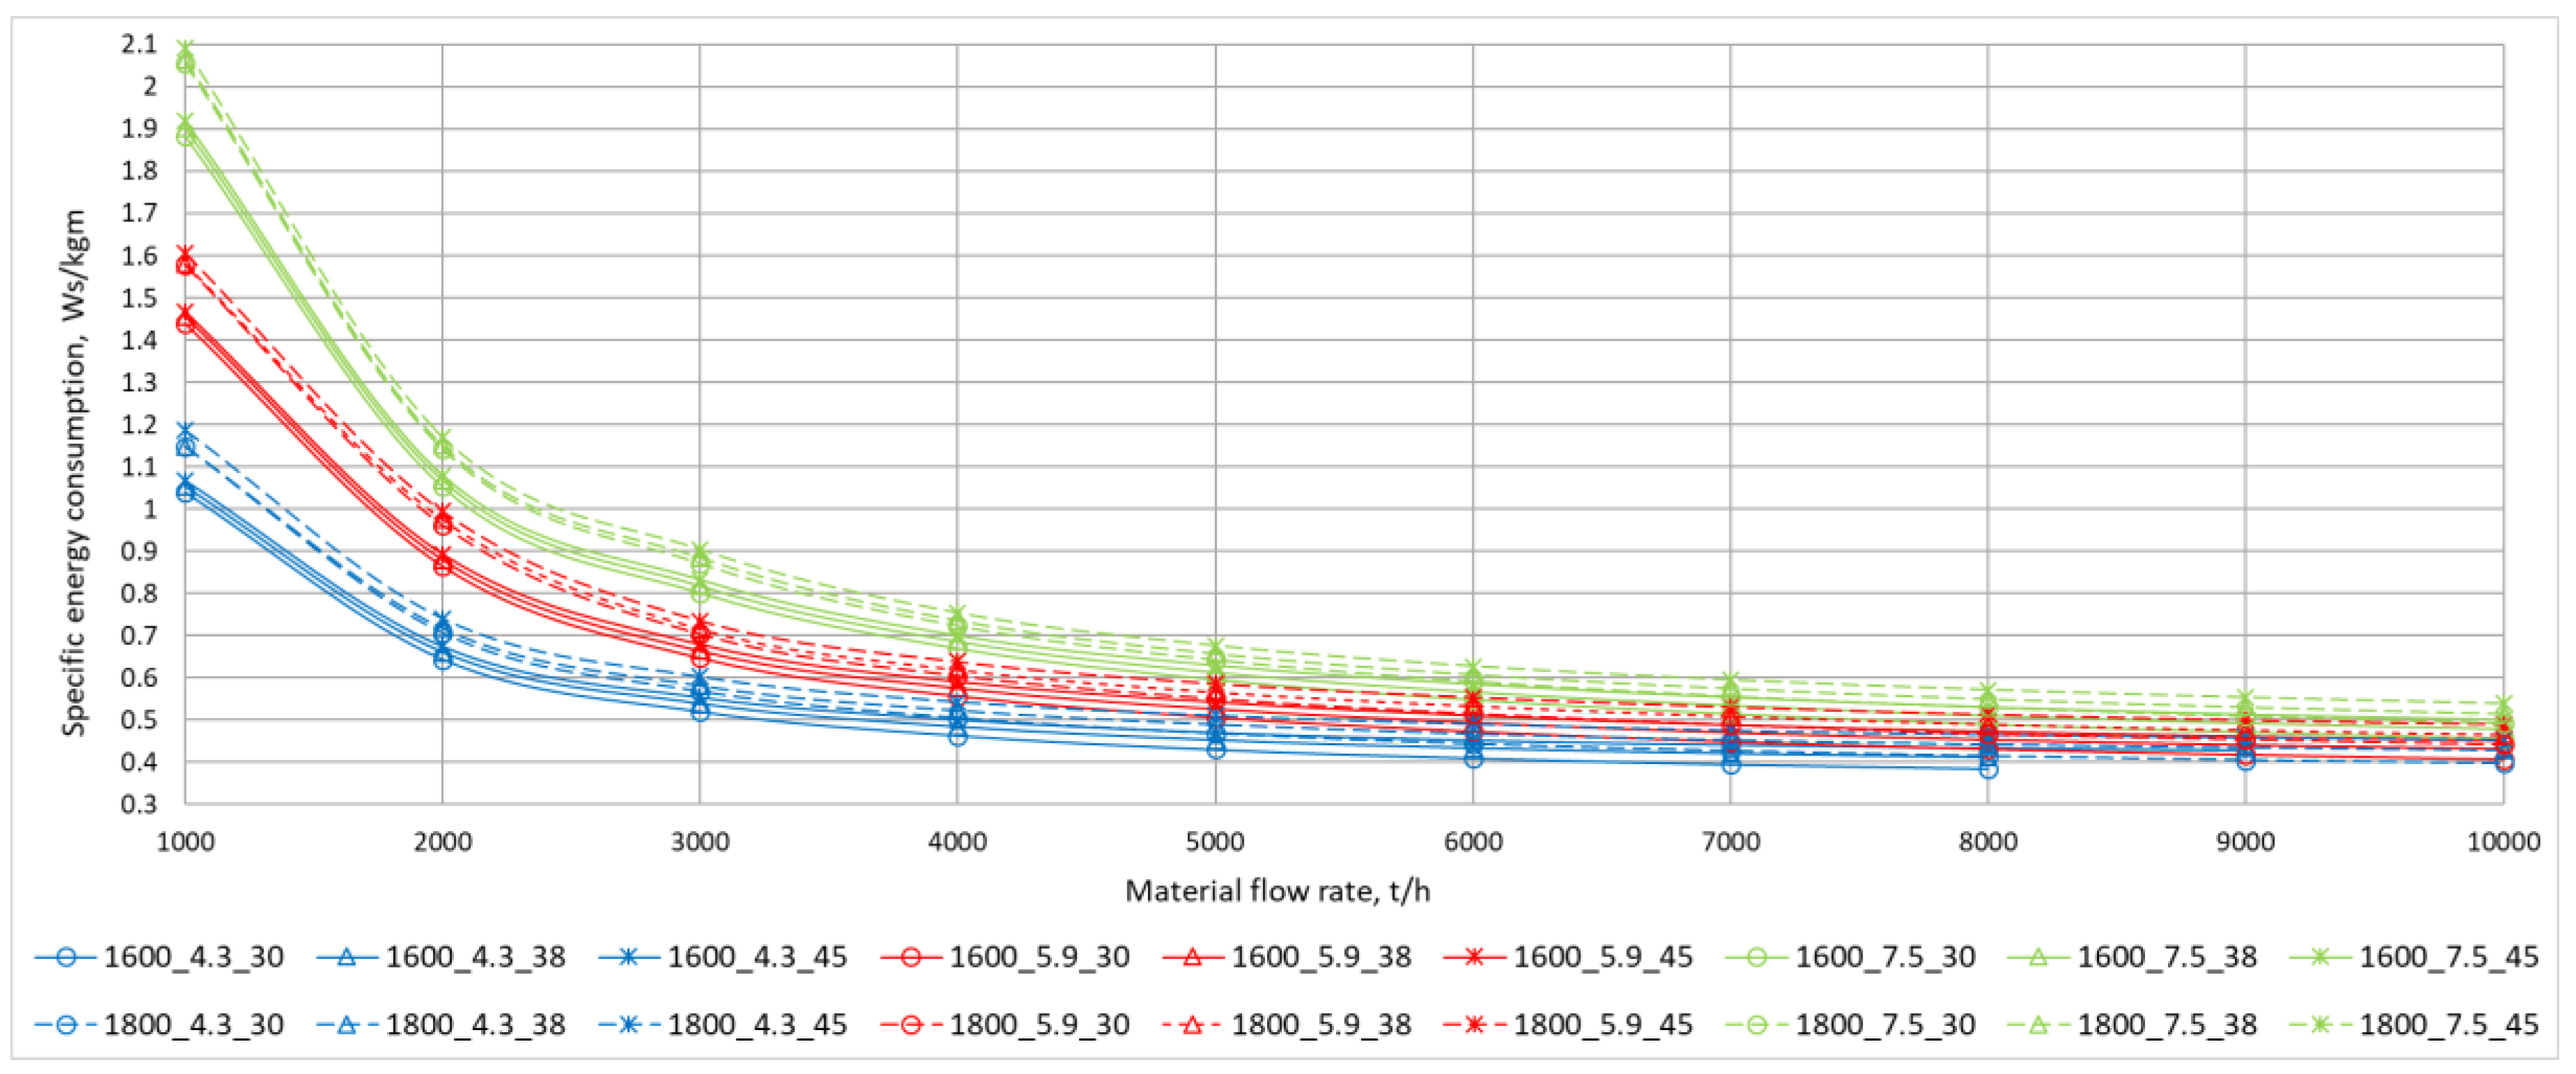
Results of the analyzed cases are presented in
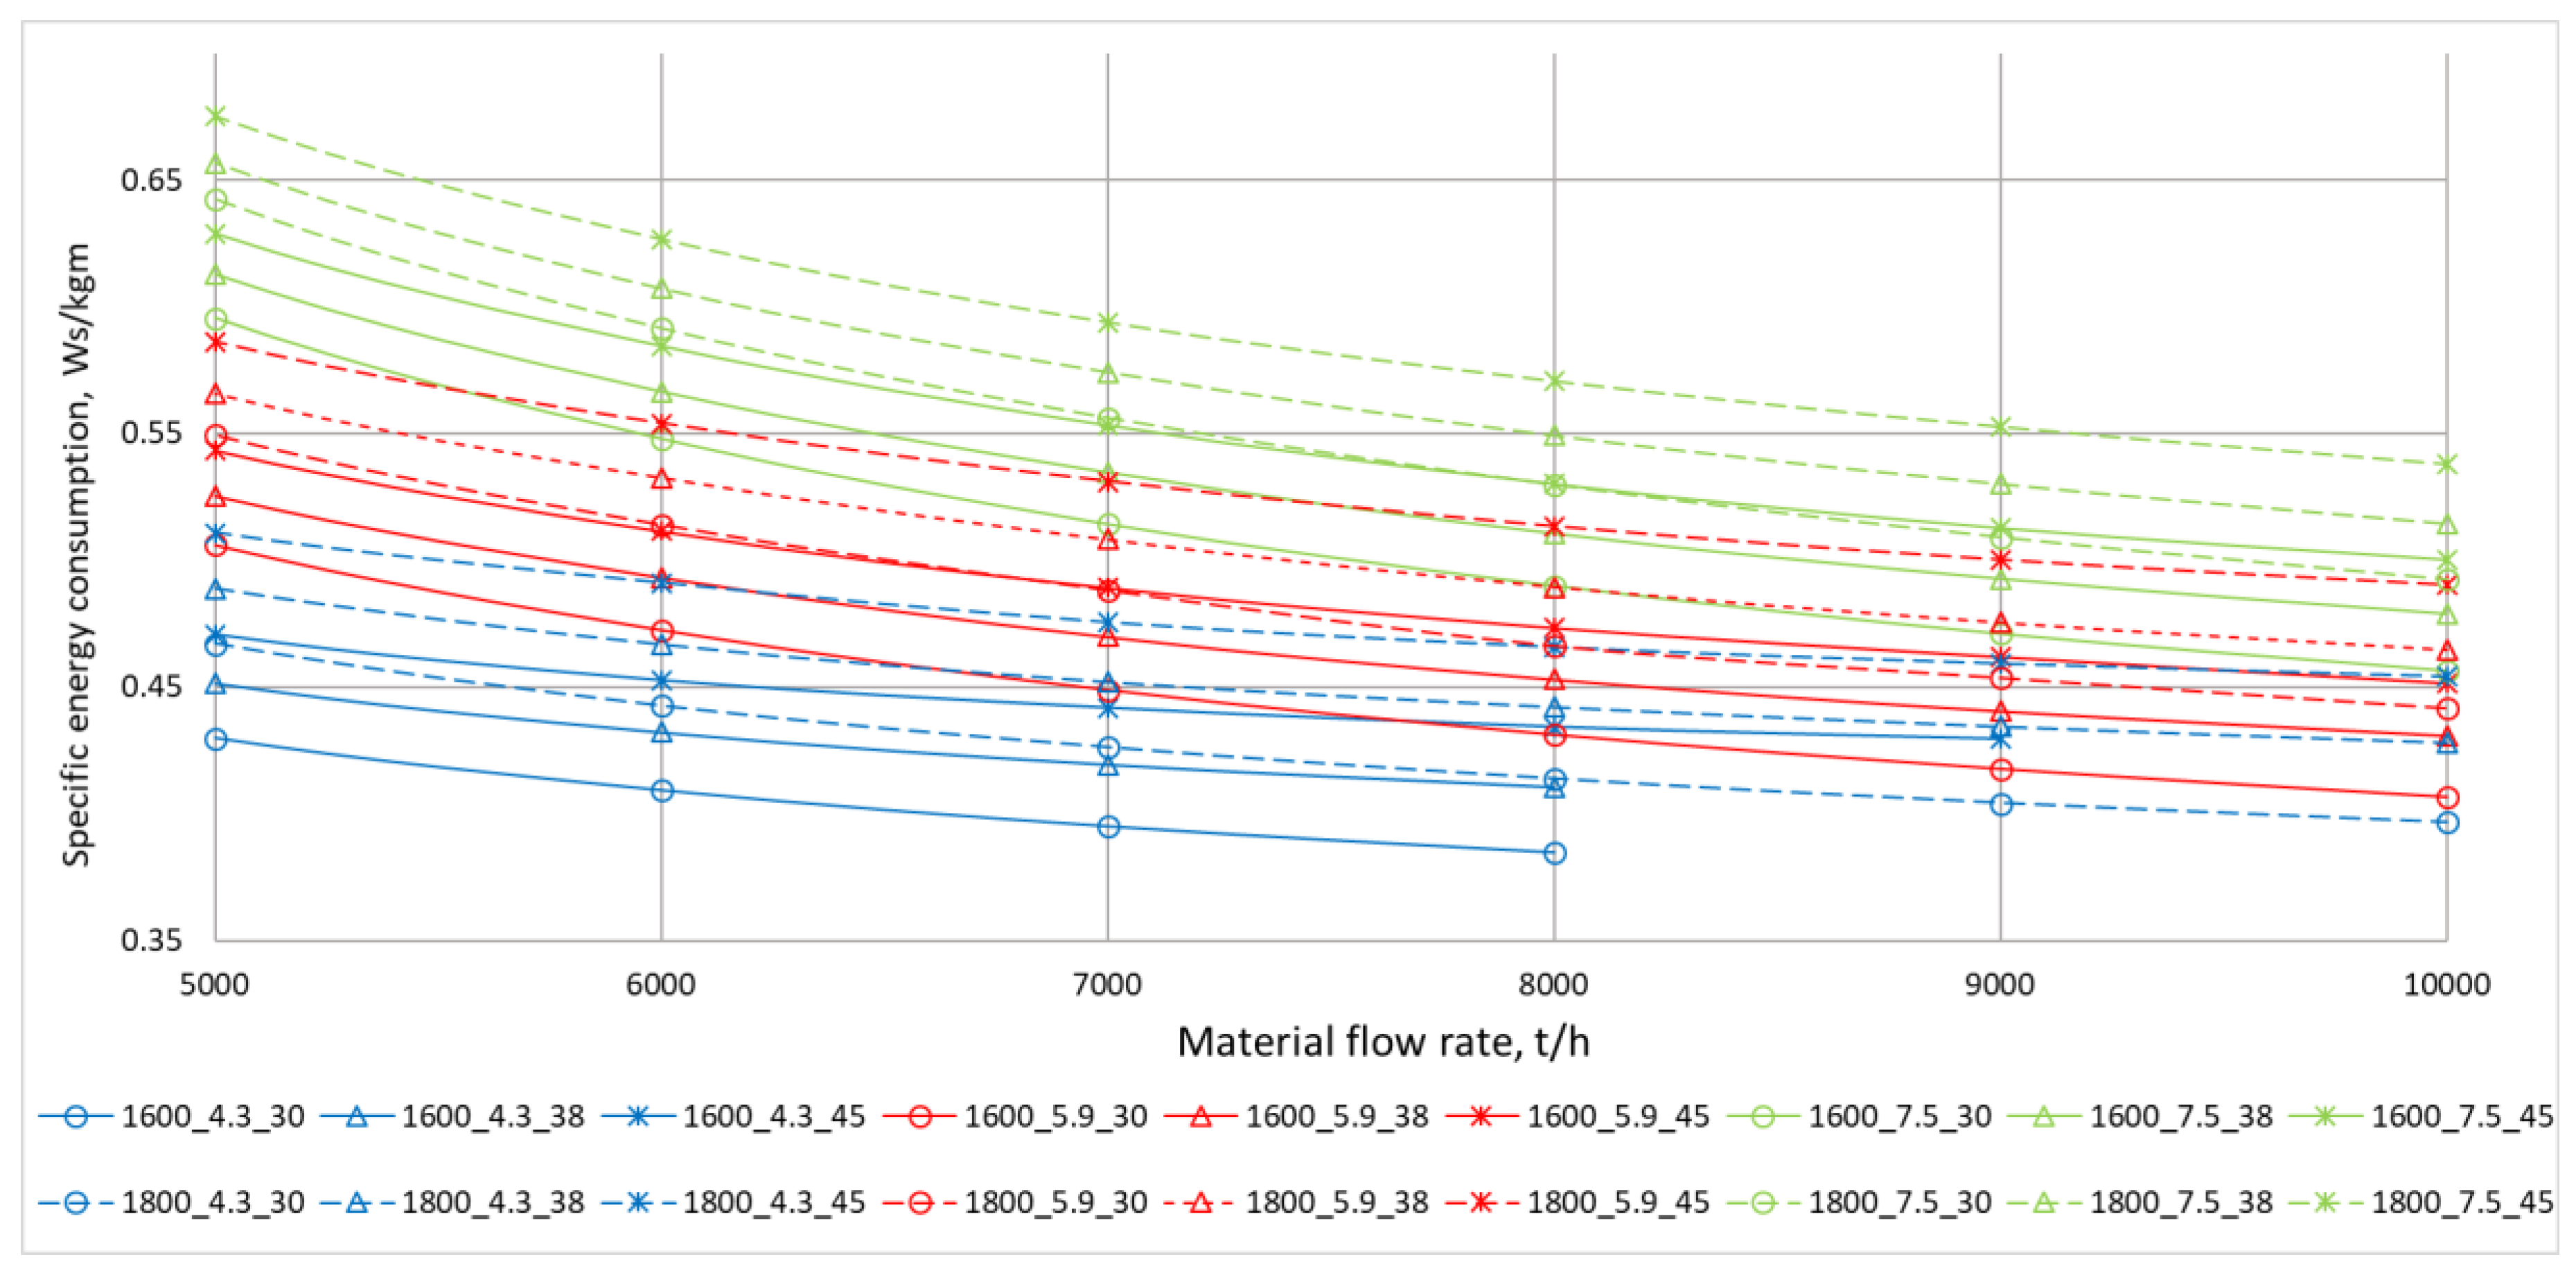
Figure 3 and showed a distinct decreasing tendency in specific energy consumption, while material flow rate increased. Moreover, the analysis indicated that lower values of conveyor design parameters yielded lower values of the SEC indicator. However, changes could be observed in the mentioned relationship above the value of 5000 t/h. As shown in
Figure 4, individual adjustment of the parameters should be considered for conveyors with higher mass capacity in order to reduce the SEC value.
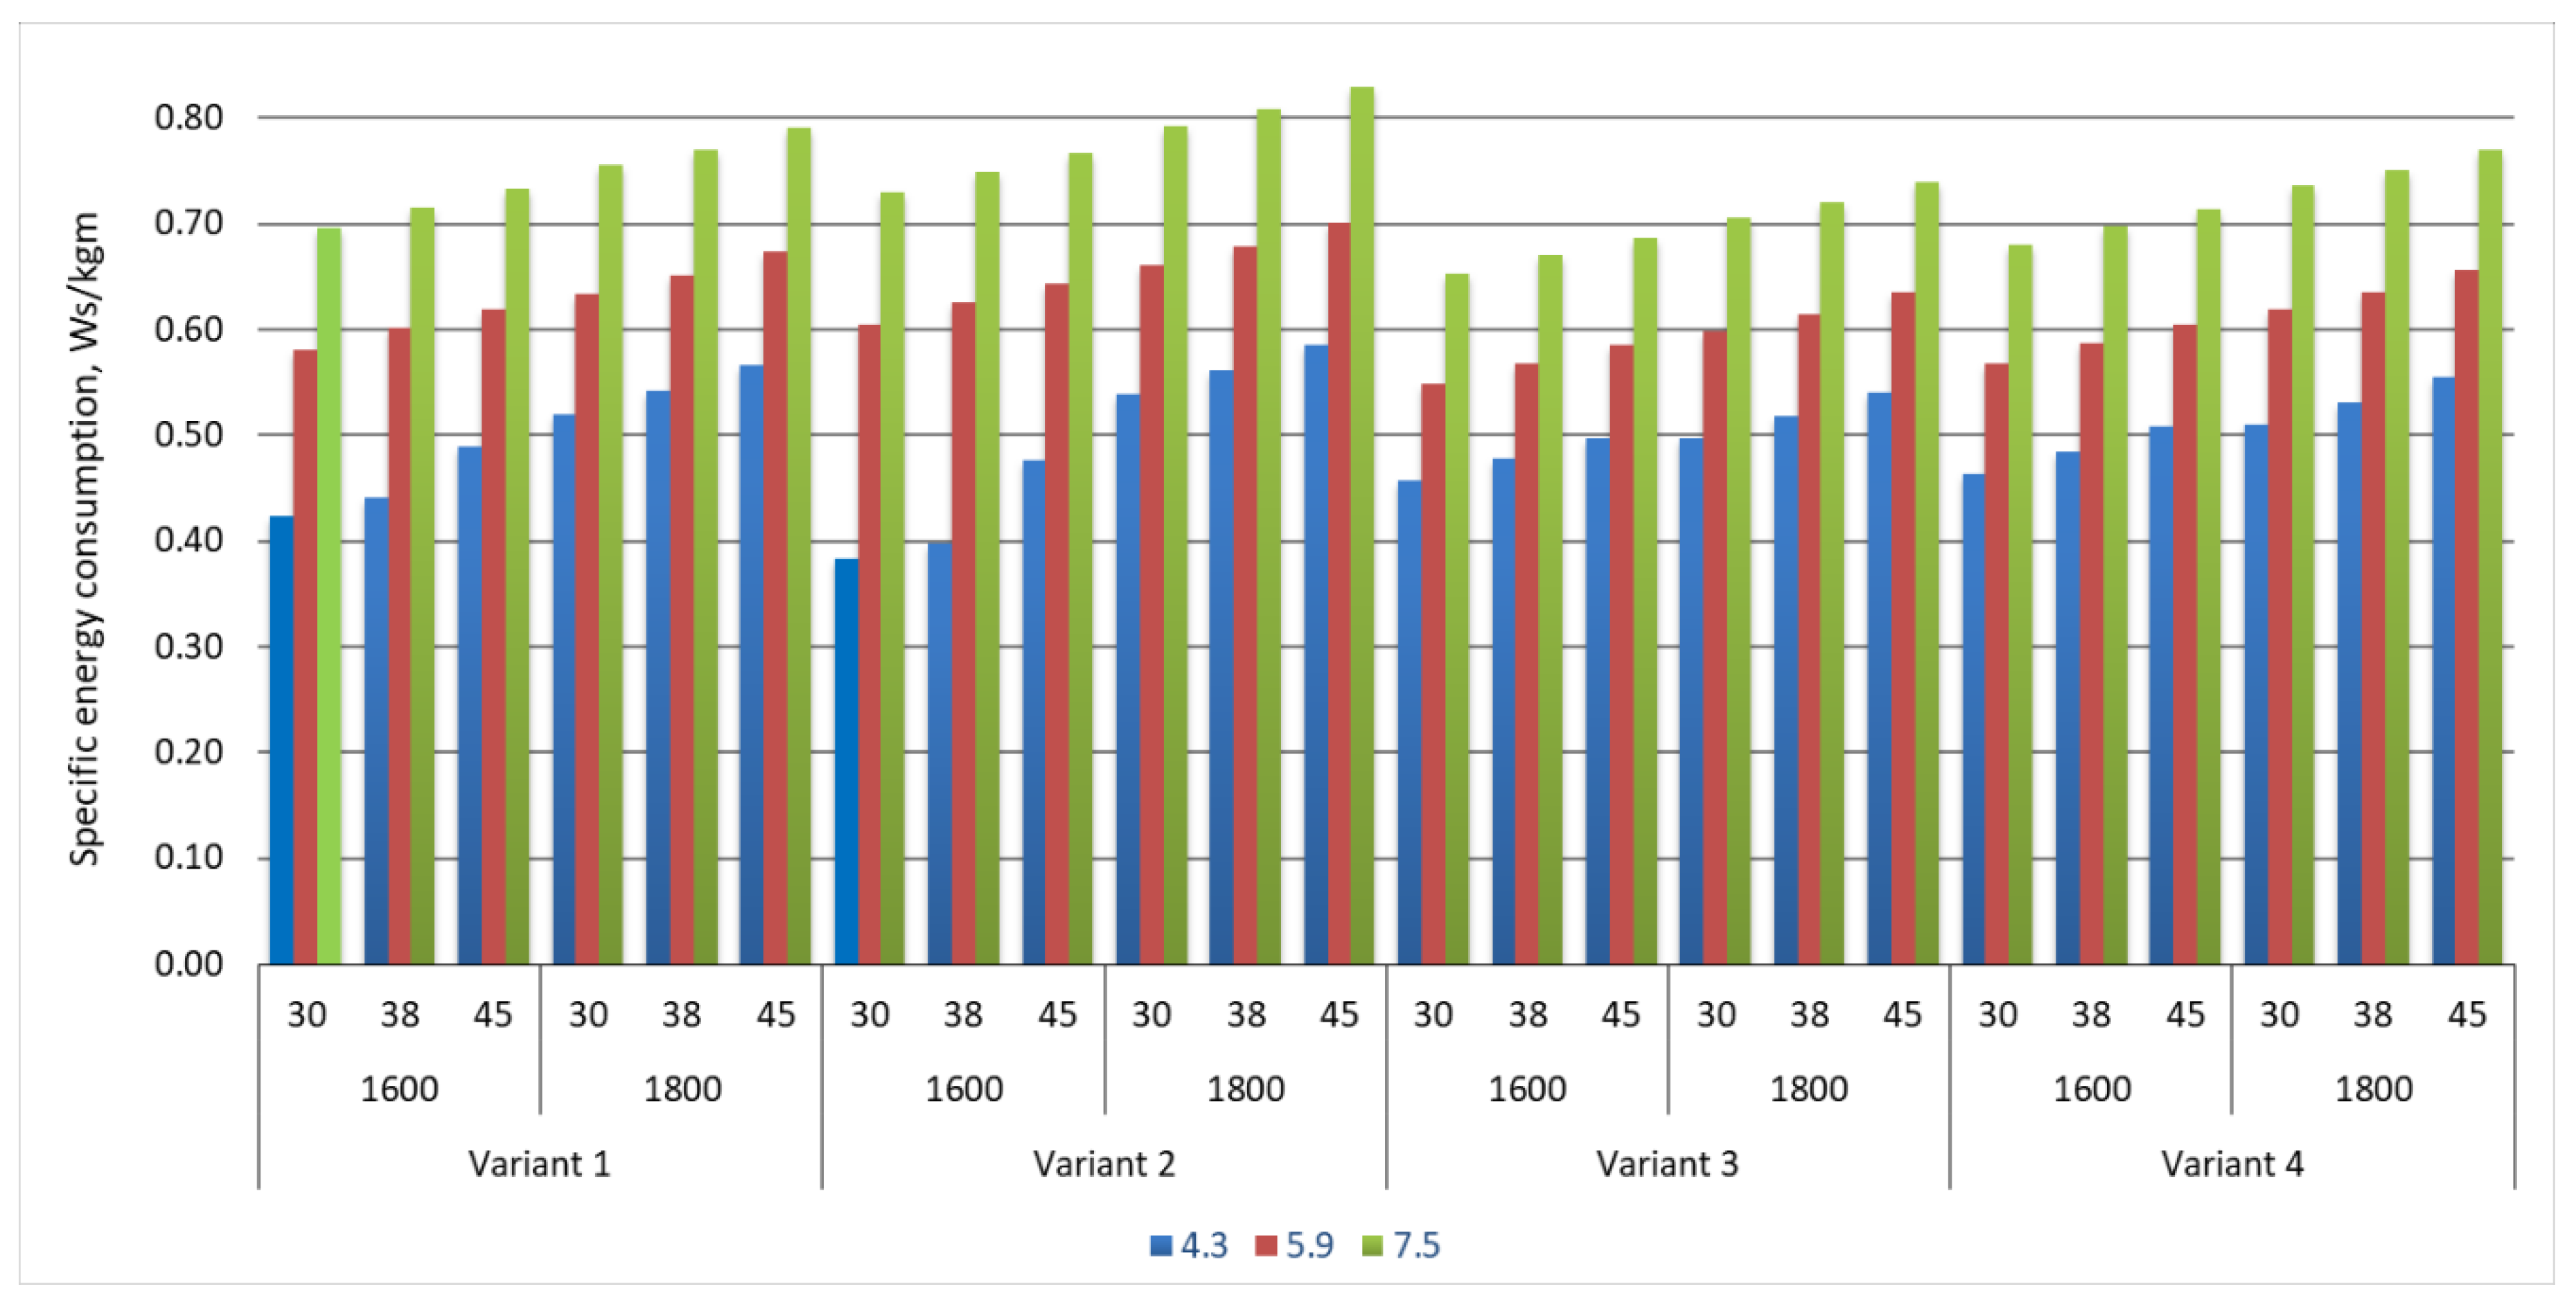
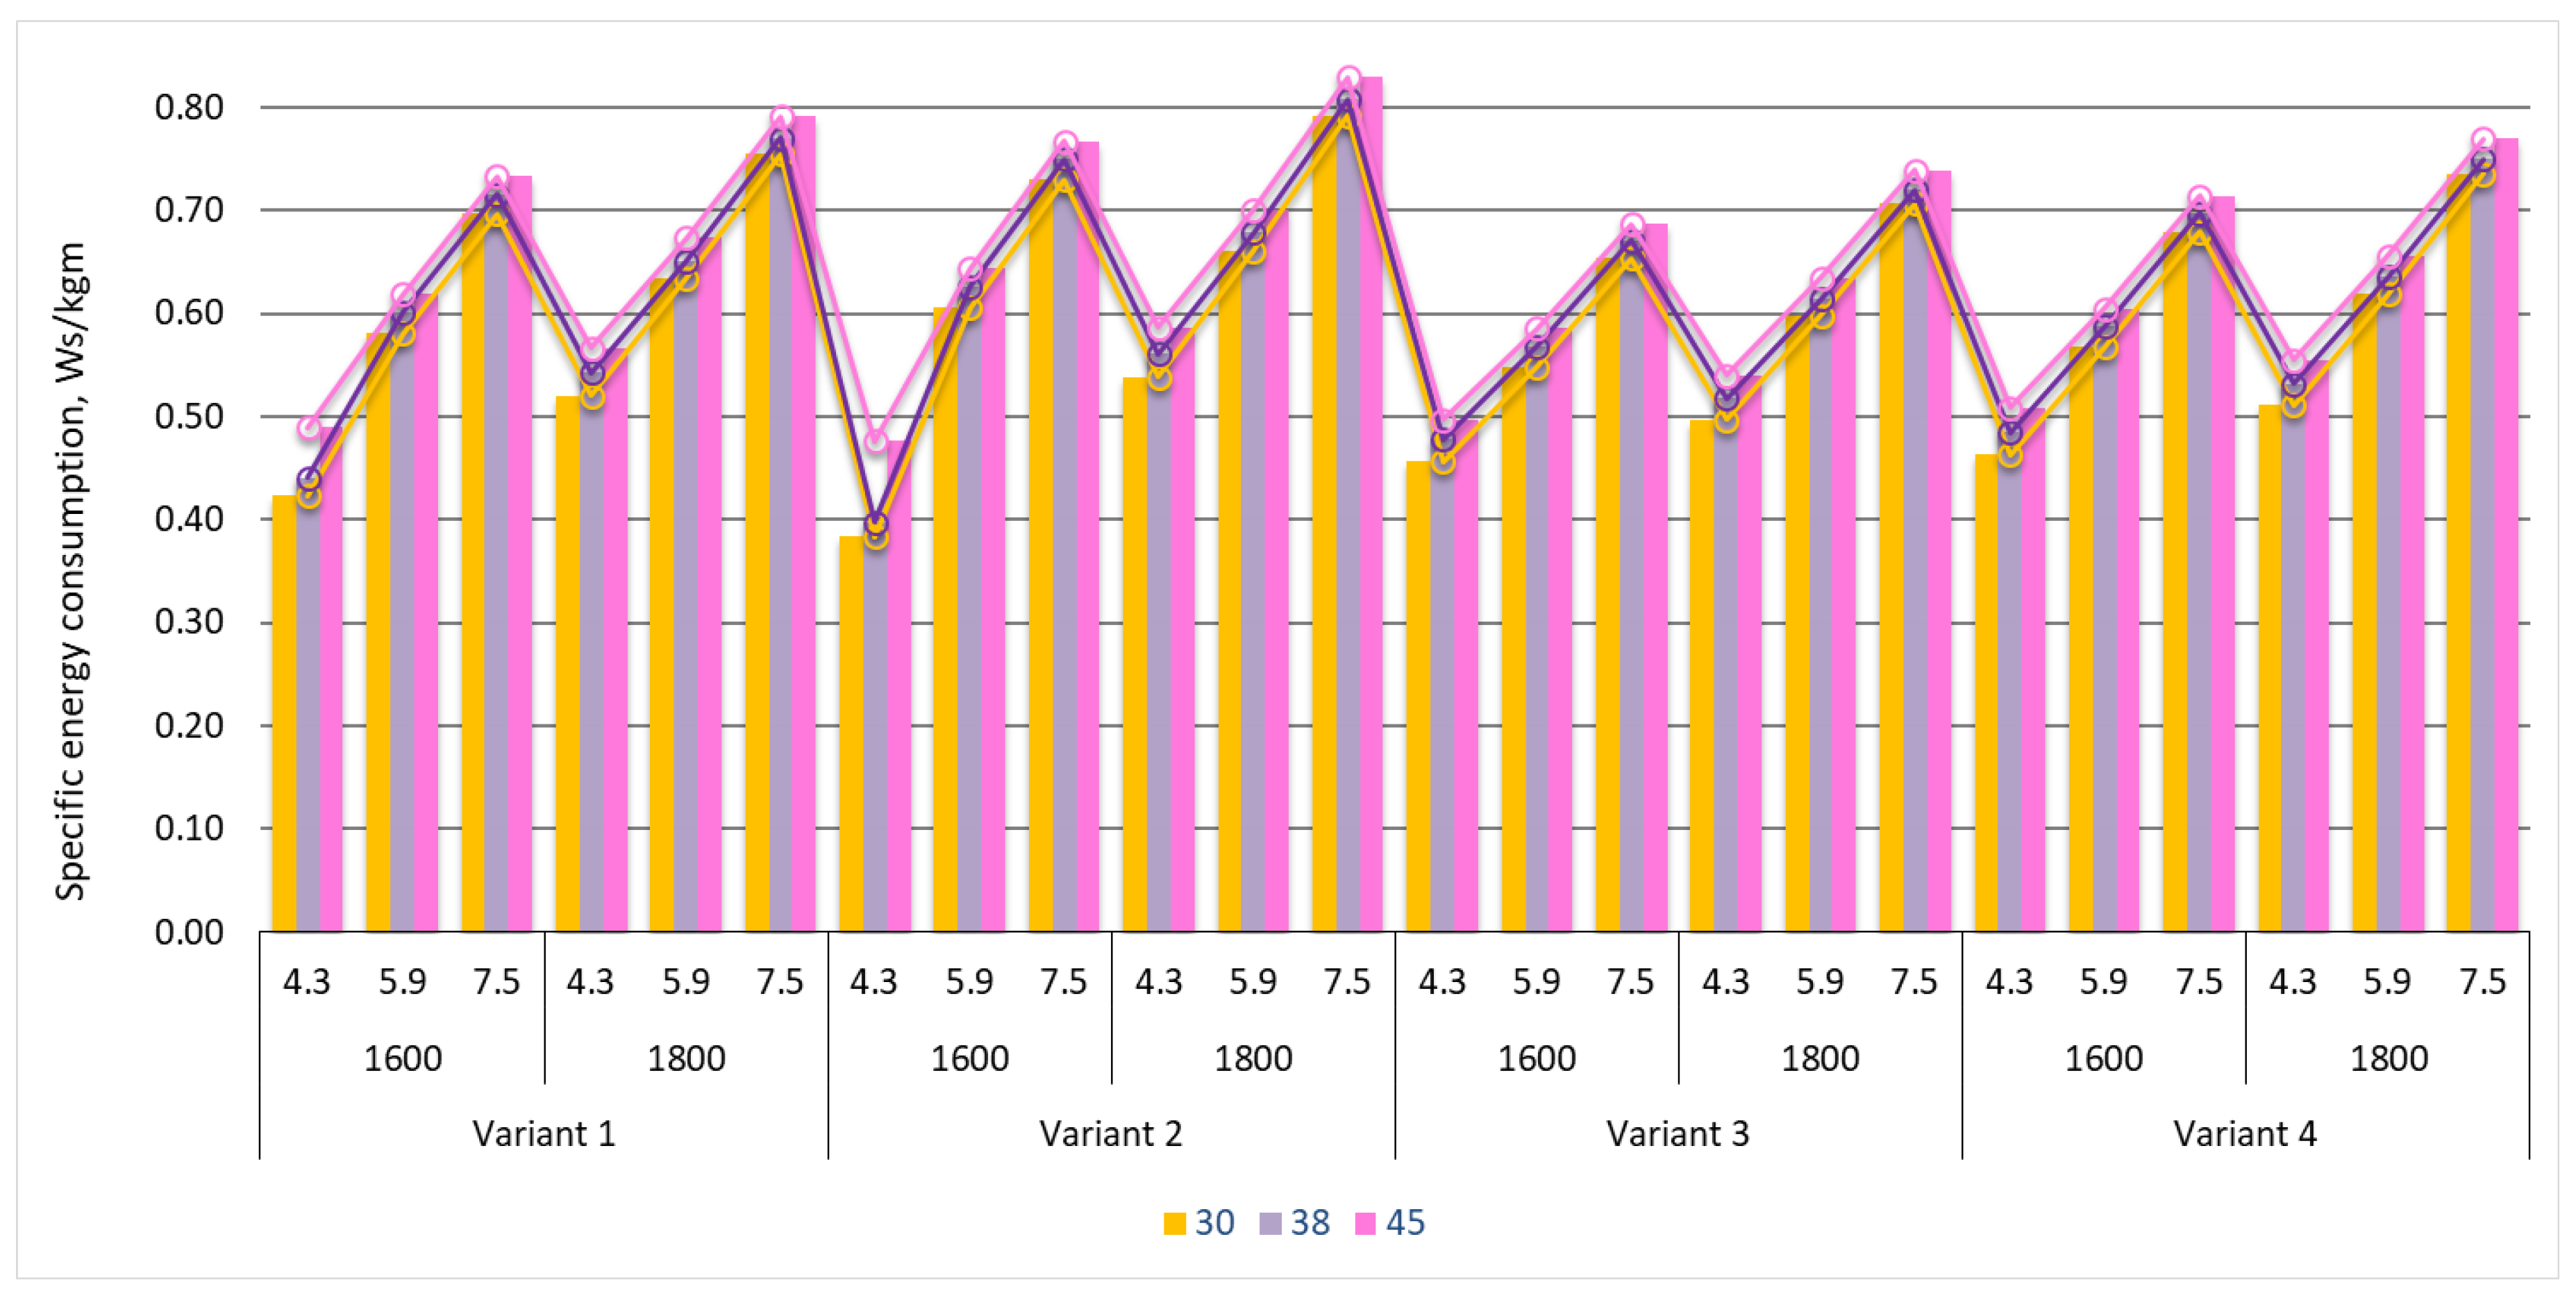
Furthermore, simulations of specific energy consumption values for different conveyors working under four different distributions of material stream were conducted.
Figure 5 and
Figure 6 indicate that the most efficient solution for real distributions of capacity was to use the conveyor with the lowest values of the considered design parameters. It is worth noting, however, that achieving a temporary capacity higher than 8000 t/h was impossible with belt width of 1600 mm and belt speed of 4.3 m/s (as this would exceed the belt’s maximum capacity).
3.2. Analysis of the Electric Energy Consumption for the Belt Conveyor Transportation System—Case Study
Based on
Section 3.1, it appeared that the most efficient solution for carrying out a given transport task was to use the conveyor with the lowest values of the considered design parameters. For this reason, these parameters were adopted in the model for further analysis (Steps 1a, 1b, and 1 + 2). In order to ensure the maximum required mass capacity in an option with a belt width of 1600 mm, the chosen speed was 5.9 m/s, and with the belt width of 1800 mm—4.3 m/s.
Table 4 presents the annual electric energy consumption of the proposed conveyor system and the percentage reduction in electricity consumption in comparison to the existing transportation system. It includes Step 0—real exploitation conditions, Step 1—reducing the number of conveyors, Step 2—a decrease in time of idle operation by half, and Step 1 + 2—a combination of Steps 1 and 2.
Electric energy consumption of the actual operating conditions (Step 0) was at a similar level regardless of the conveyor capacity distribution variant. The reductions in electric energy consumption in
Table 4 were calculated based on actual consumption in Step 0. Steps 1a and 1b involved lowering some design parameters and reducing the number of conveyors from five to three. The reduction obtained was thus the most significant (about 20%), while the step with the wider belt and the lower speed was even more efficient and provided a reduction of over 25%. The decrease halved the idle operation time (in the configuration of five conveyors) and lowered energy consumption by just over 3%. Combinations of Steps 1a and 1b with Step 2 were the sum of the reductions from the previous steps and allowed, especially in the case of the combination of Steps 1a + 2, the greatest savings in energy consumption.
Activities aimed at energy efficiency improvements also resulted in environmental benefits. The potential environmental advantages of the proposed solutions were estimated by calculating the potential reduction of annual CO
2 emissions. The CO
2 factor used for the calculations was 765 kg/MWh [
24].
Table 5 shows that the modernization (Steps 1a + 2) resulted in a reduction of around 5000 tons of CO
2 for the most effective option.
4. Discussion
The selection of belt conveyor parameters based on the Specific Energy Consumption index allowed an adjustment to actual transportation task requirements and, in effect, increased the energy effectiveness of the transportation system.
An important aspect to be considered is the percentage frequency distribution of mass capacity in the entire transportation process. As shown in
Figure 3 and
Figure 4, and in the distribution of the actual conveyor capacity in
Table 3, the share of lower mass capacities (in all variants) predominated. Moreover, the maximum capacities occurred to a small extent and did not determine the SEC.
The case study showed that various retrofittings of the transportation system were possible. One of them involved decreasing the number of conveyors from five to three in the transportation system. It allowed for a reduction of energy consumption due to the reduction of secondary resistance (a lower number of conveyors meant fewer pulleys, feed points, etc.). It was proved that changes of design parameters (i.e., selecting lower values of the analyzed parameters) should be as extensive as possible in order to achieve the required maximum mass capacities. Each of the parameters considered in the article affected some of the primary resistances. For example, a lower trough angle led to a decrease in rolling (indentation) resistance for side idlers. Moreover, a decrease in belt speed affected the decrease in idler rotational resistance. This aspect was especially important for longer conveyors, where the impact of primary resistance on total motion resistance was significant.
In order to achieve the required maximum mass capacities, a belt of 1800 mm in width, with a reserve greater than 1600 mm, needed to be adopted in some cases. For a narrower belt, variable frequency drives and speed control could be used if necessary. These allowed for a reduction in motion resistances, causing the energy consumption to be lower during regular work. In the considered transportation system, operated in a surface lignite mine, no significant difference in energy consumption was observed after reducing the idle operation time. Therefore, performing intensive stop-and-start operations when the belt remains unloaded for short periods of time (especially during the winter months) could be seen as unnecessary.
The presented results demonstrated that by selecting optimum design parameters and operating conditions, it was possible to reduce electric power demand and CO
2 emissions. In this field, significant results may be obtained by either active speed control (bulk material: coal) or proper selection of conveyor design parameters (bulk material: copper), which were presented in [
10,
16].
5. Conclusions
Based on the results of the above analyses, the following conclusions can be drawn:
The presented modernization of the transport route leads to energy-related and environmental benefits that allow for more sustainable operation of conveyor belts.
Improvement was possible because the design solutions were individually selected to match the operational parameters of the conveyor (implementing a specific transportation task) based not only on its impact on energy consumption but, above all, on the relationship between motion resistance and mass capacity efficiency.
Each modernization leading to a reduction in energy consumption could also be viewed from an environmental perspective. In the most advantageous variation, the modernization would allow a decrease in energy consumption by 27.78%, which results in the reduction of carbon dioxide emissions into the atmosphere by 5097.88 tons per year.
Author Contributions
Conceptualization, R.K., W.K., N.S., M.K.-F.; methodology, W.K., N.S.; in-house software, W.K.; validation, W.K., N.S., M.K.-F.; formal analysis, N.S., M.K.-F.; investigation, N.S.; data curation, W.K., N.S., M.K.-F.; writing—original draft preparation, N.S., M.K.-F.; writing—review and editing, M.K.-F., W.K.; visualization, N.S., M.K.-F.; project administration & funding acquisition, R.K. All authors have read and agreed to the published version of the manuscript.
Funding
The research work was co-founded with the research subsidy of the Polish Ministry of Science and Higher Education granted for 2020.
Conflicts of Interest
The authors declare no conflict of interest.
References
- Soofastaei, A.; Karimpour, E.; Knights, P.; Kizil, M. Energy-efficient loading and hauling operations. In Green Energy and Technology; Springer: Cham, Switzerland, 2018; pp. 121–146. [Google Scholar]
- Zhang, S.; Xia, X. Optimal control of operation efficiency of belt conveyor systems. Appl. Energy 2010, 87, 1929–1937. [Google Scholar] [CrossRef]
- Holmberg, K.; Kivikytö-Reponen, P.; Härkisaari, P.; Valtonen, K.; Erdemir, A. Global energy consumption due to friction and wear in the mining industry. Tribol. Int. 2017, 115, 116–139. [Google Scholar] [CrossRef]
- Zhang, S.; Xia, X. Modeling and energy efficiency optimization of belt conveyors. Appl. Energy 2011, 88, 3061–3071. [Google Scholar] [CrossRef]
- Gładysiewicz, L.; Kawalec, W.; Król, R. Selection of carry Idlers spacing of belt conveyor taking into account random stream of transported bulk material. Eksploat. Niezawodn. Maint. Reliab. 2016, 18, 32–37. [Google Scholar]
- Gładysiewicz, L.; Konieczna-Fuławka, M. Influence of idler set load distribution on belt rolling resistance. Arch. Min. Sci. 2019, 64, 251–259. [Google Scholar]
- Schützhold, J.; Benath, K.; Müller, V.; Hofmann, W. Design criteria for energy efficient belt conveyor drives. In Proceedings of the 2014 International Symposium on Power Electronics, Electrical Drives, Automation and Motion, SPEEDAM 2014, Ischia, Italy, 18–20 June 2014; IEEE Computer Society: Washington, DC, USA; pp. 1256–1263. [Google Scholar]
- Król, R.; Gladysiewicz, L.; Kaszuba, D.; Kisielewski, W. New Quality Standards of Testing Idlers for Highly Effective Belt Conveyors. IOP Conf. Ser. Earth Environ. Sci. 2017, 95, 42055. [Google Scholar] [CrossRef]
- Bajda, M.; Hardygóra, M. Laboratory tests of operational durability and energy—Efficiency of conveyor belts. IOP Conf. Ser. Earth Environ. Sci. 2019, 261, 12002. [Google Scholar] [CrossRef]
- He, D.; Liu, X.; Zhong, B. Sustainable belt conveyor operation by active speed control. Measurement 2020, 154, 107458. [Google Scholar] [CrossRef]
- Pang, Y.; Lodewijks, G. Improving energy efficiency in material transport systems by fuzzy speed control. In Proceedings of the LINDI 2011—3rd IEEE International Symposium on Logistics and Industrial Informatics, Proceedings, Budapest, Hungary, 25–27 August 2011; pp. 159–164. [Google Scholar]
- Akparibo, A.R.; Normanyo, E. Application of resistance energy model to optimising electric power consumption of a belt conveyor system. Int. J. Electr. Comput. Eng. 2020, 10, 2861–2873. [Google Scholar] [CrossRef]
- Yang, C.; Liu, J.; Li, H.; Zhou, L. Energy Modeling and Parameter Identification of Dual-Motor-Driven Belt Conveyors without Speed Sensors. Energies 2018, 11, 3313. [Google Scholar] [CrossRef]
- Gładysiewicz, L.; Migdał, W. Specific energy consumption of belt conveyors. Transp. Przem. Masz. Rob. 2017, 4, 5–9. [Google Scholar]
- Masaki, M.S.; Zhang, L.; Xia, X. A design approach for multiple drive belt conveyors minimizing life cycle costs. J. Clean. Prod. 2018, 201, 526–541. [Google Scholar] [CrossRef]
- Shihata, L.; Ebeid, S. Improved energy efficiency in troughed belt conveyors: Selected factors and effects. Int. J. Eng. Tech. Res. 2015, 3, 174–180. [Google Scholar]
- Sarathbabu Goriparti, N.V.; Murthy, C.S.N.; Aruna, M. Prediction of Energy Efficiency of Main Transportation System Used in Underground Coal Mines—A Statistical Approach. In International Conference on Emerging Trends in Engineering (ICETE); Springer: Cham, Switzerland, 2020; pp. 337–344. [Google Scholar]
- Gładysiewicz, L. Belt Conveyors: Theory and Calculations (in Polish); Wroclaw University of Technology Publishing House: Wrocław, Poland, 2003. [Google Scholar]
- Dworczyńska, M.; Kawalec, W.; Gładysiewicz, L. Model strugi urobku dla potrzeb projektowania przenośników zbiorczych. Transp. Przem. Masz. Rob. 2012, 1, 26–30. [Google Scholar]
- Kulinowski, P.; Kawalec, W. Program Komputerowy QNK-TT do Wspomagania Projektowania Przenośników Taśmowych. Available online: http://www.EnterTECH.com.pl/QNK (accessed on 24 August 2020).
- Gładysiewicz, L.; Hardygóra, M.; Kawalec, W. Determining belt resistance. Bulk Handl. Today 2009, 5, 26–30. [Google Scholar]
- Konieczna-Fuławka, M. Metoda Wyznaczania Oporów Toczenia Taśmy po Krążnikach; Wrocław University of Science and Technology: Wroclaw, Poland, 2019. [Google Scholar]
- Król, R. Methods of Testing and Selection of the Belt Conveyor Equipment with Regard to Random Loading of a Transported Bulk Material; Wydział Geoinżynierii, Górnictwa i Geologii Politechniki Wrocławskiej M4—Citavi: Wrocław, Poland, 2013; ISBN 978-83-937788-1-2. [Google Scholar]
- Krajowy Ośrodek Bilansowania i Zarządzania Emisjami. Wskaźniki Emisyjności CO2, SO2, NOx, CO i Pyłu Całkowitego dla Energii Elektrycznej; Instytut Ochrony Środowiska—Państwowy Instytut Badawczy: Warsaw, Poland, 2019. [Google Scholar]
© 2020 by the authors. Licensee MDPI, Basel, Switzerland. This article is an open access article distributed under the terms and conditions of the Creative Commons Attribution (CC BY) license (http://creativecommons.org/licenses/by/4.0/).


