Methane Hydrate Formation and Dissociation in Sand Media: Effect of Water Saturation, Gas Flowrate and Particle Size

 , , , ,
Abstract
1. Introduction
2. Materials and Methods
2.1. Materials
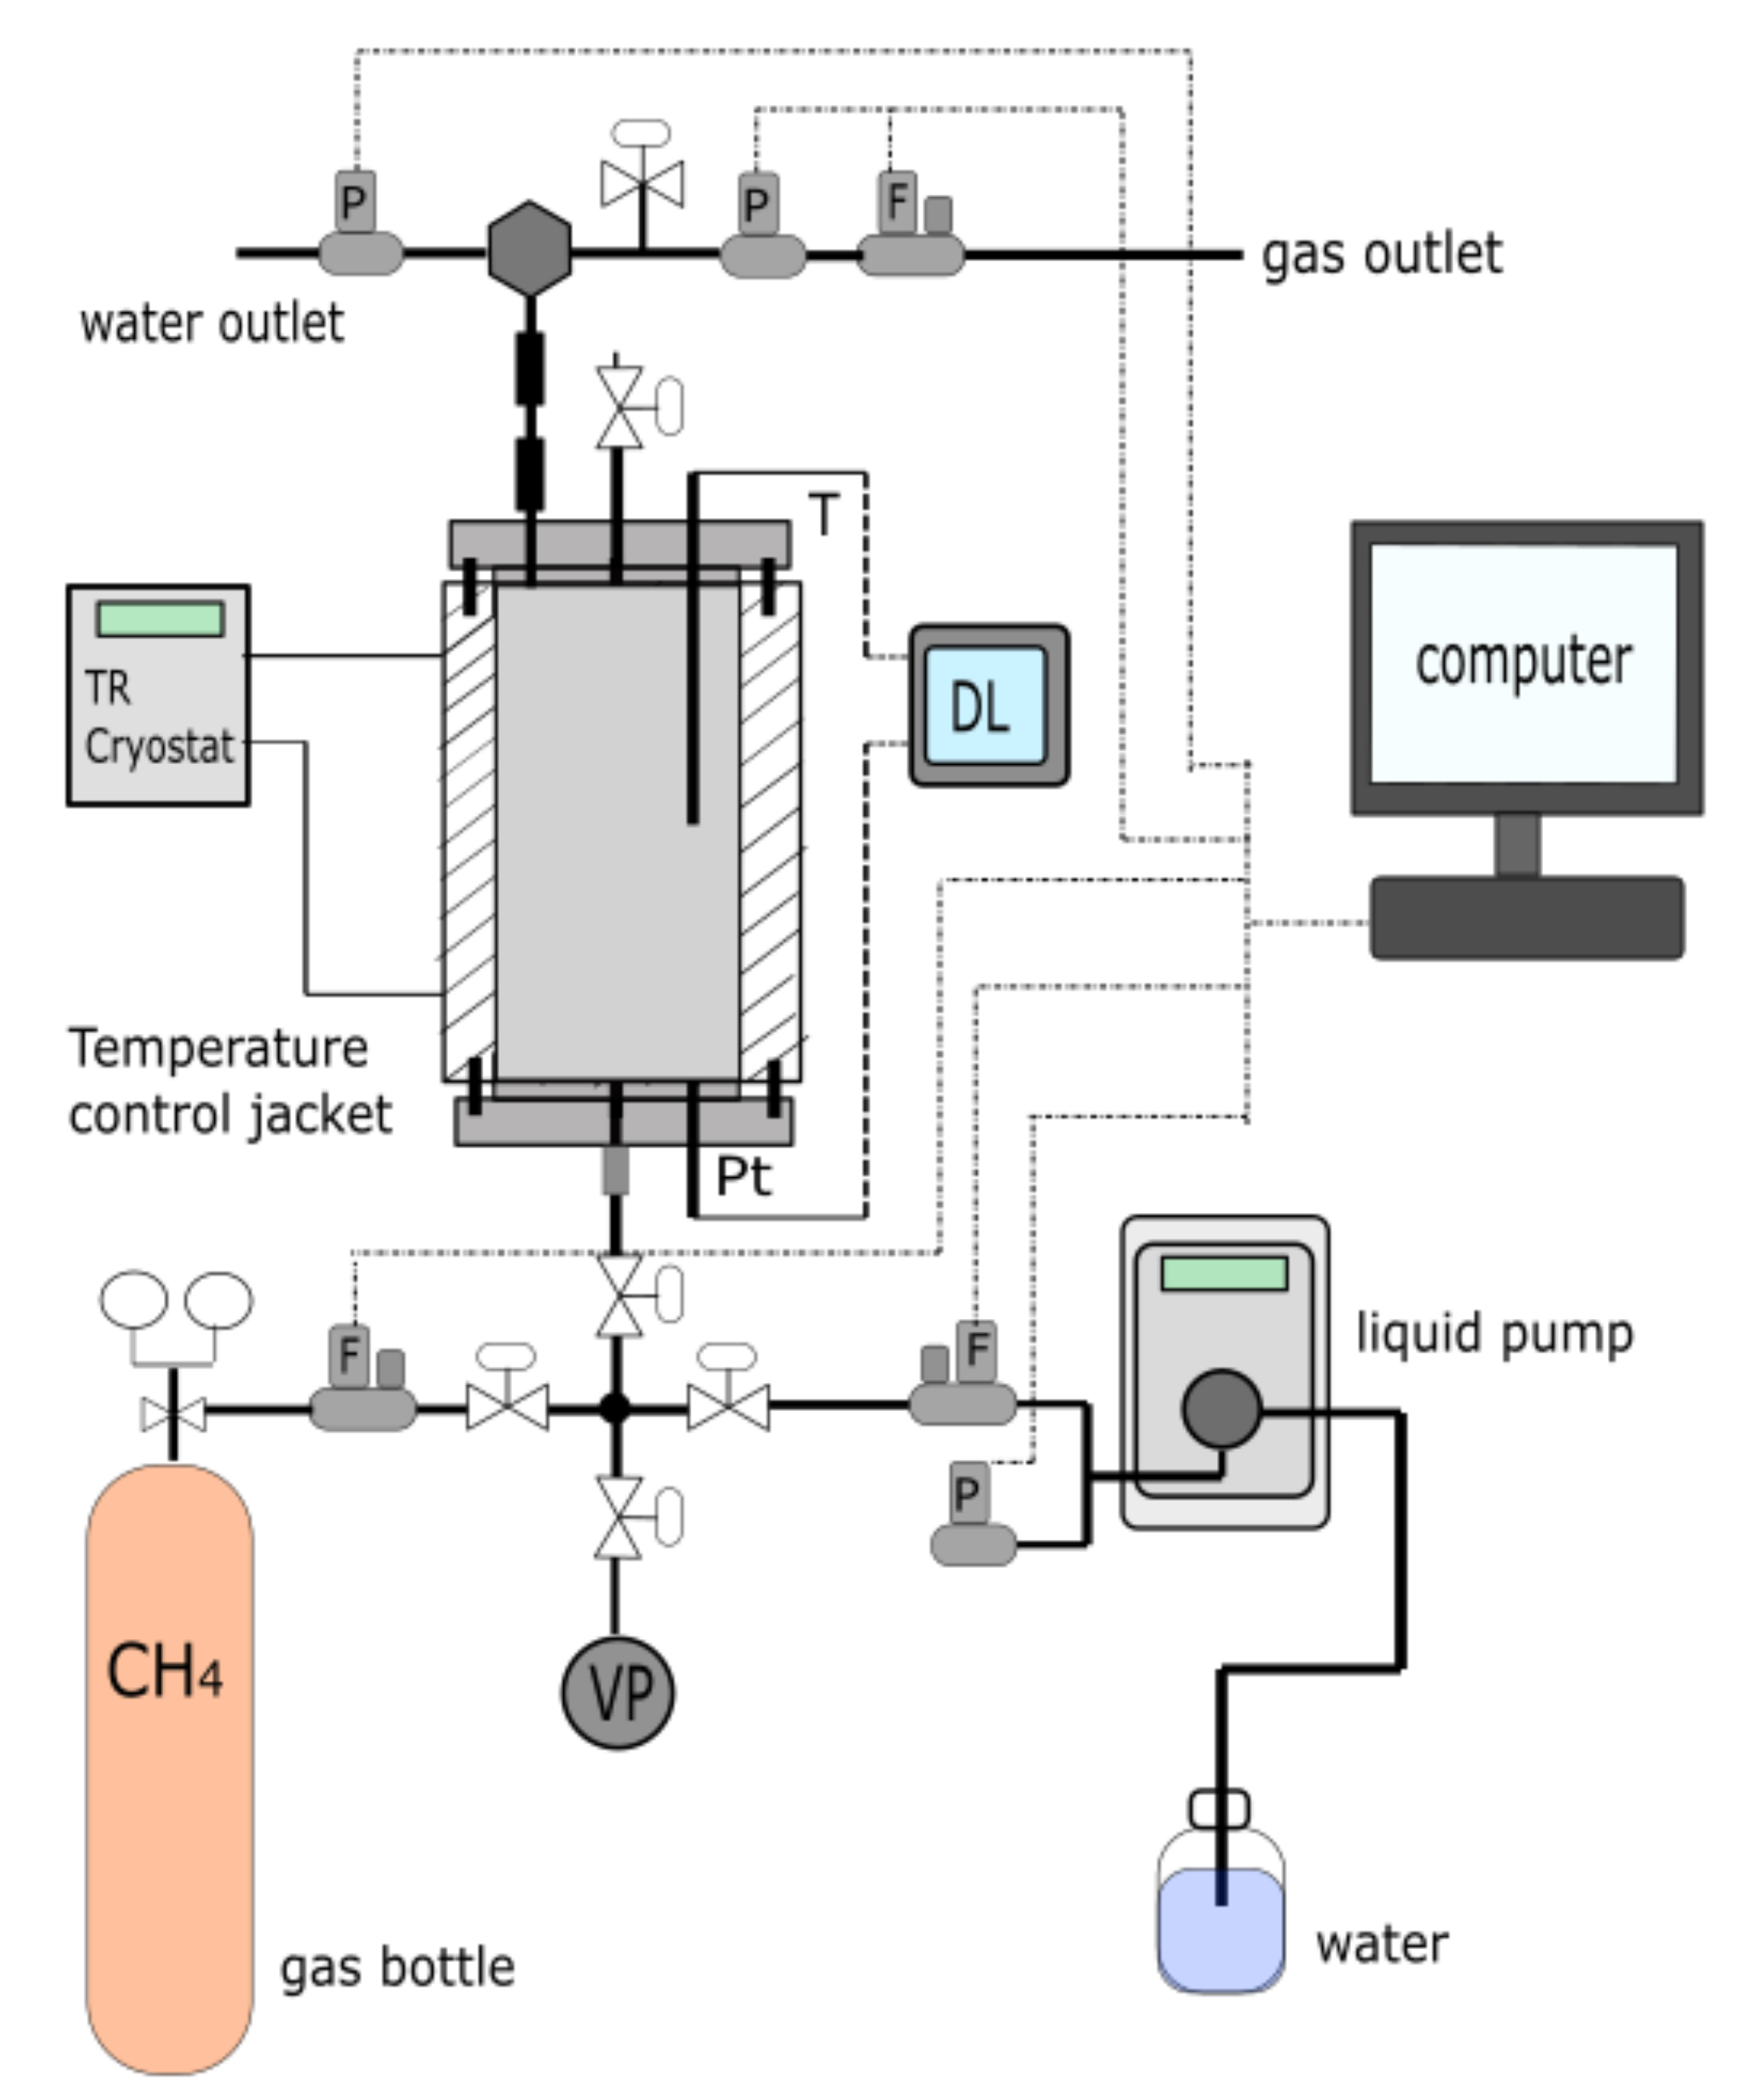
2.2. Experimental Setup
2.3. Experimental Method
2.4. Study of Water Distribution by X-Ray Computerized Tomography (CT Scan)
3. Results
3.1. Water Distribution in Sandy Core Samples
- (1)
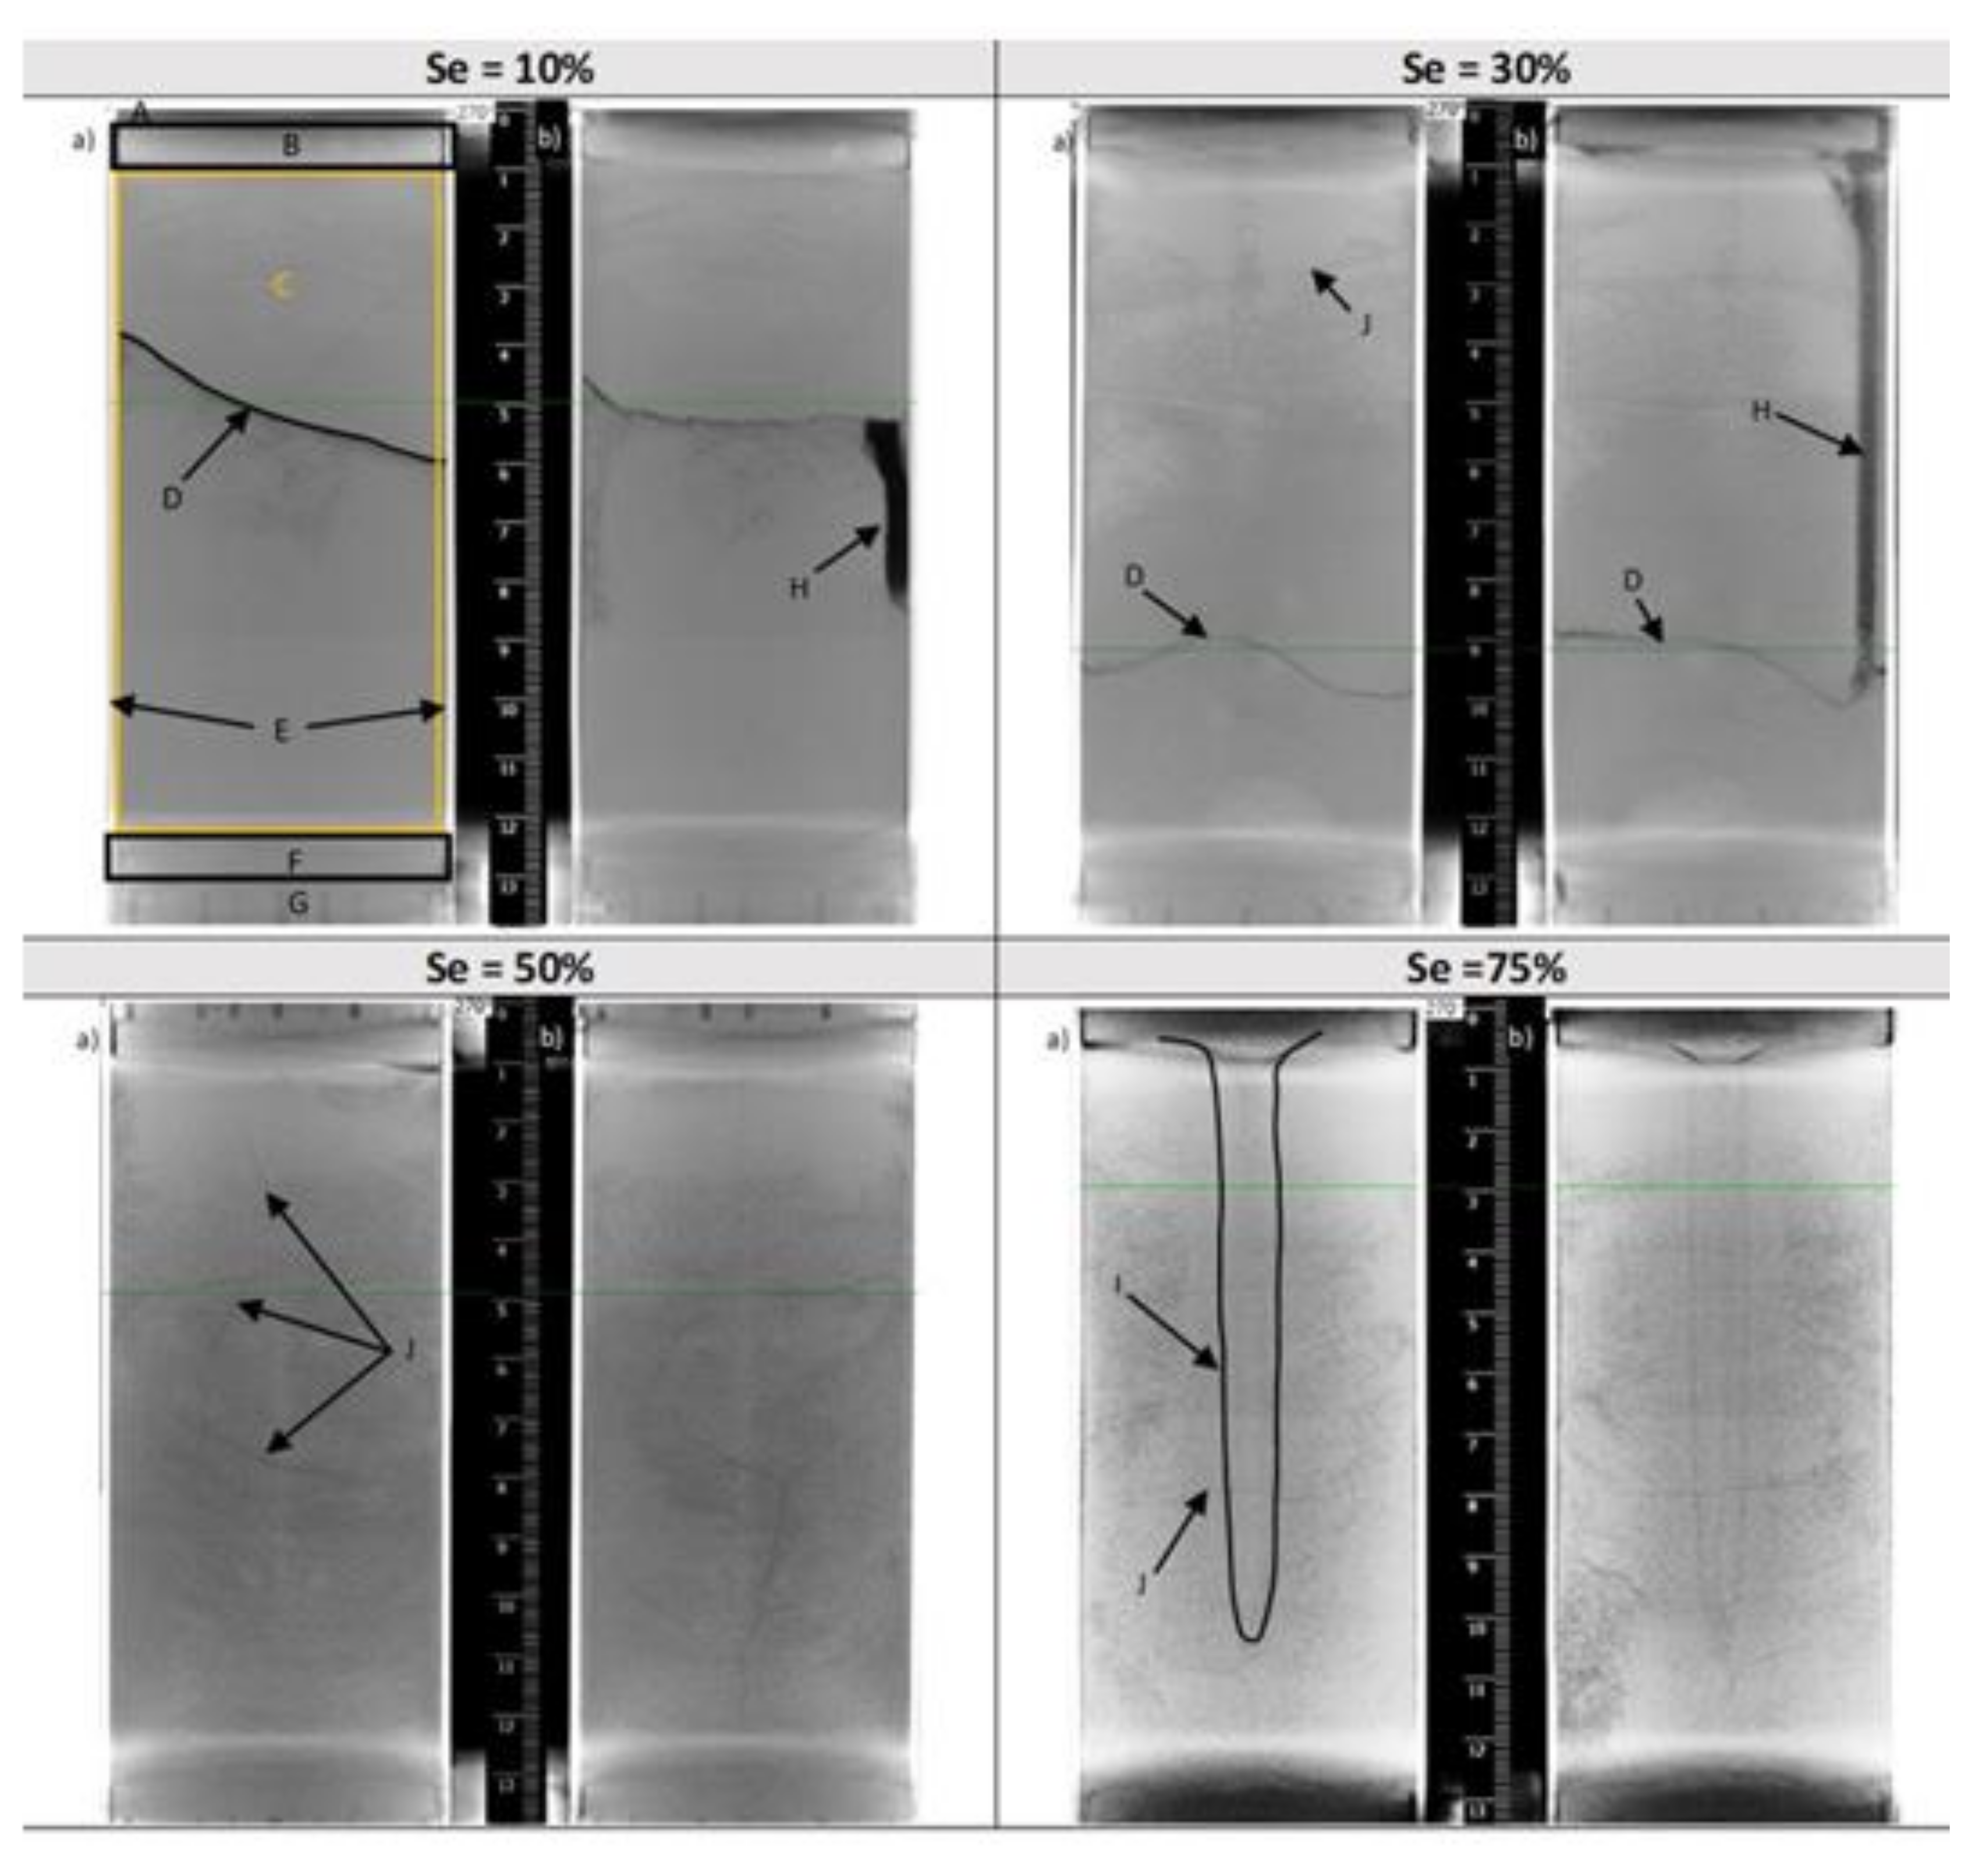
- Water injected at the top of the cell is heterogeneously distributed in the sandy core by capillary forces for 10% and 30% water saturation, in agreement with a previous finding [48]. Moreover, the amount of injected water is not sufficient to reach the bottom of the cell and a non-planar water front separating the wet and dry core sections is observed in Figure 5D. When the water saturation increases from 10% to 30%, this water front moves towards the bottom of the cell. The penetration depth of the water is between 4 cm and 6 cm thickness at 10% saturation, and between 8 cm and 10 cm thickness at 30%.
- (2)
- For higher water saturations (50% and 75%), the interface between the wet and dry core sections is not observed: it can be assumed that the amount of water is sufficient to reach the bottom of the cell. This is supported by the fact that the network cracks (J) reach the bottom of the cell at 50% water saturation. However, these CT scan images do not provide detailed and conclusive information on the total wettability of the core, and some zones remain dry suggesting a spatial heterogeneity as observed by Song et al. [49]. Therefore, Figure 5 should not be taken as face value but rather as an illustration of how heterogeneities linked to the intrinsic properties of the sandy particles (porosity and permeability) can be reflected in the water distribution. The computed porosity of the sandy core is around 0.42 here. Intrinsic permeability measurements were not carried out as our apparatus was not designed for this purpose. However, it was possible to calculate a first-order estimate of the hydraulic conductivity (k) using two widely used formula for coarse-grained matrices: The correlation from Hazen (1892) that correlated k with the effective diameter of the finest 10% of the sand (D10), and an analytically derived Kozeny-Carman’s equation from Ren et al. (2018) which is a function of the specific surface area of the sand [50,51,52,53,54]. The hydraulic conductivity is proportional to the intrinsic permeability, and gives an idea on how water flows through the sandy core. Here, computed hydraulic conductivity values are of (in cm·s−1) from 2 × 10⁻² to 5 × 10⁻², from 1 × 10⁻² to 3 × 10⁻² and from 6 × 10⁻² to 17 × 10−2 for the non-sieved sand, and the fraction PS01 and PS03, respectively. The highest values are obtained with the correlation derived from Kozeny-Carman’s equation. As expected, the hydraulic conductivity increases with increasing particle size. These values are in agreement with values from the literature for sand with similar D10 [51,52,53]. Overall, there is less than one order of magnitude between the hydraulic conductivity of each sand fraction. Knowing the non-compressibility of sand particles, we can reasonably consider here a narrow distribution range for their intrinsic permeability of the core and a diversity in the flow paths due to differences in size and shape of the particles, thus, explaining the heterogeneity in the porosity and permeability fields. In fact, the non-planar waterfront after water stabilization at 10 and 30% water saturation results from heterogeneity in the porosity and permeability fields. Thus, it is likely that even if the same procedure for sample preparation is repeated with the same matrix and at the same water saturation, the water distribution may differ from one experiment to another. At 75% water saturation, we noticed the presence of a region with a cone-like shape located in the center of the core. This region corresponds to a water saturated zone as the water injection point is located at the center of the cell lid, this assumption was confirmed when emptying the cell to visually examine the sandy core. The small region with a cone-like shape of wet sand was indeed visible, and it took longer to defrost compared to the rest of the matrix.
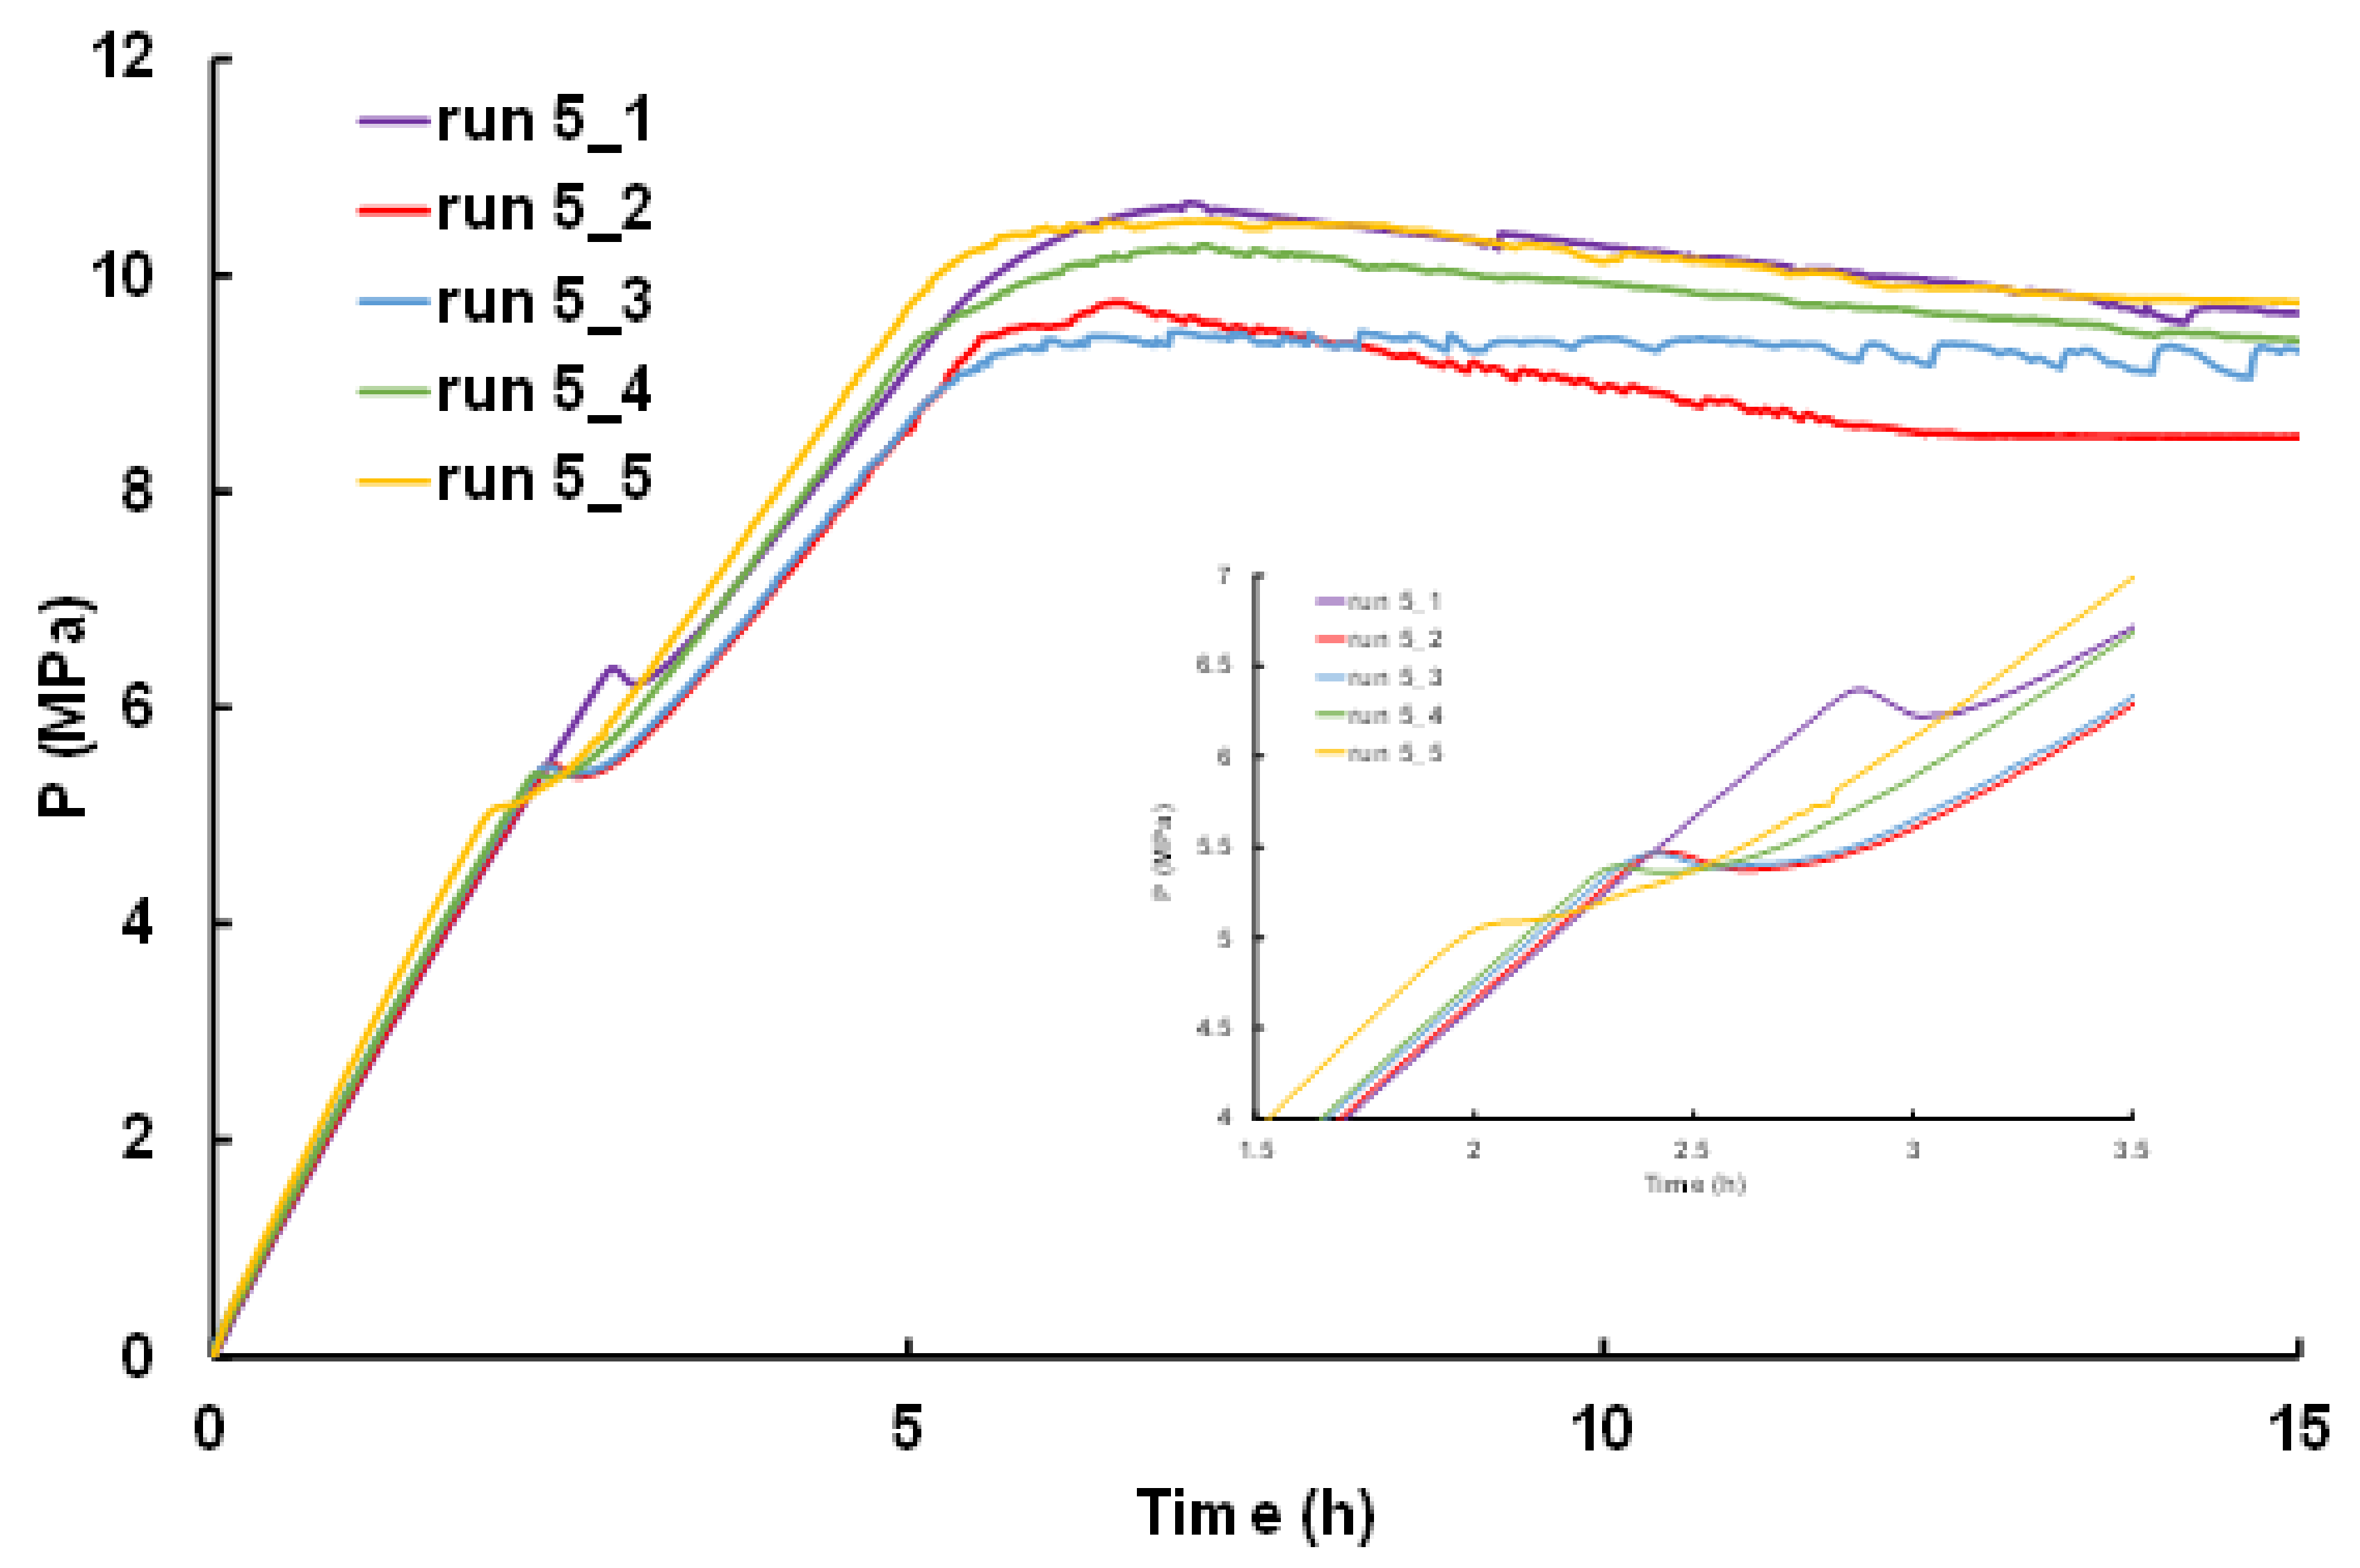
3.2. Hydrate Formation: Variability of the Induction Time and Pressure Induced Growth Trajectory with the Three Selected Parameters
3.2.1. Evolution of Induction Time for Repeated Experiments
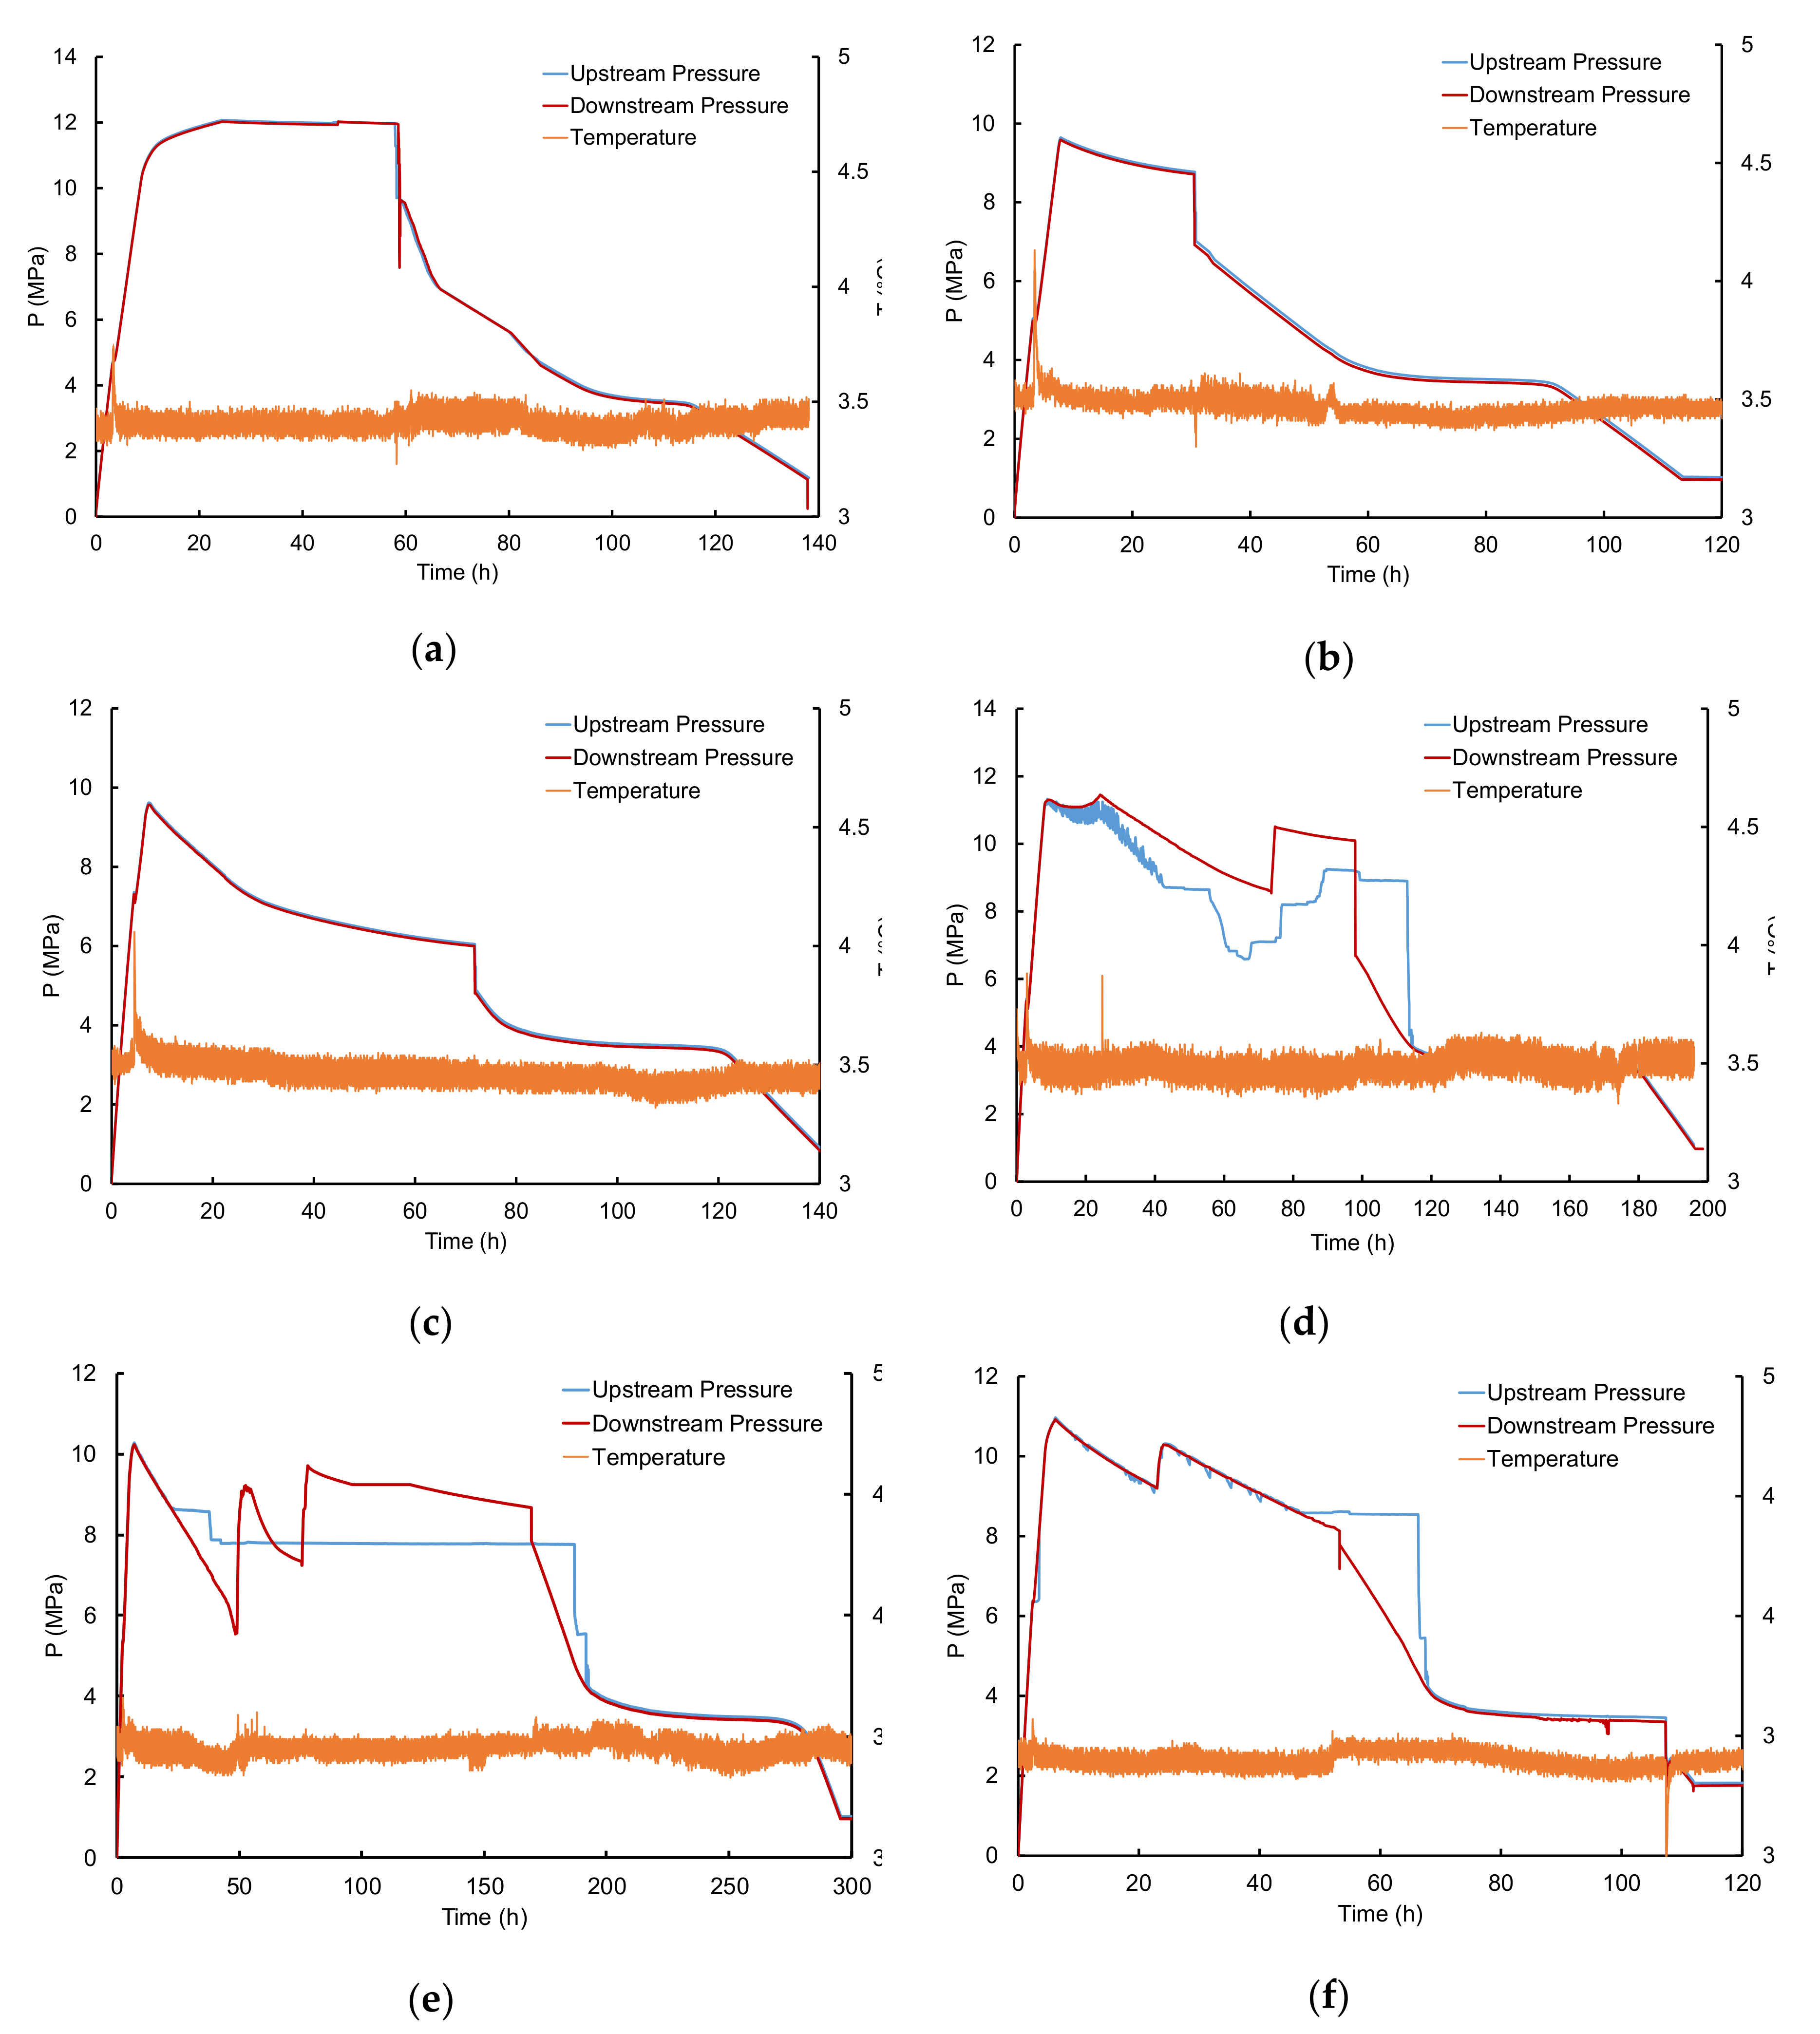
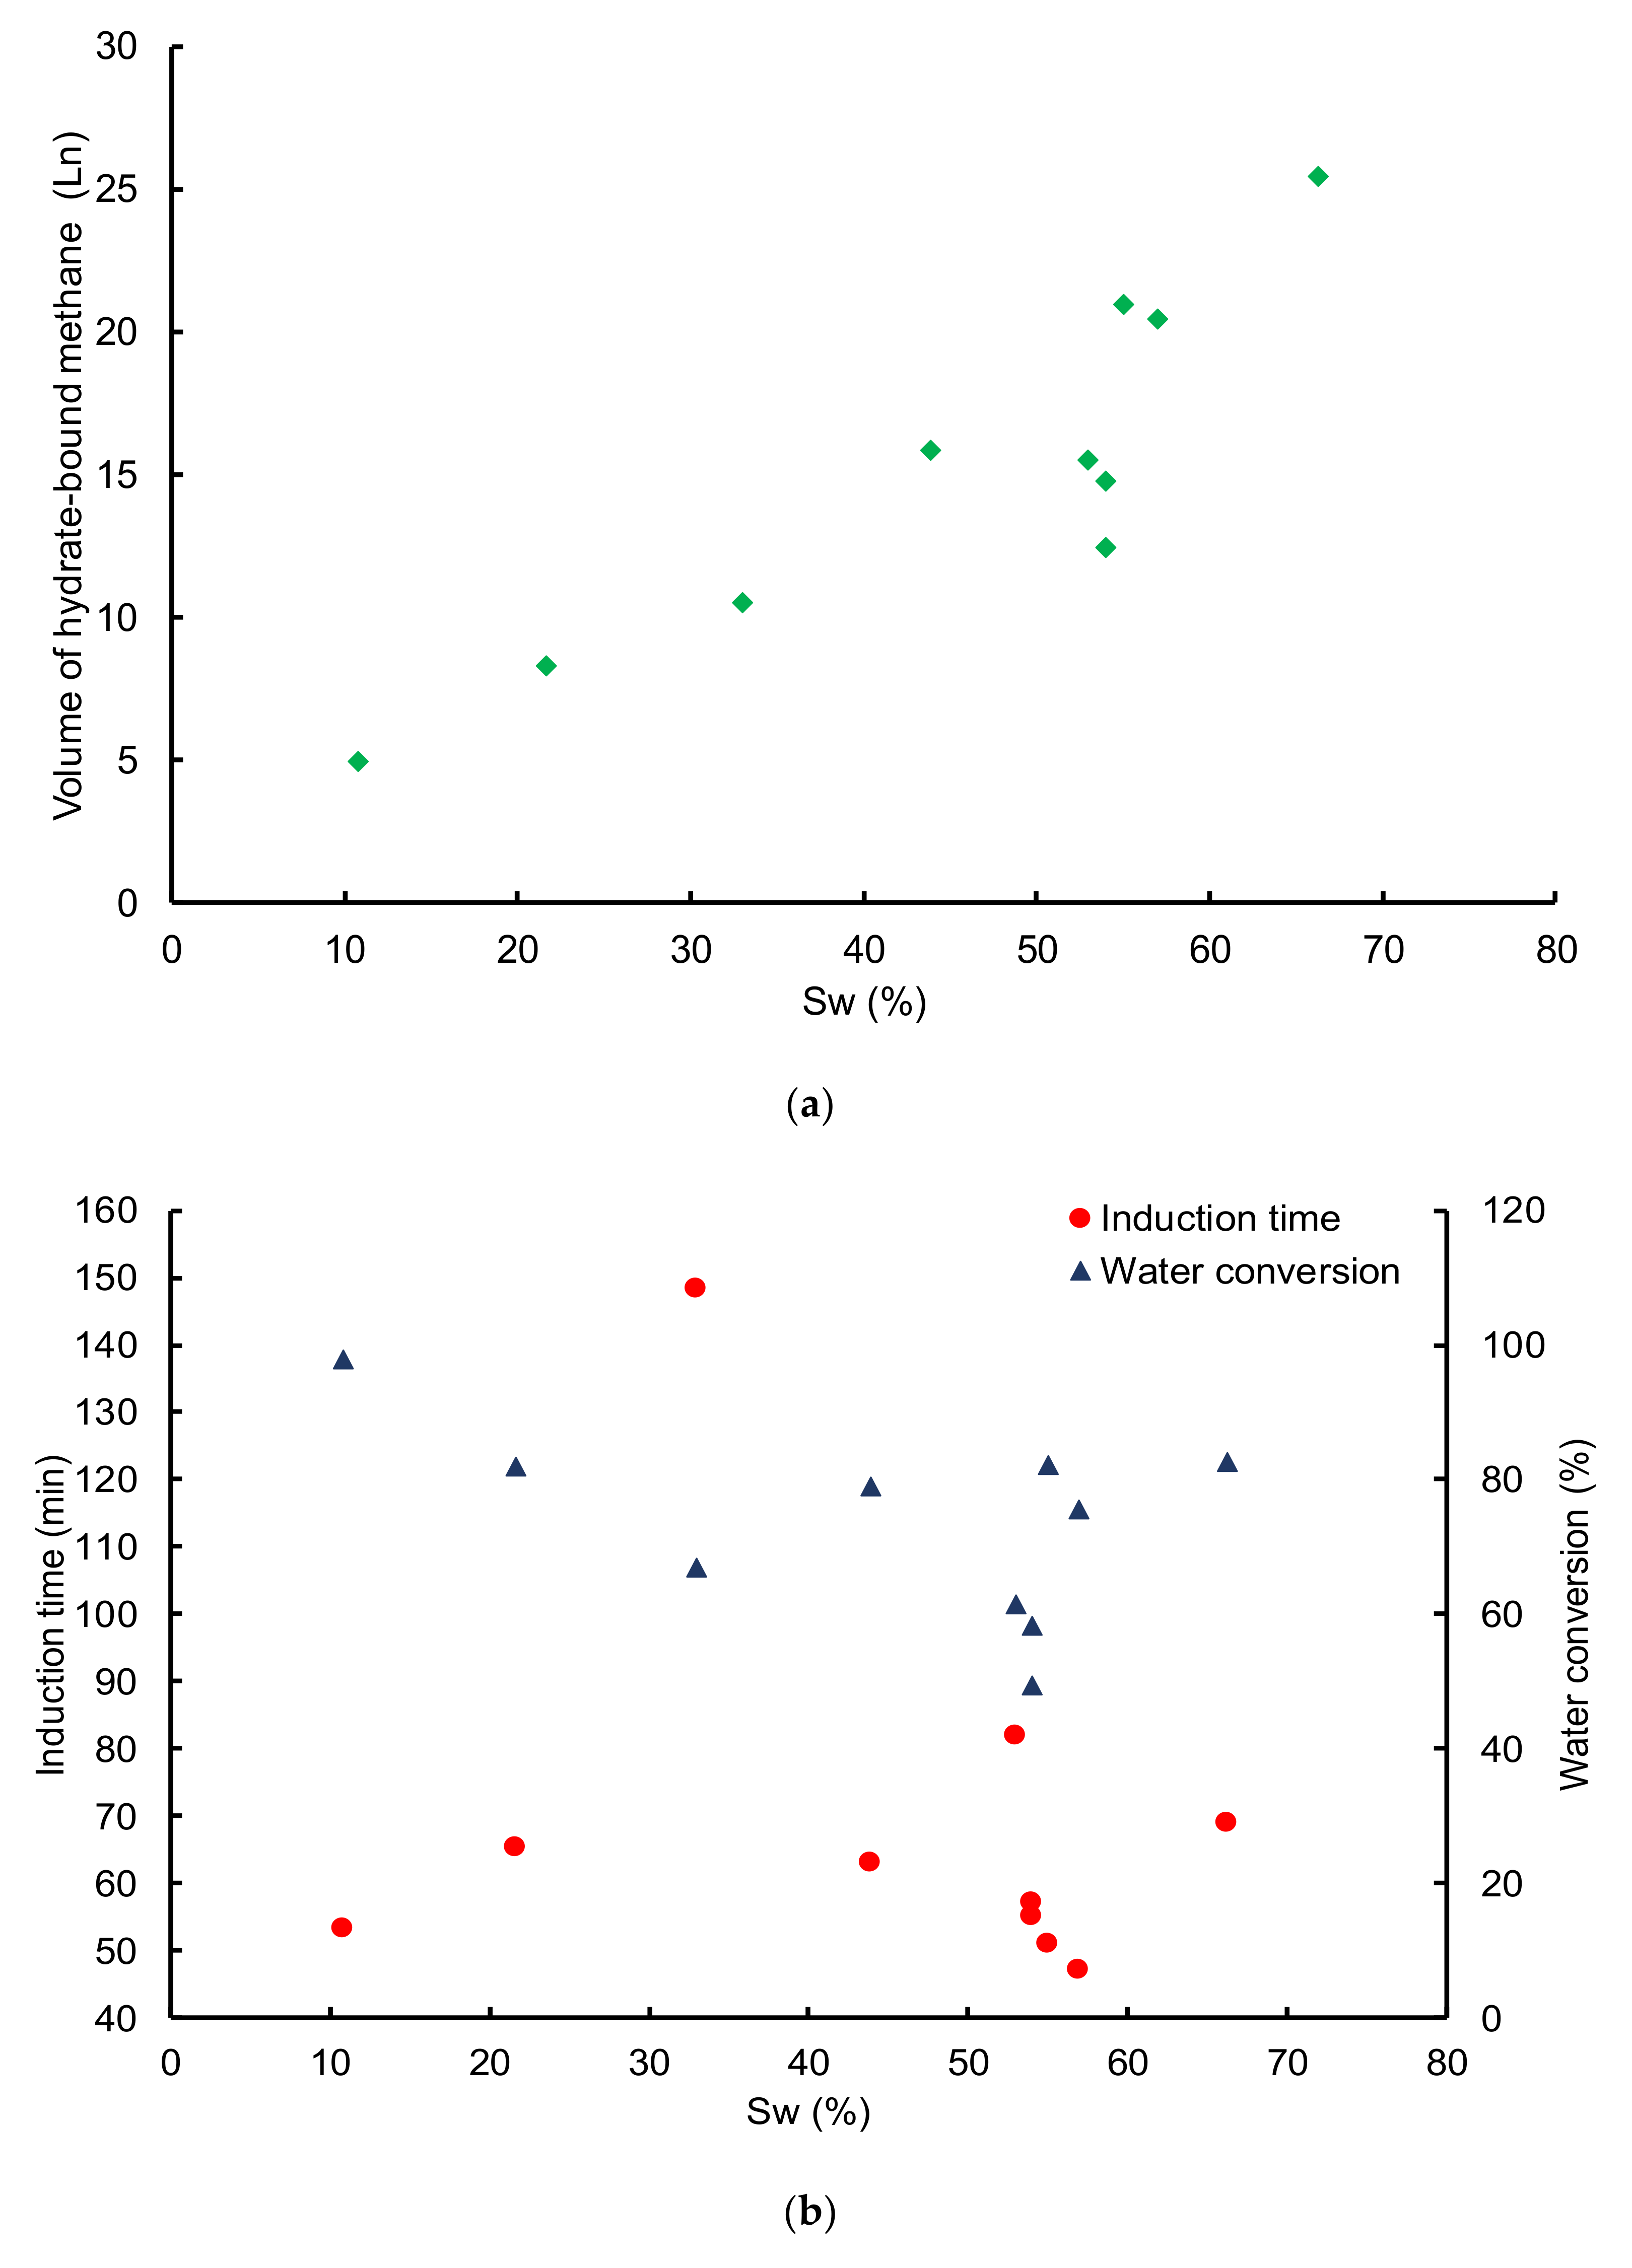
3.2.2. Influence of Water Saturation
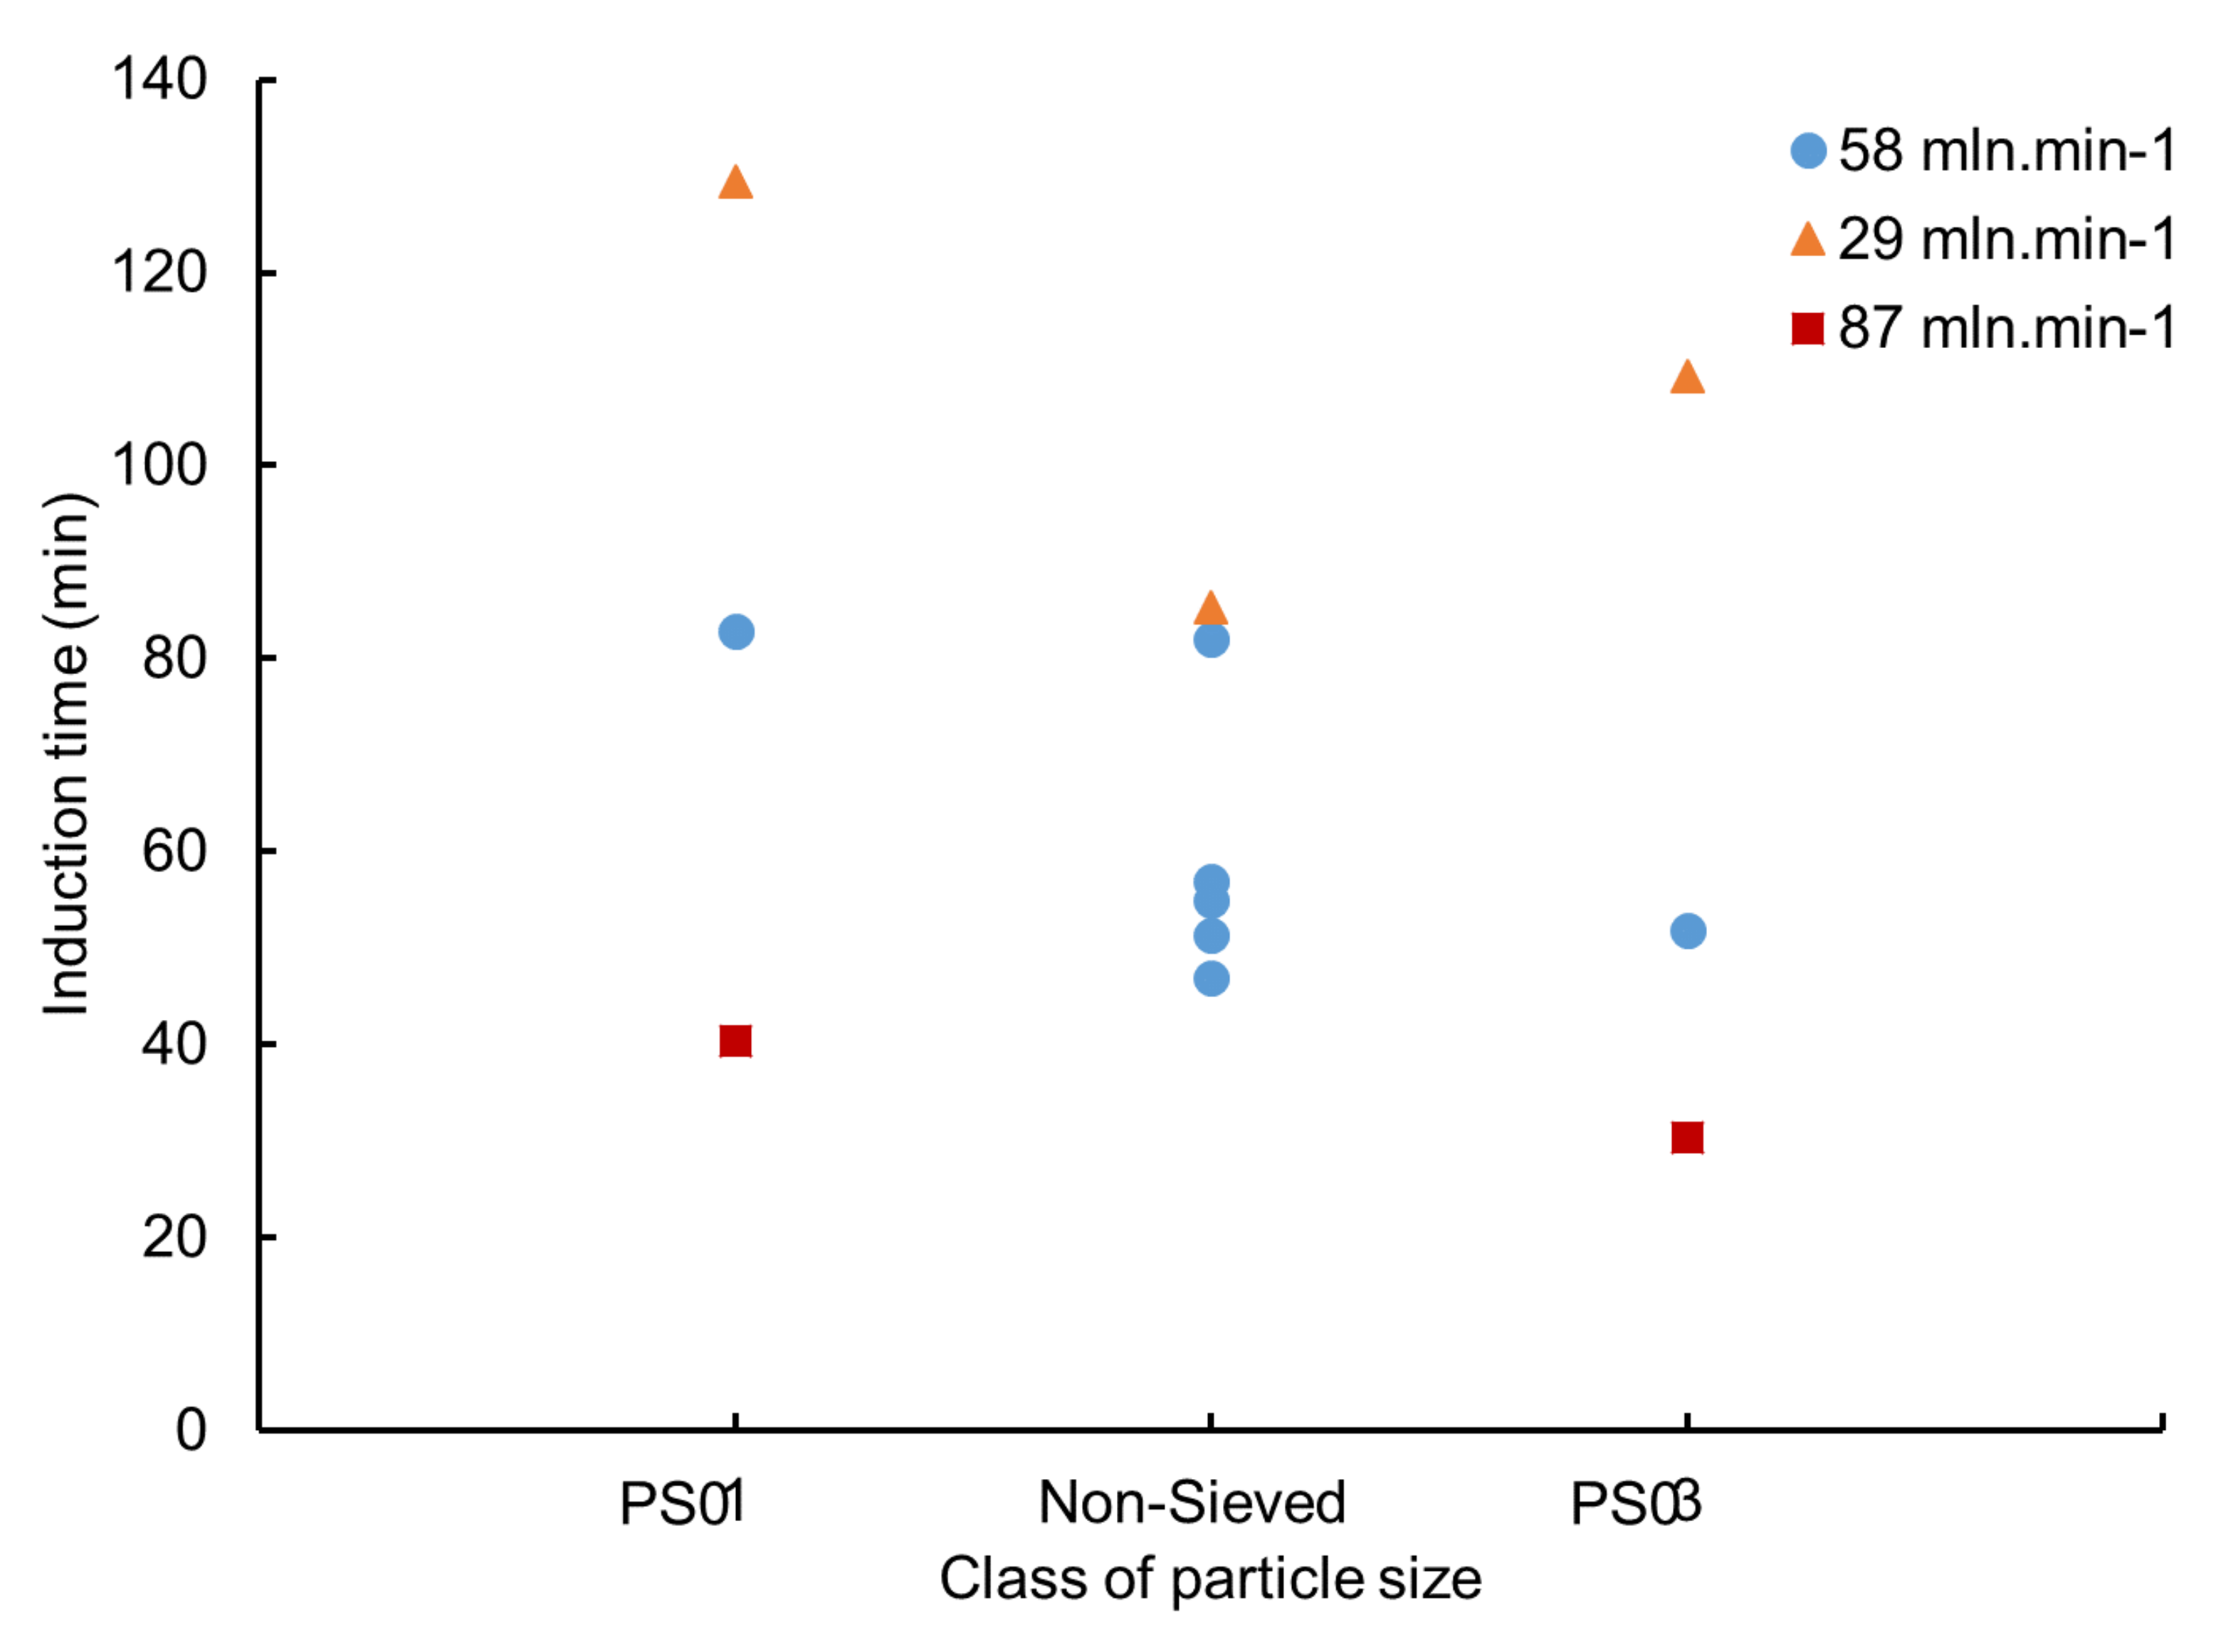
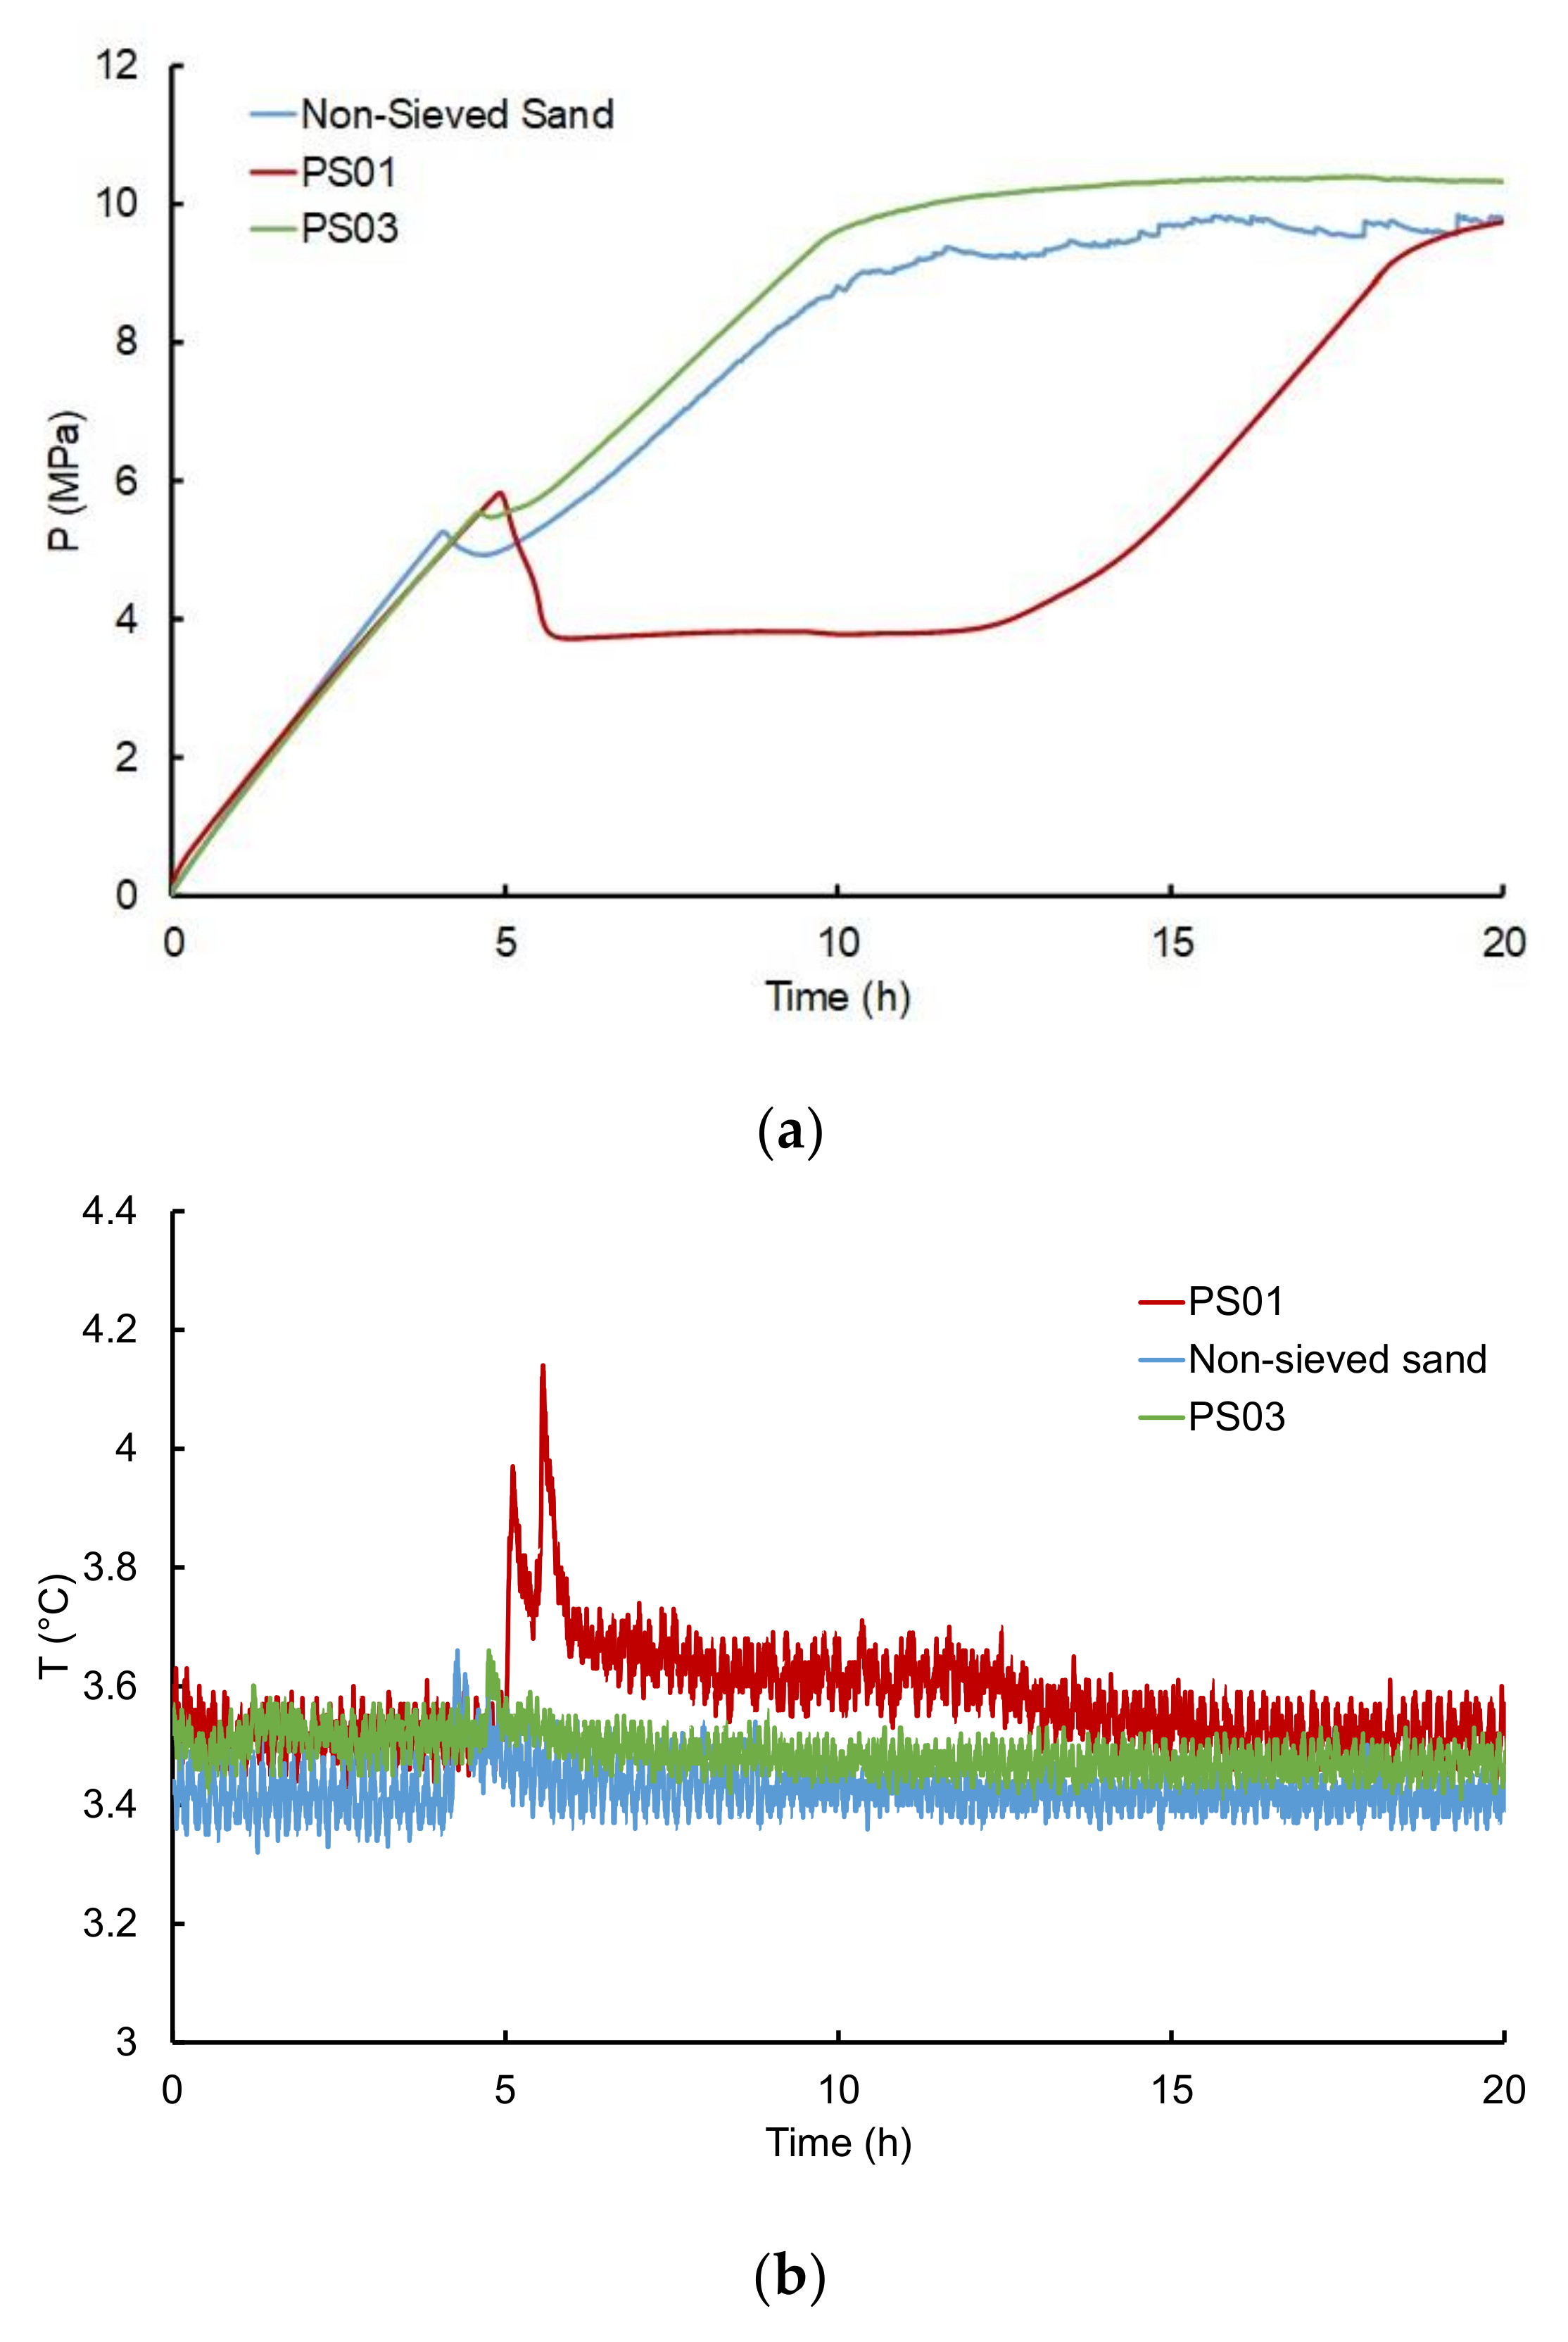
3.2.3. Influence of Particle Size
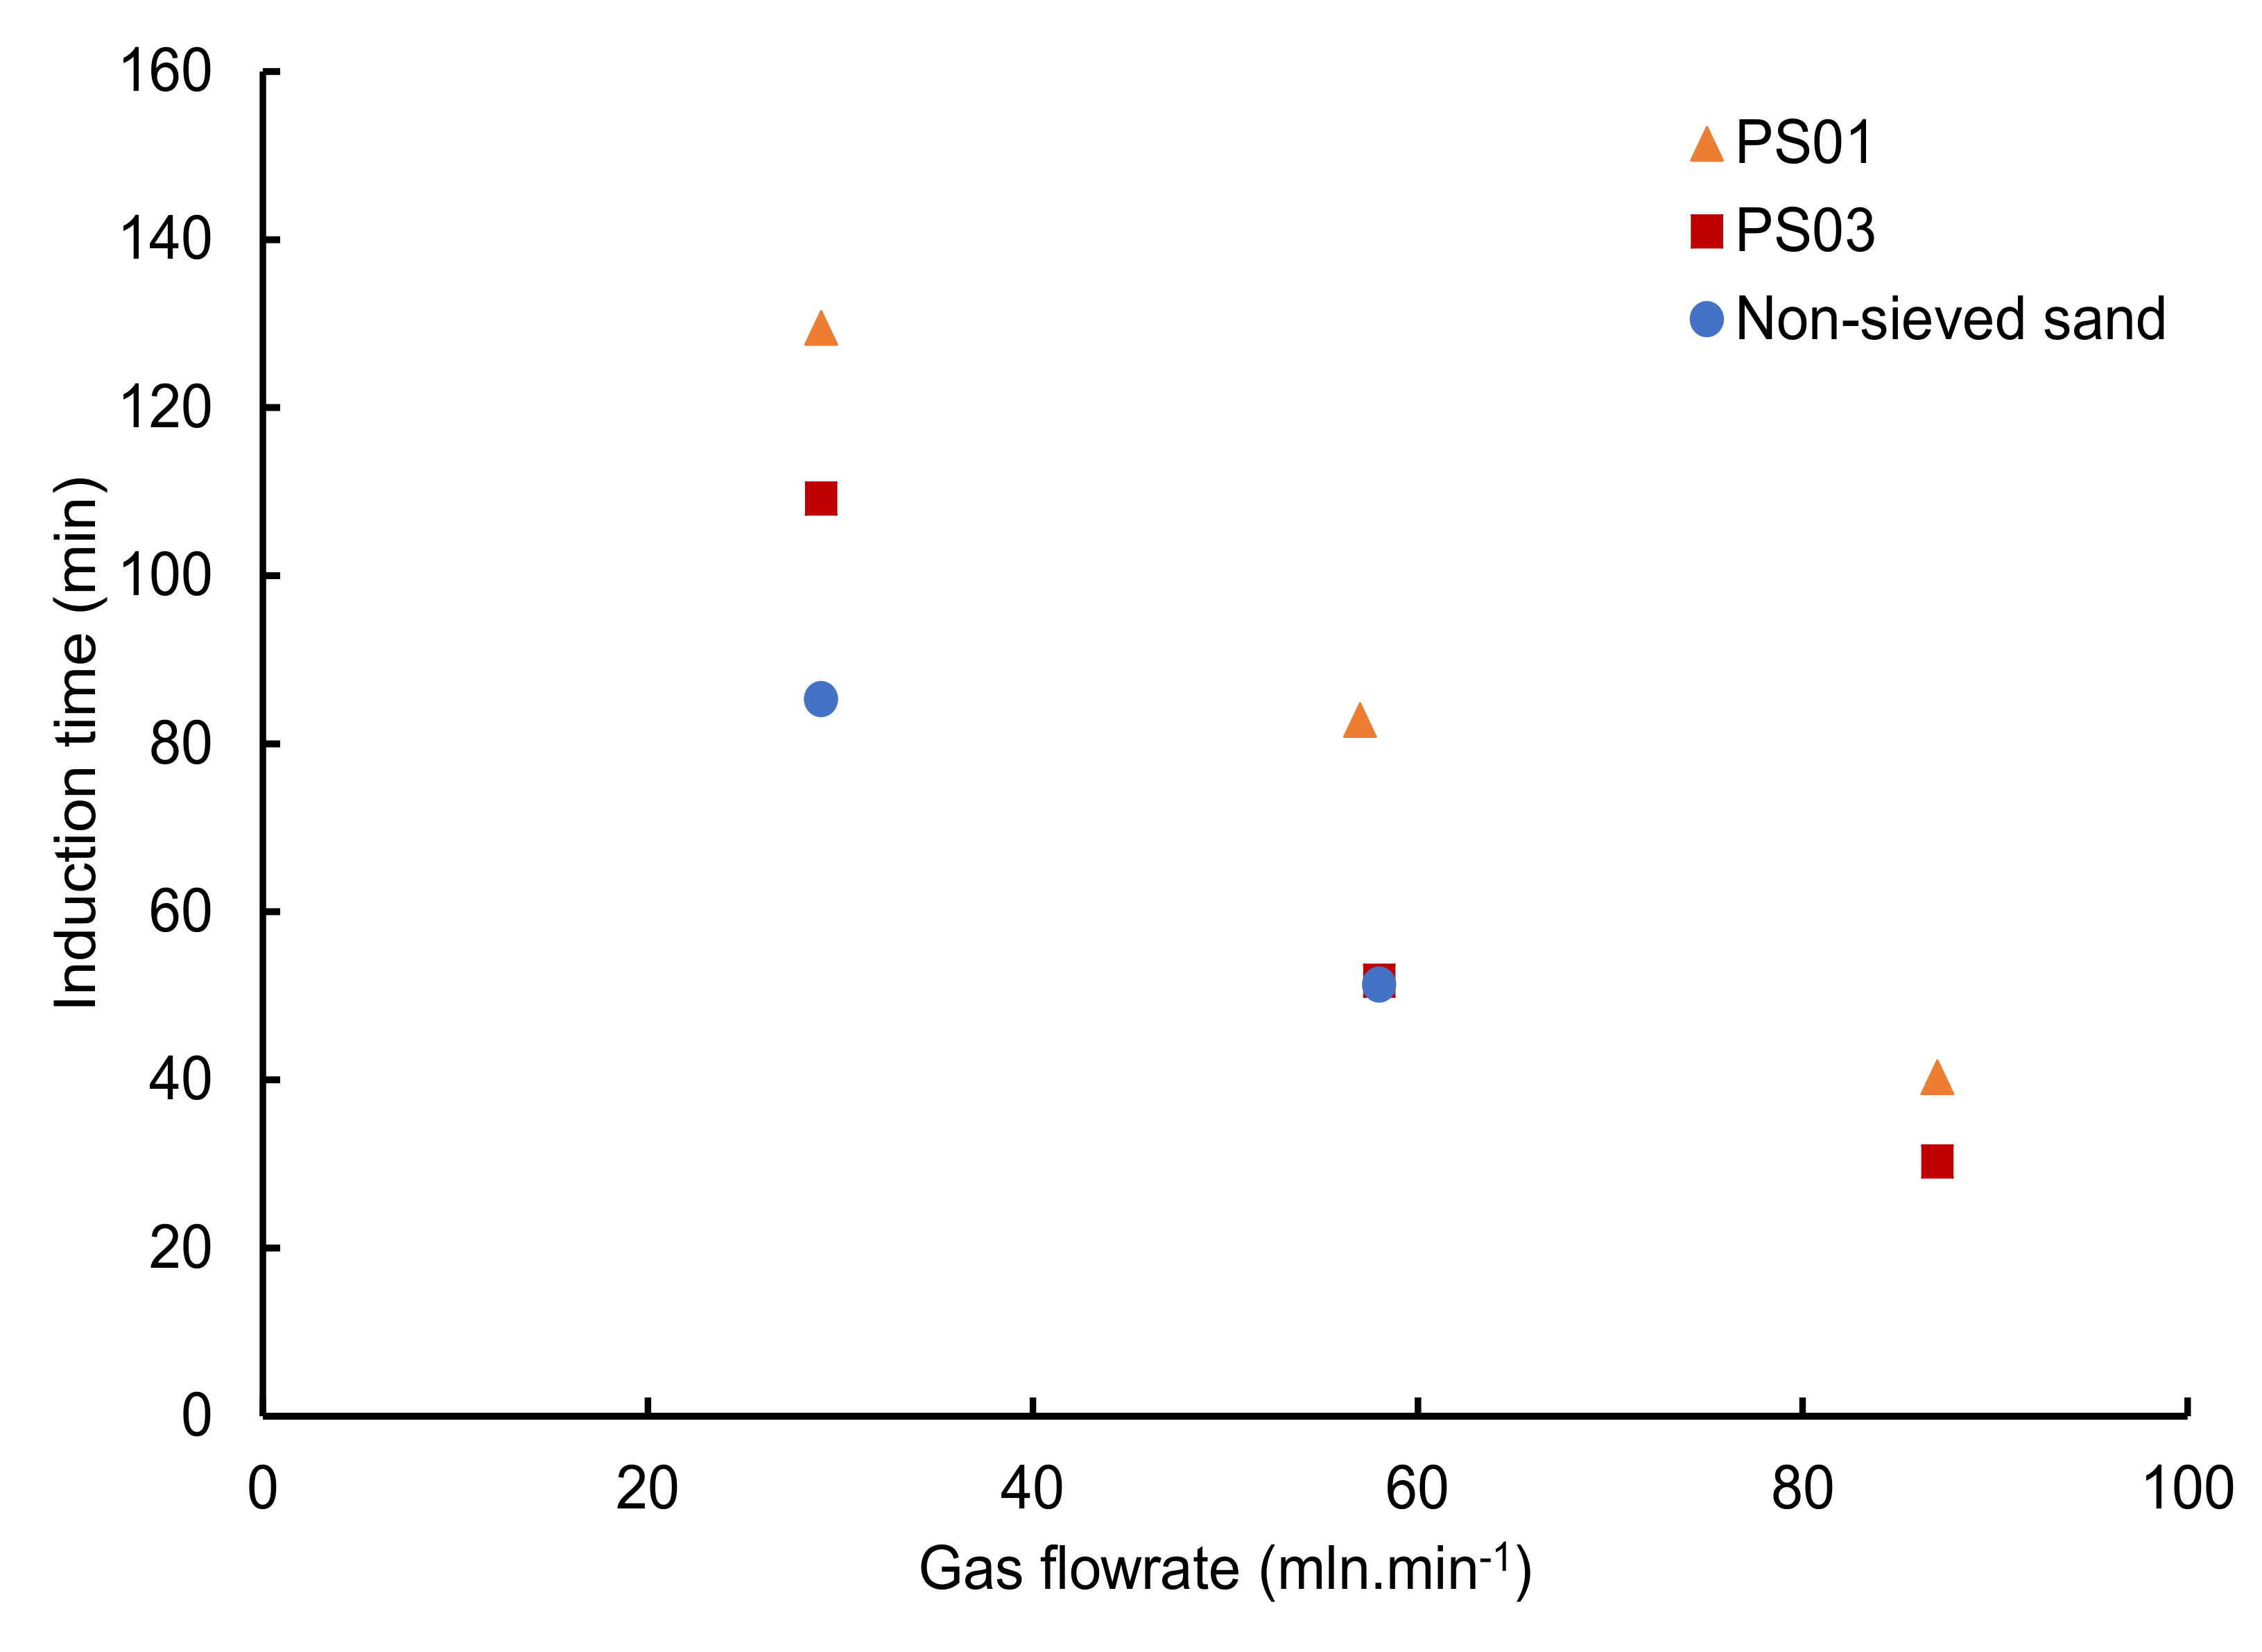
3.2.4. Influence of the Gas Flowrate
3.3. Influence of the Water Conversion, Gas Injection Flowrate and Particle Size on the Storage Capacity
4. Conclusions
Supplementary Materials
Author Contributions
Funding
Acknowledgments
Conflicts of Interest
References
- Sloan, E.D., Jr. Fundamental principles and applications of natural gas hydrates. Nature 2003, 426, 353–359. [Google Scholar] [CrossRef] [PubMed]
- Loveday, J.S.; Nelmes, R.J. High-pressure gas hydrates. Phys. Chem. Chem. Phys. 2008, 10, 937–950. [Google Scholar] [CrossRef] [PubMed]
- Broseta, D.; Ruffine, L.; Desmedt, A. Gas Hydrates 1: Fundamentals, Characterization and Modeling, 1st ed.; John Wiley & Sons: Hoboken, NJ, USA, 2017; p. 302. [Google Scholar]
- Kvenvolden, K.A. Methane hydrate—A major reservoir of carbon in the shallow geosphere? Chem. Geol. 1988, 71, 41–51. [Google Scholar] [CrossRef]
- Ruffine, L.; Broseta, D.; Desmedt, A. Gas Hydrates 2: Geoscience Issues and Potential Industrial Applications; John Wiley & Sons: Hoboken, NJ, USA, 2018. [Google Scholar]
- Matveeva, T.; Mazurenko, L.L.; Soloviev, V.A.; Klerkx, J.; Kaulio, V.V.; Prasolov, E.M. Gas hydrate accumulation in the subsurface sediments of Lake Baikal (Eastern Siberia). Geo Mar. Lett. 2003, 23, 289–299. [Google Scholar] [CrossRef]
- Ruppel, C.D. Gas Hydrate in Nature; US Geological Survey: Reston, VA, USA, 2018. [Google Scholar]
- Dillon, W.P.; Max, M.D. Oceanic Gas Hydrate. In Natural Gas Hydrate in Oceanic and Permafrost Environments; Max, M.D., Ed.; Springer: Berlin/Heidelberg, Germany, 2003; pp. 61–76. [Google Scholar]
- Paull, C.K.; Dillon, W.P. (Eds.) Natural Gas Hydrates: Occurrence, Distribution, and Detection; Geophysical Monograph Series; American Geophysical Union: Washington DC, USA, 2001; Volume 124. [Google Scholar]
- Claypool, G.E.; Kaplan, I.R. The Origin and Distribution of Methane in Marine Sediments. In Natural Gases in Marine Sediments; Kaplan, I.R., Ed.; Springer: Berlin/Heidelberg, Germany, 1974; pp. 99–139. [Google Scholar]
- Alexei, V.M. Molecular and stable isotope compositions of natural gas hydrates: A revised global dataset and basic interpretations in the context of geological settings. Org. Geochem. 2005, 36, 681–702. [Google Scholar]
- Wallmann, K.; Pinero, E.; Burwicz, E.; Haeckel, M.; Hensen, C.; Dale, A.W.; Ruepke, L. The Global Inventory of Methane Hydrate in Marine Sediments: A Theoretical Approach. Energies 2012, 5, 2449–2498. [Google Scholar] [CrossRef]
- Pinero, E.; Marquardt, M.; Hensen, C.; Haeckel, M.; Wallmann, K. Estimation of the global inventory of methane hydrates in marine sediments using transfer functions. Biogeosciences 2013, 10, 959–975. [Google Scholar] [CrossRef]
- Ruppel, C.; Kessler, J.D. The interaction of climate change and methane hydrates. Rev. Geophys. 2017, 55, 126–168. [Google Scholar] [CrossRef]
- Alexei, V.M. Global estimates of hydrate-bound gas in marine sediments: How much is really out there? Earth Sci. Rev. 2004, 66, 183–197. [Google Scholar]
- Boswell, R.; Collett, T.S. Current perspectives on gas hydrate resources. Energy Environ. Sci. 2011, 4, 1206–1215. [Google Scholar] [CrossRef]
- Collett, T.; Johnson, A.; Knapp, C.; Boswell, R. Natural Gas Hydrates—Energy Resource Potential and Associated Geologic Hazards; AAPG Memoir, 89; American Association of Petroleum Geologists: Tulsa, OK, USA; Department of Energy, National Energy Technology Laboratory: Albany, OR, USA; AAPG Foundation: Tulsa, OK, USA; AAPG Energy Minerals Division: Tulsa, OK, USA, 2010. [Google Scholar]
- Makogon, Y.; Holditch, S.; Makogon, T. Natural gas-hydrates—A potential energy source for the 21st Century. J. Pet. Sci. Eng. 2007, 56, 14–31. [Google Scholar] [CrossRef]
- Max, M.D.; Johnson, A.H.; Dillon, W.P. Economic Geology of Natural Gas Hydrate; Springer: Dordrecht, The Netherlands, 2006. [Google Scholar]
- Collett, T.S.; Boswell, R.; Cochran, J.R.; Kumar, P.; Lall, M.; Mazumdar, A.; Ramana, M.V.; Ramprasad, T.; Riedel, M.; Sain, K.; et al. Geologic implications of gas hydrates in the offshore of India: Results of the National Gas Hydrate Program Expedition 01. Mar. Pet. Geol. 2014, 58, 3–28. [Google Scholar] [CrossRef]
- Konno, Y.; Fujii, T.; Sato, A.; Akamine, K.; Naiki, M.; Masuda, Y.; Yamamoto, K.; Nagao, J. Key Findings of the World’s First Offshore Methane Hydrate Production Test off the Coast of Japan: Toward Future Commercial Production. Energy Fuels 2017, 31, 2607–2616. [Google Scholar] [CrossRef]
- Zhang, W.; Liang, J.; Wei, J.; Lu, J.; Su, P.; Lin, L.; Huang, W.; Guo, Y.; Deng, W.; Yang, X.; et al. Geological and geophysical features of and controls on occurrence and accumulation of gas hydrates in the first offshore gas-hydrate production test region in the Shenhu area, Northern South China Sea. Mar. Pet. Geol. 2020, 114, 104191. [Google Scholar] [CrossRef]
- Minshull, T.A.; Westbrook, G.K.; Weitemeyer, K.A.; Sinha, M.C.; Goswami, B.K.; Marsset, B. Leaking methane reservoirs offshore Svalbard. Eos Trans. Am. Geophys. Union 2012, 93, 413–414. [Google Scholar] [CrossRef]
- Liu, L.; Ryu, B.; Sun, Z.; Wu, N.; Cao, H.; Geng, W.; Zhang, X.; Jia, Y.; Xu, C.; Guo, L.; et al. Monitoring and research on environmental impacts related to marine natural gas hydrates: Review and future perspective. J. Nat. Gas Sci. Eng. 2019, 65, 82–107. [Google Scholar] [CrossRef]
- Kvenvolden, K.A. Gas hydrates-geological perspective and global change. Rev. Geophys. 1993, 31, 173–187. [Google Scholar] [CrossRef]
- Waite, W.F.; Santamarina, J.C.; Cortes, D.D.; Dugan, B.; Espinoza, D.N.; Germaine, J.; Jang, J.; Jung, J.W.; Kneafsey, T.J.; Shin, H.; et al. Physical properties of hydrate-bearing sediments. Rev. Geophys. 2009, 47. [Google Scholar] [CrossRef]
- Maslin, M.; Owen, M.J.; Betts, R.; Day, S.; Jones, T.D.; Ridgwell, A. Gas hydrates: Past and future geohazard? Philos. Trans. R. Soc. A 2010, 368, 2369–2393. [Google Scholar] [CrossRef] [PubMed]
- Sultan, N.; Ruffine, L.; Garziglia, S.; Ker, S.; Vanneste, M.; Humphrey, G.D. Seabed Gas Hydrates. In Encyclopedia of Maritime and Offshore Engineering; John Wiley & Sons: Hoboken, NJ, USA, 2018; pp. 1–12. [Google Scholar]
- Yelisetti, S.; Spence, G.D.; Riedel, M. Role of gas hydrates in slope failure on frontal ridge of northern Cascadia margin. Geophys. J. Int. 2014, 199, 441–458. [Google Scholar] [CrossRef]
- Carroll, J.J. Natural Gas Hydrates; A Guide for Engineers; Gulf Professional Publishing: Houston, TX, USA, 2009; p. 248. [Google Scholar]
- Marinhas, S.; Delahaye, A.; Fournaison, L.; Dalmazzone, D.; Fürst, W.; Petitet, J.P. Modelling of the available latent heat of a CO2 hydrate slurry in an experimental loop applied to secondary refrigeration. Chem. Eng. Process. Process. Intensif. 2006, 45, 184–192. [Google Scholar] [CrossRef]
- Li, G.; Hwang, Y.; Radermacher, R. Review of cold storage materials for air conditioning application. Int. J. Refrig. 2012, 35, 2053–2077. [Google Scholar] [CrossRef]
- Wang, X.; Dennis, M.; Hou, L. Clathrate hydrate technology for cold storage in air conditioning systems. Renew. Sustain. Energy Rev. 2014, 36, 34–51. [Google Scholar] [CrossRef]
- Cheng, C.; Wang, F.; Tian, Y.; Wu, X.; Zheng, J.; Zhang, J.; Li, L.; Yang, P.; Zhao, J. Review and prospects of hydrate cold storage technology. Renew. Sustain. Energy Rev. 2020, 117, 109492. [Google Scholar] [CrossRef]
- Linga, P.; Daraboina, N.; Ripmeester, J.; Englezos, P. Enhanced rate of gas hydrate formation in a fixed bed column filled with sand compared to a stirred vessel. Chem. Eng. Sci. 2012, 68, 617–623. [Google Scholar] [CrossRef]
- Liu, H.; Zhan, S.; Guo, P.; Fan, S.; Zhang, S. Understanding the characteristic of methane hydrate equilibrium in materials and its potential application. Chem. Eng. J. 2018, 349, 775–781. [Google Scholar] [CrossRef]
- Liu, Z.; Pan, Z.; Zhang, Z.; Liu, P.; Shang, L.; Li, B. Effect of Porous Media and Sodium Dodecyl Sulphate Complex System on Methane Hydrate Formation. Energy Fuels 2018, 32, 5736–5749. [Google Scholar] [CrossRef]
- Wang, J.; Zhao, J.; Zhang, Y.; Wang, D.; Li, Y.; Song, Y. Analysis of the effect of particle size on permeability in hydrate-bearing porous media using pore network models combined with CT. Fuel 2016, 163, 34–40. [Google Scholar] [CrossRef]
- Lu, H.; Kawasaki, T.; Ukita, T.; Moudrakovski, I.; Fujii, T.; Noguchi, S.; Shimada, T.; Nakamizu, M.; Ripmeester, J.; Ratcliffe, C. Particle size effect on the saturation of methane hydrate in sediments—Constrained from experimental results. Mar. Pet. Geol. 2011, 28, 1801–1805. [Google Scholar] [CrossRef]
- Ge, B.B.; Zhong, D.L.; Lu, Y. Influence of water saturation and particle size on methane hydrate formation and dissociation in a fixed bed of silica sand. Energy Procedia 2019, 158, 5402–5407. [Google Scholar] [CrossRef]
- Heeschen, K.U.; Schicks, J.M.; Oeltzschner, G. The promoting effect of natural sand on methane hydrate formation: Grain sizes and mineral composition. Fuel 2016, 181, 139–147. [Google Scholar] [CrossRef]
- Prasad, P.S.; Chari, V.D.; Sharma, D.V.; Murthy, S.R. Effect of silica particles on the stability of methane hydrates. Fluid Phase Equilibria 2012, 318, 110–114. [Google Scholar] [CrossRef]
- Bagherzadeh, S.A.; Moudrakovski, I.; Ripmeester, J.A.; Englezos, P. Magnetic Resonance Imaging of Gas Hydrate Formation in a Bed of Silica Sand Particles. Energy Fuels 2011, 25, 3083–3092. [Google Scholar] [CrossRef]
- Kumar, A.; Sakpal, T.; Roy, S.; Kumar, R. Methane hydrate formation in a test sediment of sand and clay at various levels of water saturation. Can. J. Chem. 2015, 93, 874–881. [Google Scholar] [CrossRef]
- Ruffine, L. Exploring methane-hydrate formation and dissociation in geologic materials through laboratory experiments: Kinetic behavior and morphology. Fuel 2015, 141, 173–184. [Google Scholar] [CrossRef]
- Circone, S.; Kirby, S.H.; Stern, L.A. Direct Measurement of Methane Hydrate Composition along the Hydrate Equilibrium Boundary. J. Phys. Chem. B 2005, 109, 9468–9475. [Google Scholar] [CrossRef]
- Glew, D.N. Aqueous solubility and the gas-hydrates. The methane-water system1. J. Phys. Chem. 1962, 66, 605–609. [Google Scholar] [CrossRef]
- Wang, P.; Wang, S.; Song, Y.; Yang, M. Dynamic measurements of methane hydrate formation/dissociation in different gas flow direction. Appl. Energy 2018, 227, 703–709. [Google Scholar] [CrossRef]
- Song, Y.; Wang, P.; Jiang, L.; Zhao, Y.; Yang, M. Methane hydrate formation/reformation in three experimental modes: A preliminary investigation of blockage prevention during exploitation. J. Nat. Gas Sci. Eng. 2015, 27, 1814–1820. [Google Scholar] [CrossRef]
- Hazen, A. Some Physical Properties of Sand and Gravel, with Special Reference to Their Use in Filtration; 24th Annual Report; State Board of Health: Boston, MA, USA, 1892; pp. 539–556. [Google Scholar]
- Ren, X.; Santamarina, J. The hydraulic conductivity of sediments: A pore size perspective. Eng. Geol. 2018, 233, 48–54. [Google Scholar] [CrossRef]
- Rosas, J.; Lopez, O.; Missimer, T.M.; Coulibaly, K.; Dehwah, A.H.; Sesler, K.; Lujan, L.; Mantilla, D. Determination of hydraulic conductivity from grain-size distribution for different depositional environments. Groundwater 2014, 52, 399–413. [Google Scholar] [CrossRef] [PubMed]
- Santamarina, J.C.; Klein, K.A.; Wang, Y.H.; Prencke, E. Specific surface: Determination and relevance. Can. Geotech. J. 2002, 39, 233–241. [Google Scholar] [CrossRef]
- Taylor, D.W. Fundamentals of Soil Mechanics. Soil Sci. 1948, 66, 161. [Google Scholar] [CrossRef]
- Ripmeester, J.; Alavi, S. Some current challenges in clathrate hydrate science: Nucleation, decomposition and the memory effect. Curr. Opin. Solid State Mater. Sci. 2016, 20, 344–351. [Google Scholar] [CrossRef]
- Veluswamy, H.P.; Kumar, S.; Kumar, R.; Rangsunvigit, P.; Linga, P. Enhanced clathrate hydrate formation kinetics at near ambient temperatures and moderate pressures: Application to natural gas storage. Fuel 2016, 182, 907–919. [Google Scholar] [CrossRef]
- Fandiño, O.; Ruffine, L. Methane hydrate nucleation and growth from the bulk phase: Further insights into their mechanisms. Fuel 2014, 117, 442–449. [Google Scholar] [CrossRef][Green Version]
- Chen, X.; Espinoza, D.N. Surface area controls gas hydrate dissociation kinetics in porous media. Fuel 2018, 234, 358–363. [Google Scholar] [CrossRef]
- Hassanpouryouzband, A.; Joonaki, E.; Vasheghani Farahani, M.; Takeya, S.; Ruppel, C.; Yang, J.; English, N.J.; Schicks, J.M.; Edlmann, K.; Mehrabian, H.; et al. Gas hydrates in sustainable chemistry. Chem. Soc. Rev. 2020, 49, 5225–5309. [Google Scholar] [CrossRef]
- Wang, S.; Yang, M.; Liu, W.; Zhao, J.; Song, Y. Investigation on the induction time of methane hydrate formation in porous media under quiescent conditions. J. Pet. Sci. Eng. 2016, 145, 565–572. [Google Scholar] [CrossRef]

 ) high-pressure filter for gas-liquid separator, (
 ) high pressure 0.5 µm filter.
) high-pressure filter for gas-liquid separator, () high pressure 0.5 µm filter.
) high pressure 0.5 µm filter.
) high-pressure filter for gas-liquid separator, () high pressure 0.5 µm filter.


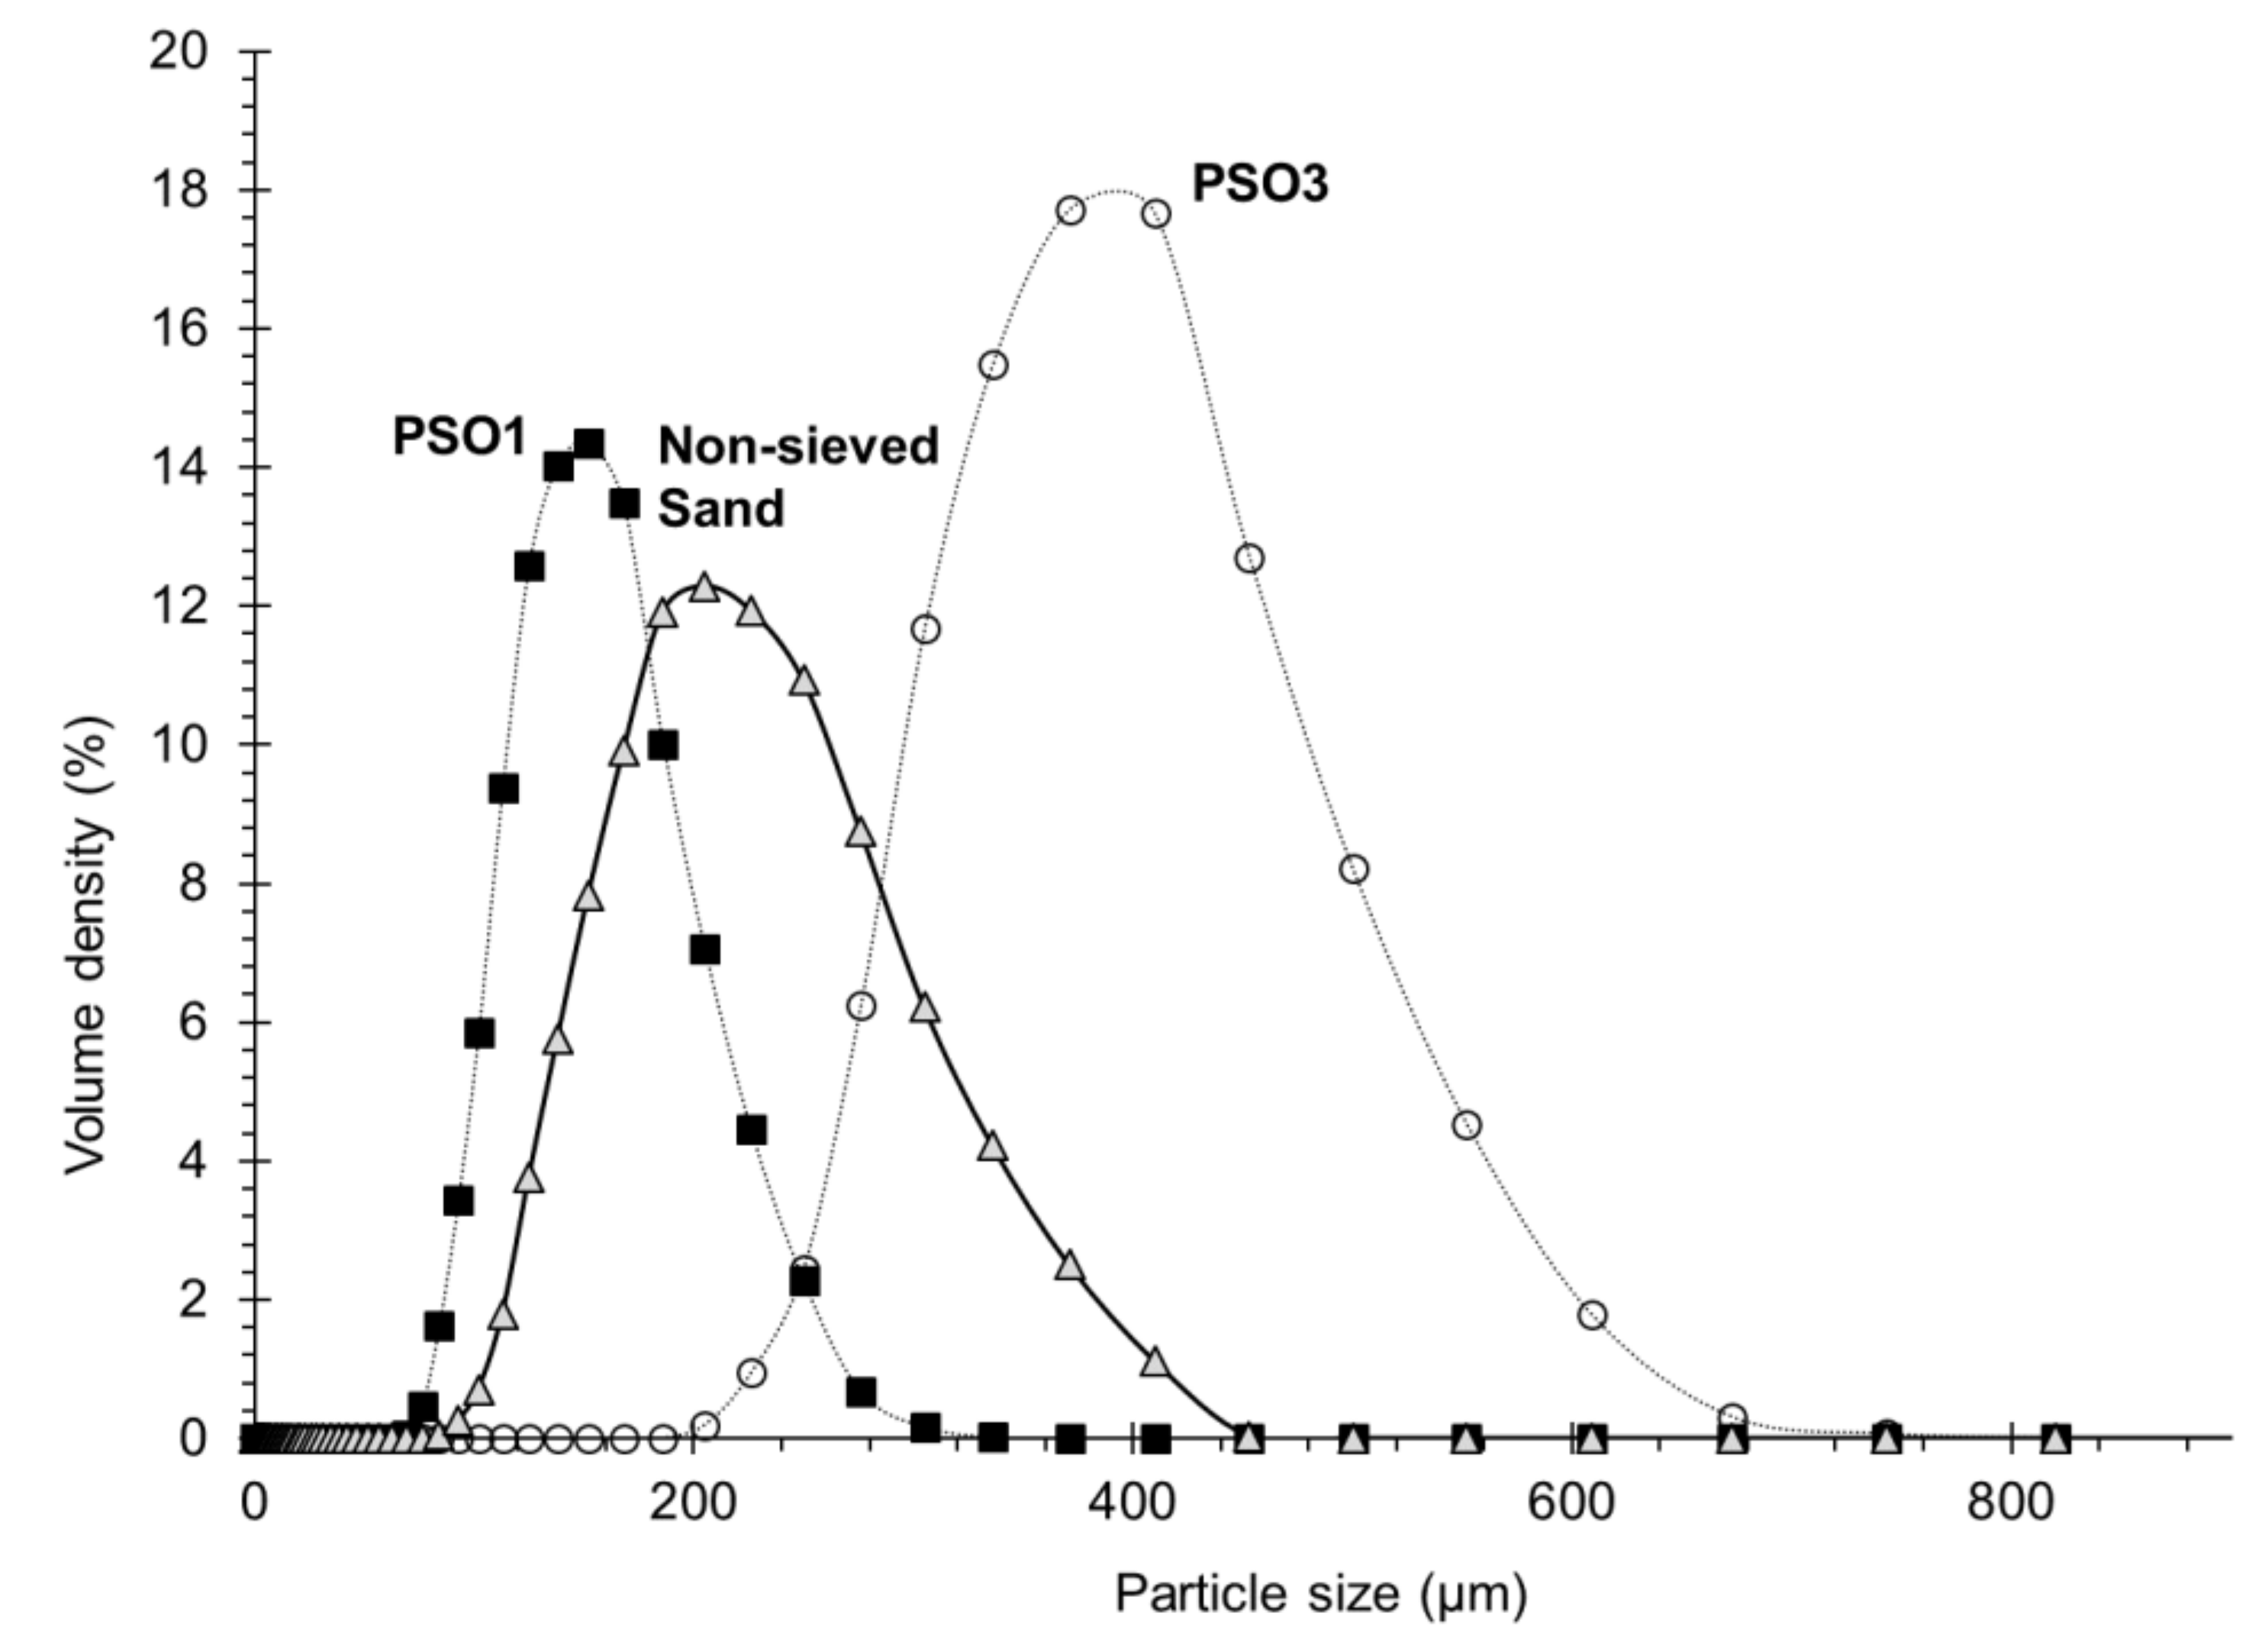
| Particle Class | Fontainebleau Sand | PS01 | PS03 |
|---|---|---|---|
| Particle size by sieving (µm) | 80–450 | 80–140 | 315–450 |
| Particle size by diffractometer analysis (µm) | 80–450 | 80–200 | 200–550 |
| Mass (g) | 100 | 5.8 | 4.2 |
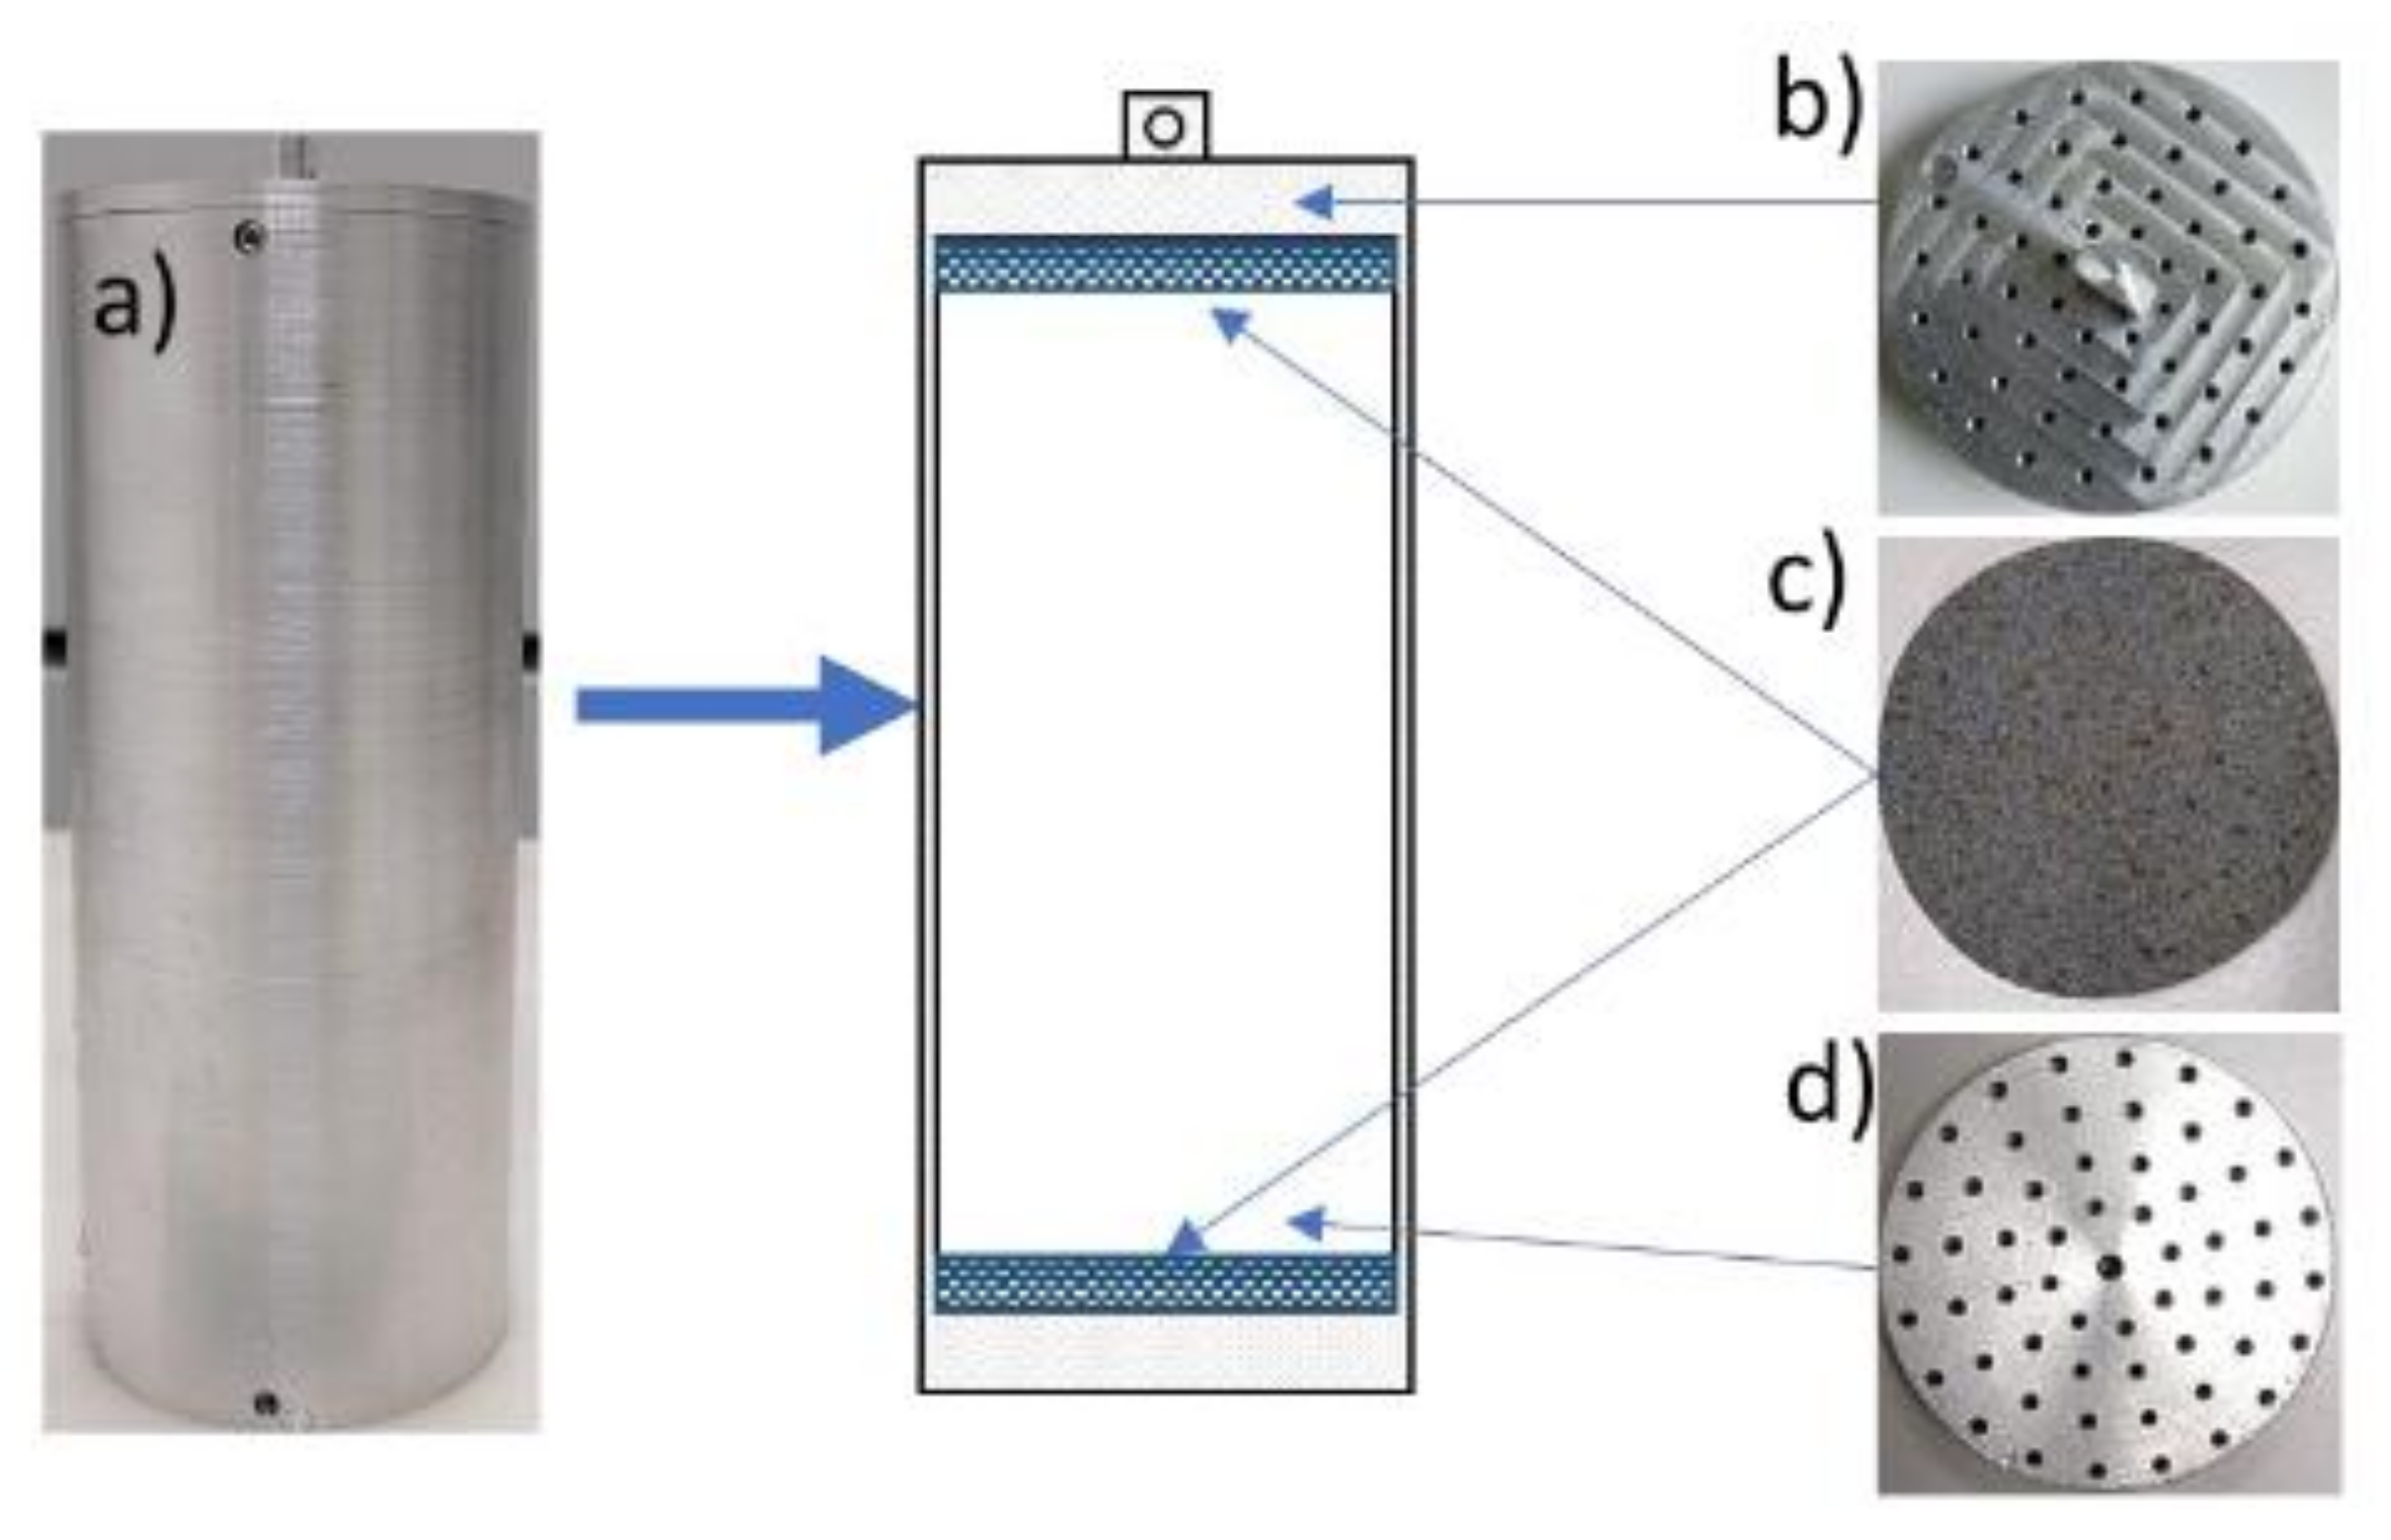
| Porous stone diameter (cm) | 5.54 ± 0.88 |
| Aluminum cell internal diameter (cm) | 5.6 ± 0.01 |
| Aluminum lids internal diameter (cm) | 0.57 ± 0.01 |
| Porous stone depth (cm) | 0.6 ± 0.2 |
| Aluminum cell height (cm) | 13.94 ± 0.01 |
| Aluminum lids height (cm) | 5.55 ± 0.01 |
| Sand density (g·cm−3) | 2.65 ± 0.01 |
| Porosity | 0.42 ± 7.103 |
| Run. | Water Volume (mL) | Water Saturation, Sw (%) | Gas Flowrate (mLn/min) | Particle Size (µm) | Induction Time (min) | Volume of Hydrate-Bound Methane (Ln) | Water Conversion (% vol) |
|---|---|---|---|---|---|---|---|
| 1 | 23.34 | 10.8 | 56.1 | 80–450 | 53 | 4.94 | 97.8 |
| 2 | 46.6 | 21.6 | 58.5 | 65 | 8.27 | 82.0 | |
| 3 | 72.4 | 33 | 58.4 | 148 | 10.50 | 67.0 | |
| 4 | 92.69 | 44 | 57.6 | 63 | 15.82 | 78.9 | |
| 5_1 * | 116.5 | 53 | 57.5 | 82 | 15.48 | 61.4 | |
| 5_2 * | 116.1 | 54 | 58.8 | 57 | 12.44 | 49.5 | |
| 5_3 * | 117.3 | 54 | 57.2 | 55 | 14.77 | 58.2 | |
| 5_4 * | 117.8 | 55 | 57.9 | 51 | 20.94 | 82.1 | |
| 5_5 * | 124.8 | 57 | 57.5 | 47 | 20.43 | 75.6 | |
| 6 | 144.9 | 66.3 | 58.2 | 69 | 25.43 | 82.7 |
| Gas Flowrate (mLn·min−1) | Water Volume (mL) | Water Saturation, Sw (%) | Particle Size Class (µm) | Induction Time (min) | Volume of Hydrate-Bound Methane (Ln) | Water Conversion (%) |
|---|---|---|---|---|---|---|
| 56.8 | 129.0 | 54.3 | PS01 | 83 | 23.91 | 86.0 |
| 57.9 | 117.8 | 55.0 | non-sieved sand | 51 | 20.94 | 82.1 |
| 58.0 | 117.2 | 54.6 | PS03 | 52 | 21.83 | 86.1 |
| 28.9 | 125.9 | 53.7 | PS01 | 129.5 | 22.74 | 83.5 |
| 29.0 | 115.7 | 54.2 | non-sieved sand | 85 | 21.59 | 84.0 |
| 28.8 | 111.3 | 50.9 | PS03 | 109 | 17.81 | 74.0 |
| 86.5 | 125.7 | 53.3 | PS01 | 40.3 | 17.05 | 62.7 |
| 87.6 | 115.9 | 53.9 | PS03 | 30.3 | 21.29 | 84.9 |
© 2020 by the authors. Licensee MDPI, Basel, Switzerland. This article is an open access article distributed under the terms and conditions of the Creative Commons Attribution (CC BY) license (http://creativecommons.org/licenses/by/4.0/).
Share and Cite
Benmesbah, F.D.; Ruffine, L.; Clain, P.; Osswald, V.; Fandino, O.; Fournaison, L.; Delahaye, A. Methane Hydrate Formation and Dissociation in Sand Media: Effect of Water Saturation, Gas Flowrate and Particle Size. Energies 2020, 13, 5200. https://doi.org/10.3390/en13195200
Benmesbah FD, Ruffine L, Clain P, Osswald V, Fandino O, Fournaison L, Delahaye A. Methane Hydrate Formation and Dissociation in Sand Media: Effect of Water Saturation, Gas Flowrate and Particle Size. Energies. 2020; 13(19):5200. https://doi.org/10.3390/en13195200
Chicago/Turabian StyleBenmesbah, Fatima Doria, Livio Ruffine, Pascal Clain, Véronique Osswald, Olivia Fandino, Laurence Fournaison, and Anthony Delahaye. 2020. "Methane Hydrate Formation and Dissociation in Sand Media: Effect of Water Saturation, Gas Flowrate and Particle Size" Energies 13, no. 19: 5200. https://doi.org/10.3390/en13195200
APA StyleBenmesbah, F. D., Ruffine, L., Clain, P., Osswald, V., Fandino, O., Fournaison, L., & Delahaye, A. (2020). Methane Hydrate Formation and Dissociation in Sand Media: Effect of Water Saturation, Gas Flowrate and Particle Size. Energies, 13(19), 5200. https://doi.org/10.3390/en13195200