Article

Experimental Research into the Evolution of Permeability of Sandstone under Triaxial Compression

1
College of Science, Qingdao University of Technology, Qingdao 266033, China
2
Cooperative Innovation Center of Engineering Construction and Safety in Shandong Blue Economic Zone, Qingdao University of Technology, Qingdao 266033, China
3
Fujian Research Center for Tunneling and Urban Underground Space Engineering, Huaqiao University, Xiamen 361021, China
*
Author to whom correspondence should be addressed.
Energies 2020, 13(19), 5065; https://doi.org/10.3390/en13195065
Submission received: 20 July 2020 / Revised: 15 September 2020 / Accepted: 24 September 2020 / Published: 27 September 2020

Abstract

:
Failure tests on sandstone specimens were conducted under different confining pressures and seepage pressures by using an MTS triaxial rock testing machine to elucidate the corresponding correlations of permeability and characteristic stress with confining pressure and pore pressure during deformation. The results indicate that permeability first decreases and presents two trends, i.e., a V-shaped increase and an S-shaped trend during the non-linear deformation stage. The greater the seepage pressure, the greater the initial permeability and the more obvious the V-shaped trend in the permeability. As the confining pressure was increased, the trend in the permeability gradually changed from V- to S-shaped. Compared with the case at a high confining pressure, the decrease of permeability occurred more quickly, the rate of change becomes greater, and the sudden increase observed in the permeability happened earlier under lower confining pressures. Within the range tested, confining pressure exerted a greater effect on the permeability than the seepage pressure. In comparison with the axial strain, volumetric strain better reflected changes in permeability during compaction and dilation of sandstone. The ratio of crack initiation stress to peak strength ranged from 0.37 to 0.50, while the ratio of dilation stress to peak strength changed from 0.58 to 0.72. Permeabilities calculated based on Darcy and non-Darcy flow changed within the same interval, while the change in permeability was different.

1. Introduction

Microcrack initiation, propagation, and coalescence in a rock mass under the coupled effects of seepage and stress caused by engineering excavation are key factors threatening the stability of such rock masses [1]. According to statistical evidence [2], 90% of the failures of rock slopes are related to groundwater seepage, and 60% of mine accidents are correlated with groundwater action. Previous research shows that these factors (including: rock type, microcrack development, pore connectivity, load regime (stress path), stress state, and porosity) can affect the permeability [3,4,5,6,7,8,9,10], while the specific influence and mechanism underpinning such behaviors remain unclear.
At present, in most seepage–stress coupling tests of a rock mass, the axial stress is increased under certain confining pressures and water pressures and changes of permeability during deformation are measured on the premise of Darcy flow. The research objects include coal and rock masses, sandstone, salt rock, granite, etc. Yu et al. [11] and Jiang et al. [12] considered that change of permeability are commonly determined by microfracture initiation and propagation in rock and crushing of skeleton particles therein. Wang et al. [4], Liu, et al. [5], Oda et al. [13], Mitchell et al. [14] analyzed changes to the permeability during crack propagation in granite, where seepage only occurs after the onset of cracking. Alkan [15] explored the corresponding relationship between change of permeability in salt rock and acoustic emission information, finding that the acoustic emission event concentration occurred in the area of variation of permeability. Nara et al. [16] investigated changes in wave velocity during permeability evolution in basalt. Moreover, Pereira et al. [17] researched the effect of fracture distribution on permeability. They all found that the permeability of intact rocks was very low and increased only when cracks appeared. Liu et al. [18] studied the correspondence between creep deformation of mudstone and pore pressure and found the permeability evolution could be determined by the microstructural evolution of rock. Li et al. [19] found that axial strain (in a rock specimen) has a functional relationship with permeability. Pradip et al. [20] and Legrand et al. [21] investigated the rate of convergence under stable seepage in crushed rock and pressure-drop data during seepage and used a capillary model to predict the experimental data expressed in terms of a pore friction factor. In the test results of rock failure under hydraulic coupling, there are few complete datasets relating to volumetric strain and circumferential strain and the correlations of coefficient of permeability with hydraulic gradient and volumetric strain remain unclear.
Many scholars [22,23,24,25] have found that factors influencing flow states of fluids in cracks are complicated and mainly include crack morphology, contact extent, roughness, opening, fluid viscosity, and applied pressure. If the crack is narrow, the pressure gradient and the flow obey a quasi-linear Darcy relationship. When the crack width and flow increase, the seepage is found to have non-Darcian characteristics. The tests suggest that, after reaching peak strength, crack propagation in rock accelerates, seepage channels in the rock become larger and the permeability increases abruptly. Therefore, seepage is unsteady, thus no longer conforms to Darcy’s law. Wen et al. [26] found that factor β (in models of non-Darcy flow) becomes negative after reaching the peak strength of limestone. Wu et al. [27] developed a method of simulation of non-Darcy seepage in porous rock and fractured rock masses. Furthermore, Zhou et al. [28] proposed a fractional derivative model of non-Darcy seepage in porous media. Chen et al. [29] constructed a relationship between fracture characteristics and coefficient of non-Darcy seepage of a rock mass and then compared the changes in parameters of non-Darcy seepage for five types of crushed rock masses. Qin et al. [30] found that broken sandstone with a lower porosity had more obvious non-Darcian properties than broken sandstones with the same particle size distribution. Zeng et al. [31] established a mathematical model to describe transient non-Darcy flow in hydraulic fractures, however, there has been no general understanding of Darcy flow in the current studies, as it is difficult to consider fully the factors influencing non-Darcy Flow.
There is no clear conclusion as to the relationship between permeability and deformation of rock under hydraulic coupling effects and Li et al. [19] classified the relationships between permeability and strain of 16 groups of sandstone into three types. Yu et al. [32] only obtained one type of relationship there between through test evidence, so further testing is needed to understand the relationship between them. The consensus conclusion is that the evolution of permeability is closely related to the microstructural evolution of rock, including the closure of pre-existing micro-cracks and the creation, propagation, and coalescence of micro-cracks; however, current test methods cannot directly demonstrate the entire process of crack propagation. Characteristic stress is a parameter that reflects the stress state in a rock mass and the characteristics of triaxial tensile and compressive strength thereof. It is directly related to each stage of crack development. The relationship between permeability and crack development can be reflected by characteristic stress. Based on seepage–stress coupling test of sandstone, in this manuscript we present the relationships among characteristic stress, strain, and permeability of sandstone during deformation and discuss differences in the permeability under Darcy and non-Darcy flow in sandstone. Some new ideas have been proposed in terms of the relationship between the permeability and volumetric strain, formation of local compression zones, and influences of volumetric strain on the permeability.

2. Test Materials and Equipment

An MTS electro-hydraulic servo triaxial rock testing machine was used in the test and the machining precision of the samples conformed to the test requirements of rock mechanics. Considering the complexity and inhomogeneity of rock properties, to ensure uniformity and comparability of specimens, all specimens were sampled from adjacent positions within the same rock block. An image of sandstone samples and the triaxial cell are shown in Figure 1.
The test process was as follows: A. The rock specimen was subjected to vacuum and loaded in a pressure chamber after saturation for 48 h in water. B. An axial force of 1 kN was applied to force the pressure heads at each end of the testing machine into tight contact with the specimen and a confining pressure was applied to pre-set values (10, 20, and 30 MPa). C. pore pressure P1 was applied to both ends of the specimen and then pore pressure on the lower end was reduced to P2, thus forming stable differences in pore pressure P = P1P2 (1, 4, and 7 MPa). D. Axial load was applied (under axial displacement control) at a velocity of 0.02 mm/min and the positions of the test points were pre-set. Loading was applied to the first test point and then stopped when forming a stable difference in seepage pressures across the specimen. In this case, the changes in pore pressure difference over time were recorded. The other test points were measured (in increasing order of stress) until the onset of damage.

3. The Mechanical Characteristics of Failure of Sandstone under Hydro-Mechanical Coupling

3.1. Failure Morphology

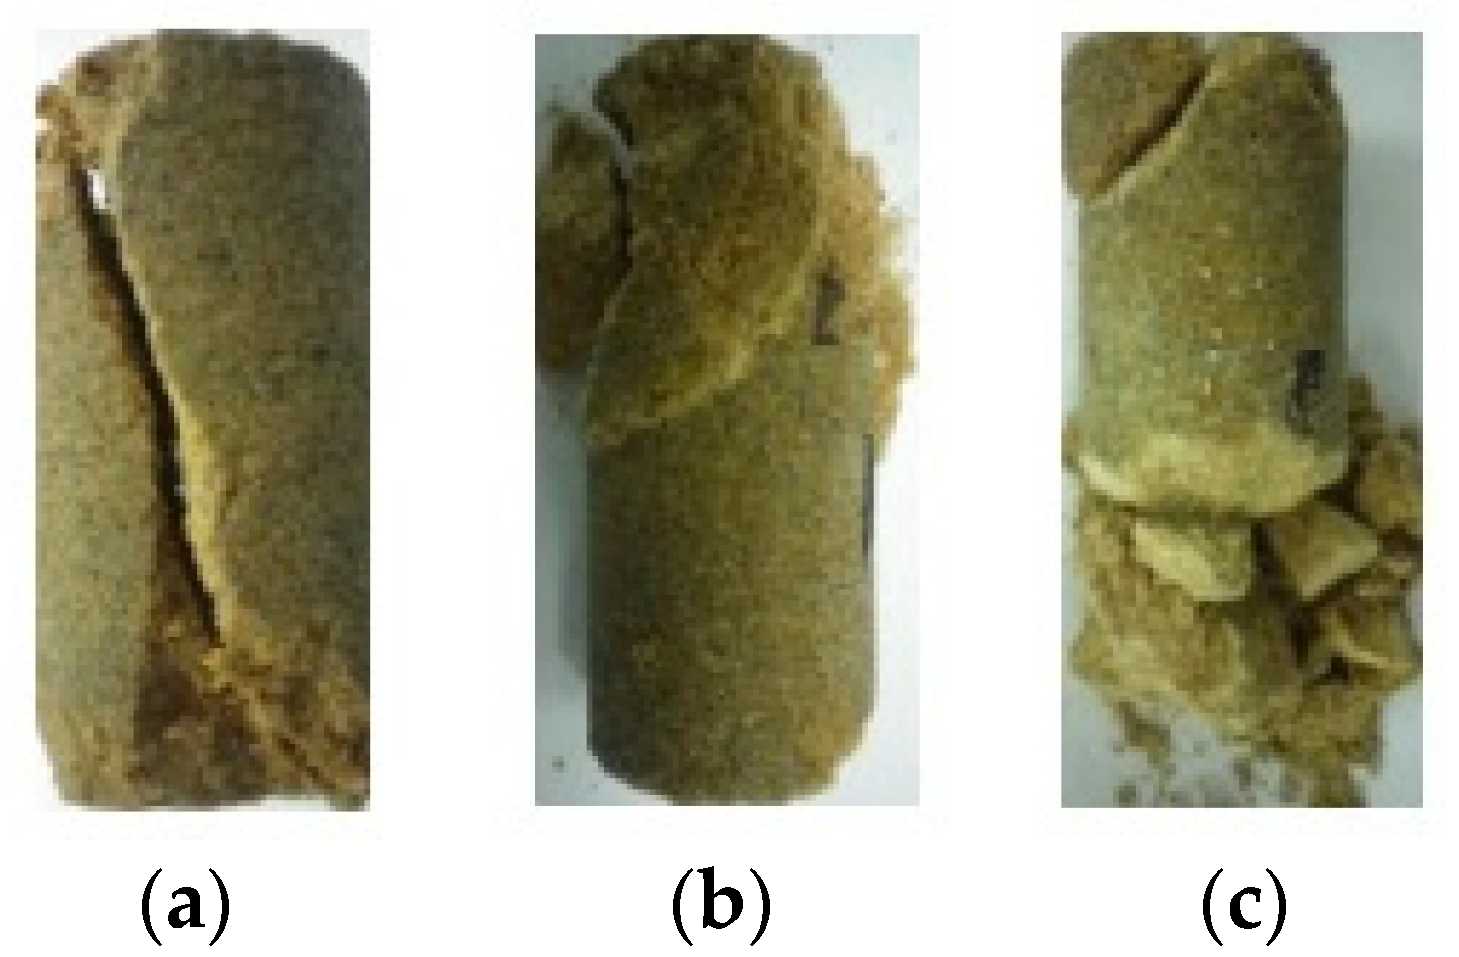
Typical failure morphologies of specimens under different confining pressures and a pore pressure of 4 MPa are shown in Figure 2 [33]. Mainly shear failure, shear and tensile failure, and a combination of local shear failure and compactive separately occur in such specimens under confining pressures of 10, 20, and 30 MPa. A combination of local shear failure and compactive the sample exhibits the combined characteristics of shear and compactive failure. By combining these with the data linking permeability, different local structures formed by triaxial compression and fracturing into fragments of size and sphericity may be seen under deformation as causing the different changes in permeability.

3.2. Stress–Strain Relationship

Figure 3 shows the deformation of sandstone specimens under conventional triaxial compression. As the confining pressure increases, the peak strength and corresponding peak strain increase, indicative of significant plasticity. Plastic flow occurs in specimens at a confining pressure of 30 MPa.
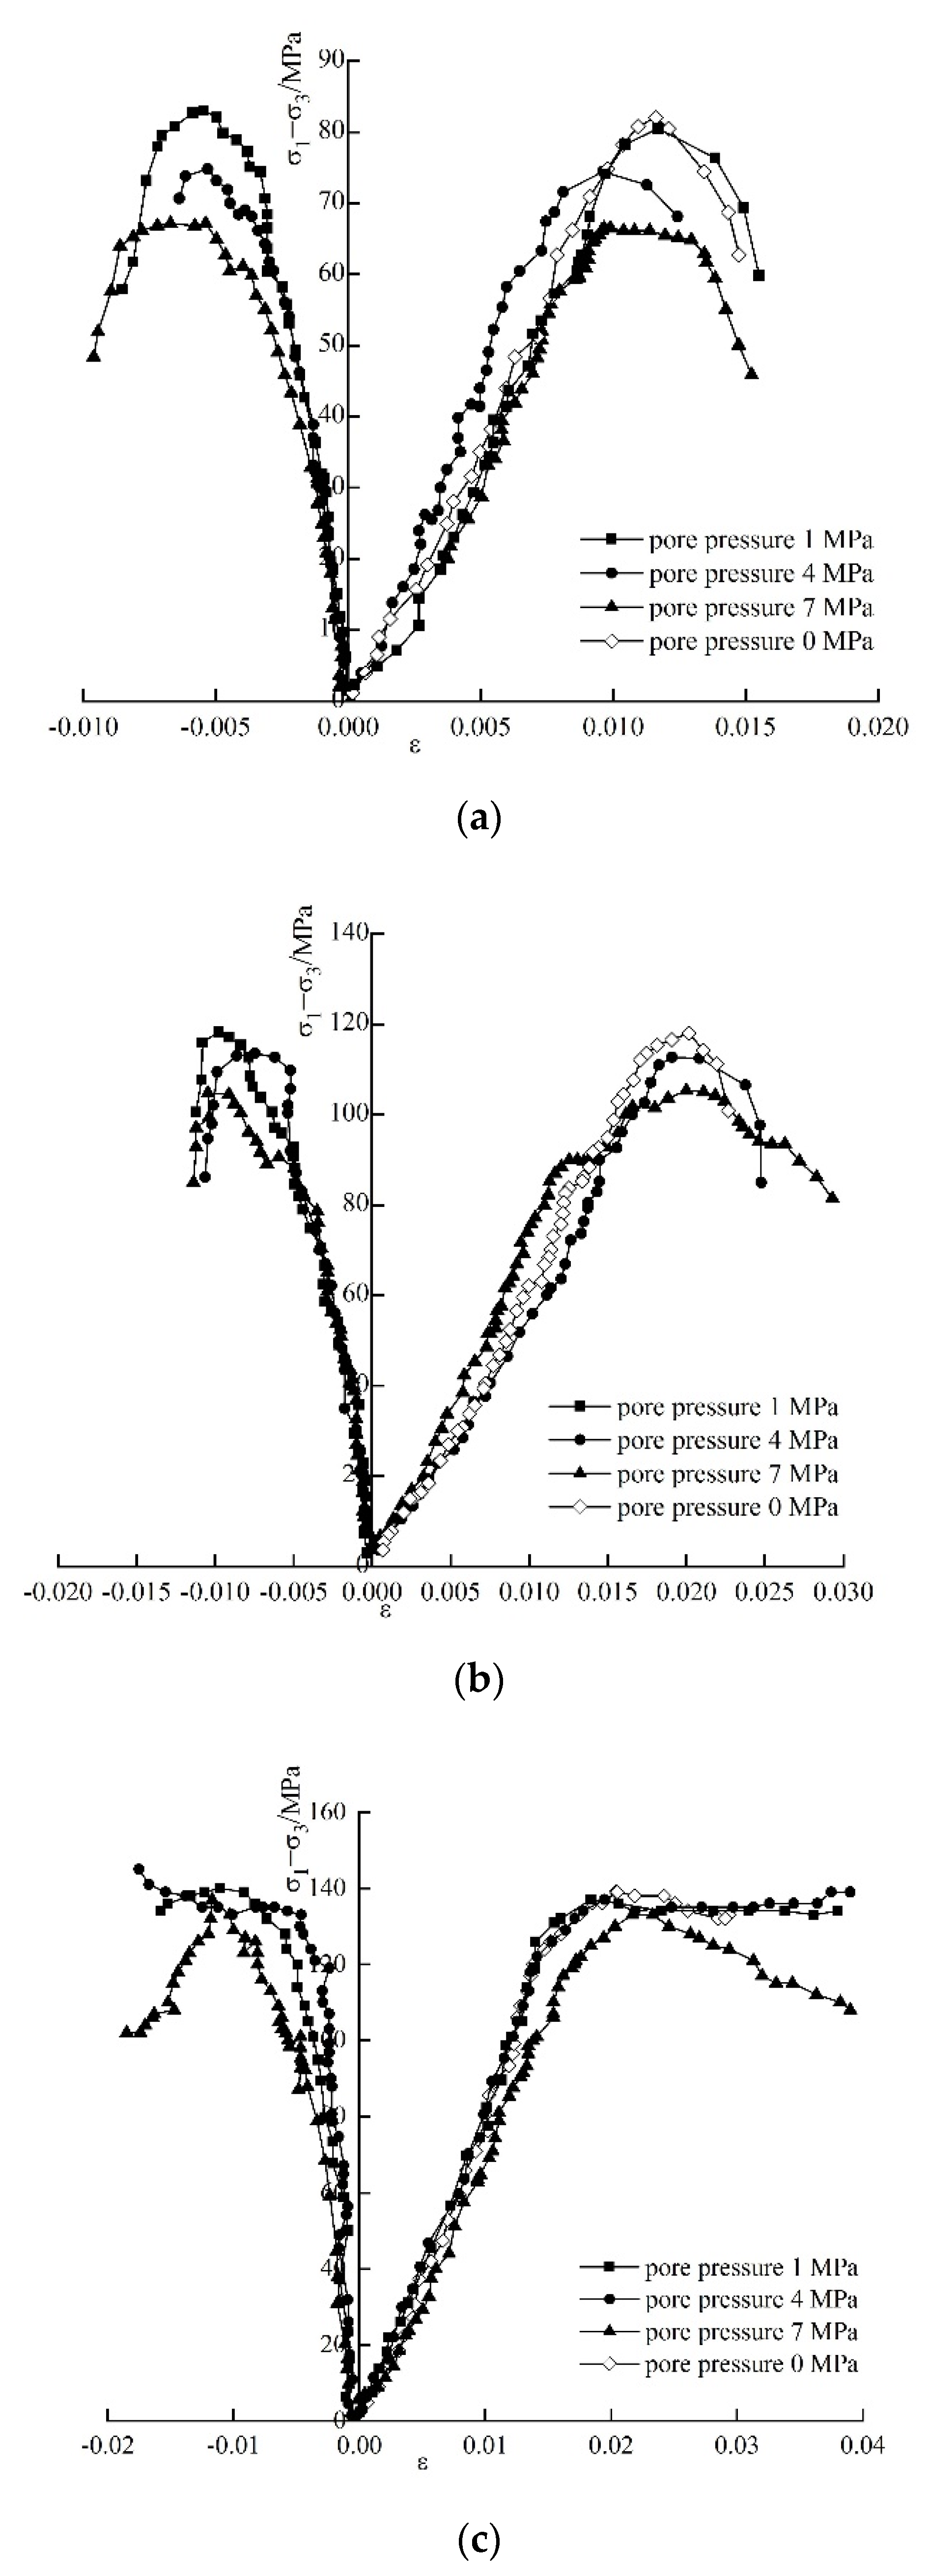
Under confining pressures of 10, 20, and 30 MPa and seepage pressures of 1, 4, and 7 MPa, stress–strain curves of sandstone during deformation are as illustrated in Figure 4. In Table 1, initial permeabilities and peak strengths of sandstone specimens under different confining pressures and seepage pressures are listed. Under the same seepage pressure, the peak strength increases with confining pressure. When the confining pressure is fixed, the peak strength decreases with increasing seepage pressure. The greater the seepage pressure, the greater the decrease in peak strength. When the confining pressure increases, the inhibitory effects of pore pressure on peak strength diminishes and the difference between peak strengths of rock specimens under different seepage pressures decrease.
At a confining pressure of 30 MPa and seepage pressures of 1 and 4 MPa, the stress drops seen at confining pressures of 10 and 20 MPa do not occur; instead, the stress remains unchanged and plastic flow occurs. Strain softening does begin until the pore pressure is increased to 7 MPa. This indicates that, due to compaction under a high confining pressure, the low pore pressure exerts little influence on the strength of the rock, while only a high pore pressure affects the strength of the rock.

3.3. Relationships of Characteristic Stress with Confining Pressure and Seepage Pressure

Characteristic stress is a parameter reflecting the stress state and triaxial strength of rock and includes compaction stress, crack-initiation stress, dilatancy stress, and peak strength. In the process of rock deformation, after the elastic phase is over, the new crack begins to expand, and the corresponding stress is defined as the crack initiation stress. Dilatancy stress refers to the stress under which the volumetric strain changes from contraction to expansion [34,35]. Based on the crack volumetric strain method [34,35], the crack initiation stress σ c i and dilatancy stress σ c d of sandstone were determined. Confining pressure borne by the rock skeleton under the influence of a positive pore water pressure is described in the form of effective confining pressure as follows:
P f = σ 3 Δ P
where, σ 3 and ΔP represent the confining pressure in the test and the seepage pressure, respectively. The characteristic stresses on sandstone under different effective confining pressures are listed in Table 2 and the relationship between characteristic stress and effective confining pressure is demonstrated in Figure 5 and Figure 6.

3.4. Failure Criterion

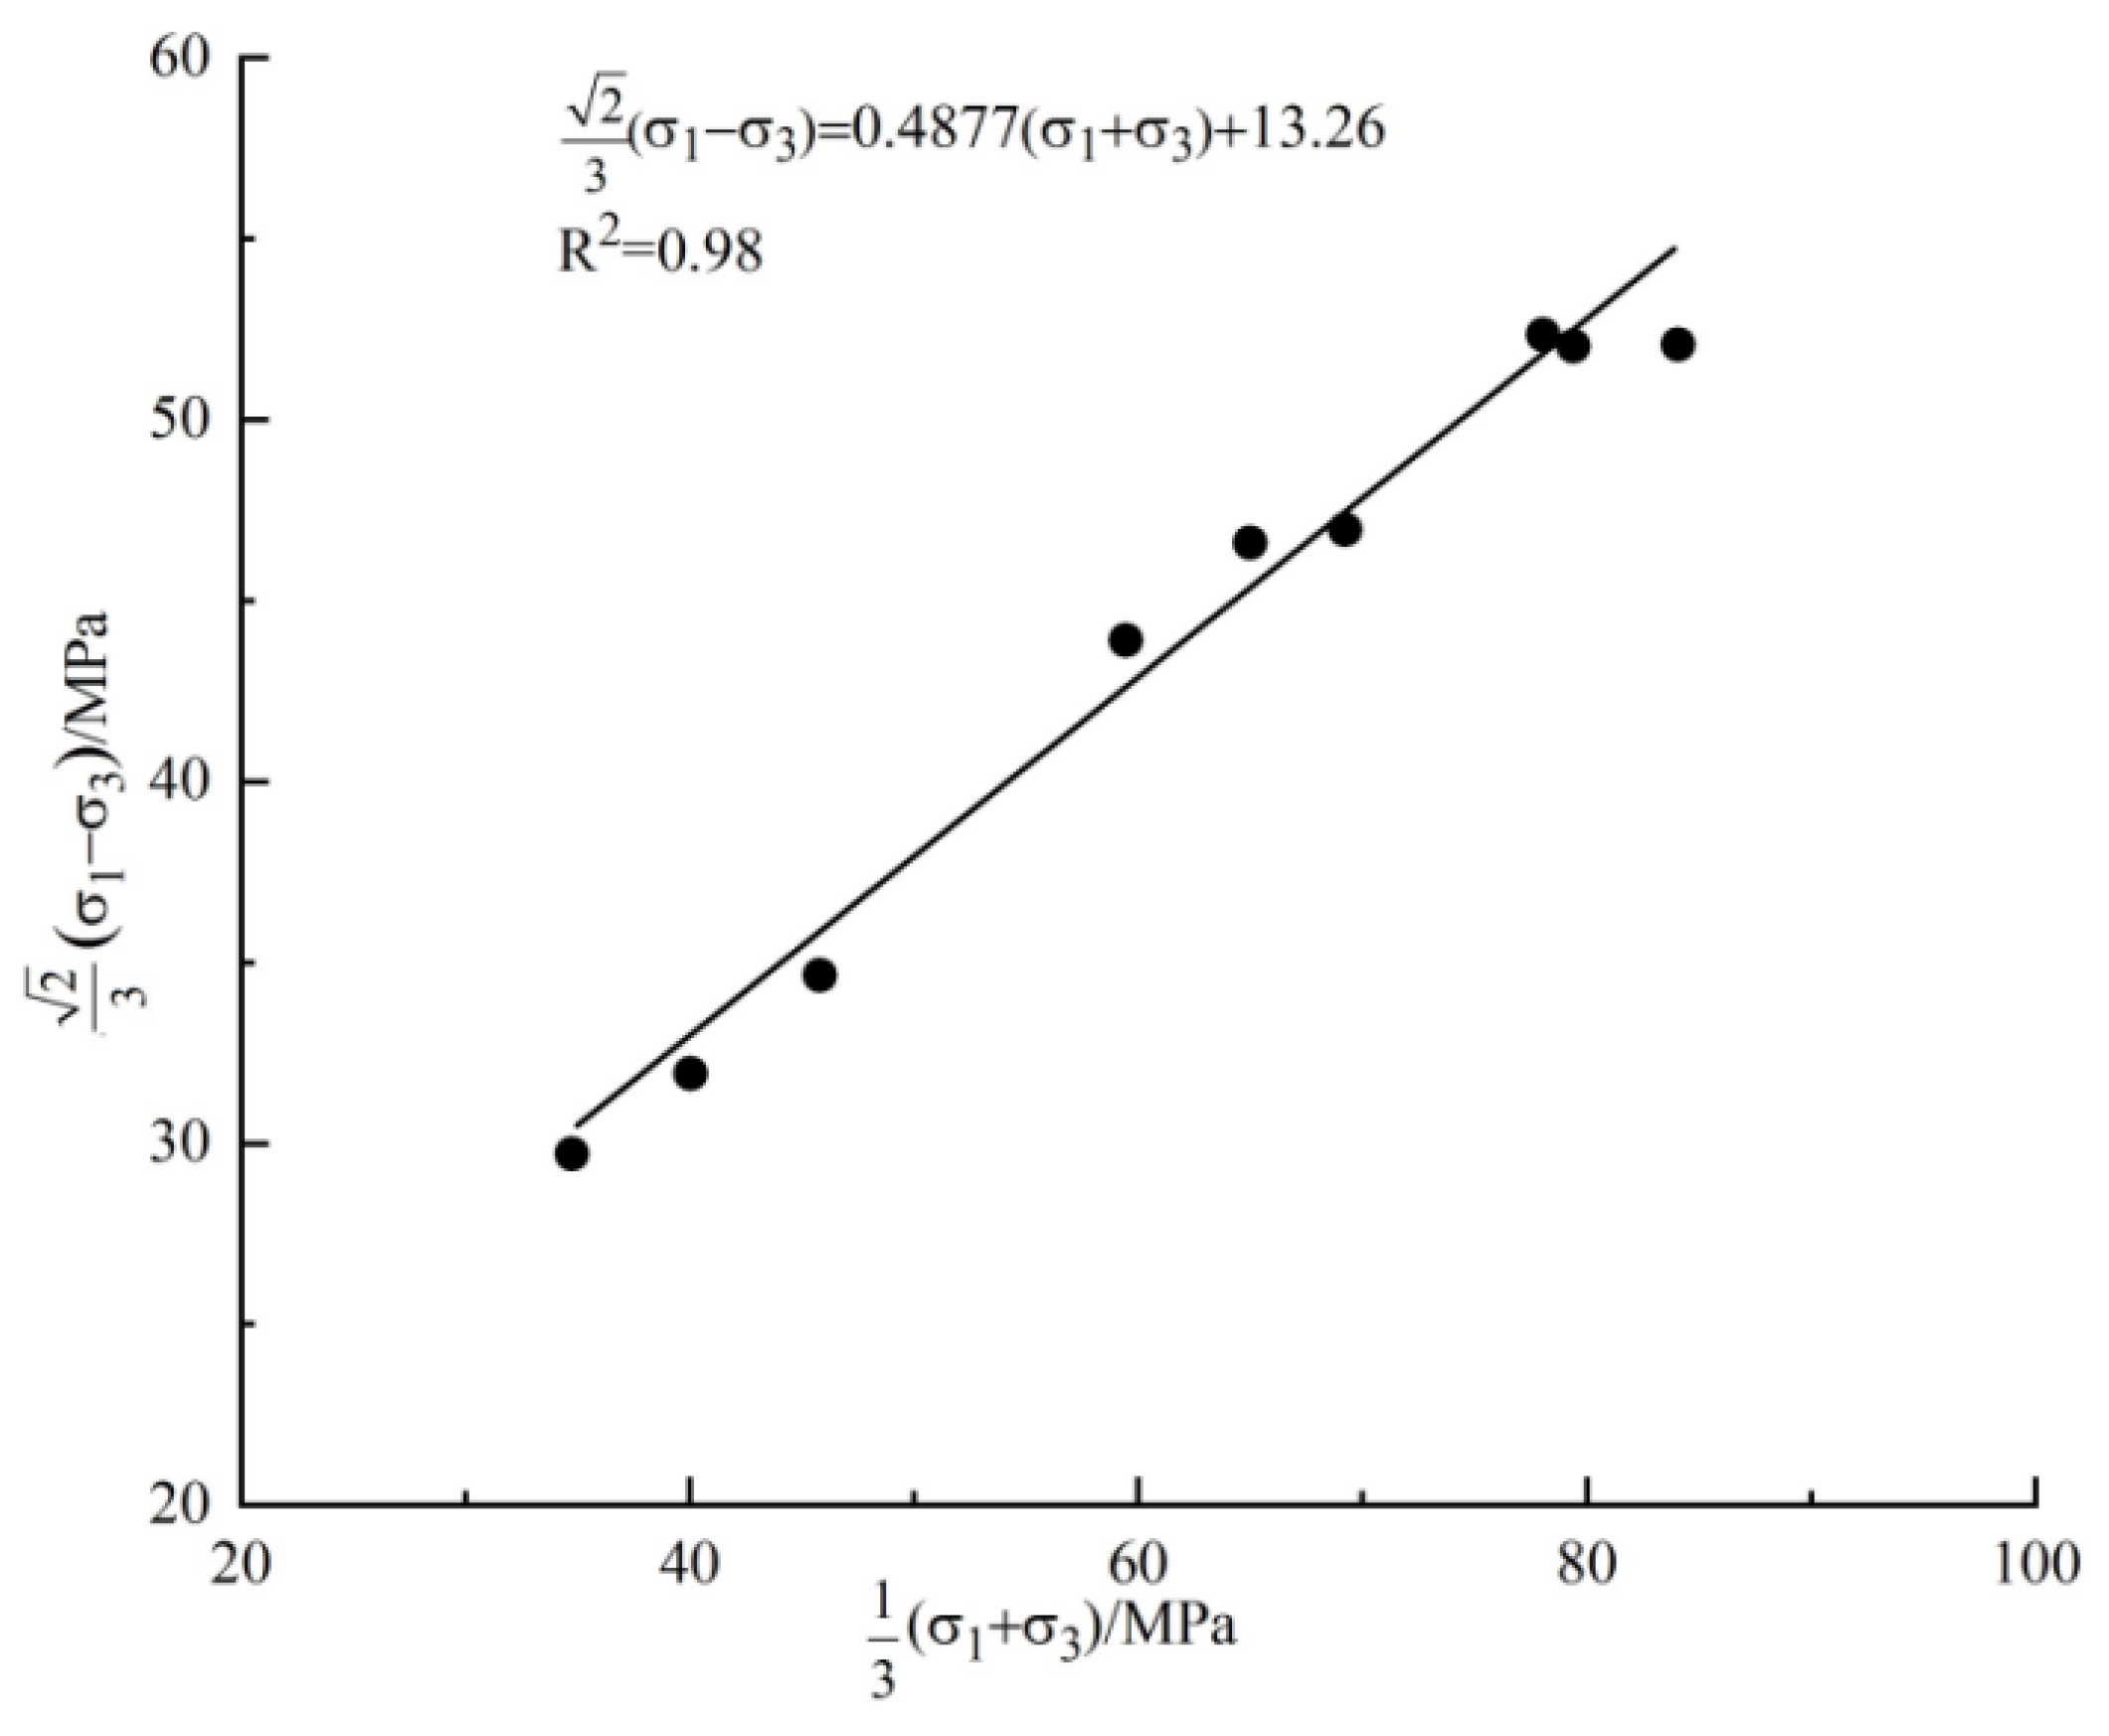
The Mogi–Coulomb strength criterion takes the effect of intermediate principal stress on rock strength into account [36,37]:
2 3 ( σ 1 σ 3 ) = a + b 2 ( σ 1 + σ 3 )
where, a and b are constants, and their relationships with parameters of the Mohr-Coulomb criterion are as follows:
a = 2 2 3 c cos φ , b = 2 2 3 sin φ
According to Formula (2), the data in Table 2 are fitted, as shown in Figure 7, thus obtaining the angle of internal friction of 31.2° and a cohesion of 16.4 MPa.

4. Evolution of Permeability of Sandstone under Darcy Flow

4.1. Relationship between Permeability and Axial Strain

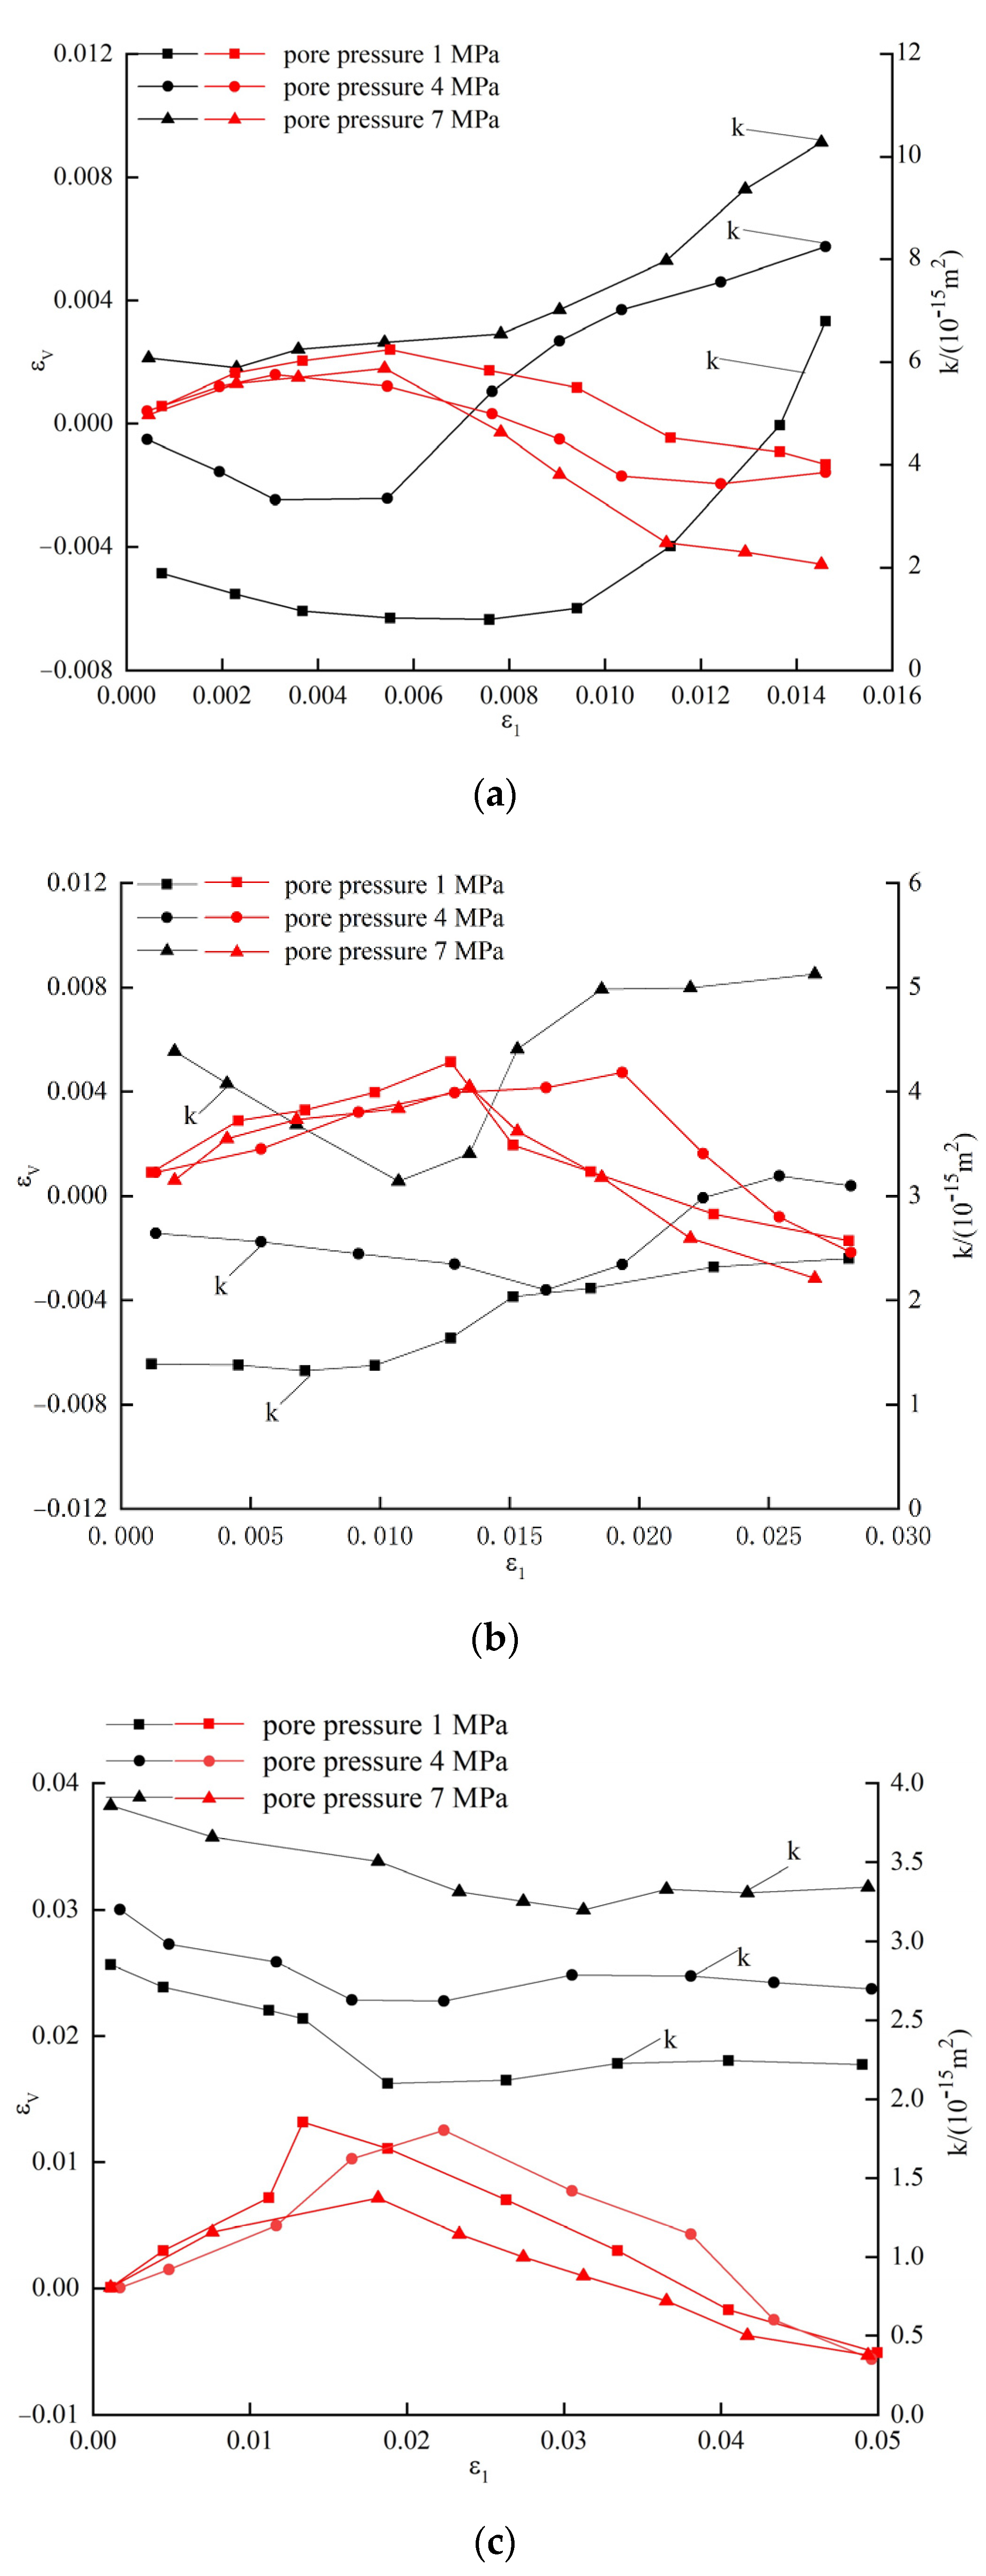
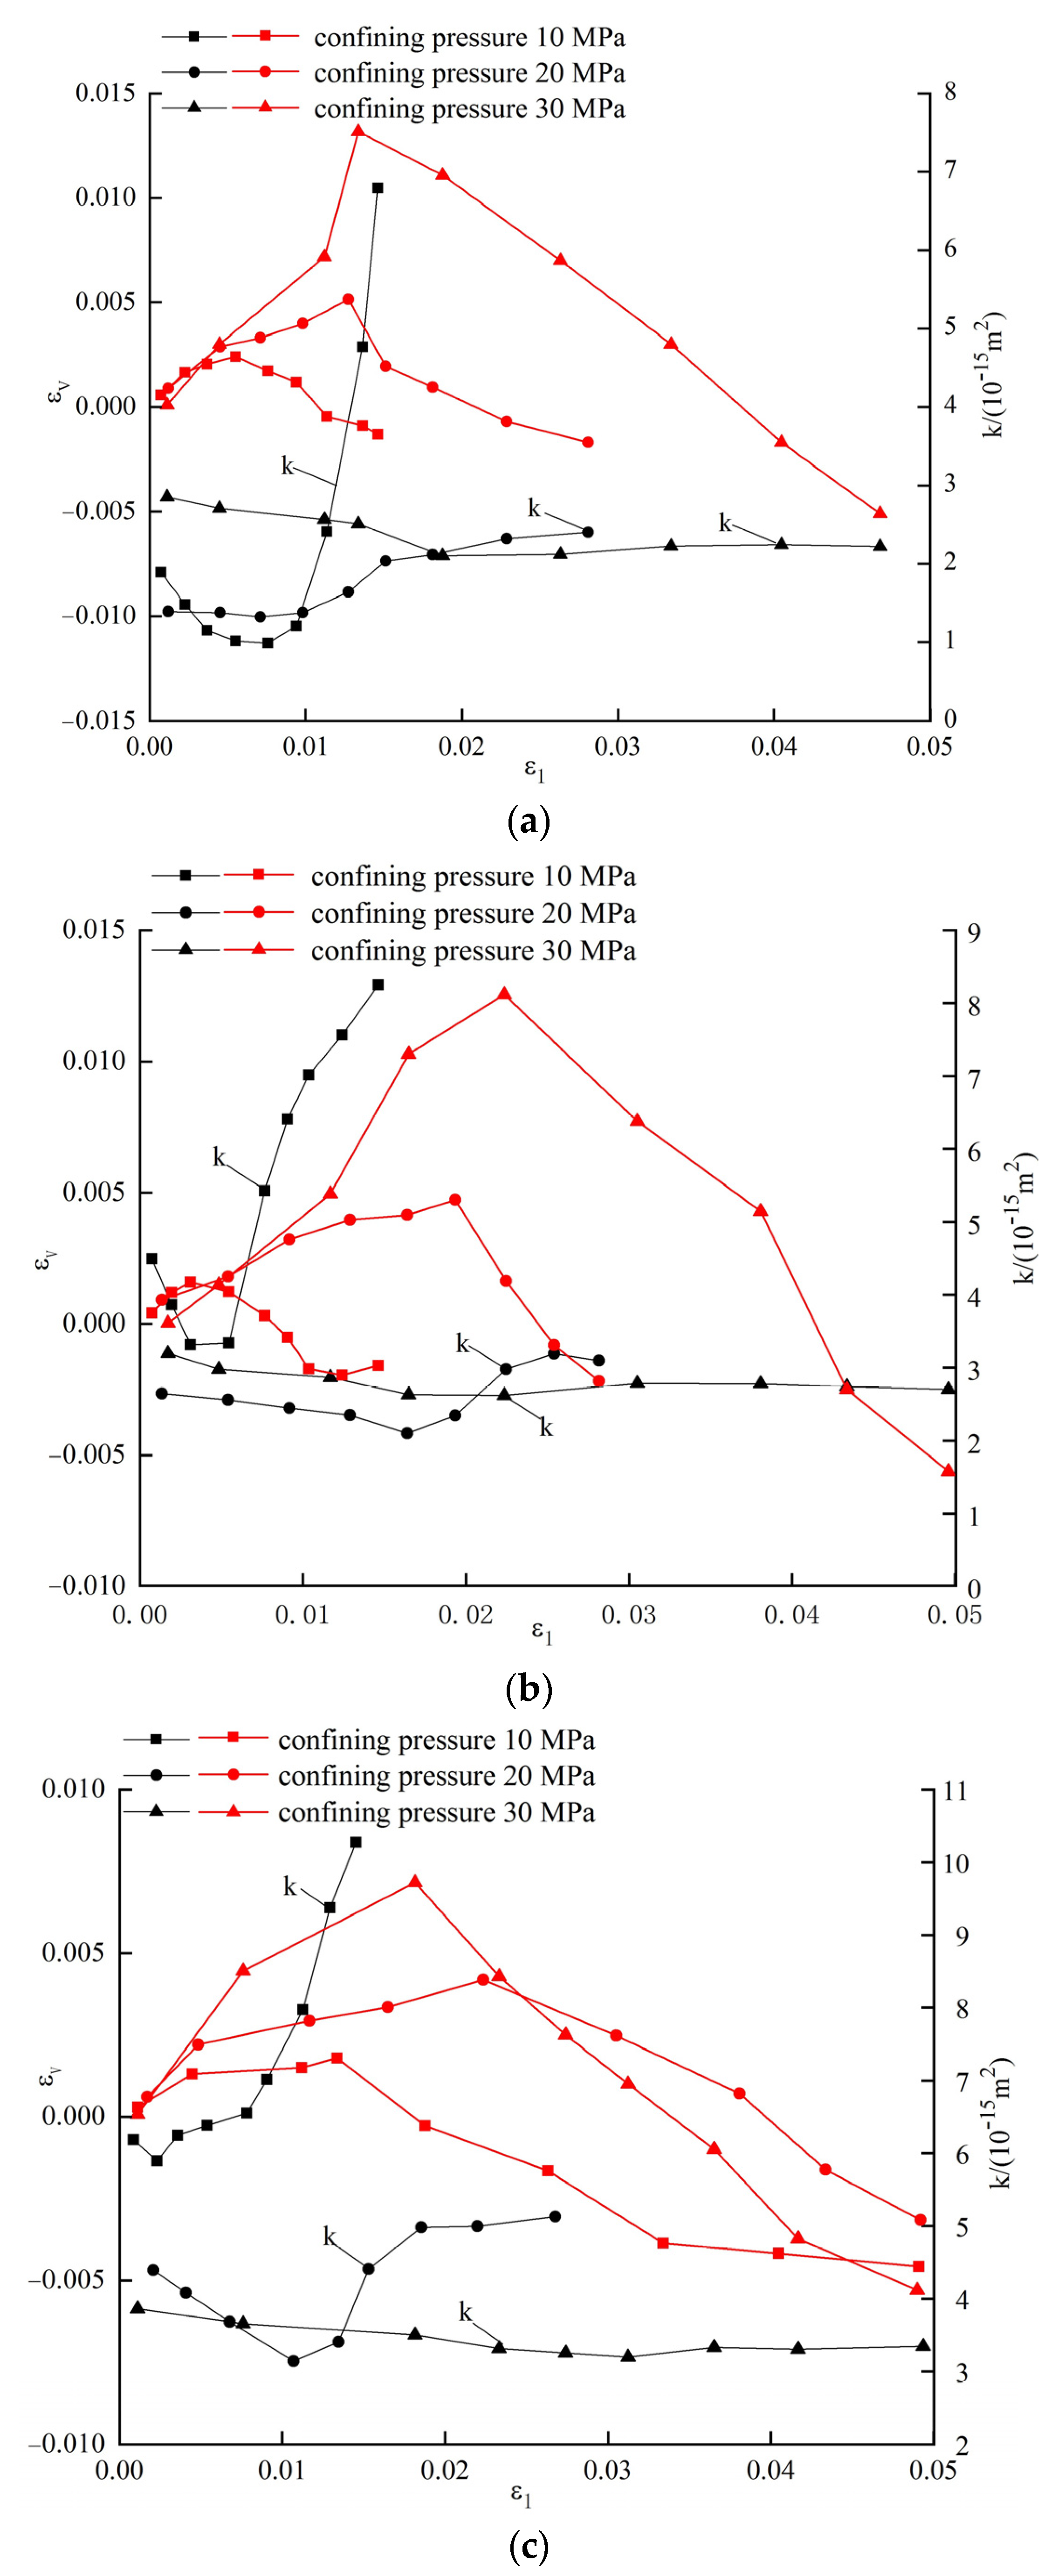
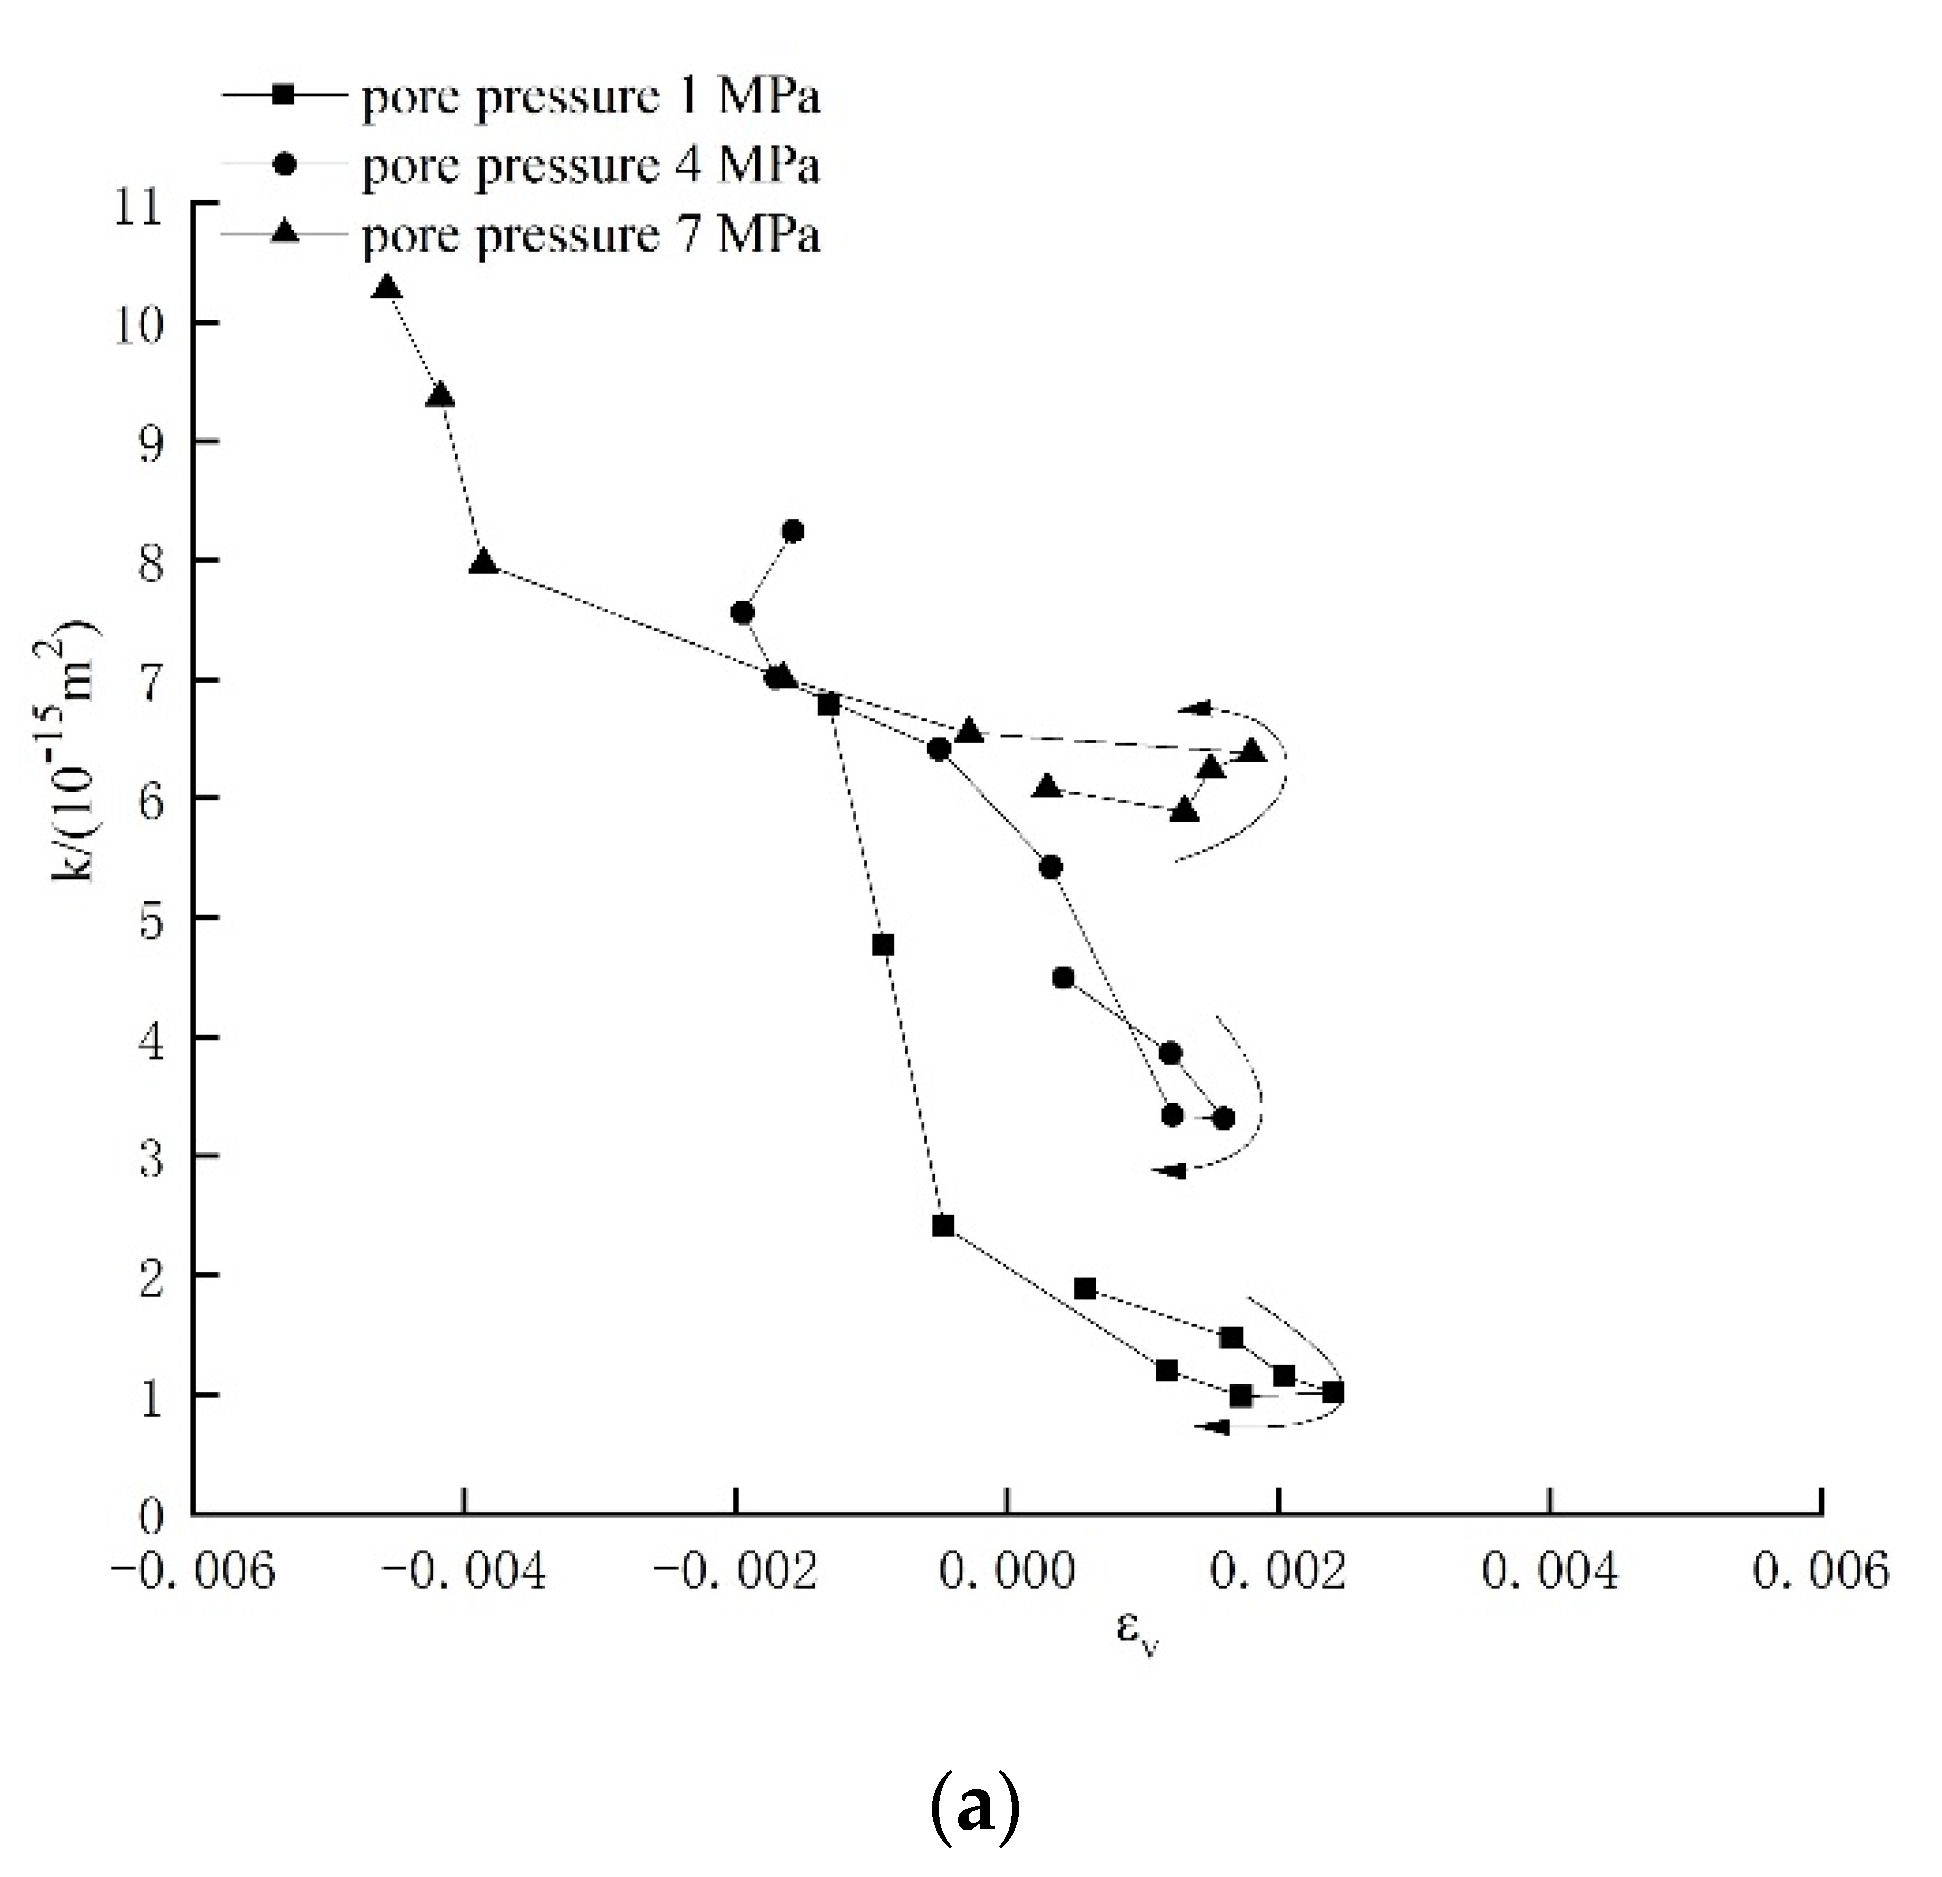
The relationship between permeability, volumetric strain and axial strain of sandstone under different confining pressures and seepage pressures are shown in Figure 8 and Figure 9. The formula for calculating the permeability under Darcy flows is [11]:
k = Q μ L Δ P A
where k (m2) is the permeability of samples (1 darcy = 10−12 m2); Q (m3 s−1) is the flow rate through the samples per unit time; μ is the dynamic viscosity coefficient of water; ΔP tands for the pressure difference between the two end-faces of the sample; L (m) and A (m2) denote the height and cross-section of the sample, respectively.
In the initial deformation stage, micropores and meso-throats in sandstone are compacted and the permeability decreases. In the non-linear deformation stage, microcracks propagate in the rock and new microfractures are initiated: moreover, the permeability follows two trends: one is V-shaped, that is, it first reduces, then increases rapidly, while the other is S-shaped, such that it slowly decreases and then remains unchanged. Under a confining pressure of 10 MPa, the permeability exhibits a V-shaped trend. At a confining pressure of 20 MPa, the V-shaped trend weakens and magnitude of changes in permeability decreases. At a confining pressure of 30 MPa, the permeability follows an S-shaped trend. Under the same confining pressure, the greater the seepage pressure, the greater the initial permeability and that under the same deformation. Moreover, the V-shaped trend becomes more obvious. Under the same seepage pressure, the permeability decreases with increasing confining pressure. Furthermore, the permeability decreases when the rock suffers damage and the overall magnitude of any change in permeability decreases and the V-shaped trend gradually changes to an S-shaped one.
In comparison with the case at a high confining pressure, under a low confining pressure, the decrease in permeability is faster and its subsequent increase occurs earlier. In addition, the rate of change of permeability is greater; however, the permeability gradually changes under higher confining pressures.

4.2. Relationship between Permeability and Volumetric Strain

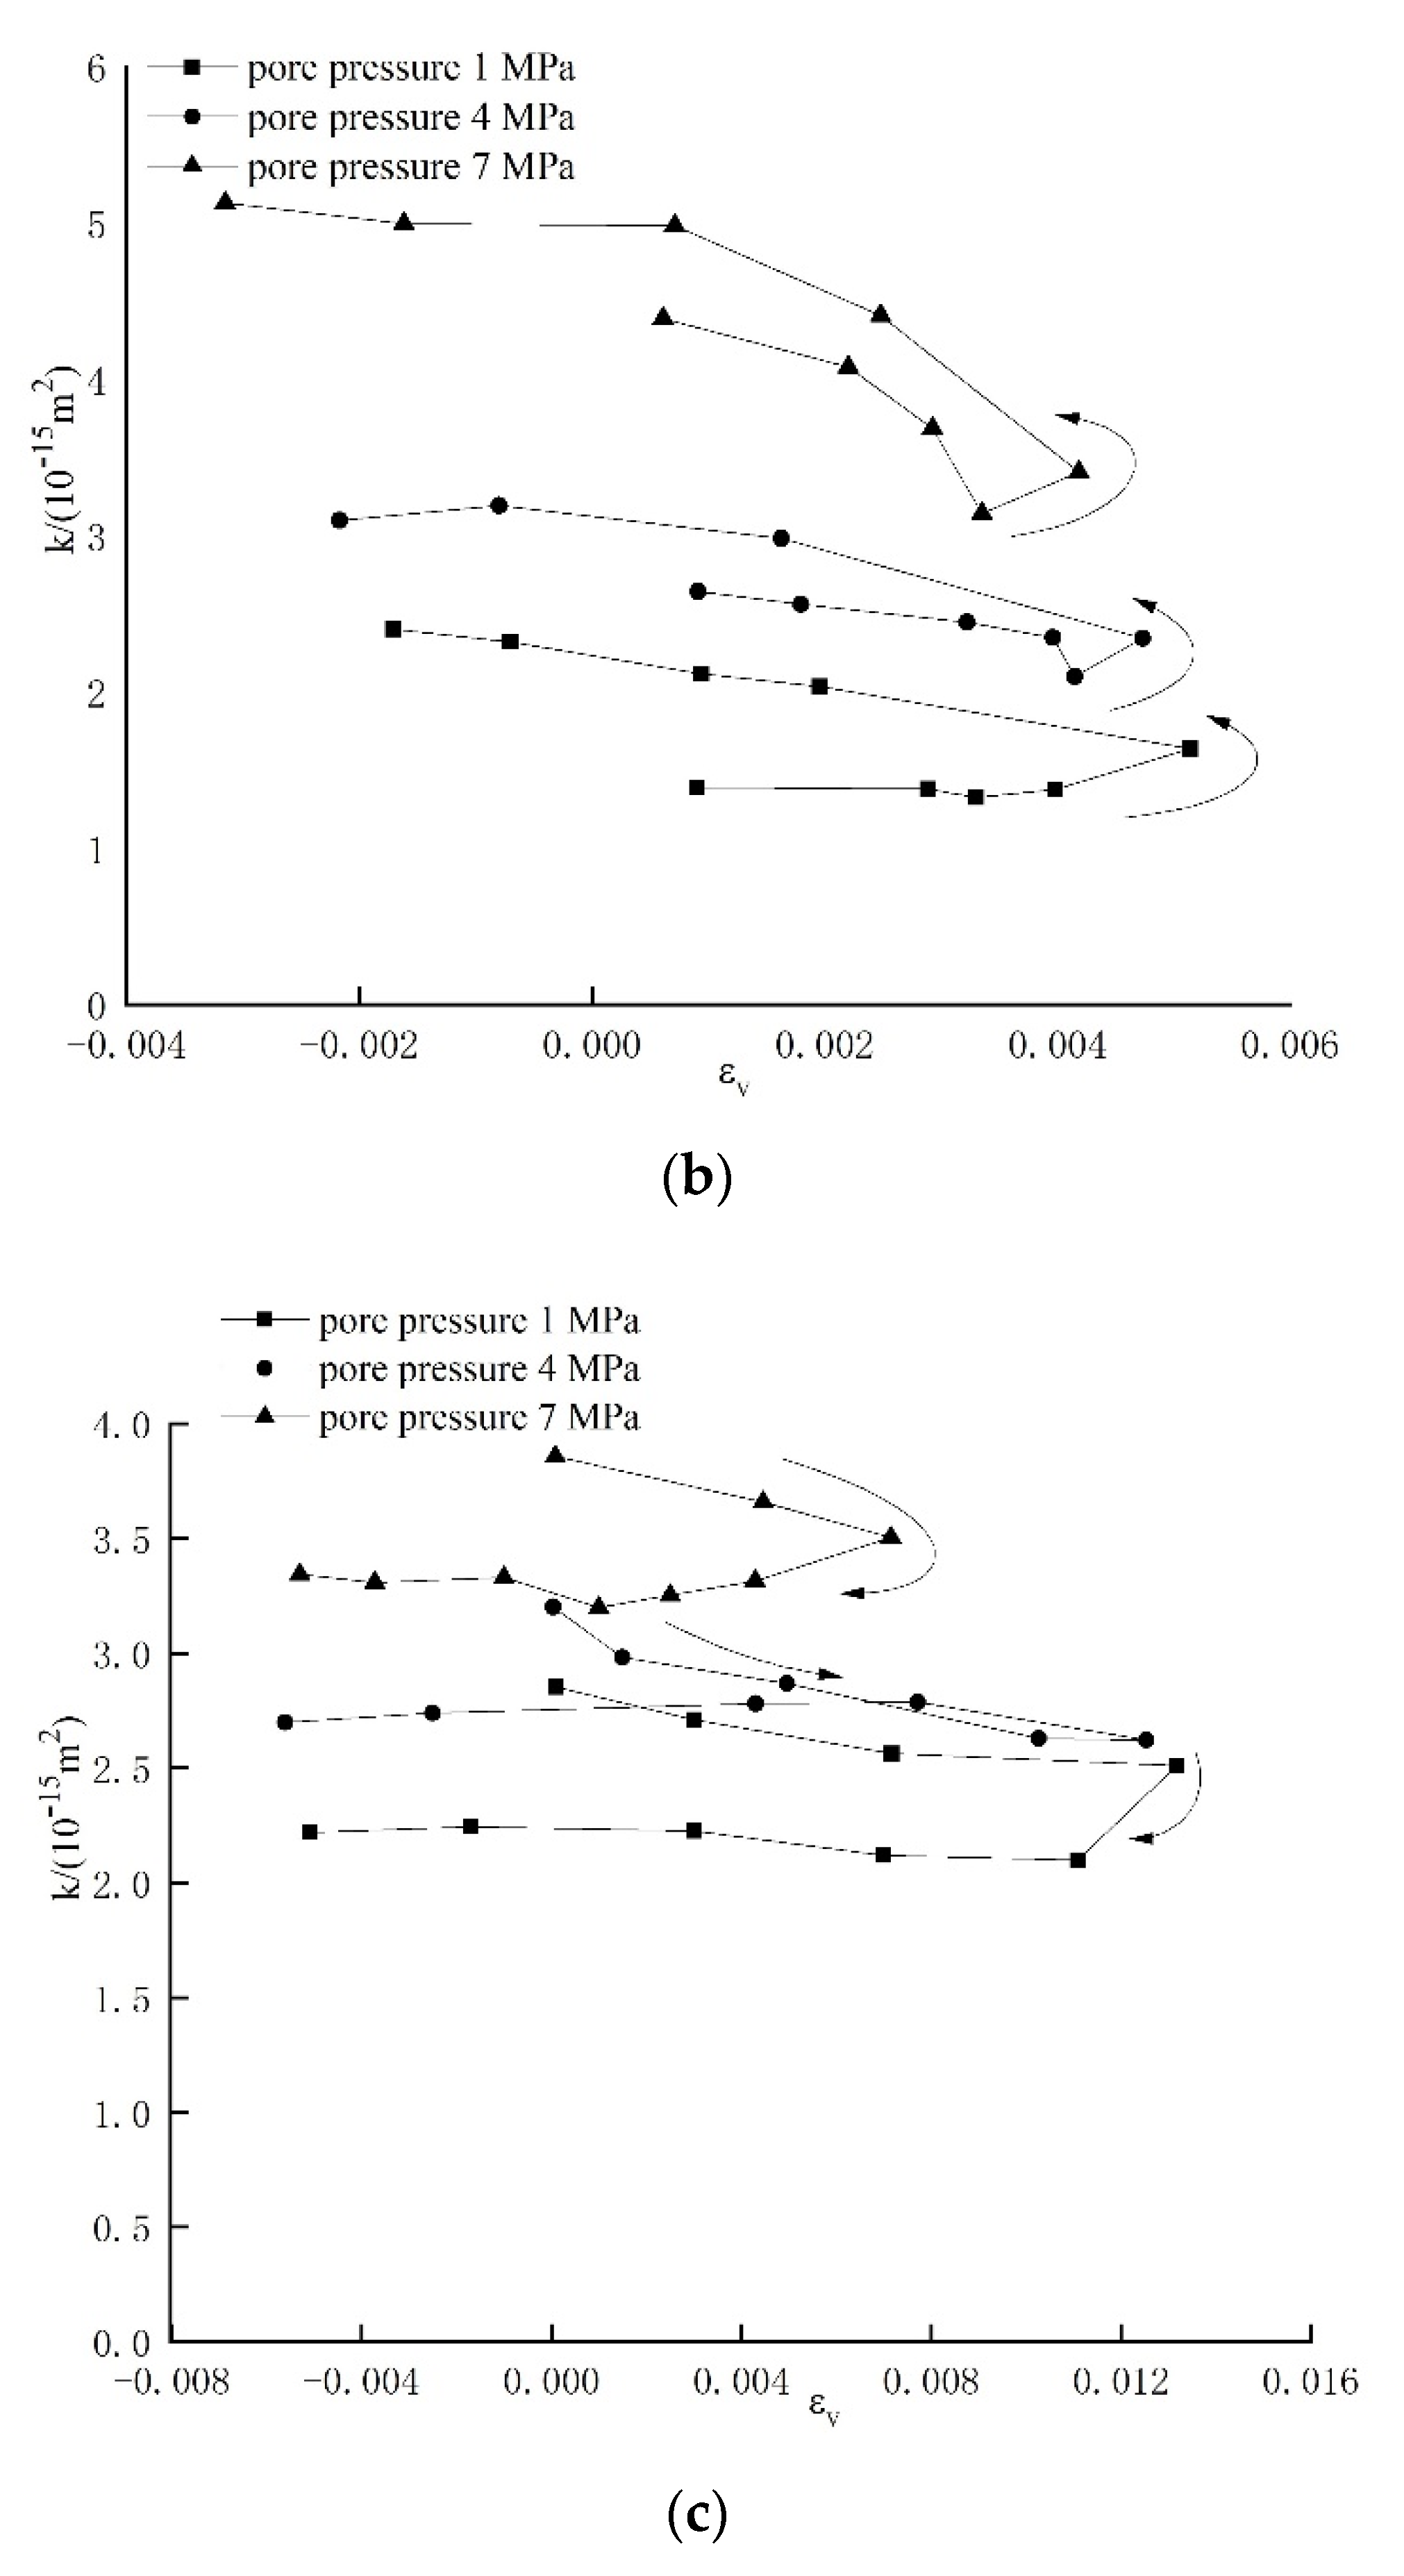
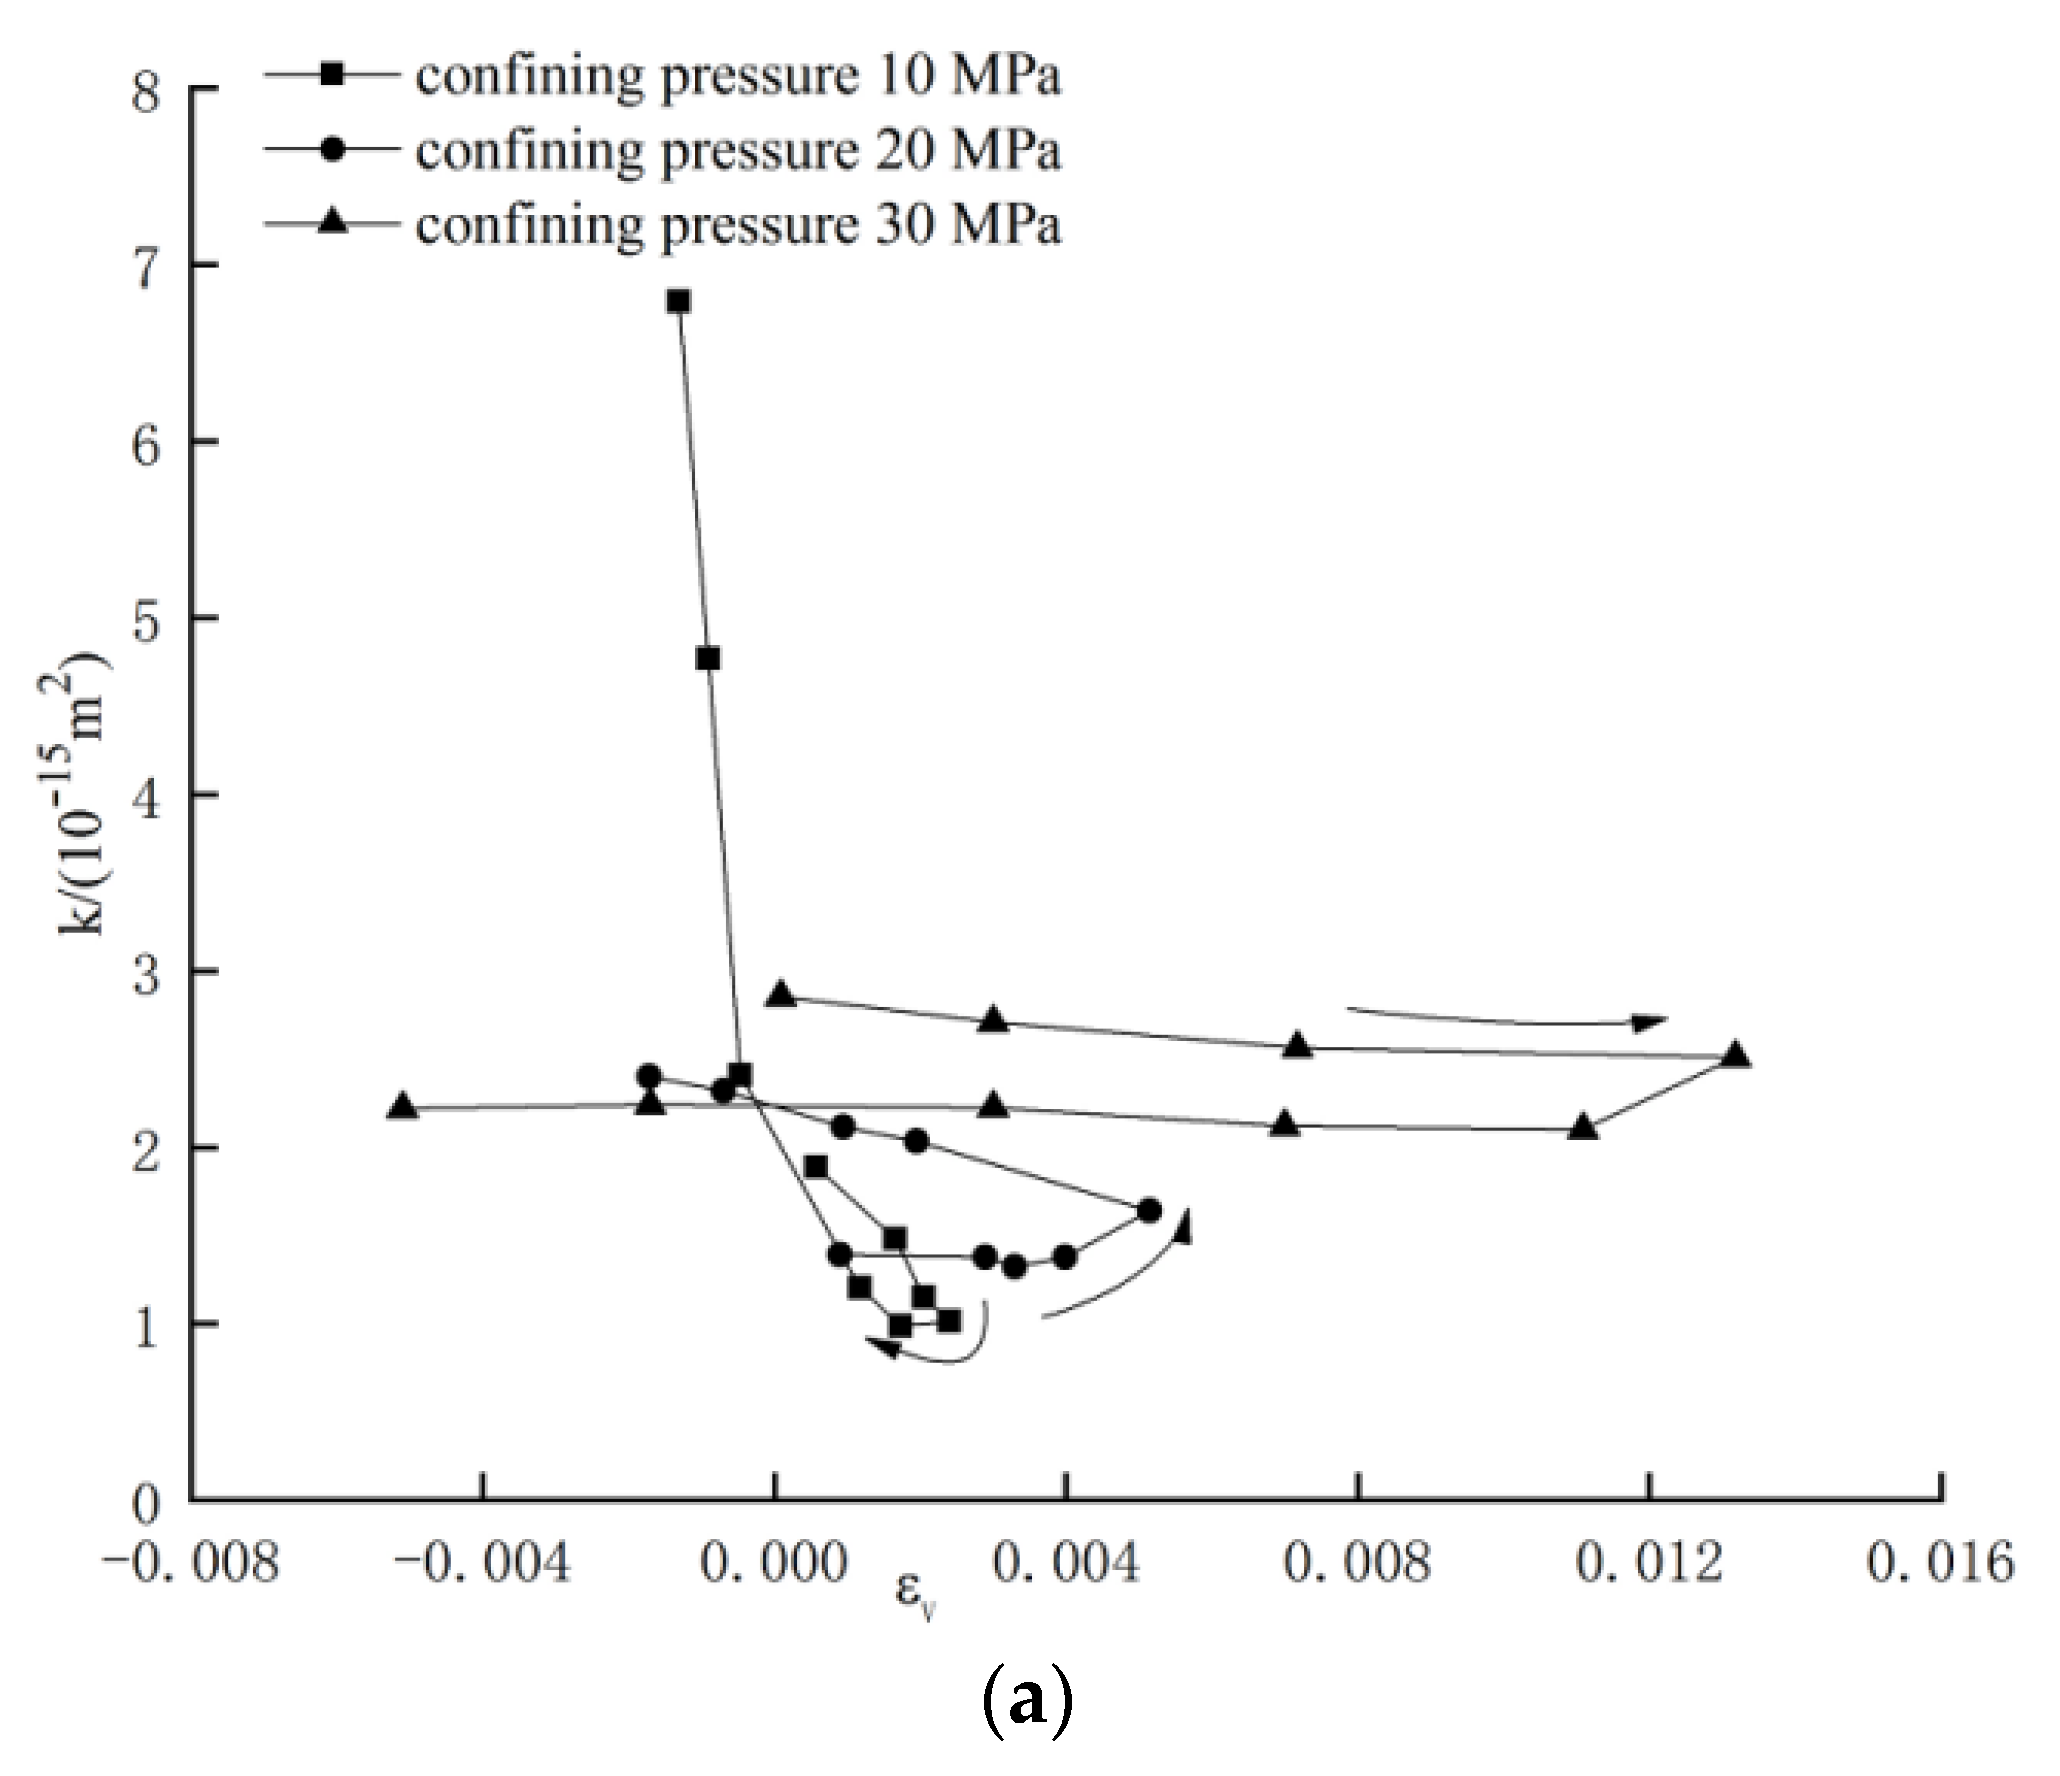
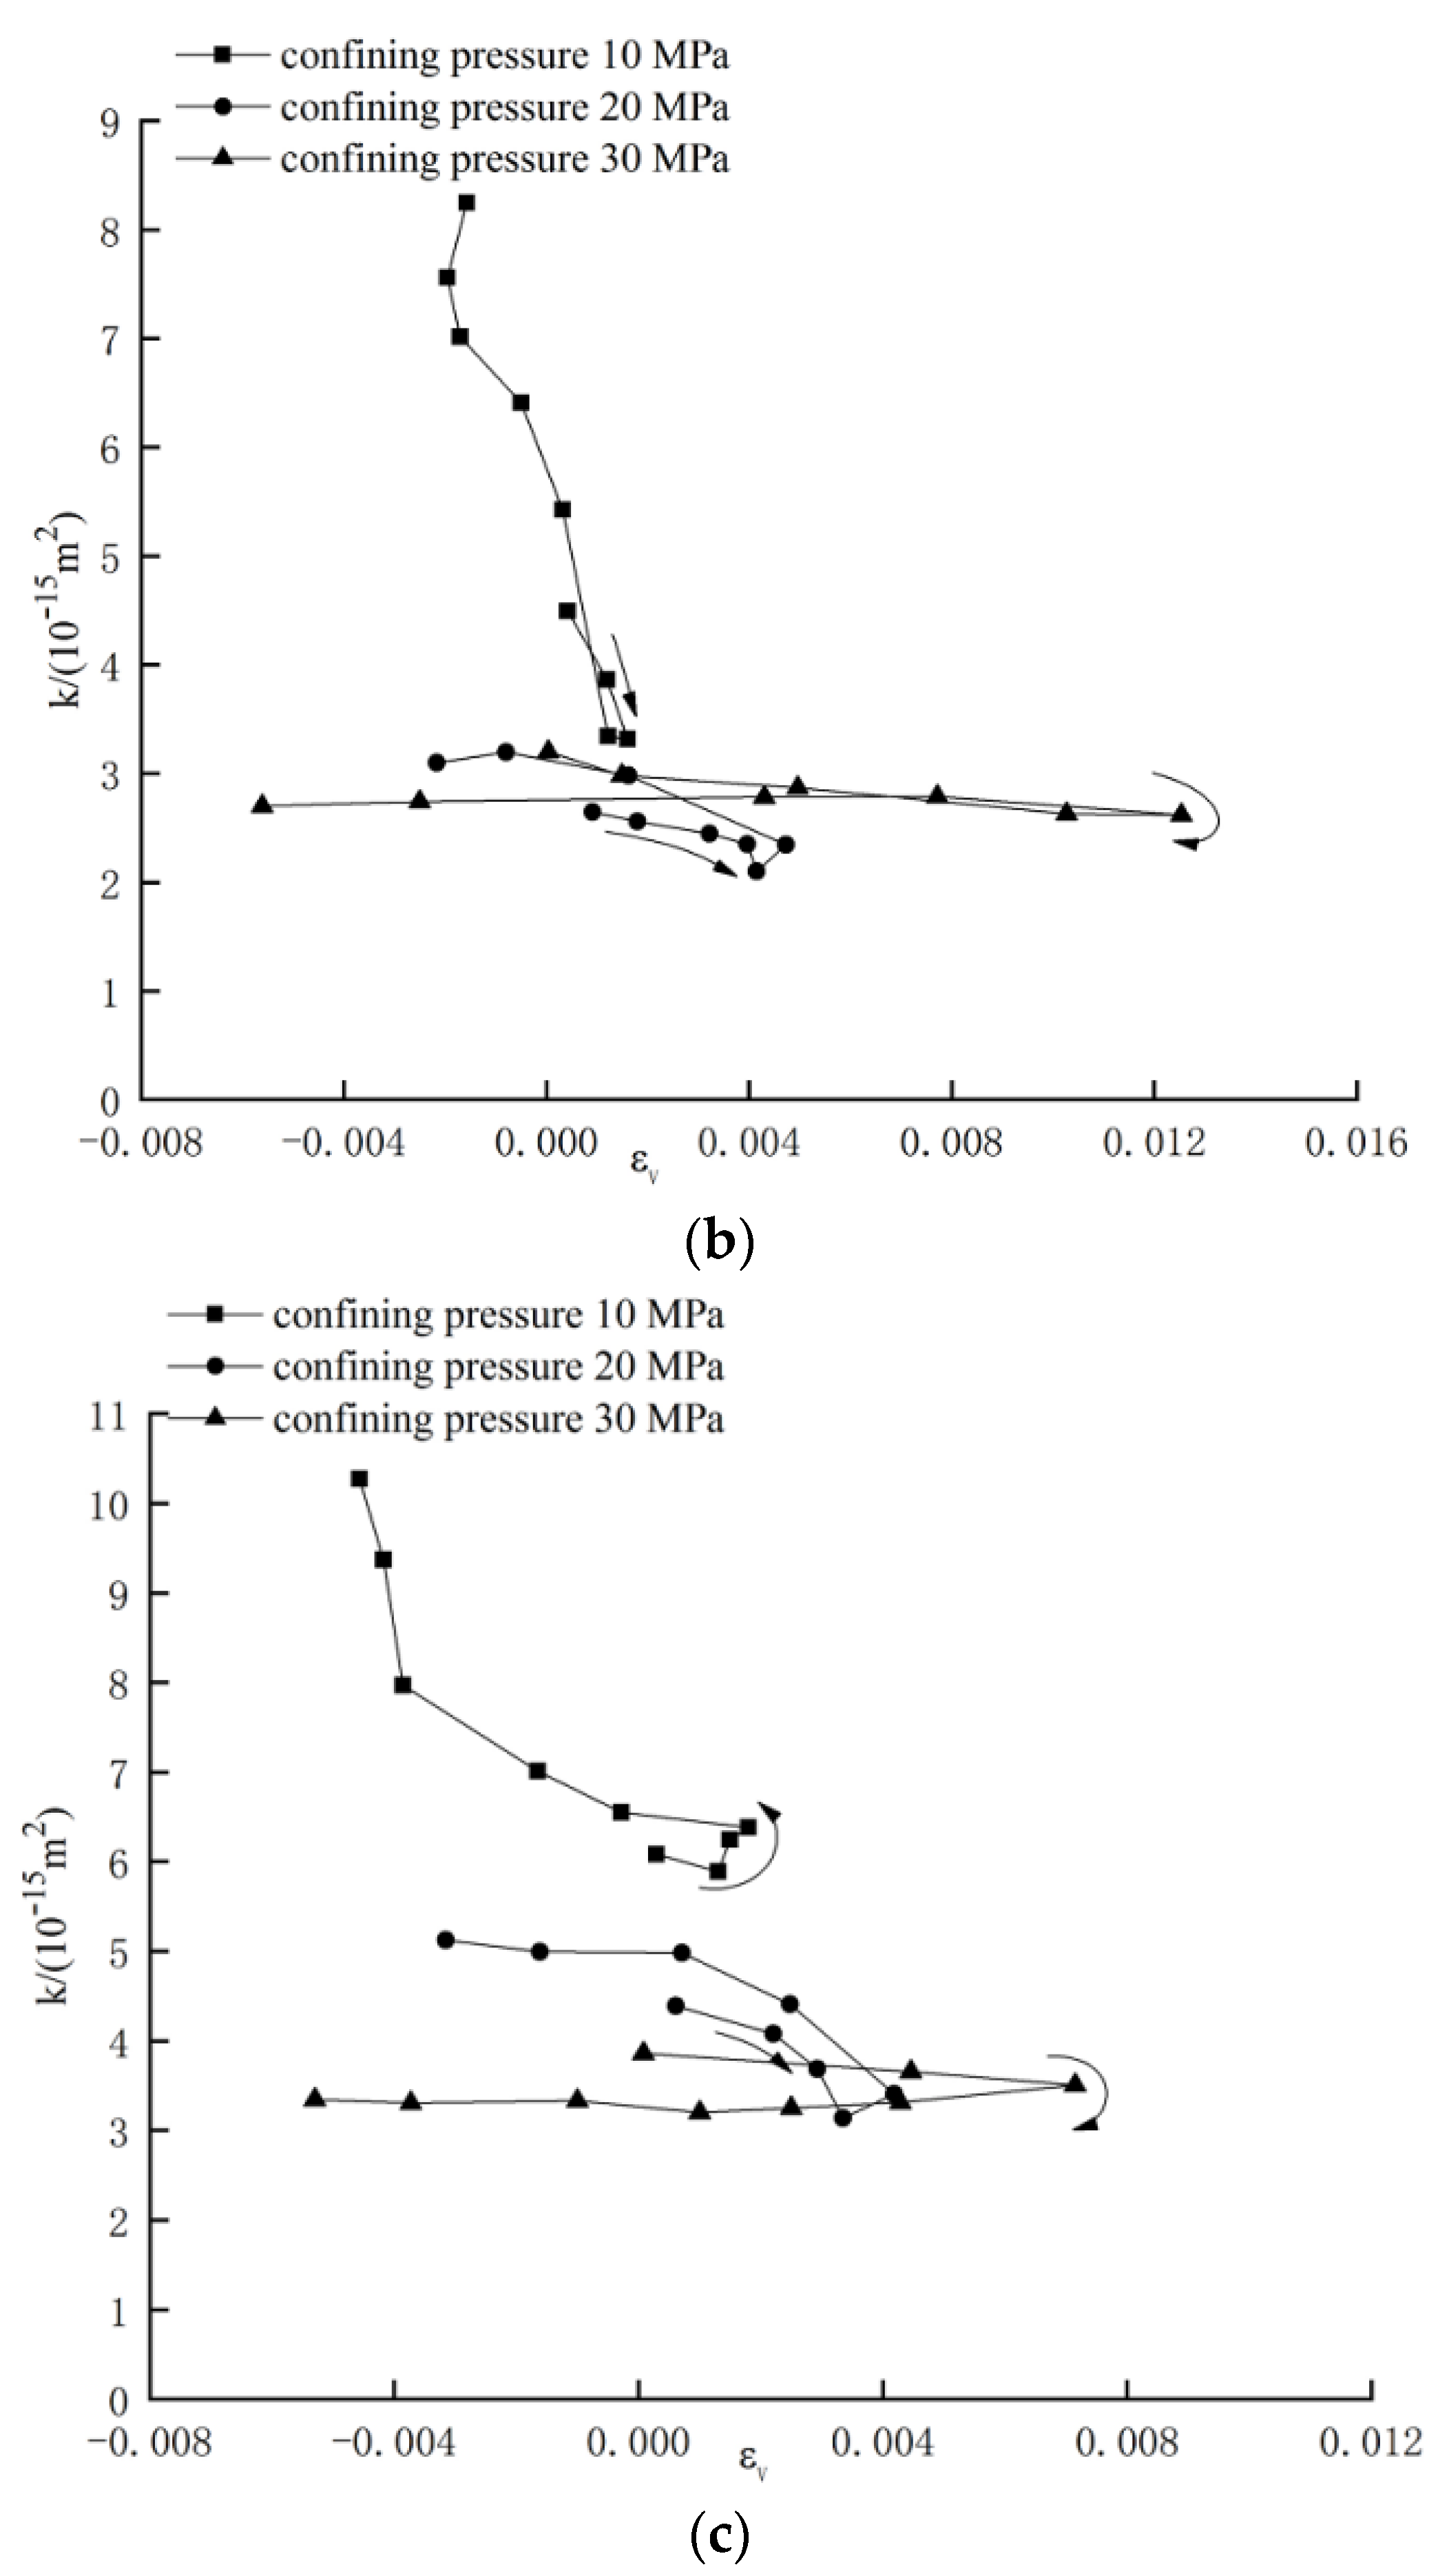
The relationship between permeability and volumetric strain of sandstone under different confining pressures and seepage pressures are shown in Figure 10 and Figure 11. Volumetric strain is the sum of the axial strain ε 1 and circumferential strain ε 3 , expressed as:
ε v = ε 1 + 2 ε 3
Compaction and dilation processes in sandstone are related to closure and propagation of internal microcracks and volumetric strain can directly reflect these two characteristics. In the compaction stage, the specimen volume and permeability decrease. After axial force reaches a certain value, many microcracks are generated in the samples. In that case, compaction-induced deformation becomes dilatant and the specimen volume increases. In this case, if the confining pressure is low and the rock is brittle, microfractures constantly coalesce and expand. Under positive pore water pressure, the internal fractures propagate and coalesce faster and the volume expands rapidly, so that the permeability increases. If the confining pressure on, and ductility of, the rock are high, skeleton particles therein are crushed and pores while microfractures coalesce, which slows the expansion and inhibits any increase of permeability. Therefore, volumetric strain can better reveal changes in permeability during compaction and dilation of the samples. In comparison with Figure 8, Figure 9, Figure 10 and Figure 11, volumetric strain can more clearly reflect the effects of confining pressure and pore pressure on permeability compared with axial strain.
Under different confining pressures and seepage pressures, the permeability changes near the inflection point in the volumetric strain. In the compaction stage, the permeability first decreases, then stabilizes with reducing volumetric strain. Adjacent to the inflection point, the permeability undergoes a slow increase. Upon dilation, the permeability increases rapidly with decreasing volumetric strain. Compared with the compaction stage, the permeability during dilation is more sensitive to the decrease in volumetric strain. That is, the permeability decreases in the volume-compaction stage while increases in the volume-dilation stage.
As the confining pressure increases, the permeability tends to decrease. When the pore pressure increases, or when the confining pressure decreases, the inflection point in the volumetric strain appears earlier. With increasing seepage pressure, the permeability differs slightly from that pertaining before the inflection point of volumetric strain, but differs to a greater extent thereafter.

5. Evolution of Permeability of Sandstone under Non-Darcy Flow

5.1. Calculation of Non-Darcy Seepage

Based on Forchheimer’s equation for non-Darcy seepage, a one-dimensional equation may be obtained by neglecting effects of volumetric body forces [38]:
p C α V t = p x μ k V + β p V 2
where, p , C α , V, and t represent the density of liquid, the acceleration coefficient of fluid, the flow rate of fluid, and time, respectively; p x , μ , and β denote the pressure gradient, coefficient of viscosity, and the seepage factor, respectively.
In the test process, the axial deformation stabilizes for a certain period after reaching a certain value, until the seepage reaches a steady state where:
V t = 0
Assuming a uniform pressure gradient in the fluid under steady seepage, their values were determined by differences in seepage pressures and the height ratio of the specimens.
The data were collected at a frequency of 2 Hz. While keeping the piston displacement constant, the time series pore pressure data were collected, thus obtaining a group of stable values of pressure gradients from plotted data. The seepage velocity can be expressed as follows:
V = D V V 1
where, V, V1, D, and d denote the seepage velocity, the relative velocity of the axial piston to the cylinder block, the diameter of the piston, and the diameter of the cylinder, respectively.
The seepage velocities V1, V2, …,·Vn at different times can be acquired based on piston displacement. By fitting seepage velocities and pressure gradients, the following formulae were obtained [38]:
μ k = i = 1 n p x | i V i ( i ) i = 1 n V m 4 ( m ) i = 1 n p x | i V i ( i ) i = 1 n V m 3 ( m ) i = 1 n V i 2 ( i ) m = 1 n V m 4 ( m ) i = 1 n V i 3 ( i ) m = 1 n V m 3 ( m )
β p = i = 1 n p x | i V i 2 ( i ) m = 1 n V m 2 ( m ) i = 1 n p x | i V i ( i ) m = 1 n V m 3 ( m ) i = 1 n V i 2 ( i ) m = 1 n V m 4 ( m ) i = 1 n V i 3 ( i ) m = 1 n V m 3 ( m )
Through use of the above formulae, permeability and seepage factor under non-Darcy flow were acquired, where i and m indicate the points on the time series and n represents the total number of series points.

5.2. Changes in Permeability during Non-Darcy Seepage

At a confining pressure of 10 MPa and different seepage pressures, the relationship between pore water pressure and time during non-Darcy seepage in sandstone is as shown in Figure 12 and the relationship between permeability and axial strain is demonstrated in Figure 13.
At a pore pressure of 1 MPa, the fitting equation for the relationship between pore pressure and time is given by:
P = 2 × 10 7 t 2 9 × 1 0 4 t + 0.9981
At an interval of 10 s, the pore pressure gradient is expressed as follows:
ξ = 2 × 10 6 t 2 9 × 10 3 t + 0.9981
According to Formula (7), the seepage velocity is given by:
V = 4.76 × 10 15 ( 2 × 10 6 t 2 9 × 1 0 3 t + 0.9981 )
Formula (13) indicates that the pore pressure gradient under non-Darcy seepage shows a second-order non-linear relationship with seepage velocity and the seepage is unstable. Under Darcy seepage, the pore pressure gradient has a linear relationship to the seepage velocity, indicating that permeability evolution under non-Darcy flow is completely different from that under Darcy flow.
Under different seepage pressures, permeabilities were calculated based on Darcy and non-Darcy flow change in the same interval, with an order of magnitude ranging from 10−15 m2 to 10−14 m2, while the change itself differs greatly. The permeability calculated based on Darcy flow shows a non-linear increasing trend, while that calculated on the basis of non-Darcy flow develops unsteadily, with a more obvious non-linear trend and multiple increase and decreases therein.

6. Discussion

6.1. Explanation of Certain Behavioral Phenomena

The reason for the V-shaped trend in permeability is that microcracks in the rock develop and coalesce into macrocracks and open fissures are thus developed so that water can rapidly flow through the fissures, thus rapidly increasing the permeability.
The S-shaped change in permeability is mainly attributed to the fact that a high confining pressure leads to plastic flow in sandstone and inhibits initiation and coalescence of new cracks, so that the rock samples tend to undergo dilation. In addition, the local rock skeleton can be crushed into many fine particles, some of these are moved during formation of the shear zone to block the original seepage channels, resulting in a quasi-constant permeability.
Within the test range, confining pressure and pore pressure have different degrees of influence on permeability in each stage of deformation of sandstone and the effects of confining pressure on permeability are greater than those of seepage pressure, which can be explained by Biot’s principle of effective stress. In the initial stage of deformation, Biot’s coefficient is small in sandstone specimens. When the confining pressure is fixed, as the pore pressure increases, a small pore pressure exerts a limited influence on the effective stress and correspondingly the change in permeability is small. At a constant seepage pressure, when increasing the confining pressure, the initial effective confining pressure increases. The degree of compaction of microcracks and open pores is greater, and both the number and width of seepage channels decrease. Moreover, Biot’s coefficient and the permeability decrease. During non-linear deformation, many microcracks are generated and some closed pores are connected to form open pores. Biot’s coefficient increases, and the high pore pressure reduces the effective confining pressure and accelerates crack generation and propagation, thus increasing the permeability. In this stage, confining pressure and pore pressure significantly affect the permeability, and as the confining pressure is much greater than the seepage pressure, the confining pressure exerts the greater effect on the permeability.

6.2. Existing Problems

At a confining pressure of 30 MPa, sandstone undergoes a brittle–ductile transition and the permeability remains unchanged with increasing volumetric strain, which is contrary to the conventional understanding of the positive correlation between permeability and volumetric strain. It remains unclear whether this is caused by the calculation error in volumetric strain. The circumferential deformation in different parts of the samples is extremely uneven. In the test, the chain for testing the circumferential strain is placed in the middle of the samples, so the measured circumferential strain is relatively large. According to experience, the final value of the circumferential strain is taken as half of the measured value, which possibly leads to error in the calculation of volumetric strain. The effect of calculation error in the volumetric strain on the final processing of the test results warrants further investigation.
At present, there is no effective method with which to characterize the dissipation of pore pressure gradient, therefore, by referring to Forchheimer’s equation for non-Darcy seepage, the seepage characteristics of sandstone were studied and permeabilities of sandstone specimens calculated based on Darcy flow and non-Darcy flow differ significantly. The determination of whether the fluid is in a Darcy or non-Darcy flow state during seepage is a key factor affecting the calculation accuracy of seepage in rock, because different seepage states need to be described using different equations, but there is no uniform criterion yet available to judge the state.
The characteristics of non-Darcy flow can be described using the Forchheimer equation; however, it is very difficult to consider all influencing factors in the equation, so the Forchheimer equation is generally fitted using test data, followed by determination of the coefficient [39,40].

7. Conclusions

  • The permeability first decreases and exhibits two distinct trends: a V-shaped increase and a S-shaped plateau in the non-linear stage. The greater the seepage pressure, the more obvious the V-shaped trend in permeability. With increasing confining pressure, the variation in the permeability gradually changes from V-shaped to S-shaped.
  • Compared with the case at a high confining pressure, under low confining pressure, the increase in permeability appears earlier, and the permeability rises faster. Moreover, the decrease in permeability happens faster and the time at which it increases again is earlier. The confining pressure exerts a greater effect on the permeability than the seepage pressure.
  • In comparison with the axial strain, volumetric strain better reflects any changes in permeability during compaction and dilation of the specimens. In the compaction stage, the permeability first decreases, then stabilizes with decreasing volumetric strain. Upon dilation of the specimen, the permeability increases rapidly with increasing volumetric strain.
  • The crack initiation stress, dilation stress, and peak stress all increase with the effective confining pressure, while decreasing with increasing seepage pressure. Failure of sandstone specimens under hydro-mechanical coupling is governed by the Mogi–Coulomb strength criterion.
  • Permeabilities calculated based on Darcy flow and non-Darcy flow vary within the same range, while the changes therein differ significantly in terms of process: under non-Darcy flow, dissipation of pore pressure gradient and changes in permeability are significantly non-linear.

Author Contributions

Writing—original draft preparation, S.J.; writing—review and editing, L.Z.; writing—critical revision, J.Y. All authors have read and agreed to the published version of the manuscript.

Funding

This research was funded by the National Science Foundation of China grant number 41472270.

Conflicts of Interest

The authors declare no conflict of interest.

References

  1. Tsang, C.F.; Stephansson, O.; Jing, L.; Kautsky, F. Decovalex project: From 1992 to 2007. Environ. Geol. 2009, 57, 1221–1237. [Google Scholar] [CrossRef]
  2. Zhao, Y.S. Multi-field coupling theory of porous media and its engineering applications. Sci. Press 2010, 27, 171–230. [Google Scholar]
  3. Ferfera, F.M.R.; Sarda, J.P.; Bouteca, M.; Vincke, O. Experimental study of monophasic permeability changes under various stress paths. Int. J. Rock Mech. Min. Sci. 1997, 34, 1–12. [Google Scholar] [CrossRef]
  4. Wang, H.L.; Xu, W.Y.; Shao, J.F.; Skoczylas, F. The gas permeability properties of low permeabilit rock in the process of triaxial compression test. Mater. Lett. 2014, 116, 386–388. [Google Scholar] [CrossRef]
  5. Liu, L.; Xu, W.Y.; Wang, H.L.; Wang, W.; Wang, R.B. Permeability evolution of granite gneiss during triaxial creep tests. Rock Mech. Rock Eng. 2016, 49, 3455–3462. [Google Scholar] [CrossRef]
  6. Park, H.D.; Wang, J.A. Fluid permeability of sedimentary rocks in a complete stress-strain process. Eng. Geol. 2012, 63, 291–300. [Google Scholar]
  7. Otto, S.; Till, P.; Hartmut, K. Development of damage and permeability in deforming rock salt. Eng. Geol. 2001, 61, 163–180. [Google Scholar]
  8. Tzelepis, V.; Moutsopoulos, K.N.; Papaspyros, J.N.E.; Tsihrintzis, V.A. Experimental investigation of flow behavior in smooth and rough artificial fractures. J. Hydrol. 2015, 521, 108–118. [Google Scholar] [CrossRef]
  9. Wang, Q.; Zhan, H.; Tang, Z. Forchheimer flow to a well-considering time-dependent critical radius. Hydrol. Earth Syst. Sci. 2014, 18, 2437–2448. [Google Scholar] [CrossRef] [Green Version]
  10. Aulisa, E.; Ibragimov, A.; Toka, M. Geometric framework for modeling nonlinear flows inporous media and its applications in engineering. Nonlinear Anal. Real World Appl. 2010, 11, 1734–1751. [Google Scholar] [CrossRef]
  11. Yu, J.; Liu, G.Y.; Cai, Y.; Zhou, J.F. Time-dependent deformation mechanism for swelling soft-rock tunnels in coal mines and its mathematical deduction. Int. J. Geomech. 2020, 20, 04019186. [Google Scholar] [CrossRef]
  12. Tang, J.; Shao, J.F.; Xu, W.Y.; Zhou, C.B. Experimental investigation and micromechanical analysis of damage and permeability variation in brittle rocks. Int. J. Rock Mech. Min. Sci. 2010, 47, 703–713. [Google Scholar]
  13. Oda, M.; Takemura, T.; Aoki, T. Damage growth and permeability change in triaxial compression tests of Inada granite. Mech. Mater. 2002, 34, 313–331. [Google Scholar] [CrossRef]
  14. Mitchell, T.M.; Faulkner, D.R. Towards quantifying the matrix permeability of fault damage zones in low porosity rocks. Earth Planet. Sci. Lett. 2012, 339, 24–31. [Google Scholar] [CrossRef]
  15. Alkan, H. Percolation model for dilatancy-induced permeability of the excavation damaged zones in rock salt. Int. J. Rock Mech. Min. Sci. 2009, 46, 69–79. [Google Scholar] [CrossRef]
  16. Nara, Y.; Meredith, P.G.; Yoneda, T.; Kaneko, K. Influence of macro-fractures and microfracture on permeability and elastic wave velocities in basalt at elevated pressure. Tectonophysics 2011, 50, 52–59. [Google Scholar] [CrossRef] [Green Version]
  17. Pereira, J.M.; Arson, C. Retention and permeability properties of damaged porous rocks. Comput. Geotech. 2013, 48, 272–282. [Google Scholar] [CrossRef] [Green Version]
  18. Liu, Z.B.; Xie, S.Y.; Shao, J.F.; Conil, N. Multi-step triaxial compressive creep behaviour and induced gas permeability change of clay-rich rock. Géotechnique 2018, 68, 281–289. [Google Scholar] [CrossRef]
  19. Li, S.P.; Li, Y.S.; Wu, Z.Y. The permeability-strain equations relating to complete stress-strain path of the rock. Chin. J. Geotech. Eng. 1995, 17, 13–19. [Google Scholar]
  20. Pradip Kumar, G.N.; Venkataraman, P. Non-Darcy converging flow through coarse granular media. J. Inst. Eng. Civ. Eng. Div. 1995, 76, 6–11. [Google Scholar]
  21. Legrand, J. Revisited analysis of pressure drop in flow through crushed rocks. J. Hydraul. Eng. 2002, 128, 1027–1031. [Google Scholar] [CrossRef]
  22. Ohnson, J.; Brown, S.; Steckman, H. Fluid flow and mixing in rough-walled fracture intersections. J. Geophys. Res. Solid Earth 2006, 111, 1–16. [Google Scholar] [CrossRef]
  23. Qian, J.Z.; Zhan, H.B.; Luo, S.H.; Zhao, W. Experimental evidence of scale-dependent hydraulic conductivity for fully developed turbulent flow in a single fracture. J. Hydrol. 2007, 339, 206–215. [Google Scholar] [CrossRef]
  24. Zhang, Z.Y.; Nemcik, J. Fluid flow regimes and nonlinear flow characteristics in deformable rock fractures. J. Hydrol. 2013, 47, 139–151. [Google Scholar] [CrossRef]
  25. Zou, L.C.; Jing, L.R.; Cvetkovic, V. Roughness decomposition and nonlinear fluid flow in a single rock fracture. Int. J. Rock Mech. Min. Sci. 2015, 75, 102–118. [Google Scholar] [CrossRef]
  26. Wen, Z.; Huang, G.; Zhan, H. An analytical solution for non-Darcian flow in a confined aquifer using the power law functione. Adv. Water Resour. 2008, 31, 44–55. [Google Scholar] [CrossRef]
  27. Wu, Y.S. Numerical Simulation of Single-phase and Multiphase Non-Darcy Flow in Porous and Fractured Reservoirs. Transp. Porous Media 2002, 49, 209–240. [Google Scholar] [CrossRef]
  28. Zhou, H.W.; Yang, S. Fractional derivative approach to non-Darcian flow in porous media. J. Hydrol. 2018, 566, 910–918. [Google Scholar] [CrossRef]
  29. Chen, Y.D.; Lian, H.J.; Liang, W.G.; Yang, J.F.; Nguyen, V.P.; Bordas, S.P.A. The influence of fracture geometry variation on non-Darcy flow in fractures under confining stresses. Int. J. Rock Mech. Min. Sci. 2019, 113, 59–71. [Google Scholar] [CrossRef]
  30. Qin, Y.P.; Luo, W.; Yang, X.B. Study on parameters quantification of Horkheimer equation and the critical point of Darcy transition to Non-Darcy flow. J. Southwest Jiao Tong Univ. 2018, 12, 1–8. [Google Scholar]
  31. Zeng, F.H.; Zhao, G. The optimal hydraulic fracture geometry under non-Darcy flow effects. J. Pet. Sci. Eng. 2010, 72, 143–157. [Google Scholar] [CrossRef]
  32. Yu, B.Y.; Chen, Z.Q.; Ding, Q.L.; Wang, L.Z. Non-Darcy flow seepage characteristics of saturated broken rocks under compression with lateral constraint. Int. J. Rock Mech. Min. Sci. 2016, 26, 1145–1151. [Google Scholar] [CrossRef]
  33. Jin, Y.; Li, H.; Chen, X.; Cai, Y.Y.Y.; Wu, N.; Mu, K. Triaxial experimental study of associated permeability-deformation of sandstone uner hydro-mechanical coupling. Chin. J. Rock Mech. Eng. 2013, 32, 1203–1213. [Google Scholar]
  34. Martin, C.D.; Chandler, N.A. The progressive fracture of Lac du Bonnet granite. J. Rock Mech. Min. Sci. Geomech. Abstr. 1994, 31, 643–659. [Google Scholar] [CrossRef]
  35. Zhang, L.M.; Cong, Y.; Meng, F.Z.; Guo, S. Energy evolution analysis and failure criteria for rock under different stress paths. Acta Geotech. 2020. [Google Scholar] [CrossRef]
  36. Mogi, K. Fracture and flow of rocks under high triaxial compression. J. Geophys. Res. 1971, 76, 1255–1269. [Google Scholar] [CrossRef]
  37. Zhang, L.M.; Gao, S.; Wang, Z.Q.; Ren, M. Analysis on deformation characteristics and energy dissipation of marble under different unloading rates. Teh. Vjesn. 2014, 21, 987–993. [Google Scholar]
  38. Sun, M.G.; Huang, X.W.; Li, T.Z.; Lei, G.Y.; Mao, X.B. Seepage properties of non-Darcy flow in complete failure process of limestone. Chin. J. Rock Mech. Eng. 2006, 25, 484–491. [Google Scholar]
  39. Qian, J.Z.; Wang, M.; Zhang, Y.; Zhao, W.D. Experimental study of the transition from non-Darcian to Darcy behavior for flow through a single fracture. J. Hydrodyn. 2015, 27, 679–688. [Google Scholar] [CrossRef]
  40. Quinn, P.M.; Cherry, J.A.; Parker, B.L. R Quantification of non-Darcian flow observed during packer testing in fractured sedimentary rock. Water Resour. Res. 2011, 47, 1–15. [Google Scholar] [CrossRef]
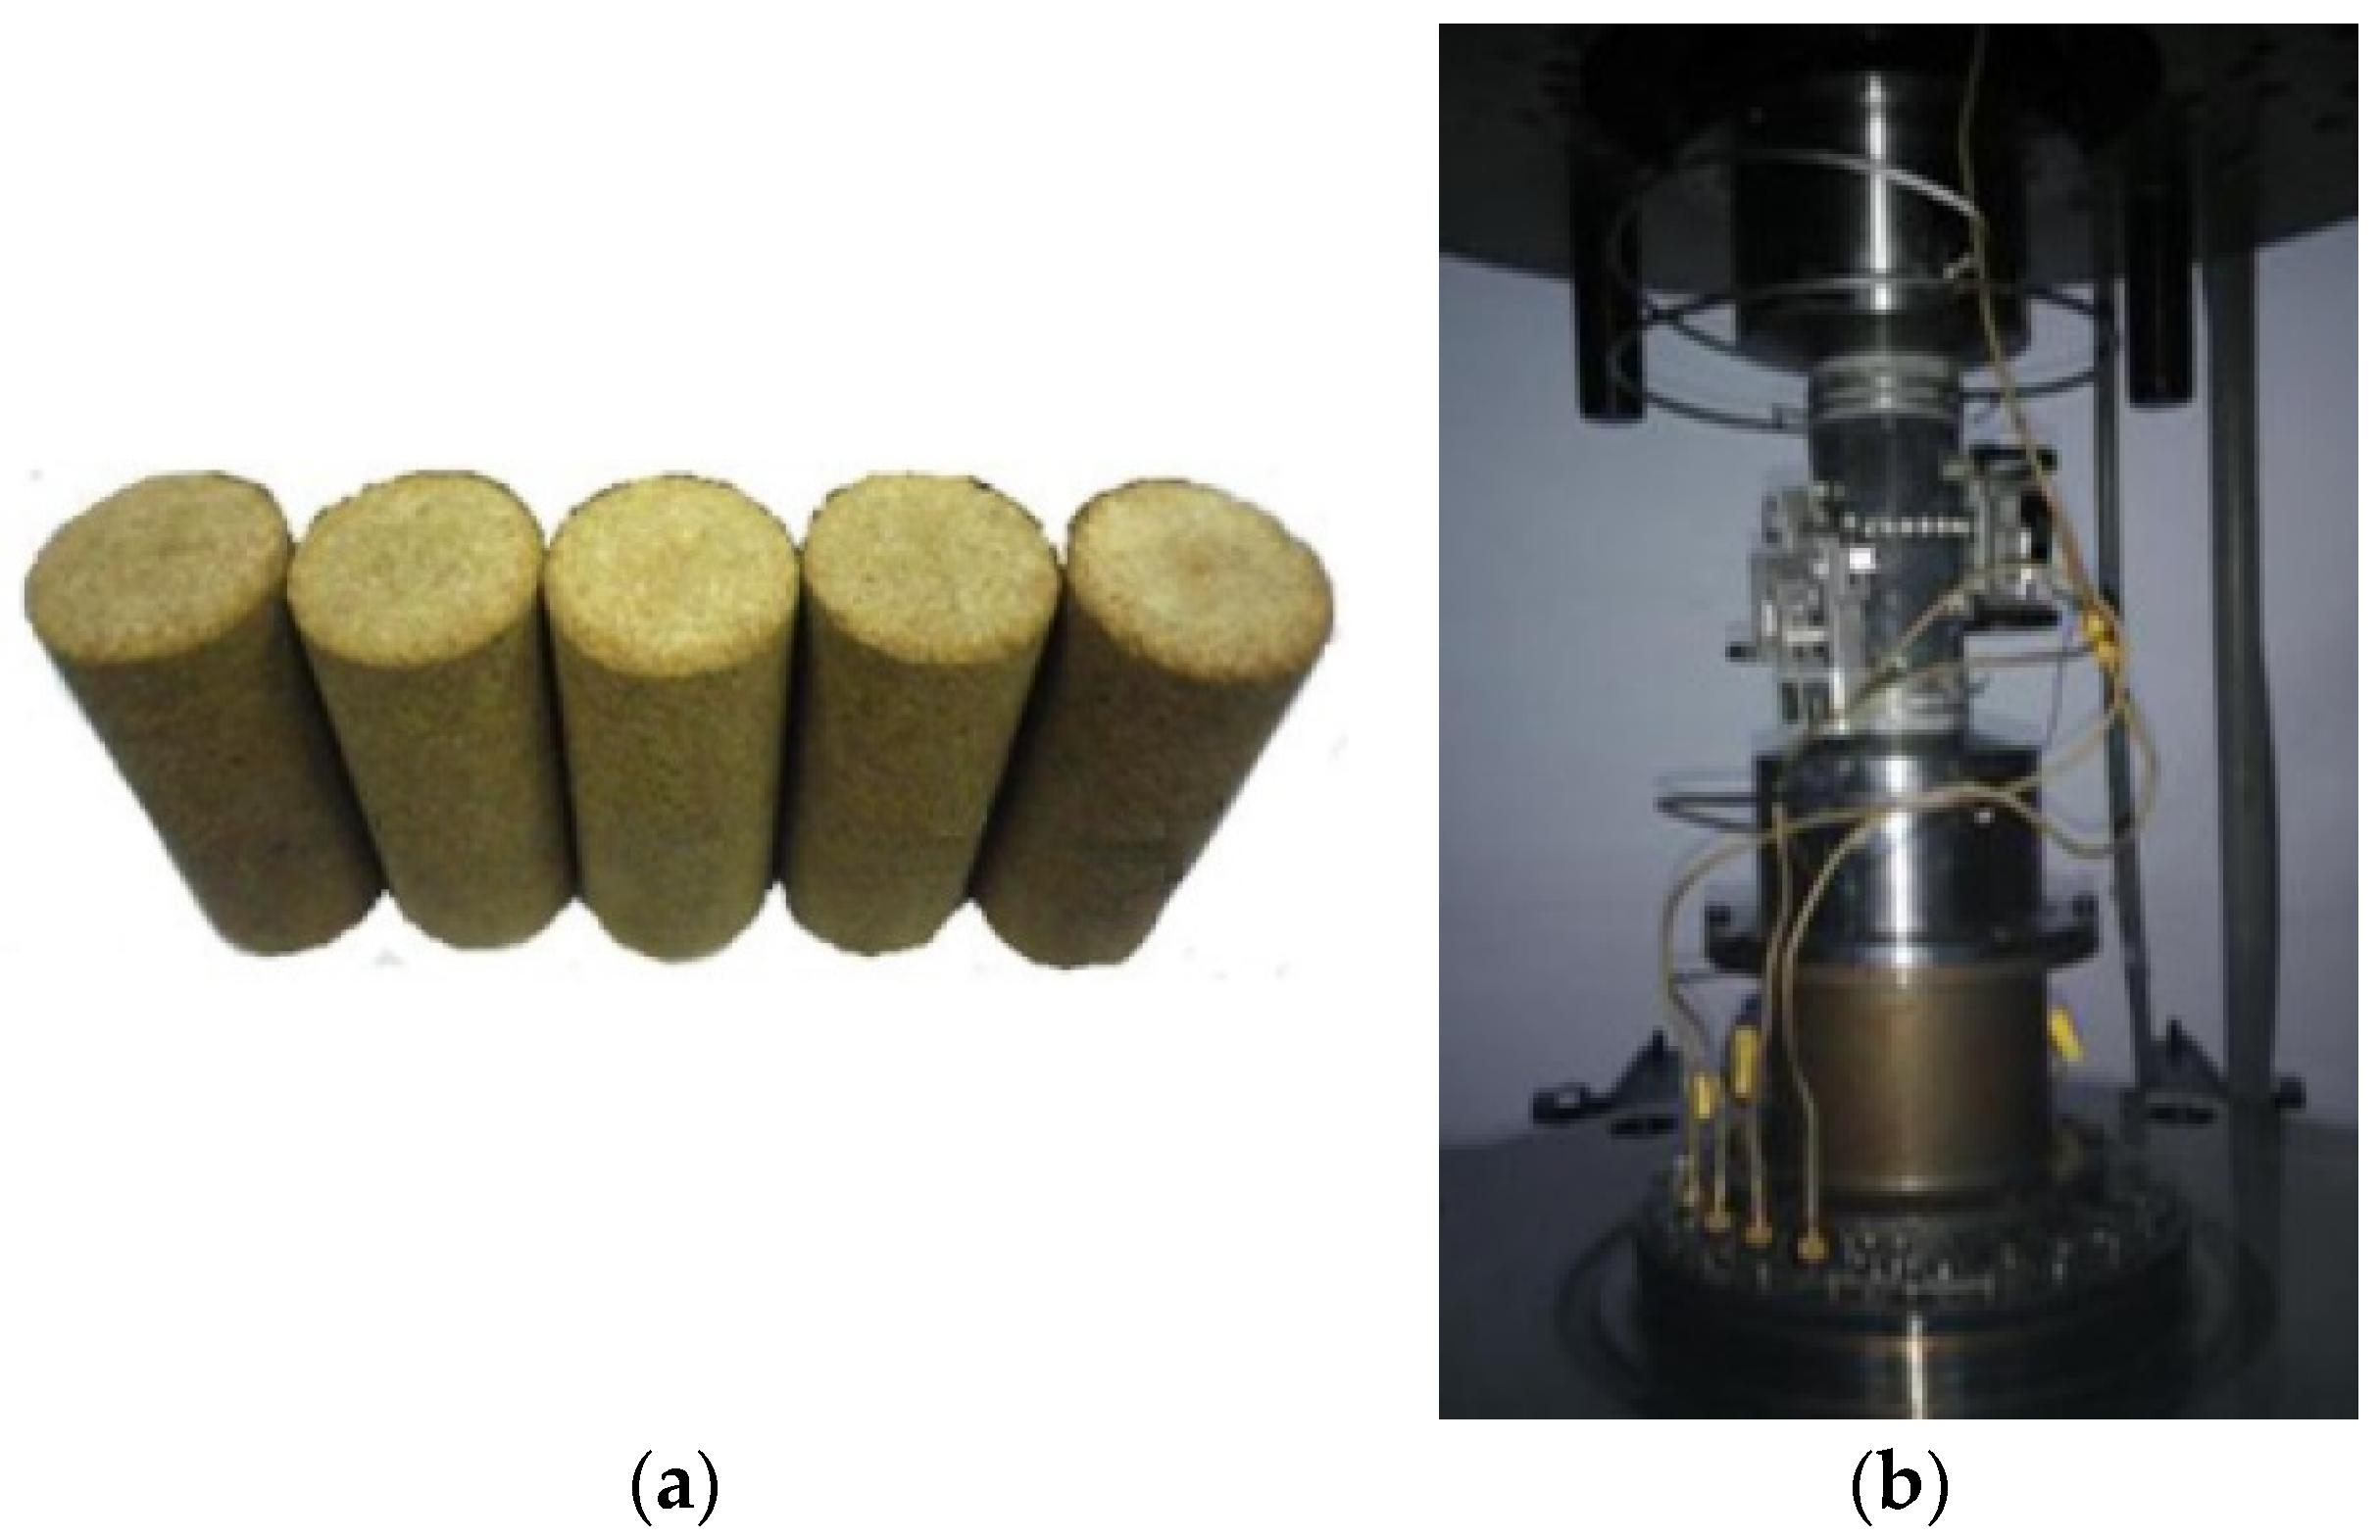
Figure 1. Photo of sandstone samples stress–strain curves of sandstone during failure under hydro-mechanical coupling. (a) Sandstone samples; (b) the mounted sample.
Energies 13 05065 g001
Figure 2. Typical modes of failure of the rock specimens (a) Confining pressure 10 MPa, (b) Confining pressure 20 MPa, (c) Confining pressure 30 MPa [33] Reproduced from [33], Science Press (in Chinese): 2013.
Energies 13 05065 g002
Figure 3. Stress–strain curves of sandstone during deformation under conventional triaxial compression.
Energies 13 05065 g003
Figure 4. Stress–strain curves of sandstone during failure under hydro-mechanical coupling (a) Confining pressure 10 MPa, (b) Confining pressure 20 MPa, (c) Confining pressure 30 MPa.
Energies 13 05065 g004
Figure 5. Relationship between the crack initiation stress and effective confining pressure.
Energies 13 05065 g005
Figure 6. Relationship between the dilatancy stress and effective confining pressure.
Energies 13 05065 g006
Figure 7. Mogi–Coulomb strength criterion: fitted data.
Energies 13 05065 g007
Figure 8. Volumetric strain, axial strain and permeability, axial strain of sandstone under different confining pressures. (a) Confining pressure 10 MPa; (b) confining pressure 20 MPa; (c) confining pressure 30 MPa.
Energies 13 05065 g008
Figure 9. Volumetric strain, axial strain and permeability, axial strain of sandstone under different seepage pressures, (a) Pore pressure 1 MPa; (b) pore pressure 4 MPa; (c) pore pressure 7 MPa.
Energies 13 05065 g009
Figure 10. Relationship between permeability and volumetric strain of sandstone under different confining pressures. (a) Confining pressure 10 MPa; (b) confining pressure 20 MPa; (c) confining pressure 30 MPa.
Energies 13 05065 g010aEnergies 13 05065 g010b
Figure 11. Relationship between permeability and volumetric strain of sandstone under different seepage pressures. (a) Pore pressure 1 MPa; (b) pore pressure 4 MPa; (c) pore pressure 7 MPa.
Energies 13 05065 g011aEnergies 13 05065 g011b
Figure 12. Relationship between pore water pressure and time during non-Darcy seepage in sandstone. (a) Pore pressure 1 MPa; (b) pore pressure 4 MPa; (c) pore pressure 7 MPa.
Energies 13 05065 g012
Figure 13. Comparison of permeability changes calculated based on Darcy and non-Darcy flow under different seepage pressures. (a) Pore pressure 1 MPa; (b) pore pressure 4 MPa; (c) pore pressure 7 MPa.
Energies 13 05065 g013
Table 1. Initial permeabilities and strengths of sandstone under different confining, and seepage, pressures.
Confining Pressure/MPaSeepage Pressure/MPaInitial Permeability/10−15 m2Peak Strength/MPa
0--66.9
10-85.3
200120.2
30 140.2
1011.7982.7
1044.4374.1
1076.2767.1
2010.53119.0
2041.44114.1
2072.64106.0
3010.34138.9
3040.35134.6
3070.36134.4
Table 2. The characteristic stress on sandstone under different effective confining pressures.
Effective Confining Pressure/MPaCrack Initiation Stress/MPaDilation Initiation Stress/MPaPeak Stress/MPa
346.153.667.1
652.264.374.1
952.470.482.7
1380.195.8106.0
1681.296.5114.1
1978.296.0119.0
2394.5115.7134.4
2692.2121.0134.6
2990.5121.4138.9
1055.872.385.3
2079.198.0120.2
3095.1121.5140.2