Article

Multiscale Modeling for Reversible Solid Oxide Cell Operation

1
Department of Civil, Chemical and Environmental Engineering, University of Genova, Via Opera Pia 15, 16145 Genova, Italy
2
Department of Engineering, University of Perugia, Via Duranti 93, 06125 Perugia, Italy
*
Author to whom correspondence should be addressed.
Energies 2020, 13(19), 5058; https://doi.org/10.3390/en13195058
Submission received: 4 September 2020 / Revised: 22 September 2020 / Accepted: 23 September 2020 / Published: 25 September 2020
(This article belongs to the Special Issue Electrocatalysts for Fuel Cells and Hydrogen Production)

Abstract

:
Solid Oxide Cells (SOCs) can work efficiently in reversible operation, allowing the energy storage as hydrogen in power to gas application and providing requested electricity in gas to power application. They can easily switch from fuel cell to electrolyzer mode in order to guarantee the production of electricity, heat or directly hydrogen as fuel depending on energy demand and utilization. The proposed modeling is able to calculate effectively SOC performance in both operating modes, basing on the same electrochemical equations and system parameters, just setting the current density direction. The identified kinetic core is implemented in different simulation tools as a function of the scale under study. When the analysis mainly focuses on the kinetics affecting the global performance of small-sized single cells, a 0D code written in Fortran and then executed in Aspen Plus is used. When larger-scale single or stacked cells are considered and local maps of the main physicochemical properties on the cell plane are of interest, a detailed in-home 2D Fortran code is carried out. The presented modeling is validated on experimental data collected on laboratory SOCs of different scales and electrode materials, showing a good agreement between calculated and measured values and so confirming its applicability for multiscale approach studies.

1. Introduction

In view of the continuous increase in energy needs and derived environmental issues, a strict normative has been introduced to favor the development of more sustainable processes [1]. The high emissions of Greenhouse Gas (GHG) mainly from artificial sources such as power plants and transport sectors are one of the leading causes of pollution. Indeed, GHG atmospheric concentration is almost doubled from the preindustrial period to the current days [2]. The global goal is the achievement of thermoneutrality by 2050. This means that a balance between the emissions due to human activities and the needed GHG reduction must be achieved [3]. For this reason, renewable sources have been incentivized to decrease common fossil fuel extraction. However, their high uncertainty and irregular geographical distribution have limited their spread on the energy market. Several storage systems have been studied to provide the energy produced through renewable sources when it is actually required. Some possible storage examples are capacitors, batteries, superconducting magnetic energy systems, flywheels, aquifer energy storage systems, compressed air devices, pumped hydro and chemical storages [4,5]. Among these, only the last ones can guarantee long-term applications and an easy control discharge. Moreover, since the pumped hydro storage needs specific land features, the best solution results in the use of chemical energy carriers of which hydrogen is the most important [6]. H2 can be used directly as fuel [7,8] or alternatively converted into other fuels, if a proper net distribution is not available. The addition of a downstream methanation unit permits to obtain synthetic natural gas that can be directly fed in existing pipelines [9]. Light hydrocarbons are derived from the combination of electrolyzer and Fischer–Tropsch reactor [10]. In addition, also methanol [11,12] and ammonia [13] are interesting chemical carriers due to their high energy density.
There are several possible ways to synthesize H2 using thermochemical, biological or electrochemical processes. Natural gas steam reforming and coal gasification are the main routes in industrial applications, despite relevant environmental issues [6,14]. A more sustainable alternative consists of the use of biomass through gasification [15,16,17], pyrolysis [18] or biological treatments [19]. In all these cases, the product is a syngas with variable percentages of H2, H2O, CO, CO2 and light hydrocarbons. Differently, water dissociation by means of electrolysis cells allows for the production of emission-free H2 with a marked purity level [20]. Among different types of electrochemical cells, high-temperature molten carbon and solid oxide cells are the preferential designs as they guarantee optimized efficiency and low cost in both operation modes. Thus, fuel cell technologies might become the core of cogeneration plants producing electricity and heat at the same time [21,22]. On the other hand, a fraction of the requested power for the endothermicity of water dissociation is provided by the high working temperature as thermal energy [23,24]. In particular, reversible Solid Oxide Cells (rSOCs) have good electrical conductivity and fast kinetics, without requiring noble metals as catalysts. Since all layers are solid, their handling is easy and liquid leaks are nonexistent compared to other cell designs, such as Polymer Electrolyte Membrane Cells (PEMCs) [25]. Moreover, these low-temperature cells cannot reach high efficiency since the common catalysts used for oxygen reduction in fuel cell applications have low performance for oxygen evolution in electrolysis operation [26], therefore requiring the use of two distinct units [27]. Contrarily, ceramic materials are effective catalysts for both modes, making SOC a bifunctional unit.
rSOCs have been widely investigated from theoretical, environmental and economical points of view. The basic application consists of standalone systems that provide the requested energy as electricity and heat in isolated microgrids or self-sufficient buildings [28]. rSOCs can be integrated into existing electricity–gas networks where H2 is also directly used for public transport. In comparison with current fossil fuel-based configurations, the GHG emissions can be decreased by 5–50% [29,30]. Moreover, these cells allow revamping industrial plants in order to optimize the internal energy cycle [31]. In all these fields, a proper simulation is fundamental to study the feasibility of proposed alternative energy production routes. SOC electrochemistry prediction is the main challenging aspect. Different specific kinetics are presented for Solid Oxide Fuel Cell (SOFC) [32,33] and Solid Oxide Electrolyzer Cell (SOEC) [24,34]. Nonetheless, only a minor number of studies have been validated simultaneously for two modes using either a macroscale formulation or detailed microkinetic approach [35,36,37,38].
In this context, this study aims at presenting a multiscale rSOC modeling that can describe single and stacked cell performance for both operation modes. Depending on the application goal, the most suitable simulation tool has been chosen to minimize computational efforts. When a small-sized single cell has been tested, a 0D stationary model, written in Fortran and then integrated into the process simulation software Aspen Plus, has been used. In this case, the analysis has been focused mainly on the electrochemical kinetics identification to evaluate the global system performance. Differently from the common literature approach, both activation and diffusion polarizations have been derived from a rigorous formulation of the Butler–Volmer equation where temperature and gas composition dependencies are underlined. According to this approach, the diffusion overpotential term is influenced by reactant kinetic orders, whereas thermodynamic formulation is commonly followed in literature [39]. A home-made 2D Fortran code has been proposed for stack simulation to guarantee the local control of system behavior on the cell plane and to reduce the evolution of possible stressed working conditions. At both scales, the work has studied an anionic conductive electrolyte planar SOC configuration with different perovskite air electrodes, using as reference a semi-empirical kinetics approach developed and preliminarily validated only for fuel cell operation [40,41]. Then, the model has been tuned to simulate also SOEC behavior, considering that the detected SOFC formulation is still efficient when the same cell materials and designs are used. Firstly, fuel composition has been changed in order to verify the need to introduce the reactant dependency on activation polarization terms in both modes. Subsequently, the stack thermal behavior has been also modeled to evaluate temperature gradients due to occurring reactions. A good match between simulated and experimental rSOC performance in a wide range of working conditions has confirmed the validity of the proposed general approach at both single and stacked cell level and in two operation modes.

2. rSOC Modeling

A multiscale study is a common approach in chemical engineering, since it allows the use of the most effective simulation tool, in view of the available and requested level of detail [42]. When a small-sized cell is considered, high-level modeling requires relevant simulation time without providing more useful data on the system operation. At this scale, the cell surface has a quite homogeneous behavior, and it can be considered as a perfect stirred reactor. On the contrary, larger-scale units need a more specific investigation to highlight the influence of physicochemical property changes on global cell performance. In this case, the model can also be refined to obtain a better match with system behavior, introducing different kinetics equations and parameters in function of the considered point on the cell plane [43].
In view of the specific scale of analyzed case studies, two simulation tools have been used. A 0D code written in Fortran and implemented in Aspen Plus has allowed evaluating global cell performance by solving material and energy balances at the anodic and cathodic sides. This modeling approach has been proposed to study small-scale single cells focusing on the electrokinetic formulation, thanks to a simulation tool that provides results in a few seconds due to minimum computational efforts. This simplified approach has allowed for a preliminary evaluation of the reversible cell operation, easily switching from fuel cell to electrolysis mode. In addition, the implementation in Aspen Plus has favored a quick and easy execution of sensitivity analysis and process investigation. The model has assumed that the system reaches the stationary working condition and all balances have been solved in the gas domain, considering the exchanges with cell solid elements from a macroscopic point of view.
When larger-scale single or stacked cells are under study, the local performance acquires relevance and the cell dimension can no longer be overlooked. In this case, a 2D simulation code, previously validated for SOFC [41] and here improved to model also the electrolysis operation, has been used. Assuming uniform operating conditions for stacked cells to reduce computational efforts, the simulation has converged in just one minute. Considering an isopotential behavior, anodic and cathodic planes have been divided into an optimized number of subelements, where steady-state material, energy, momentum and charge balances have been formulated (for a more detailed description refer to [44]). In particular, three domains have been considered: fuel electrode gas, air electrode gas and the single solid cell (i.e., anode, cathode, electrolyte and current collectors). The related differential equations have been solved introducing the finite difference approach to simplify the initial problem in a system of ordinary equations. Since each variable has been calculated at specific local conditions, a detailed description of the transport and reaction mechanisms occurring inside the cell has been obtained. Additional information has been provided, which cannot be easily measured at the experimental level such as gas composition, temperature and polarization loss distribution on the cell plane.

Electrochemical Kinetics for Fuel Cell and Electrolyzer Modes

The electrochemical kinetics focusing on the specific description of cell operations is the core of both SOFC and SOEC models. Taking as reference a previous work of the authors [40], a more detailed formulation has been developed considering also the possibility of SOEC mode without modifying the basic assumptions validated for SOFC.
An anionic conductive electrolyte cell type is considered. In these cells, O = species are the charge carriers between two electrodes thanks to the migration of oxygen vacancies present in electrolyte lattice that move in the opposite direction of the ions [45]. At each side, semiredox reactions occur as a function of the operation mode: H2 oxidation or steam reduction at the fuel electrode, O2 production or consumption at the air electrode (refer to Table 1).
The cell effective performance is evaluated starting from the equilibrium potential Eeq penalized by several contributions η that cause a reduction of the measured voltage in fuel cell operation and an increase during electrolysis (Equation (1)).
V SOC = E eq j | η j |
The equilibrium voltage is formulated according to the Nernst equation, considering operating temperature T and reactant composition in terms of partial pressure p (Equation (2)). Since it represents the potential at equilibrium condition, it is valid for both directions of the redox reaction.
E eq = E 0 ( T ) + R T z F ln ( p H 2 _ fuel p O 2 _ air 0.5 p H 2 O _ fuel )
where the reversible potential E0 is a function of temperature according to Equation (3) [39]:
E 0 ( T ) = 1.253 2.416 × 10 4 T
However, the effective value of OCV (Open Circuit Voltage) is lower due to the possible gas leakage phenomena or electron migrations inside the electrolyte. To consider this aspect, a term ηl is introduced as a further polarization loss (Equation (4)) [46,47].
O C V = E eq η l
The overpotential terms consider different resistances that penalize the electrochemical phenomena. A relevant penalization is due to the electron conductivity and the migration of O = ions from the fuel to the air electrode and vice versa, which are assumed as activated thermal processes following the Ohm law [44]. Consequently, the ohmic overpotential ηohm is expressed as Equation (5), showing a linear dependence on the applied current density J.
η ohm = R ohm J = P 1 T exp P 2 T J
where P1 and P2 are two empirical parameters specific for every case study.
The overpotential due to electrochemical reactions ηel is derived from the Butler–Volmer formulation that represents the rate-limiting step in the function of the applied current density [48]. It depends on the direct (i.e., oxidation) and indirect (i.e., reduction) reactions occurring at each electrode in the function of bulk partial pressures pbulk and Three Phase Boundary (TPB) partial pressures pTPB of the reactants (Equation (6)). Thus, the same kinetic approach has to be followed in both operation modes.
J = J 0 , el [ exp ( α z η el F R T ) i = 1 n ( p i , red _ TPB p i , red _ bulk ) 2 A i exp ( α z η el F R T ) i = 1 n ( p i , ox _ TPB p i , ox _ bulk ) 2 B i ]
When a low electric load is applied, the actual redox exchange is the slowest step and so reactant pressure gradients are a minimum value, i.e., the ratio between bulk and TPB values (pTPB/pbulk) equal to one (Equation (7)).
| J J 0 , el | = [ exp ( α z η act , el F R T ) exp ( α z η act , el F R T ) ]
Equation (7) can be rewritten according to a hyperbolic sine formulation for the activation polarization ηact, depending on temperature and reactant compositions [49]. Only bulk values are considered since diffusion issues along electrode thickness are negligible at low current density [40]. Equations (8) and (9) are formulated assuming atmospheric working pressure and the charge transfer coefficient α equal to 0.5. It is worth to underline that the exchange current density J0,el has to show the same dependencies on the working conditions (i.e., temperature and reactant composition) in both modes since it represents the forward and reverse electrode reaction rate at the equilibrium state [24,34].
η act , fuel = 2 R T z F sin h 1 | J 2 γ fuel ( y H 2 , fuel _ bulk ) A ( y H 2 O , fuel _ bulk ) B exp E act , fuel R T |
η act , air = 2 R T z F sin h 1 | J 2 γ air ( y O 2 , air _ bulk ) C exp   E act , air R T |
where the pre-exponential coefficients γ, the activation energies Eact and the reactant kinetics orders A, B and C are specific for every occurring reaction path.
Differently, when a high current density is applied, the gas diffusion inside the microstructure of the electrode becomes the rate-limiting step. This effect is represented by the diffusion overpotential ηdiff, which considers the difference between bulk and TPB partial pressures as driving force [50]. It is again derived from Butler–Volmer formulation (Equation (6)), but in this case, the electrochemical reaction is faster than transport mechanisms. Thus, the exchange current density J0,el representing the kinetic rate at equilibrium state tends to infinity at this condition (Equation (10)).
exp ( α z η diff , el F R T ) i = 1 n ( p i , red _ TPB p i , red _ bulk ) 2 A i exp ( α z η diff , el F R T ) i = 1 n ( p i , ox _ TPB p i , ox _ bulk ) 2 B i = 0
The concentration gradient at the oxygen electrode side is relevant only at very low O2 partial pressure (pO2 < 0.05 atm), so it is usually neglected in common working conditions with air feed [51]. Differently, the contribution at the fuel electrode for both operations is represented by using an equal formulation through the introduction of the absolute value in order to guarantee the right ratio among reactant compositions, independently from the current density direction (Equation (11)). By solving Equation (10) for the fuel electrode side and fixing α equal to 0.5, the diffusion overpotential is derived from Butler–Volmer equation in contrast with the common literature formulation. As Equation (11) shows, this results in the direct influence of the kinetic orders, previously evaluated in the exchange current density expression (Equation (8)), on gas partial pressures.
η diff , fuel = | R T z F ln ( i = 1 n ( p i , red _ bulk p i , red _ TPB ) 2 A i ( p i , ox _ TPB p i , ox _ bulk ) 2 B i ) |
To evaluate the reactant pressures at TBP active sites, material balances are solved along the fuel electrode thickness δfuel assuming a Fickian mechanism as the main transport phenomenon. Regarding the diffusion coefficients D, a combination of molecular and Knudsen terms is taken into account. H2 and H2O average values in the detected gas profile are considered as TPB partial pressures, as Equations (12) and (13) show for SOFC and SOEC modes, respectively (for a detailed description refer to [34,41]).
p H 2 , fuel _ TPB = p H 2 , fuel _ bulk J R T δ fuel 3 z F D H 2
p H 2 O , fuel _ TPB = p H 2 O , fuel _ bulk ± J R T δ fuel 3 z F D H 2 O
Substituting Equations (12) and (13) into Equation (11), the diffusion overpotential at fuel electrode ηdiff,fuel is estimated (Equation (14)). In this approach, the reaction is assumed to occur along electrode length and not only at the electrode–electrolyte interface [33], thanks to the mixed electron and ion conductivity of used ceramic materials.
η diff , fuel = | R T z F ln ( 1 ± R T δ fuel J 3 z F D H 2 O p H 2 O , fuel _ bulk ) 2 B ( 1 R T δ fuel J 3 z F D H 2 p H 2 , fuel _ bulk ) 2 A |
The proposed approach has been followed in both 0D and 2D simulation. In the first case, an average between input and output gas partial pressures has been considered as bulk composition. In the second case, specific values have been used in every defined subelement on the cell plane thanks to the local modeling.
In light of this final observation, a further term is introduced. The Nernst overpotential ηNernst considers the reference Open Circuit Voltage owing to the inhomogeneous concentration distribution that occurs on the cell plane under electric load. In the 2D approach, this term has not been considered, since it is possible to evaluate directly the cell behavior knowing actual local features in each subdomain [44]. Thus, it has been only added to the 0D modeling code. For both operations, Equation (15) defines this further overpotential as the difference of Open Circuit Voltage calculated in initial pin and average pav (i.e., between input and output values) conditions [52].
η Nernst = R T 2 z F ln ( p O 2 , air _ in p O 2 , air _ av ) + R T z F ln ( p H 2 , fuel _ in p H 2 O , fuel _ av   p H 2 , fuel _ av p H 2 O , fuel _ in   )
where the first term is referred to the air electrode contribution and the second to the fuel electrode one.
All these formulations are valid for both SOFC and SOEC operations, so that the model can easily switch between two operating modes by only changing the current direction without the need to modify kinetic parameters [37].

3. Results and Discussion

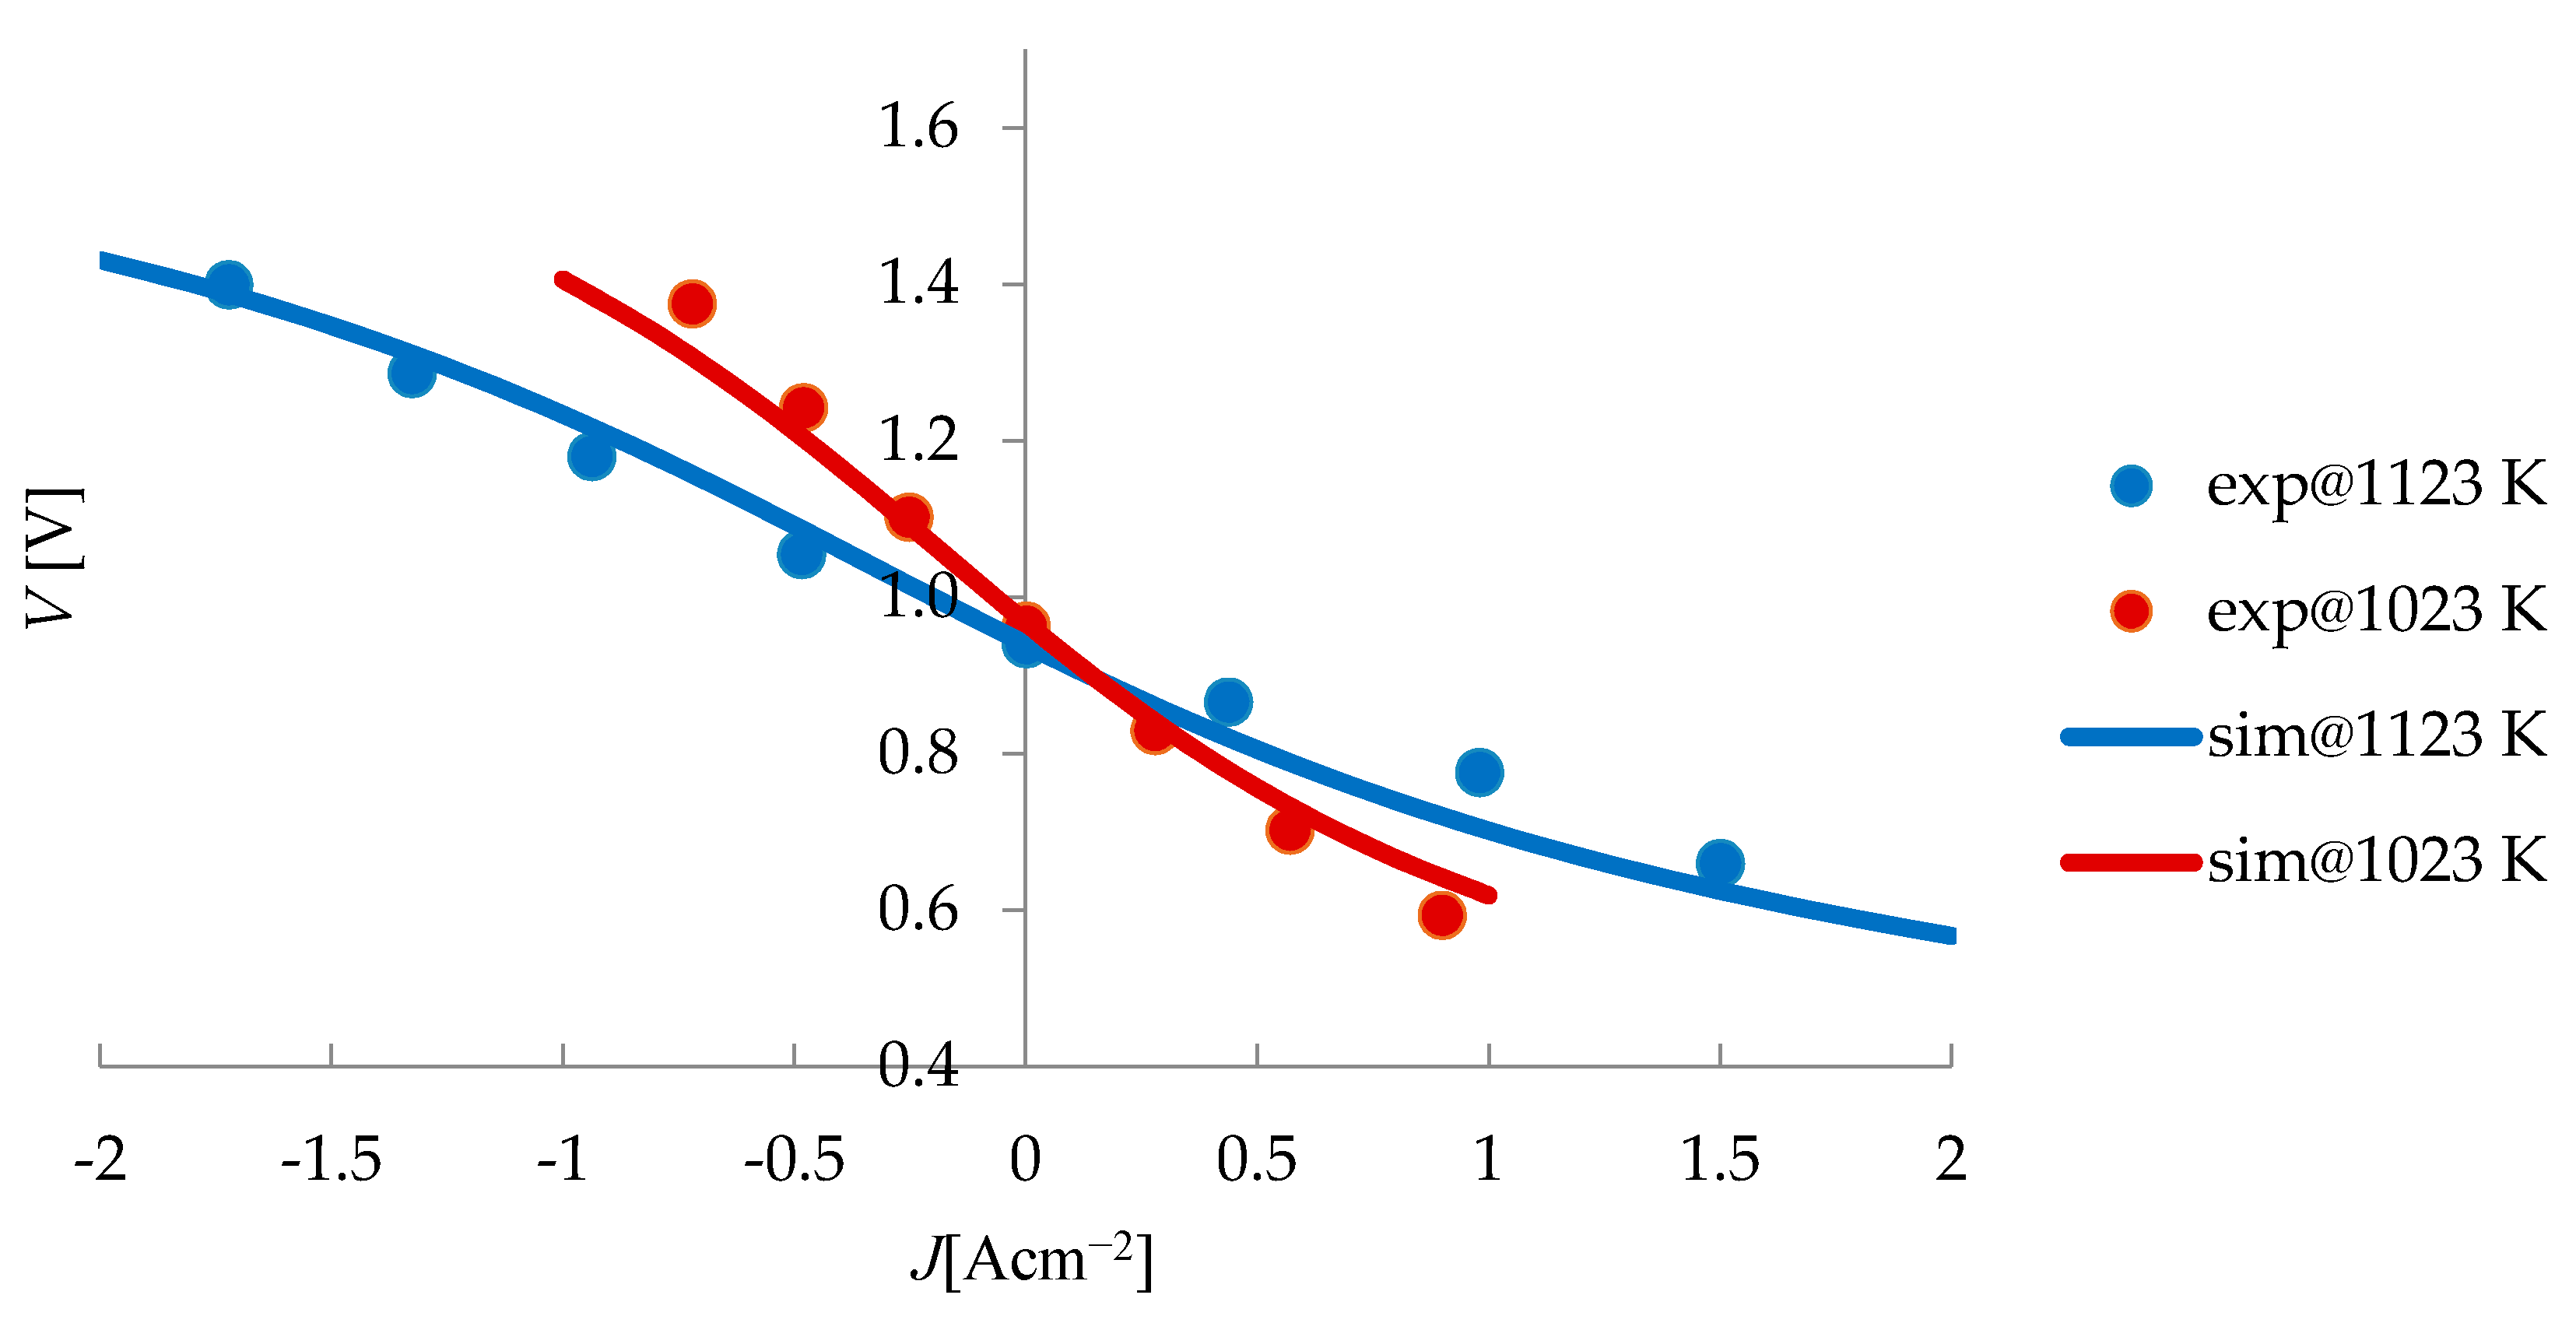
3.1. Zero-Dimensional (0D) Simulation of rSOC Small-Scale Single Cell

The 0D approach has been used to evaluate the global performance of a rSOC small-sized single cell. The analysis has been focused on electrochemical kinetics to verify if the proposed approach, previously validated only for fuel cell mode [40], can represent both operations.
The study has considered literature tests of a planar anionic conductive electrolyte cell with an active area equal to 8 cm2. The cell is structured by a porous Ni/YSZ (Ni/Yttria-stabilized Zirconia) layer fuel electrode that is the support for the YSZ electrolyte and LSM (Lanthanum Strontium Manganite) air electrode [53]. Dry air is fed to the air electrode, whereas an H2/H2O mixture is used at the fuel electrode side working at constant flow rates (0.14 and 0.025 m3 h−1, respectively).
The set of parameters necessary for the application of the above described semi-empirical kinetics model has been identified through the fitting of experimental polarization curves (Table 2).
The different kinetics parameters derived from the fitting of experimental results are comparable with previous reference studies. Activation energies are usually assumed equal to 100 and 120 kJ mol−1 for fuel and air electrode, respectively [38]. Pre-exponential coefficients are set between 104 and 106 A cm−2 [51], whereas reaction orders vary from −0.5 to 2 in SOFC operation [54]. These values should be the same for SOEC mode, yet the common literature approach [11,34,38] neglects reactant dependencies in activation overpotentials, differently from the proposed formulation (Equations (8) and (9)). All few studies follow this method: for instance, the fuel electrode reaction orders are equal to 0.11 and 0.67 for A and B, respectively, while γfuel results in 2.5 × 10⁵ A cm−2 in [36]. Such values are quite similar to the identified ones.
The model has been validated for both operating modes, testing cell behavior at 50/50 H2/H2O mixture as the fuel electrode feed and two different temperatures (i.e., 1023 and 1123 K). As Figure 1 shows, a good match between experimental and simulated results has been obtained confirming the possibility to use the same set of parameters. Only the current direction has to be updated switching from electrolysis to fuel cell mode. Detected trends confirm the relevant influence of the temperature on cell performance, due to a thermally occurring activate transport and reaction phenomena. As expected, the temperature increase favors the cell voltage reducing overpotential contributions.

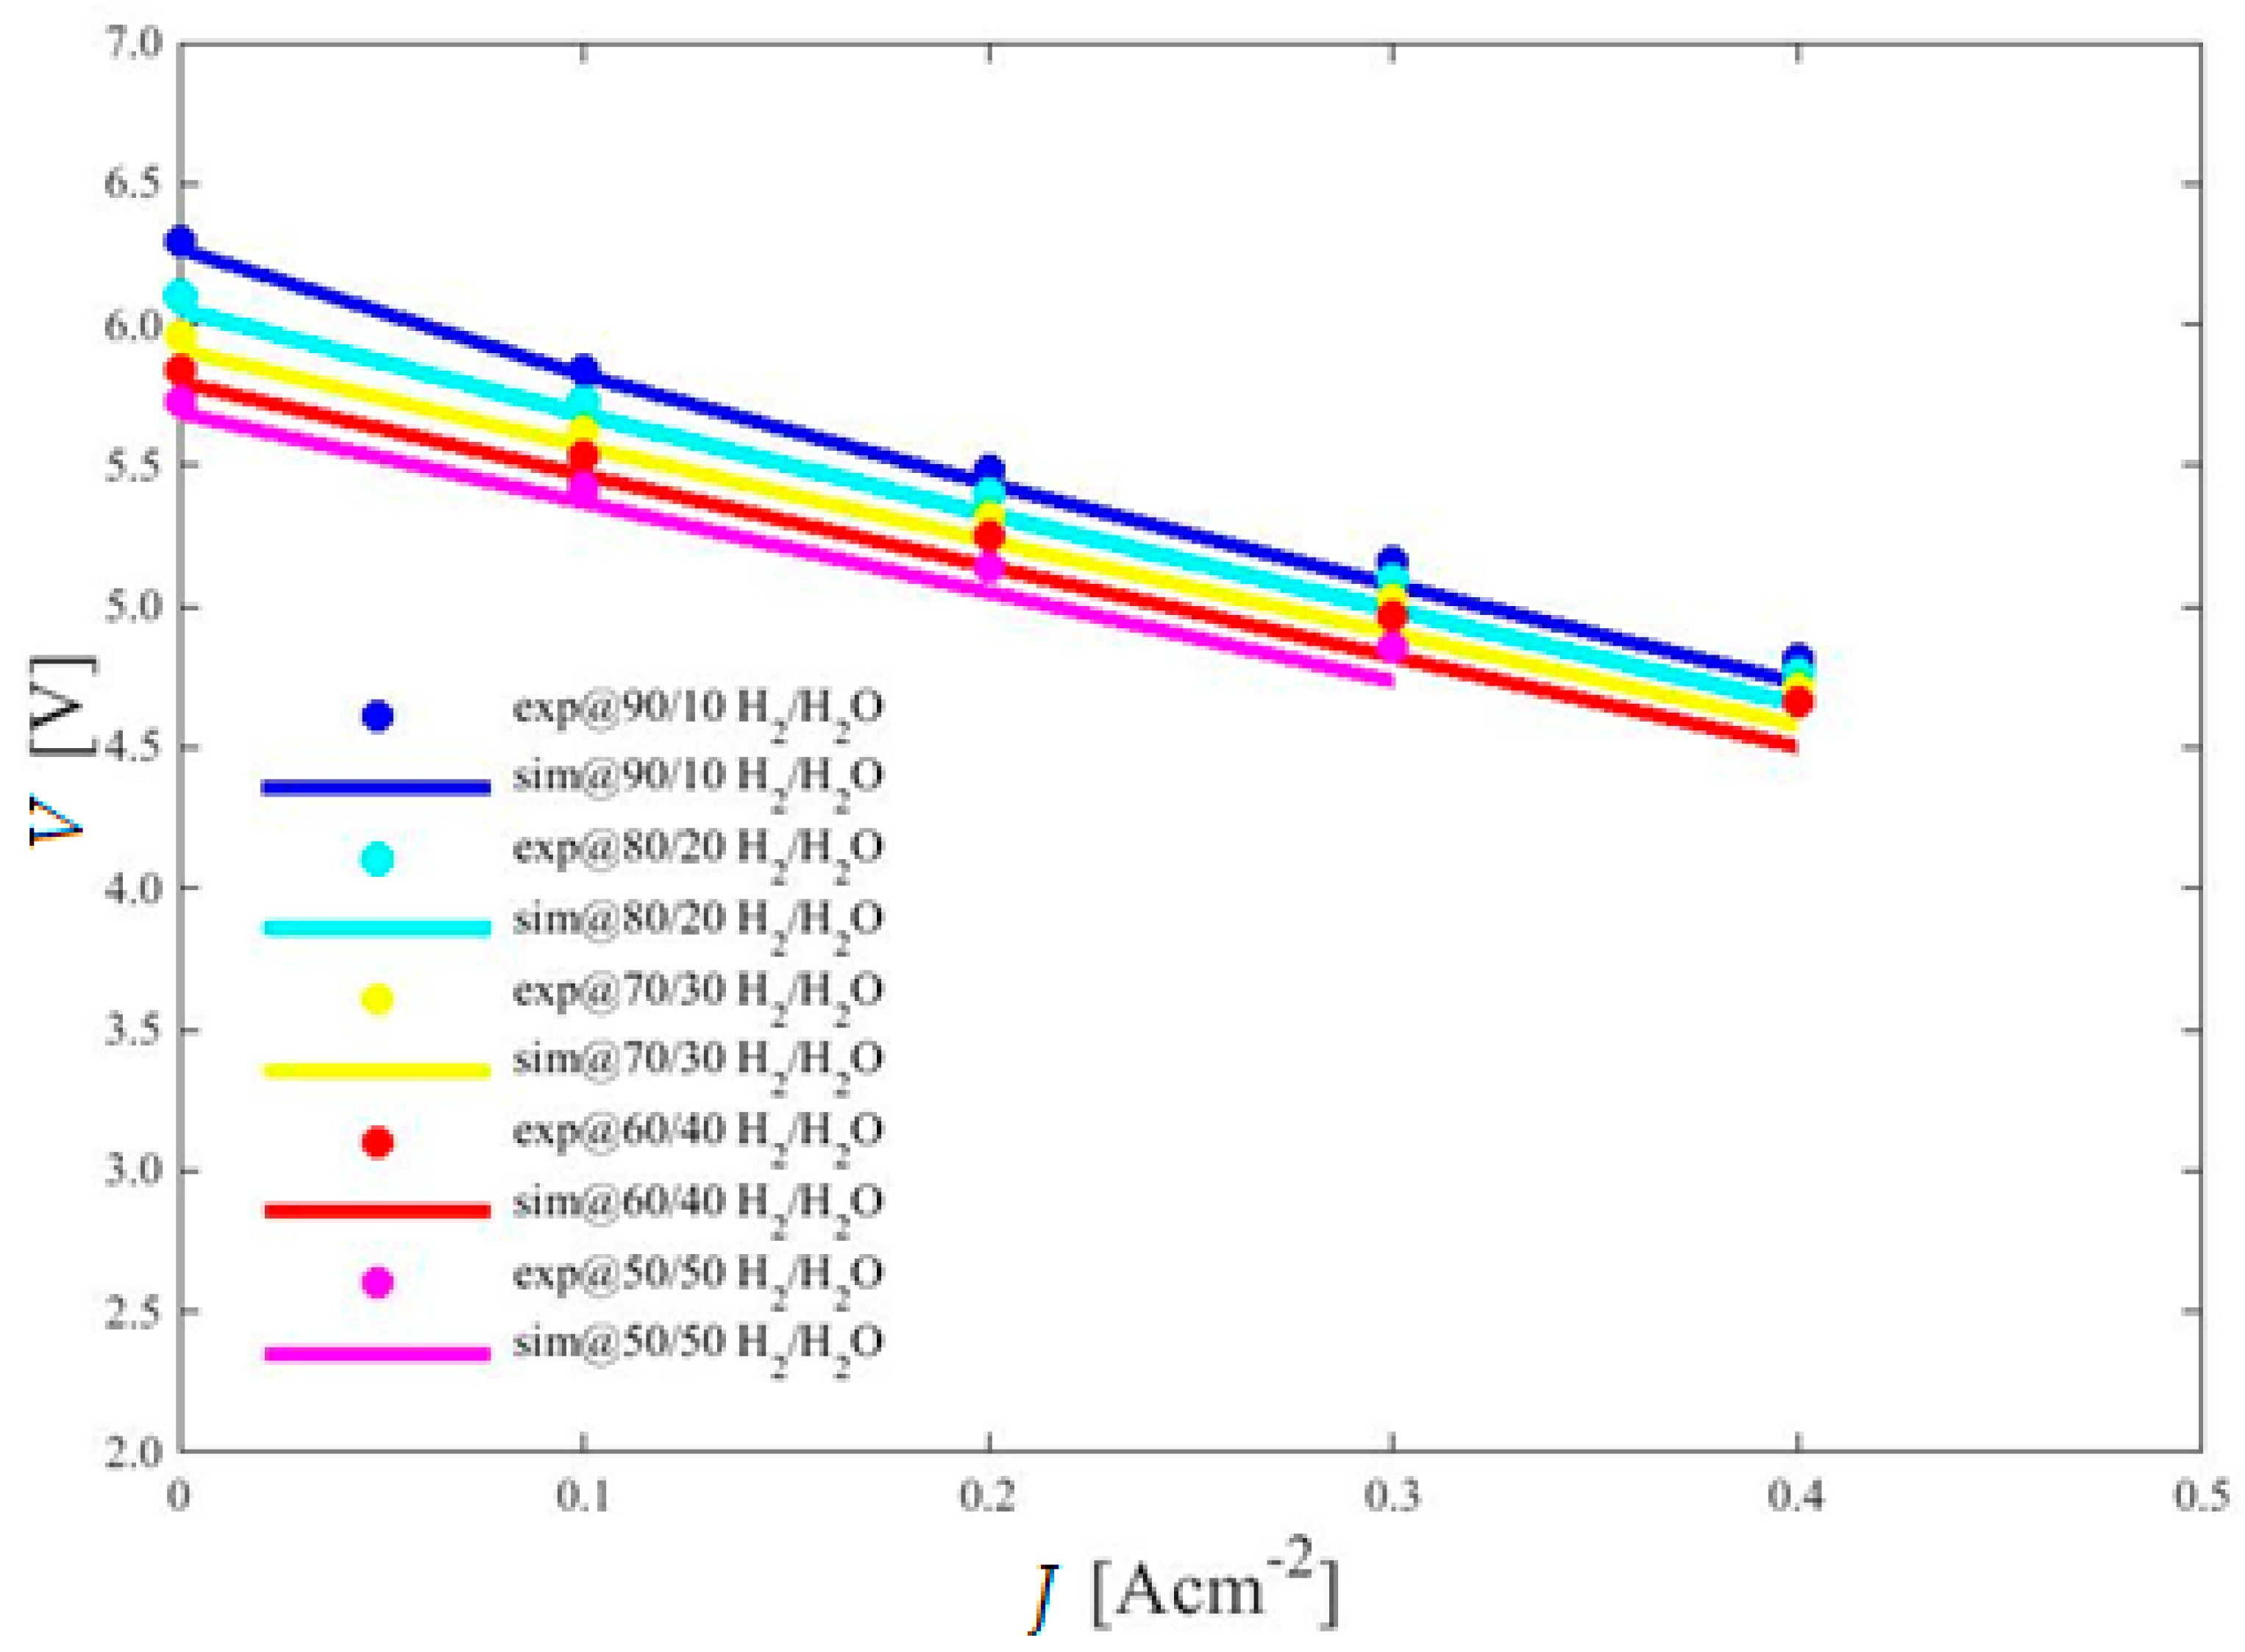
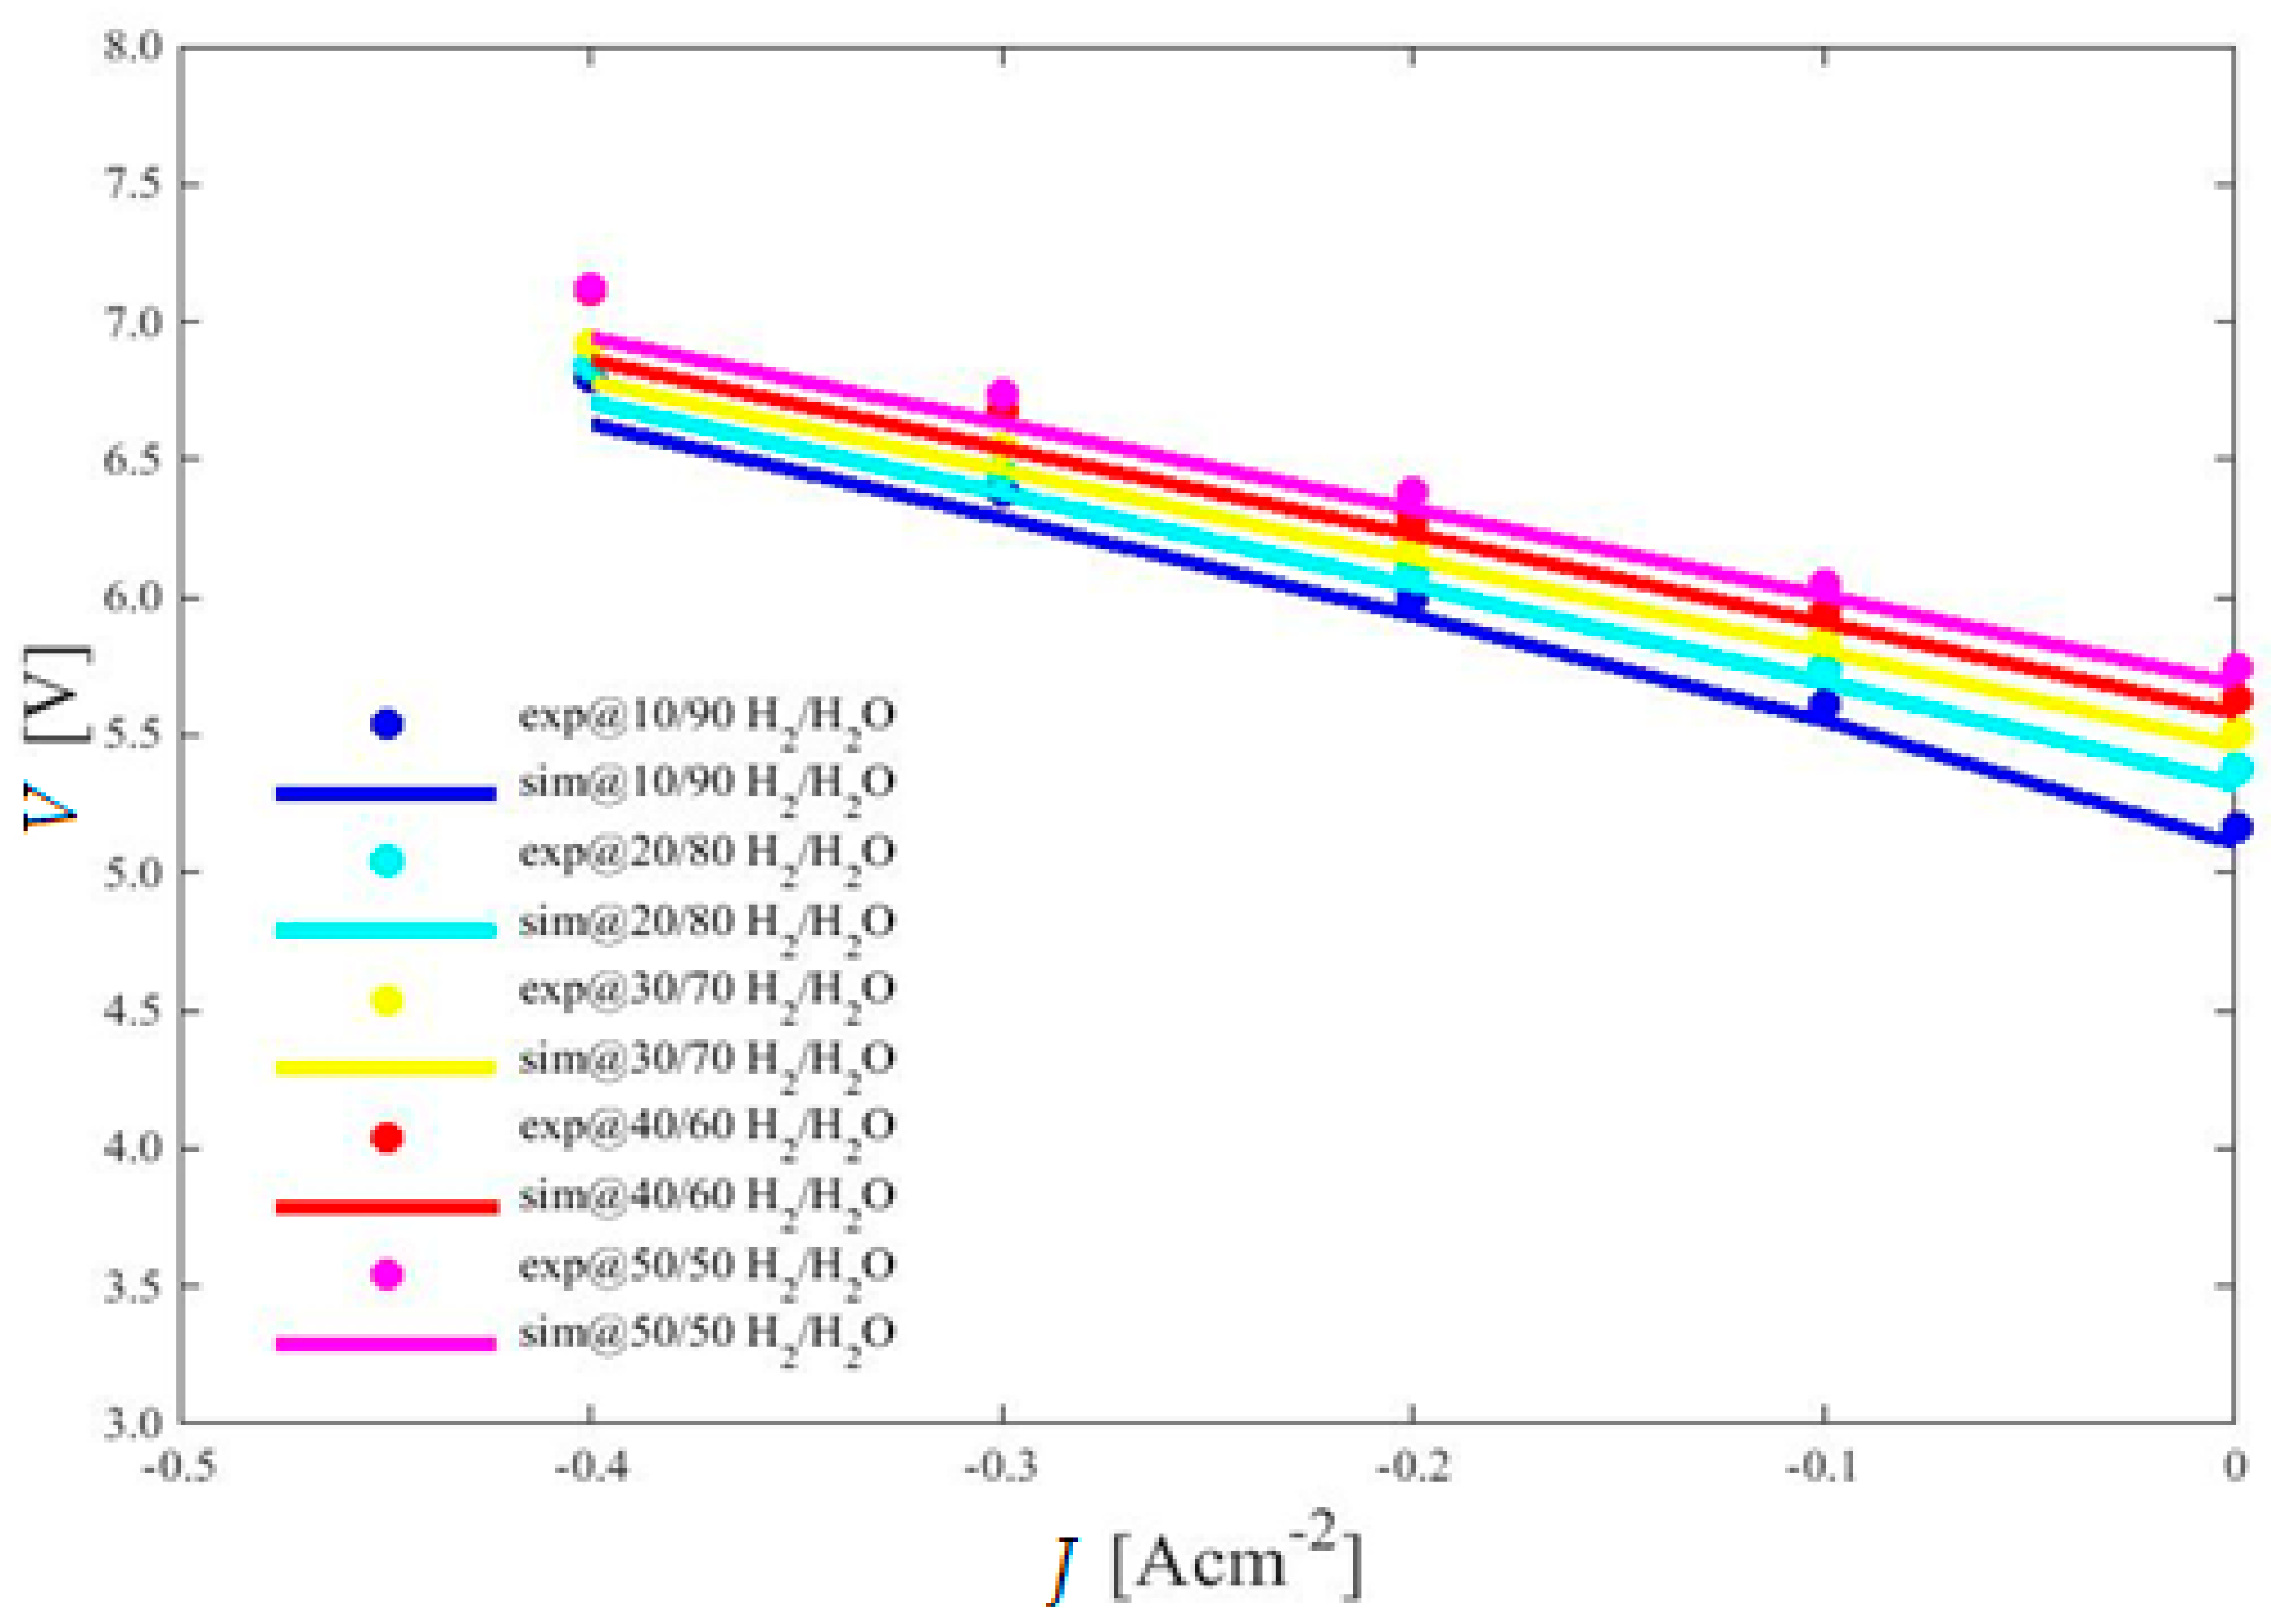
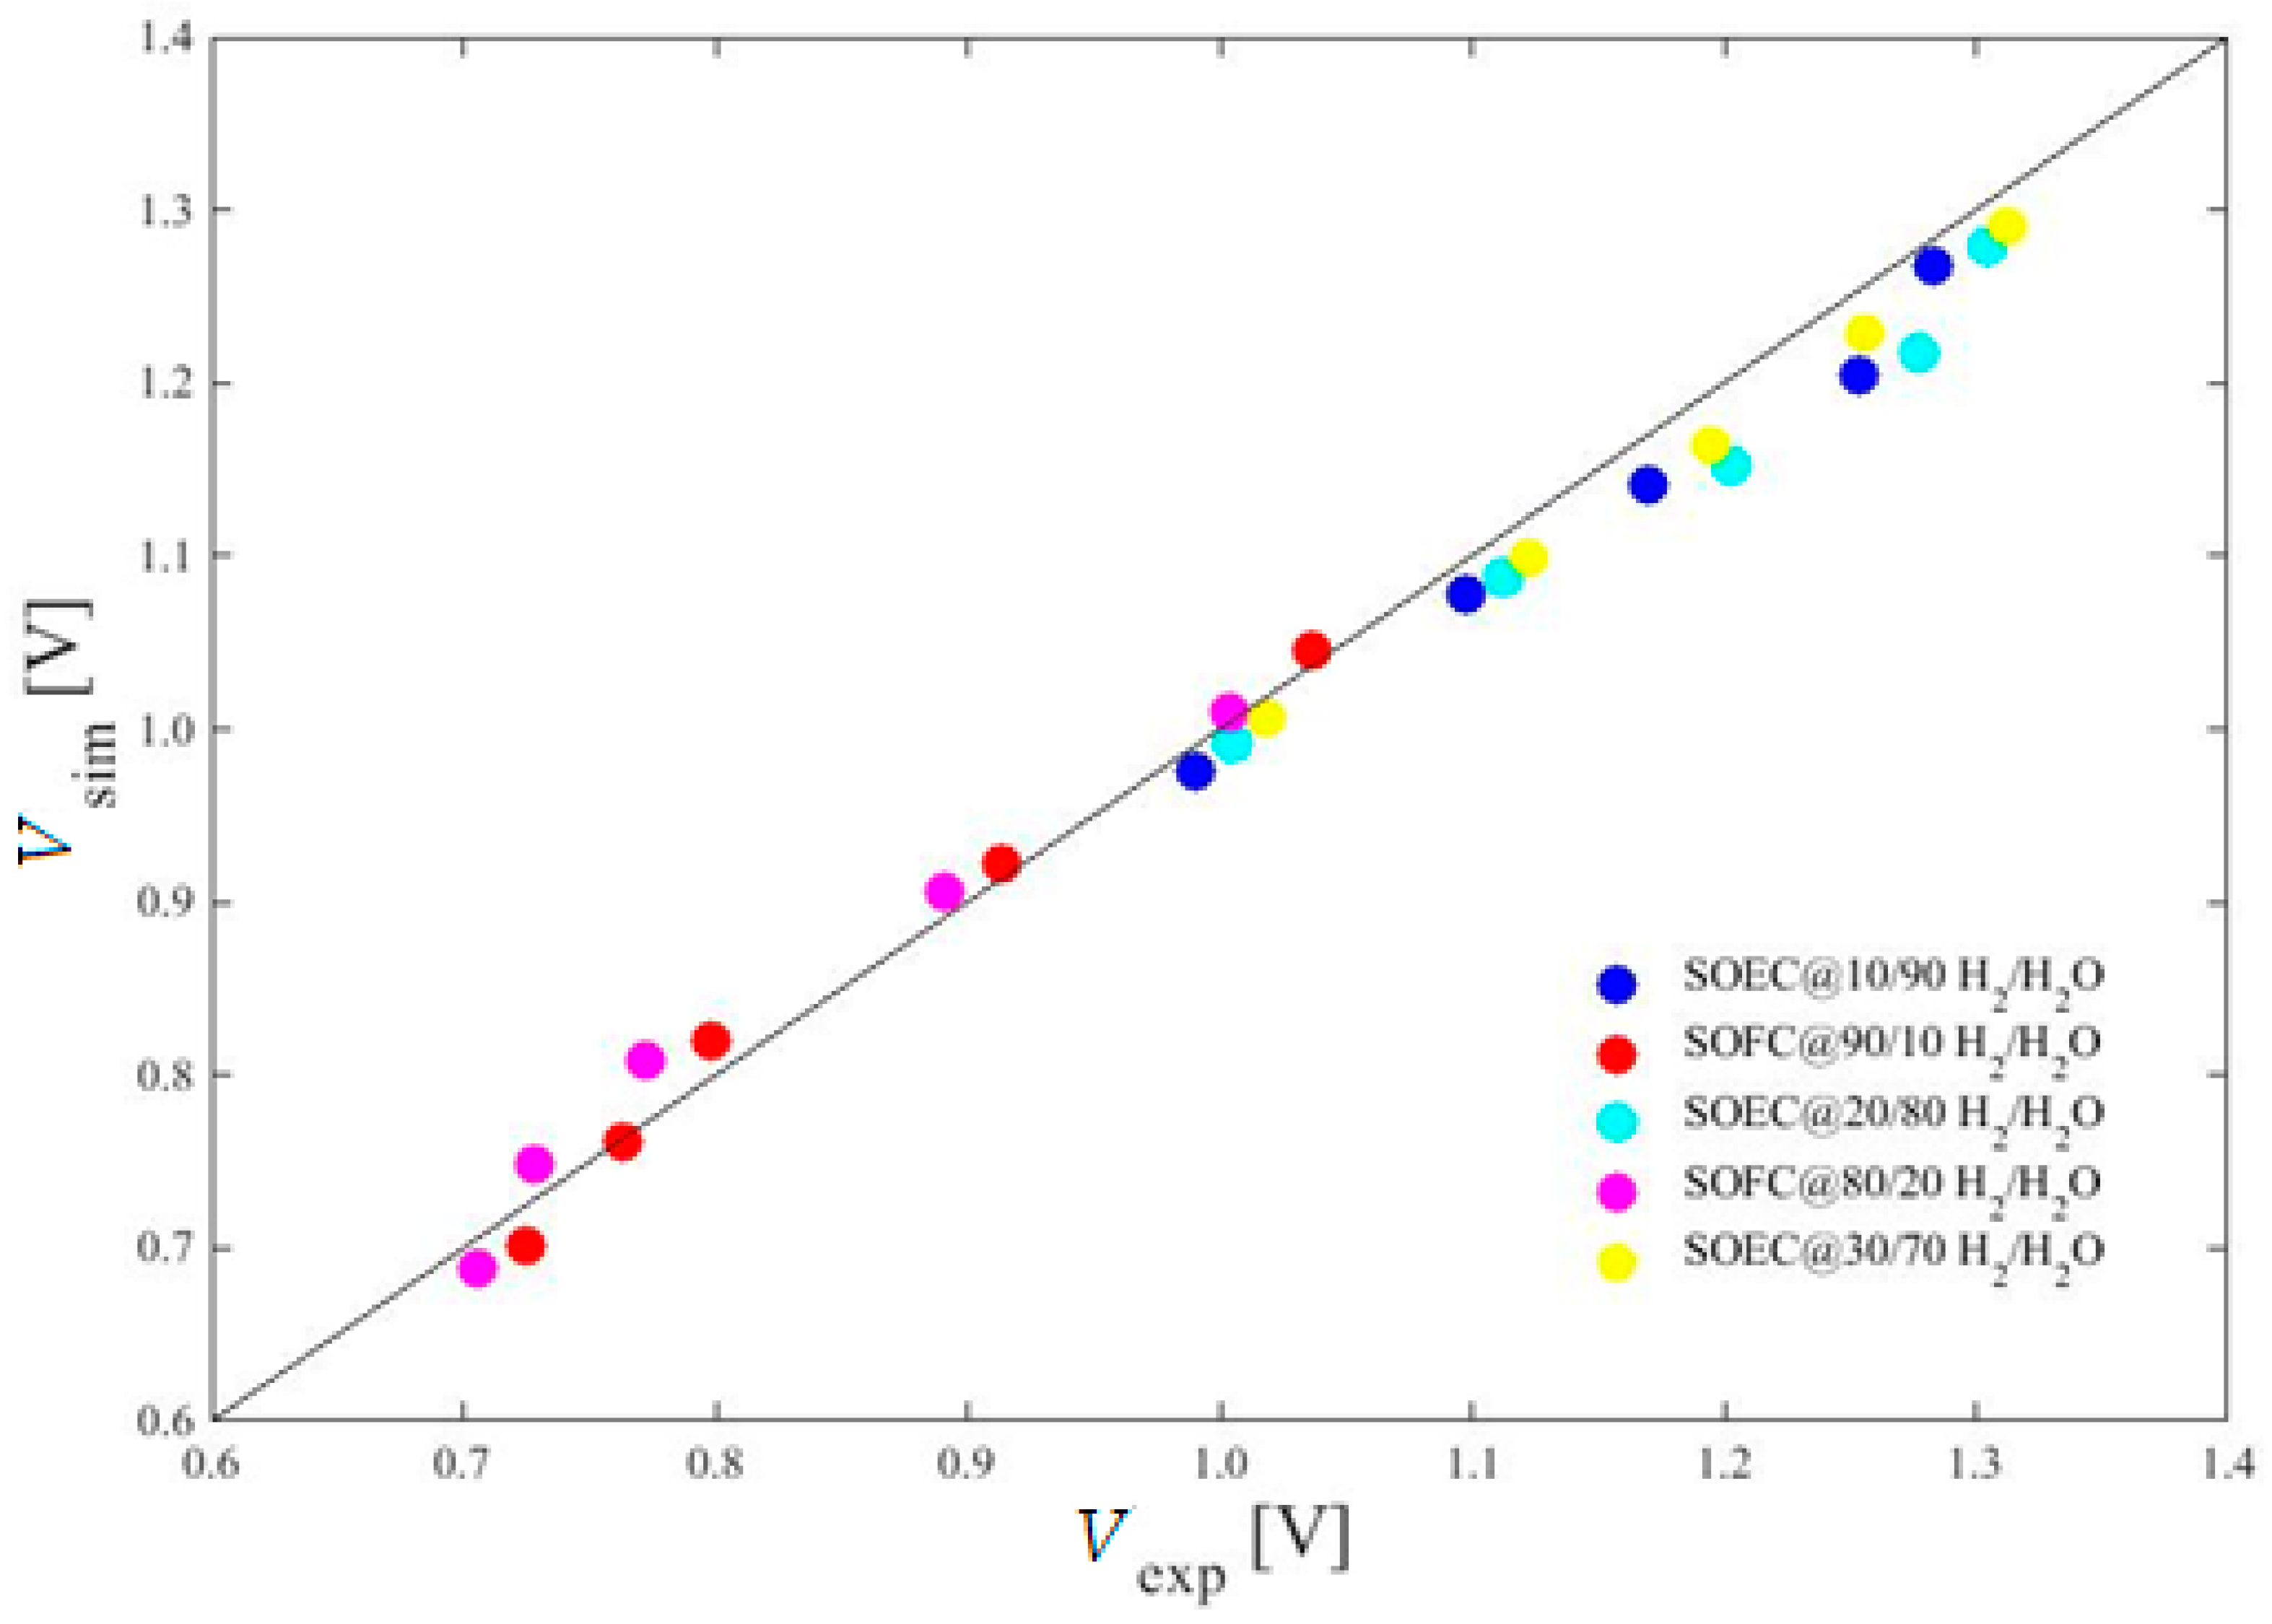
3.2. Two-Dimensional (2D) Simulation of rSOC Larger-Scale Stacked Cells

For 2D modeling validation, a rSOC short stack case study has been considered, consisting of six planar anode supported cells of 80 cm2 active area supplied by SOLIDPower. The materials used are Ni/8YSZ for the fuel electrode, 8YSZ for the electrolyte and GDC + LSCF (Gadolinium-doped Ceria + Lanthanum Strontium Cobalt Ferrite) for the bilateral layers. Thus, in this case, a different type of perovskite is present, also adding a protective layer between the electrolyte and the air electrode to avoid possible poisoning effects. Tests have been performed at equal initial temperature (i.e., 1023 K), feeding dry air and varying H2/H2O composition as the fuel mixture. Two sets of data have been analyzed. Initially, system performance has been estimated through ten polarization curves at fixed flow rates and furnace temperature in order to underline fed reactant dependencies in both SOFC and SOEC modes. Later different working points have been tested setting fuel reactant utilization and reducing furnace temperature to underline the actual cell thermal behavior. The complete description of the test rig and the experimental campaign is explained in [55].
As for the 0D approach, a careful model tuning to evaluate cell kinetics through the fitting of experimental polarization curves is necessary. In this first step, the analysis has focused on highlighting the stack performance dependence on fed hydrogen in order to verify if a more general approach, where reactant influences are considered also for the activation overpotential (Equations (8) and (9)) differently from previous literature, could provide a more detailed simulation or only an increase of computational efforts. Focusing on this point, an isothermal model has been assumed referring to experimental tests where the furnace temperature has been set in order to balance temperature changes due to redox reactions. Table 3 shows the identified values.
Comparing the obtained set with the previous one related to the single cell, it is worth to underline that only the parameters concerning specific cell features (i.e., materials and design) have been changed. Kinetic order and activation energy values have been maintained equally as they refer to the same anodic and cathodic reaction paths despite the presence of a different air electrode. The resulting model has been again validated for both operation modes. As Figure 2 and Figure 3 show, a good agreement has been obtained comparing experimental and simulated results with an error lower than 4%. The most relevant mismatch has been measured at high current density in SOEC operation where a relevant electric noise has been detected during lab tests. The polarization curves underline that the increase of reactant compositions (i.e., H2 for fuel cell and H2O for electrolysis) improves stack performance. Under a current of 0.3 A cm−2, a difference of 0.3 V has been measured by comparing tests in rich and poor H2 percentages. This discrepancy reaches almost 0.4 V in SOEC operation at −0.3 A cm−2. According to the proposed simulation, the polarization curve improvement is mainly due to activation overpotential reduction (Equation (8)), confirming the need for the proposed formulation for effective cell modeling. On the contrary, diffusion overpotentials have a lower influence as the cell works far from the limit current density.
After successful validation of the electrochemical kinetics at different feed compositions, the study has focused on the system thermal behavior to highlight the temperature increase or decrease due to redox reactions. In this case, also energy balances have been solved without varying the previously evaluated kinetic parameters except for the ohmic coefficients (Table 4). These are the parameters that show the main temperature dependence, and consequently, a minimum adjustment was required in changing from an isothermal to a temperature-dependent simulation.
In this case, also the system parameters referred to heat exchange phenomena have to be taken into account. The main used parameters are summarized in Table 5, showing similar values to literature ones [56].
Different working conditions have been considered varying gas compositions and flow rates to guarantee a fixed Reactant Utilization (RU) for both operating modes (i.e., hydrogen RU equal to 0.7 and oxygen RU equal to 0.25 in SOFC, water RU equal to 0.7 in SOEC). Figure 4 shows the measured data expressing the rSOC performance as an average among different voltage values of stacked cells. The good comparison confirms again the validity of model assumptions.
To also validate the thermal behavior of the simulated stack, the temperature evolution has been studied starting from the open circuit condition at an initial system temperature equal to 1021 K. It has been focused on the air electrode outlet temperature, since it is a representative value of the global system temperature due to its high flow rate and heat capacity [55]. Quite similar profiles have been detected for all the tested fuel compositions. The model validation of both SOFC and SOEC modes puts in evidence a good match with a maximum discrepancy of 3 K compared to experimental measurements. In fuel cell operation, the process exothermicity causes a temperature increase from 1020 to 1033 K, whereas a variety of low degrees characterizes tests in electrolysis.
In addition to lab test results, 2D simulation favors a detailed analysis of cell temperature, assuming an equal value for all layers of each single unit (i.e., electrodes, electrolyte and current collectors). Through this local approach, it has been possible to know the actual temperature on the system plane, detecting the maximum and average values reached. For instance, Table 6 shows the obtained results under common working loads at different fuel compositions. A quite uniform profile has been underlined comparing cell temperature gradients (first two columns), so safety working conditions are guaranteed without issues due to creep or delamination that represent relevant causes of degradation in high working temperature cells. Moreover, these data are also useful to validate the following experimental approach. A difference of only some degrees has been detected between the maximum simulated solid temperature and the tested air electrode outlet. Therefore, this last one can effectively represent the stack temperature with a good approximation permitting a simpler measurement during rSOC operation.
In all test conditions an average error equal to 0.1% has been obtained compared to experimental measurements, reaching 0.3% as the maximum value.

4. Conclusions

A multiscale approach has been proposed to simulate rSOC performance, starting from a 0D model executed in Aspen Plus for a small-scale single cell to a 2D Fortran code for stacked cells. Indeed, depending on system size, the most suitable tool has to be used guaranteeing minimum computational efforts without loss of information. The calculation of the inhomogeneous distribution of temperature and gas composition on the cell plane due to occurring local phenomena cannot be neglected for large-sized cells since they have a direct influence on global cell performance, so that this results in a more precise simulation tool. Both lumped and local approaches have been based on conservation equations to describe material and energy transport phenomena, while a semi-empirical formulation has been followed to represent the system electrochemistry. Firstly, common electrochemical kinetics has been derived from Ohm and Butler–Volmer equations for SOFC and SOEC operations and successfully validated through 0D model for a single cell. To simulate the stack configuration, a 2D local analysis has been introduced. The previous detected activation energies (Eact,fuel = 100 kJ mol−1 and Eact,air = 120 kJ mol−1) and kinetic orders (A = 0.5, B = 0.5 and C = 0.25) have been maintained unchanged, since they are linked to intrinsic redox reactions properties and they are validated for both air electrode materials. On the contrary, the parameters depending on the specific used design have been newly tuned. In this second configuration, the model has been tested at different fuel electrode feeds and a fixed operating temperature highlighting the importance to consider the same electrochemical kinetics dependencies for both operation modes (resulting in an error between experimental and simulated data lower than 4%). Later, the system thermal behavior has been evaluated: the model follows adequately the obtained experimental profiles at different operating conditions, with only a few mismatched degrees. SOFC operation results are more sensitive to temperature variation due to an increase of 10 K, whereas the thermal trend is more homogeneous in SOEC mode. Available measured temperatures of the air electrode outlet have been assumed as a representative value of the cell working one, after a preliminary assessment of effective occurring thermal gradients on the cell plane. The detected differences among maximum, average and outlet temperatures are lower than 2 K, confirming the feasibility of this simplified assumption.

Author Contributions

Conceptualization, F.R.B. and B.B.; methodology, F.R.B., E.A. and B.B.; software, F.R.B., E.A. and B.B.; formal analysis, F.R.B.; investigation, A.B., L.B. and G.C.; writing—original draft preparation, F.R.B. and B.B.; writing—review and editing, F.R.B., A.B., L.B., G.C., E.A. and B.B. All authors have read and agreed to the published version of the manuscript.

Funding

The present research work has received funding from the Italian Ministry of Education, Universities and Research, MIUR, as Project of National Interest, PRIN 2017F4S2L3.

Conflicts of Interest

The authors declare no conflict of interest.

List of Symbols

A, B, CKinetics orders for different reactants [-]
DDiffusion coefficient [cm2 s−1]
E0Reversible voltage [V]
EeqEquilibrium voltage [V]
EactActivation energy [J mol−1]
FFaraday constant [C mol−1]
JCurrent density [A cm−2]
J0Exchange current density [A cm−2]
nNumber of components [-]
OCVOpen Circuit Voltage [V]
PElectrochemical parameters [variable]
pPressure [atm]
RGas constant [J mol−1 K−1]
TTemperature [K)
VCell voltage [V]
yMolar fraction [-]
zNumber of transferred electrons [-]
Greek letters
αCharge transfer coefficient [-]
γPre-exponential coefficient in exchange current density [A cm−2]
δThickness [cm]
ηOverpotential [V]
Subscript
actActivation
airAir electrode
avAverage
bulkBulk composition
diffDiffusion
elElectrode
fuelFuel electrode
inInlet
lLoss
ohmOhmic
outOutlet
oxOxidized species
redReduced species
SOCSolid Oxide Cell
TPBTriple Phase Boundary composition

References

  1. Bachmann, T.M. Considering Environmental Costs of Greenhouse Gas Emissions for Setting a CO2 Tax: A Review. Sci. Total Environ. 2020, 720, 137524. [Google Scholar] [CrossRef]
  2. Olivier, J.G.J.; Schure, K.M.; Peters, J.A.H.W. Trend in Global CO2 and Total Greenhouse Gas Emissions; PBL Netherlands Environmental Assessment Agency: The Hague, The Netherlands.
  3. Mangano, E.; Brandani, S.; Ferrari, M.C.; Ahn, H.; Friedrich, D.; Lozinska, M.L.; Wright, P.A.; Kahr, J.; Morris, R.; Croad, M.; et al. Efficient and Rapid Screening of Novel Adsorbents for Carbon Capture in the UK IGSCC Project. Energy Procedia 2013, 37, 40–47. [Google Scholar] [CrossRef] [Green Version]
  4. Akinyele, D.O.; Rayudu, R.K. Review of Energy Storage Technologies for Sustainable Power Networks. Sustain. Energy Technol. Assess. 2014, 8, 74–91. [Google Scholar] [CrossRef]
  5. Sarrias-Mena, R.; Fernández-Ramírez, L.M.; García-Vázquez, C.A.; Jurado, F. Electrolyzer Models for Hydrogen Production from Wind Energy Systems. Int. J. Hydrog. Energy 2015, 40, 2927–2938. [Google Scholar] [CrossRef]
  6. Penchini, D.; Cinti, G.; Discepoli, G.; Desideri, U. Theoretical Study and Performance Evaluation of Hydrogen Production by 200 W Solid Oxide Electrolyzer Stack. Int. J. Hydrog. Energy 2014, 39, 9457–9466. [Google Scholar] [CrossRef]
  7. Zhang, Z.; Zhou, J.; Zong, Z.; Chen, Q.; Zhang, P.; Wu, K. Development and Modelling of a Novel Electricity-Hydrogen Energy System Based on Reversible Solid Oxide Cells and Power to Gas Technology. Int. J. Hydrog. Energy 2019, 44, 28305–28315. [Google Scholar] [CrossRef]
  8. Damo, U.M.; Ferrari, M.L.; Turan, A.; Massardo, A.F. Solid Oxide Fuel Cell Hybrid System: A Detailed Review of an Environmentally Clean and Efficient Source of Energy. Energy 2019, 168, 235–246. [Google Scholar] [CrossRef] [Green Version]
  9. Luo, Y.; Wu, X.; Shi, Y.; Ghoniem, A.F.; Cai, N. Exergy Analysis of an Integrated Solid Oxide Electrolysis Cell-Methanation Reactor for Renewable Energy Storage. Appl. Energy 2018, 215, 371–383. [Google Scholar] [CrossRef]
  10. Xu, H.; Maroto-Valer, M.M.; Ni, M.; Cao, J.; Xuan, J. Modeling of a Combined CH4-Assisted Solid Oxide Co-Electrolysis and Fischer-Tropsch Synthesis System for Low-Carbon Fuel Production. Energy Procedia 2019, 158, 1666–1671. [Google Scholar] [CrossRef]
  11. Lonis, F.; Tola, V.; Cau, G. Renewable Methanol Production and Use through Reversible Solid Oxide Cells and Recycled CO2 Hydrogenation. Fuel 2019, 246, 500–515. [Google Scholar] [CrossRef]
  12. Ali, S.; Sørensen, K.; Nielsen, M.P. Modeling a Novel Combined Solid Oxide Electrolysis Cell (SOEC)—Biomass Gasification Renewable Methanol Production System. Renew. Energy 2020, 154, 1025–1034. [Google Scholar] [CrossRef]
  13. Cinti, G.; Frattini, D.; Jannelli, E.; Desideri, U.; Bidini, G. Coupling Solid Oxide Electrolyser (SOE) and Ammonia Production Plant. Appl. Energy 2017, 192, 466–476. [Google Scholar] [CrossRef] [Green Version]
  14. Greppi, P.; Bosio, B.; Arato, E. Feasibility of the Integration of a Molten Carbonate Fuel-Cell System and an Integrated Gasification Combined Cycle. Int. J. Hydrog. Energy 2009, 34, 8664–8669. [Google Scholar] [CrossRef]
  15. AlNouss, A.; McKay, G.; Al-Ansari, T. Enhancing Waste to Hydrogen Production through Biomass Feedstock Blending: A Techno-Economic-Environmental Evaluation. Appl. Energy 2020, 266, 114885. [Google Scholar] [CrossRef]
  16. Bove, D.; Moliner, C.; Curti, M.; Baratieri, M.; Bosio, B.; Rovero, G.; Arato, E. Preliminary Tests for the Thermo-chemical Conversion of Biomass in a Spouted Bed Pilot Plant. Can. J. Chem. Eng. 2019, 97, 59–66. [Google Scholar] [CrossRef] [Green Version]
  17. Dellepiane, D.; Bosio, B.; Arato, E. Clean Energy from Sugarcane Waste: Feasibility Study of an Innovative Application of Bagasse and Barbojo. J. Power Sources 2003, 122, 47–56. [Google Scholar] [CrossRef]
  18. Onarheim, K.; Hannula, I.; Solantausta, Y. Hydrogen Enhanced Biofuels for Transport via Fast Pyrolysis of Biomass: A Conceptual Assessment. Energy 2020, 199, 117337. [Google Scholar] [CrossRef]
  19. Balaji, R.K.; Rajan, K.P.; Ragula, U.B.R. Modeling & Optimization of Renewable Hydrogen Production from Biomass via Anaerobic Digestion & Dry Reformation. Int. J. Hydrog. Energy 2019, S0360319919332288. [Google Scholar] [CrossRef]
  20. Wang, M.; Wang, Z.; Gong, X.; Guo, Z. The Intensification Technologies to Water Electrolysis for Hydrogen Production—A Review. Renew. Sustain. Energy Rev. 2014, 29, 573–588. [Google Scholar] [CrossRef]
  21. Mehrpooya, M.; Sayyad, S.; Zonouz, M.J. Energy, Exergy and Sensitivity Analyses of a Hybrid Combined Cooling, Heating and Power (CCHP) Plant with Molten Carbonate Fuel Cell (MCFC) and Stirling Engine. J. Clean. Prod. 2017, 148, 283–294. [Google Scholar] [CrossRef]
  22. Al-Khori, K.; Bicer, Y.; Boulfrad, S.; Koç, M. Techno-Economic and Environmental Assessment of Integrating SOFC with a Conventional Steam and Power System in a Natural Gas Processing Plant. Int. J. Hydrog. Energy 2019, 44, 29604–29617. [Google Scholar] [CrossRef]
  23. Pérez-Trujillo, J.P.; Elizalde-Blancas, F.; McPhail, S.J.; Della Pietra, M.; Bosio, B. Preliminary Theoretical and Experimental Analysis of a Molten Carbonate Fuel Cell Operating in Reversible Mode. Appl. Energy 2020, 263, 114630. [Google Scholar] [CrossRef]
  24. Udagawa, J.; Aguiar, P.; Brandon, N.P. Hydrogen Production through Steam Electrolysis: Model-Based Steady State Performance of a Cathode-Supported Intermediate Temperature Solid Oxide Electrolysis Cell. J. Power Sources 2007, 166, 127–136. [Google Scholar] [CrossRef]
  25. Dinda, S.; Birla Institute of Technology and Science (Eds.) Innovations in Chemical Engineering, (ICE 2013): The National Conference on “Innovations in Chemical Engineering- ICE 2013”, Organized at BITS Pilani, Hyderabad Campus during November 15–16, 2013; BS Publ: Hyderabad, India, 2013. [Google Scholar]
  26. Jung, H.-Y.; Park, S.; Popov, B.N. Electrochemical Studies of an Unsupported PtIr Electrocatalyst as a Bifunctional Oxygen Electrode in a Unitized Regenerative Fuel Cell. J. Power Sources 2009, 191, 357–361. [Google Scholar] [CrossRef]
  27. Paul, B.; Andrews, J. PEM Unitised Reversible/Regenerative Hydrogen Fuel Cell Systems: State of the Art and Technical Challenges. Renew. Sustain. Energy Rev. 2017, 79, 585–599. [Google Scholar] [CrossRef]
  28. Sanz-Bermejo, J.; Muñoz-Antón, J.; Gonzalez-Aguilar, J.; Romero, M. Optimal Integration of a Solid-Oxide Electrolyser Cell into a Direct Steam Generation Solar Tower Plant for Zero-Emission Hydrogen Production. Appl. Energy 2014, 131, 238–247. [Google Scholar] [CrossRef]
  29. Buffo, G.; Ferrero, D.; Santarelli, M.; Lanzini, A. Energy and Environmental Analysis of a Flexible Power-to-X Plant Based on Reversible Solid Oxide Cells (RSOCs) for an Urban District. J. Energy Storage 2020, 29, 101314. [Google Scholar] [CrossRef]
  30. Salomone, F.; Giglio, E.; Ferrero, D.; Santarelli, M.; Pirone, R.; Bensaid, S. Techno-Economic Modelling of a Power-to-Gas System Based on SOEC Electrolysis and CO2 Methanation in a RES-Based Electric Grid. Chem. Eng. J. 2019, 377, 120233. [Google Scholar] [CrossRef]
  31. Vialetto, G.; Noro, M.; Colbertaldo, P.; Rokni, M. Enhancement of Energy Generation Efficiency in Industrial Facilities by SOFC—SOEC Systems with Additional Hydrogen Production. Int. J. Hydrog. Energy 2019, 44, 9608–9620. [Google Scholar] [CrossRef]
  32. Ni, M.; Leung, M.K.H.; Leung, D.Y.C. Parametric Study of Solid Oxide Fuel Cell Performance. Energy Convers. Manag. 2007, 48, 1525–1535. [Google Scholar] [CrossRef]
  33. Yahya, A.; Ferrero, D.; Dhahri, H.; Leone, P.; Slimi, K.; Santarelli, M. Electrochemical Performance of Solid Oxide Fuel Cell: Experimental Study and Calibrated Model. Energy 2018, 142, 932–943. [Google Scholar] [CrossRef]
  34. Ni, M.; Leung, M.; Leung, D. Parametric Study of Solid Oxide Steam Electrolyzer for Hydrogen Production. Int. J. Hydrog. Energy 2007, 32, 2305–2313. [Google Scholar] [CrossRef]
  35. Menon, V.; Janardhanan, V.M.; Deutschmann, O. A Mathematical Model to Analyze Solid Oxide Electrolyzer Cells (SOECs) for Hydrogen Production. Chem. Eng. Sci. 2014, 110, 83–93. [Google Scholar] [CrossRef]
  36. García-Camprubí, M.; Izquierdo, S.; Fueyo, N. Challenges in the Electrochemical Modelling of Solid Oxide Fuel and Electrolyser Cells. Renew. Sustain. Energy Rev. 2014, 33, 701–718. [Google Scholar] [CrossRef]
  37. Kazempoor, P.; Braun, R.J. Model Validation and Performance Analysis of Regenerative Solid Oxide Cells for Energy Storage Applications: Reversible Operation. Int. J. Hydrog. Energy 2014, 39, 5955–5971. [Google Scholar] [CrossRef]
  38. Hauck, M.; Herrmann, S.; Spliethoff, H. Simulation of a Reversible SOFC with Aspen Plus. Int. J. Hydrog. Energy 2017, 42, 10329–10340. [Google Scholar] [CrossRef]
  39. EG&G Technical Services, Inc. Fuel Cell Handbook (Seventh Edition). Available online: https://netl.doe.gov/sites/default/files/netl-file/FCHandbook7.pdf (accessed on 20 August 2020).
  40. Bianchi, F.R.; Bosio, B.; Baldinelli, A.; Barelli, L. Optimization of a Reference Kinetic Model for Solid Oxide Fuel Cells. Catalysts 2020, 10, 104. [Google Scholar] [CrossRef] [Green Version]
  41. Bianchi, F.R.; Spotorno, R.; Piccardo, P.; Bosio, B. Solid Oxide Fuel Cell Performance Analysis through Local Modelling. Catalysts 2020, 10, 519. [Google Scholar] [CrossRef]
  42. Charpentier, J.-C. Among the Trends for a Modern Chemical Engineering, the Third Paradigm: The Time and Length Multiscale Approach as an Efficient Tool for Process Intensification and Product Design and Engineering. Chem. Eng. Res. Des. 2010, 88, 248–254. [Google Scholar] [CrossRef]
  43. Audasso, E.; Bianchi, F.R.; Bosio, B. 2D Simulation for CH4 Internal Reforming-SOFCs: An Approach to Study Performance Degradation and Optimization. Energies 2020, 13, 4116. [Google Scholar] [CrossRef]
  44. Conti, B.; Bosio, B.; McPhail, S.J.; Santoni, F.; Pumiglia, D.; Arato, E. A 2-D Model for Intermediate Temperature Solid Oxide Fuel Cells Preliminarily Validated on Local Values. Catalysts 2019, 9, 36. [Google Scholar] [CrossRef] [Green Version]
  45. Pornprasertsuk, R.; Ramanarayanan, P.; Musgrave, C.B.; Prinz, F.B. Predicting Ionic Conductivity of Solid Oxide Fuel Cell Electrolyte from First Principles. J. Appl. Phys. 2005, 98, 103513. [Google Scholar] [CrossRef] [Green Version]
  46. Miyahita, T. Open-Circuit Voltage Anomalies in Yttria-Stabilized Zirconia and Samaria-Doped Ceria Bilayered Electrolytes. ECSarXiv 2019. preprint. [Google Scholar] [CrossRef]
  47. Bove, R.; Lunghi, P.; Msammes, N. SOFC Mathematic Model for Systems Simulations. Part One: From a Micro-Detailed to Macro-Black-Box Model. Int. J. Hydrog. Energy 2005, 30, 181–187. [Google Scholar] [CrossRef]
  48. Appleby, A.J.; Foulkes, F.R. Fuel Cell Handbook; Van Nostrand Reinhold: New York, NY, USA, 1989. [Google Scholar]
  49. Noren, D.A.; Hoffman, M.A. Clarifying the Butler–Volmer Equation and Related Approximations for Calculating Activation Losses in Solid Oxide Fuel Cell Models. J. Power Sources 2005, 152, 175–181. [Google Scholar] [CrossRef]
  50. Suwanwarangkul, R.; Croiset, E.; Fowler, M.W.; Douglas, P.L.; Entchev, E.; Douglas, M.A. Performance Comparison of Fick’s, Dusty-Gas and Stefan–Maxwell Models to Predict the Concentration Overpotential of a SOFC Anode. J. Power Sources 2003, 122, 9–18. [Google Scholar] [CrossRef]
  51. Leonide, A. Schriften des Instituts für Werkstoffe der Elektrotechnik, Karlsruher Institut für Technologie. SOFC Modelling and Parameter Identification by Means of Impedance Spectroscopy; KIT Scientific Publishing: Karlsruhe, Germany, 2010. [Google Scholar]
  52. Sharma, A.K.; Ahmed, K.; Birgersson, E. Nernst Voltage Losses in Planar Fuel Cells Caused by Changes in Chemical Composition: Effects of Operating Parameters. Ionics 2018, 24, 2047–2054. [Google Scholar] [CrossRef]
  53. Jensen, S.H.; Larsen, P.H.; Mogensen, M. Hydrogen and Synthetic Fuel Production from Renewable Energy Sources. Int. J. Hydrog. Energy 2007, 32, 3253–3257. [Google Scholar] [CrossRef]
  54. Yonekura, T.; Tachikawa, Y.; Yoshizumi, T.; Shiratori, Y.; Ito, K.; Sasaki, K. Exchange current density of solid oxide fuel cell electrodes. In Proceedings of the 12th International Symposium on Solid Oxide Fuel Cells, SOFC-XII - 219th ECS Meeting, Montreal, QC, Canada, 1–6 May 2011; pp. 1007–1014. [Google Scholar] [CrossRef]
  55. Barelli, L.; Bidini, G.; Cinti, G.; Ottaviano, A. Study of SOFC-SOE Transition on a RSOFC Stack. Int. J. Hydrog. Energy 2017, 42, 26037–26047. [Google Scholar] [CrossRef]
  56. Pianko-Oprych, P.; Zinko, T.; Jaworski, Z. Computational Fluid Dynamics Calculation of a Planar Solid Oxide Fuel Cell Design Running on Syngas. Chem. Process Eng. 2017, 38, 513–521. [Google Scholar] [CrossRef] [Green Version]
Figure 1. Polarization curves validation of a small-SIZED single rSOC though the 0D modeling approach.
Energies 13 05058 g001
Figure 2. Polarization curves validation of a Solid Oxide Fuel Cell (SOFC) short stack working at 1023 K though 2D isothermal modeling.
Energies 13 05058 g002
Figure 3. Polarization curves validation of a Solid Oxide Electrolyzer Cell (SOEC) short stack working at 1023 K though 2D isothermal modeling.
Energies 13 05058 g003
Figure 4. Validation of a rSOC short stack electrochemical performance though 2D not-isothermal modeling.
Energies 13 05058 g004
Table 1. Occurring electrochemical reactions.
ReactionSOFCSOEC
Anodic H 2 + O = H 2 O + 2 e
(fuel electrode)
O = 1 2 O 2 + 2 e
(air electrode)
Cathodic 1 2 O 2 + 2 e O =
(air electrode)
H 2 O + 2 e H 2 + O =
(fuel electrode)
Global H 2 + 1 2 O 2 H 2 O
Table 2. Kinetics parameters for a small-sized single rSOC.
Kinetic ParameterSmall Size Single Cell Model
ηl [V]0
P1 [Ω cm2 K−1]4.5 × 10⁻⁷
P2 [K]7000
γfuel [A cm−2]5 × 10⁵
γair [A cm−2]5 × 10⁶
Eact,fuel [kJ mol−1]100
Eact,air [kJ mol−1]120
A [-]0.5
B [-]0.5
C [-]0.25
Table 3. Kinetics parameters for the rSOC short stack operating in isothermal conditions.
Kinetic ParameterIsothermal Short Stack Model
ηl [V]0.02
P1 [Ω cm2 K−1]1 × 10⁻⁵
P2 [K]3497
γfuel [A cm−2]3 × 10⁵
γair [A cm−2]4 × 10⁵
Eact,fuel [kJ mol−1]100
Eact,air [kJ mol−1]120
A [-]0.5
B [-]0.5
C [-]0.25
Table 4. Kinetics parameters for a rSOC short stack operating in not-isothermal conditions.
Kinetic ParameterNot-Isothermal Short Stack Model
P1 [Ω cm2 K−1]1.8 × 10⁻⁵
P2 [K]3410
Table 5. Main parameters for the thermal behavior of a rSOC short stack.
rSOC PropertyFuel ElectrodeAir ElectrodeElectrolyte
Density [kg m−3]774053006000
Heat capacity [cal mol−1 K−1]503429
Global cell conductivity [W m−1 K−1]2.0
Table 6. Simulated and measured temperatures for short stack at 0.3 A cm−2 and −0.3 A cm−2 in the SOFC and SOEC modes, respectively.
Operating ConditionTmax_sim [K]Tav_sim [K]Tair_out_sim [K]Tair_out_exp [K]
SOEC@10/90 H2/H2O1019101810191020
SOFC@90/10 H2/H2O1030102910281028
SOEC@20/80 H2/H2O1019101910191020
SOFC@80/20 H2/H2O1030102910271028
SOEC@30/70 H2/H2O1019101910191020

