Article

A New Method for Impeller Inlet Design of Supercritical CO2 Centrifugal Compressors in Brayton Cycles

1
Department of Mechanics, Tianjin University, Tianjin 300350, China
2
Department of Mechanics and Maritime Sciences, Chalmers University of Technology, 41296 Gothenburg, Sweden
*
Author to whom correspondence should be addressed.
Energies 2020, 13(19), 5049; https://doi.org/10.3390/en13195049
Submission received: 17 August 2020 / Revised: 21 September 2020 / Accepted: 22 September 2020 / Published: 25 September 2020

Abstract

:
Supercritical Carbon Dioxide (SCO2) is considered as a potential working fluid in next generation power and energy systems. The SCO2 Brayton cycle is advantaged with higher cycle efficiency, smaller compression work, and more compact layout, as compared with traditional cycles. When the inlet total condition of the compressor approaches the critical point of the working fluid, the cycle efficiency is further enhanced. However, the flow acceleration near the impeller inducer causes the fluid to enter two-phase region, which may lead to additional aerodynamic losses and flow instability. In this study, a new impeller inlet design method is proposed to achieve a better balance among the cycle efficiency, compressor compactness, and inducer condensation. This approach couples a concept of the maximum swallowing capacity of real gas and a new principle for condensation design. Firstly, the mass flow function of real gas centrifugal compressors is analytically expressed by non-dimensional parameters. An optimal inlet flow angle is derived to achieve the maximum swallowing capacity under a certain inlet relative Mach number, which leads to the minimum energy loss and a more compact geometry for the compressor. Secondly, a new condensation design principle is developed by proposing a novel concept of the two-zone inlet total condition for SCO2 compressors. In this new principle, the acceptable acceleration margin (AAM) is derived as a criterion to limit the impeller inlet condensation. The present inlet design method is validated in the design and simulation of a low-flow-coefficient compressor stage based on the real gas model. The mechanisms of flow accelerations in the impeller inducer, which form low-pressure regions and further produce condensation, are analyzed and clarified under different operating conditions. It is found that the proposed method is efficient to limit the condensation in the impeller inducer, keep the compactness of the compressor, and maintain a high cycle efficiency.

Graphical Abstract

1. Introduction

Supercritical Carbon Dioxide (SCO2) has superior thermodynamic properties such as high specific heat capacity, large isothermal compressibility, and small viscosity. A power generation system with SCO2 as the working fluid usually needs smaller compression work and possesses higher cycle efficiency, as compared to a working fluid of superheated vapor [1]. Moreover, the density of SCO2 is very large, leading to the benefit that the SCO2 Brayton cycle is much more compact than the traditional Rankine cycle [2]. It is also known that the critical temperature of CO2 (304.13 K) is lower than other frequently-used working fluids. This makes the thermal cycle much easier to implement [3]. Due to the above advantages, SCO2 Brayton cycles are widely used in nuclear energy systems [4], exhaust heat recovery systems [5], solar power systems [6], and geothermal energy systems [7], etc.
A centrifugal compressor is one of the key components in the SCO2 Brayton cycle. When the compressor inlet fluid approaches its critical point, the compression work further decreases, and the cycle efficiency is additionally improved [8]. These benefits mainly come from the sharp increase of the isothermal compressibility of the working fluid near the critical point.
However, the aerothermodynamic properties of CO2 near the critical point show severe nonlinear behaviors which significantly deviate from the perfect gas. The sharp variation of the fluid properties means larger uncertainty in experimental measurements and lower accuracy in numerical simulations for centrifugal compressors [9,10]. In recent years, a significant effort has been made to improve the reliability of numerical simulations for compressors running near the critical point. Ameli et al. [11] analyzed the sensitivity of the compressor aerodynamic performance and flow field with respect to the real gas models and operating conditions. A method was developed to overcome simulation difficulties. Baltadjiev et al. [12] presented a comprehensive assessment of real gas effects on the aerodynamic performance and rotor–stator matching of SCO2 compressors. Kim et al. [13] carried out a three-dimensional numerical study for a SCO2 compressor stage to obtain fundamental data for the design optimization near the critical point and in the supercritical state. More related studies can be found in the references [14,15].
On the other hand, if the inlet total condition of an SCO2 compressor is very close to the critical point, the impeller inlet design could be much more difficult. Flow acceleration happens not only at the impeller inlet from stagnation condition to static one, but also at the inducer due to the suction side curvature of the blade leading edge. Since the acceleration may cause the fluid thermodynamic state to cross the saturation line, the fluid condensation (two-phase flow) is likely to occur [16]. The phase transition of the condensation brings about unsteady flow structures near the impeller inlet, which introduces instability and decreases the compressor efficiency. Pecnik et al. [17] carried out a three-dimensional CFD (computational fluid dynamics) study for a high-speed SCO2 centrifugal compressor. Two-phase flow was captured in the suction side region of the full blade leading edge and in the wake-flow region near the impeller outlet. Baltadjiev et al. [12] defined a non-dimensional parameter to estimate the significance of two-phase flow effects. This parameter relates the time of liquid droplet formation to the residence time of the flow under saturation conditions.
To limit the condensation near the impeller inducer, design criteria have been developed. For example, Brenes [18] proposed a design criterion named acceleration margin to condensation (AMC), in which a large margin is reserved to avoid two-phase flow. AMC is a good criterion to select the proper inlet total condition, while it cannot be applied directly to the impeller design with a specified inlet condition. Shao et al. [19] introduced the inlet velocity ratio (IVR) to control the inlet condensation and, then, to define the impeller inlet geometry. However, IVR cannot explore the trade-off relationships among the non-dimensional impeller inlet parameters: the flow coefficients, the inlet relative Mach number, and the inlet flow angle. These parameters are closely related to the compressor flow capacity and aerodynamic loss.
To sum up, in the practice of SCO2 compressor design, the inlet total condition should be close to the critical point in order to achieve a high cycle efficiency. On the other hand, to limit the condensation, the flow acceleration near the impeller inducer should be restricted. This means that for the specified mass flow rate, the cross-sectional area of the impeller inducer becomes relatively large. As a consequence, the compactness of the compressor deteriorates. The above analysis shows that the impeller inlet aerodynamic and geometrical parameters are coupled and interacted. In recent years, some preliminary design methods for SCO2 compressors were developed by integrating the real gas model and the mean-line methods of air compressors [18,20]. However, those methods usually paid more attention to explore the impeller outlet parameters of SCO2 compressors [19,21], and they cannot well cope with the interactions among impeller inlet parameters. Therefore, a new methodology for aerothermodynamic design of real gas compressors is demanded, based on which the impeller inlet parameters could be explored to achieve a better balance between the inlet condensation and compressor compactness without losing the cycle efficiency.
The rest of this article is organized as follows. Firstly, the numerical simulation method for a SCO2 compressor is validated. Secondly, a new impeller inlet design method is proposed, which couples a concept of the maximum swallowing capacity of real gas and a new design principle for condensation mitigation. Then, a low-flow-coefficient compressor stage is designed using this approach and, furthermore, simulated, and analyzed. Finally, some conclusions and remarks on future work are given.

2. Numerical Method Validation

As the final design scheme is assessed by the numerical simulation method, the CFD code for SCO2 compressors is firstly validated based on the experimental data. In the following sub-sections, the thermodynamic properties of SCO2 is discussed, and then the numerical method is presented and validated.

2.1. Thermodynamic Properties of SCO2

For a specific substance, its critical temperature is defined as the highest temperature that can hold liquid–vapor equilibrium during phase change, and the corresponding pressure is termed the critical pressure. The gas and liquid states cannot coexist when the temperature is higher than the critical temperature. As shown in Figure 1, the thermodynamic properties of CO2 near the critical point ( T cr = 304.13   K , p cr = 7.38 MPa ) are far away from perfect gas. A slight change of the pressure or temperature can cause great variation of the density and specific heat. In addition, the isolines of the thermodynamic properties show a sharp discontinuity when the fluid reaches the saturation lines.
For the flow in compressors, the behavior of the working fluid along the whole compressor stage is far away from that of the perfect gas. Thus, the equations for the perfect gas (e.g., p = ρ R T , a = γ R T and T t 1 / T 1 = 1 + ( γ 1 ) M c 1 2 / 2 ) are invalid for the preliminary design or numerical simulation of SCO2 compressors. However, the mass, momentum, and energy conservations are independent of the fluid properties. Therefore, the flow in SCO2 compressors is still governed by the Navier–Stokes equations. To complete the entire equation system, it is necessary to formulate the thermodynamic relations between the state variables (equation of state), and derive the viscosity coefficient and the thermal conductivity coefficient as functions of the state variables (transport properties). The transport properties are usually derived from the basic thermodynamic properties (such as temperature and density). Therefore, a suitable EOS (equation of state) of working fluid should be firstly determined. A variety of EOS models exist with variable accuracy depending on the particular range of thermodynamic states of interest. For example, the Lee-Kesler (LK) model [22] is well-established and widely used in industry. The main advantage of the LK EOS model is to improve the accuracy of existing real gas models, particularly in the subcooled liquid and superheated vapor regions. The Span–Wagner (SW) model [23] is particularly developed for CO2, whose accuracy is shown to be on the same order as the uncertainty of the experimental measurements.
However, the original SW model is inconvenient to be directly applied to thermodynamic calculation and numerical simulation due to hundreds of empirical coefficients. Hence, this state-of-the-art model is integrated into REFPROP (reference fluid thermodynamic and transport properties) [24] to reference properties of CO2, supplemented by auxiliary models for the transport properties [25]. In this study, all required thermodynamic properties and their derivatives are generated based on the real gas database REFPROP to form an RGP (real gas property) table, which includes both the single-phase region and the vapor–liquid region. The general form of the function in REFPROP to create the RGP table is written as
y = f ( x 1 , x 2 )
where y denotes a , C P , h , p , S , T , γ , μ or ρ ; x 1 is h , p , T or ρ ; and x 2 stands for h , p , Q , S or ρ . The fundamental parameters for the RGP table are T and p .

2.2. Numerical Method for SCO2 Compressor

The CFD code is validated based on the testing results of a Sandia SCO2 centrifugal compressor [18,26], which includes an unshrouded impeller and a vaned diffuser. The geometrical parameters and flow boundary conditions of the compressor are listed in Table 1, and the solid model is given in Figure 2.
The Reynolds-averaged Navier–Stokes equations are solved using NUMECA software suit (v10.2, NUMECA International, Brussels, Belgium). The k ω SST (shear stress transport) turbulence model with an extended wall function is adopted to resolve turbulence, which can provide high-accurate results for the three-dimensional flow with strong pressure gradients, moderate curvature, and flow separation [27]. The approach of conservative coupling by pitchwise rows is adopted to deal with the rotor–stator interface of the compressor stage. This approach is capable to provide an exact conservation of mass flow, momentum, and energy through the interface. The spatial discretization used for the computation is a central scheme with artificial viscosity, and the time integration scheme is an explicit four-step Runge–Kutta algorithm. The residual smoothing, local time stepping, and multi-grid scheme are employed to accelerate the convergence.
A structured mesh with H-O-I topology is selected for the Sandia SCO2 compressor. The size of the first cell to the wall y wall is estimated by a truncated series solution of the Blasius equation as [28]
y wall = 6 ( c ref ν ) 7 / 8 ( L ref 2 ) 1 / 8 y +
where, c ref is the reference velocity and it is usually specified as the impeller inlet velocity, ν represents the kinematic viscosity of fluid, L ref is the reference length and it is often specified as the impeller inlet blade height, and y + denotes the non-dimensional distance of first cell to the wall.
Since the kinematic viscosity of SCO2 is quite small (the fluid density is very large while the dynamic viscosity is small), the Reynolds number of flows in SCO2 compressor is very high. For high-Reynolds number condition, the recommended y + range of k ω SST turbulence model (with an extended wall function) is between 20–50 [28]. In this extended wall function, the turbulent kinetic energy and the turbulent dissipation rate are fitted with polynomials to the DNS (direct numerical simulation) data [29]. Therefore, it allows to accurately solve the turbulence properties in the near wall region when the y + is in the recommended range. Here, y + 30 is selected for the Sandia SCO2 compressor and this value is also adopted by many other studies for SCO2 compressor simulations [13,30,31]. According to Equation (2), the first cell to the wall is y wall = 3 × 10 6 m .
Another frequently-used strategy to simulate the flow field of SCO2 compressor is the k ω SST turbulence model (no wall functions) with quite small y + (close to unity) [17,27]. In our study, however, due to the extremely small kinematic viscosity of SCO2, a small value of y + will lead to a quite small grid size near the wall ( y + = 1 , y wall = 1 × 10 7 m ). As a consequence, the aspect ratio of grid cells near the wall would be very large (more than 10 4 ), which might result in a low-accuracy simulation in boundary layers due to the large numerical dissipation of poor-quality mesh. In order to improve the mesh quality, much more grid nodes should be added in the computational domain, and this would greatly increase the computational effort.
Our numerical tests show that the extended wall function approach ( y + = 30 , y wall = 3 × 10 6 m , maximum aspect ratio is 350, total mesh is 2.69 million) can provide more accurate results (compared to experimental results) than the case without wall function ( y + = 1 , y wall = 1 × 10 7 m , maximum aspect ratio is above 10 4 , same total mesh). Hence, the extended wall function method might be a better way to balance the computational effort and simulation accuracy when predicting condensation in impeller leading edge of SCO2 compressors.
A baseline RGP table is preliminarily generated by cubic spline interpolation with 101 samples in the temperature range 216.6–1000 K and the pressure range 1–80 MPa (see Table 2). Based on the baseline RGP table, the mesh independency investigation is firstly conducted by coarse, medium, and fine meshes with total cell numbers of 1.75, 2.69, and 3.70 million, respectively (for a single passage of the impeller and vaned diffuser). It is clear from Figure 3a that the medium mesh seems to provide a good compromise between the accuracy and computational effort. Hence, this mesh (see Figure 4) is used for the rest of simulations.
On the other hand, the resolution of the RGP table may have a large effect on simulation results, since the fluid state is close to the critical point at the impeller inducer and its thermodynamic properties show a severe nonlinearity. Theoretically, more samples of the RGP table (higher resolution) will contribute to a higher accuracy of simulation. Nonetheless, this may significantly decrease the calculation stability. A smaller CFL (Courant–Friedrichs–Lewy) number is required for an RGP table with higher resolution.
Table 2 gives the other three RGP tables in addition to the baseline table, in which the resolution shows an upward trend. The fifth column of the table shows the corresponding maximum CFL numbers to achieve a convergent solution under the same initial value for design mass flow rate. In order to clearly compare the computational effort, the required total running time of different RGP tables is also illustrated in the table. Each simulation was conducted parallelly on a workstation with a 24-core processor (Xeon(R) E5-2670 v3 2.3 GHz) and 64GB RAM (random-access memory), and the CPU (central processing unit) and RAM utilizations were about 80% and 45%, respectively.
Figure 3b illustrates the effects of the RGP resolution on the compressor performance. It is clear from the figure that the aerodynamic performance is much more sensitive to the resolution of the RGP table than to the mesh size. From Table 2 and Figure 3b, it is found that compared to RGP-2, RGP-3 introduces limited improvement for the simulation accuracy but greatly increases the computational time. Therefore, RGP-2 achieves a good balance between the numerical accuracy and computational time, and this RGP table is selected for the remaining studies.
Table 3 shows the comparison of the predicted and measured aerodynamic performance of the SCO2 compressor based on the medium mesh and RGP-2. Generally, the prediction matches the measurement well under low-speed operating conditions ( 56 , 000 rpm ). For high-speed conditions, the maximum relative error is about 5.8%, which is acceptable for SCO2 compressor simulation [17]. Table 3 confirms the accuracy of the present numerical method.
The main advantages of the confirmed numerical method are (1) the independency studies of the meshes and RGP resolution are implemented, which can minimize the errors from unreasonable mesh density and unreal thermodynamic properties of working fluid; (2) the k ω SST turbulence model with an extended wall function is discussed in more detail, and it might be a better approach to balance the computational effort and simulation accuracy when predicting condensation in impeller leading edge of SCO2 compressors.

3. Impeller Inlet Design Method

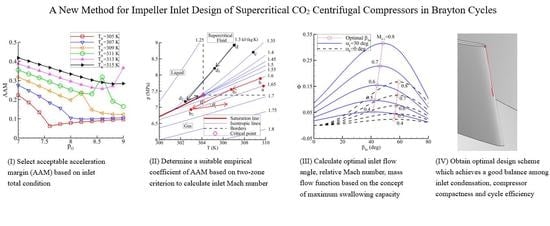
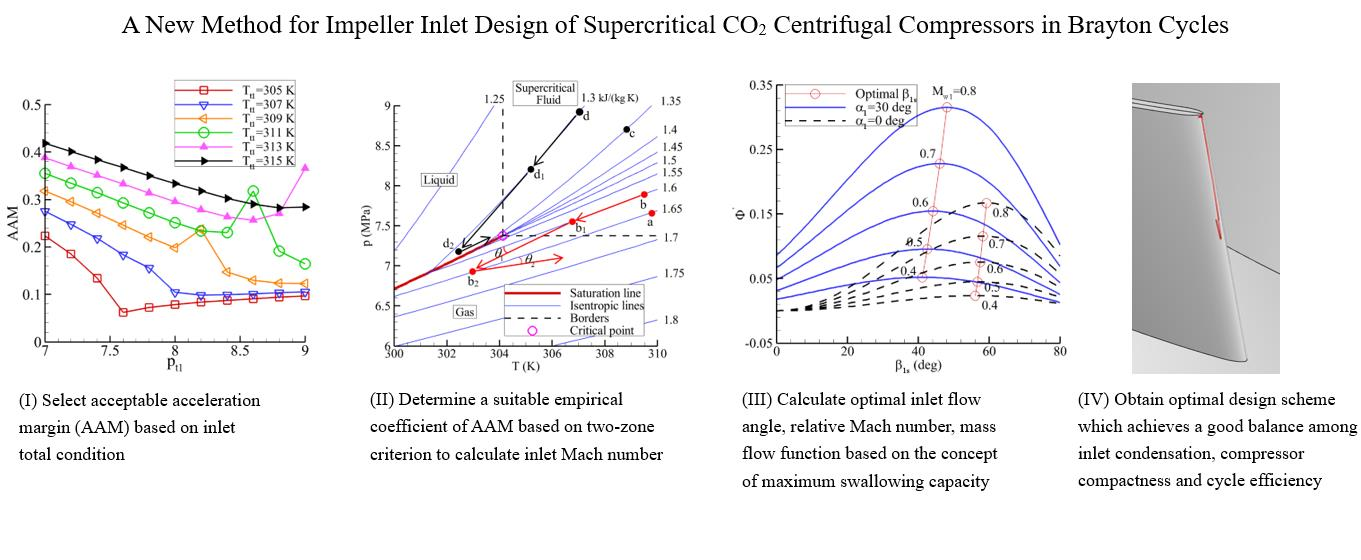
In order to prevent the inlet condensation and keep the compressor geometrical compactness but remain the high cycle efficiency, a new method of designing impeller inlet is proposed for SCO2 compressors. This method is made up of the maximum swallowing capacity concept of real gas and a new condensation design principle.

3.1. Maximum Swallowing Capacity

In centrifugal compressor, the mass flow function Φ is usually used to assess the flow capacity of an impeller [32], and it is defined as
Φ = m ˙ ρ t 1 D 2 2 a t 1
The equation of continuity at the impeller inlet is written as
m ˙ = ρ 1 A 1 c 1 m
Using the definition of the impeller inlet shape factor k = 1 ( D 1 h / D 1 s ) 2 , the impeller inlet area A 1 is
A 1 = π 4 ( D 1 s 2 D 1 h 2 ) = π 4 k D 1 s 2
For constant angular velocity, the diameter ratio equals the blade speed ratio as
D 1 s D 2 = u 1 s u 2
Substituting Equations (4)–(6) into Equation (3) yields
Φ = π k 4 ρ 1 ρ t 1 u 1 s 2 u 2 2 c 1 m a t 1
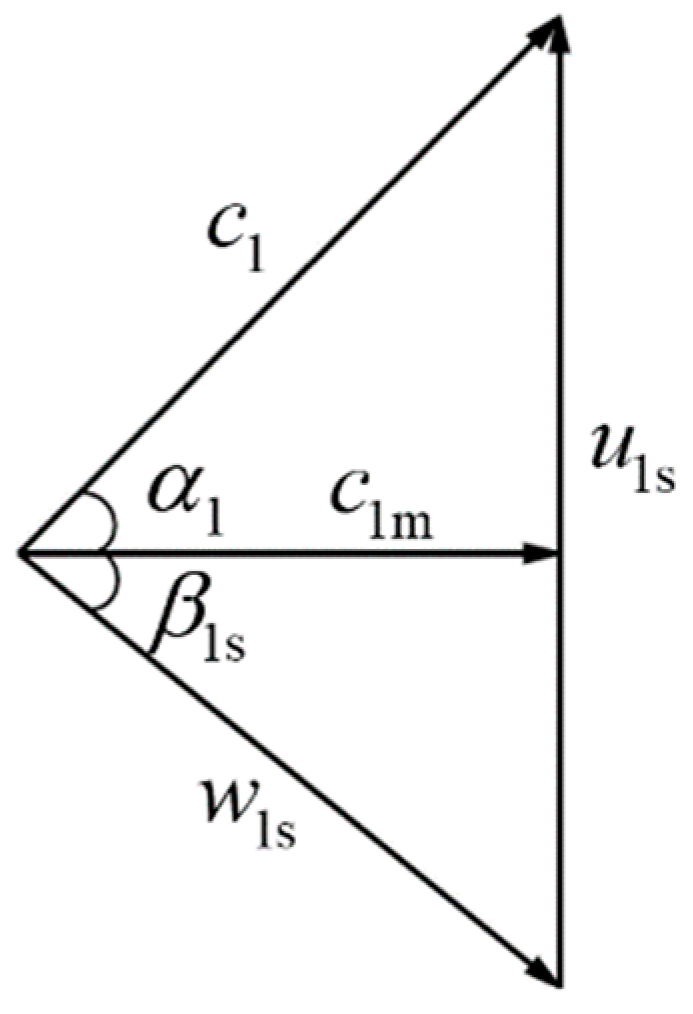
From the impeller inlet velocity triangle (see Figure 5), we obtain
c 1 = c 1 m cos α 1 ;   c 1 m = w 1 s cos β 1 s ;   u 1 s = w 1 s cos β 1 s ( tan β 1 s + tan α 1 )
Substituting Equation (8) into Equation (7) yields
Φ = π k 4 ρ 1 ρ t 1 w 1 s 2 cos 2 β 1 s ( tan β 1 s + tan α 1 ) 2 u 2 2 w 1 s cos β 1 s a t 1 = π k 4 ρ 1 ρ t 1 a 1 3 a t 1 3 w 1 s 3 a 1 3 a t 1 2 u 2 2 cos 3 β 1 s ( tan β 1 s + tan α 1 ) 2 = π k 4 M w 1 3 M u 2 2 ρ 1 ρ t 1 a 1 3 a t 1 3 cos 3 β 1 s ( tan β 1 s + tan α 1 ) 2
The above equations are derived based on the fundamental theories of turbomachinery, and they are independent of fluid properties.
For Equation (9), the remaining task is to crystallize ρ 1 / ρ t 1 and a 1 3 / a t 1 3 . In the case of a perfect gas, it is easy to give their specific equations based on aerodynamic correlations. However, for a real gas case especially near the critical point, these equations would be much more complicated.
According to the reference [33], the relations between the static parameters and total ones for a real gas case are written as
p p t = ( 1 + n s 1 2 M 2 ) n s n s 1 ρ ρ t = ( 1 + n s 1 2 M 2 ) 1 n s 1
where n s is the isentropic exponent. It can be derived from the fundamental equations of thermodynamics as
n s = γ β T p
where the specific heat ratio γ and the isothermal compressibility β T are
γ = C P C V = ( p v ) s / ( p v ) T β T = 1 v ( v p ) T
It is clear from Equation (11) that in the case of the real gas, the isentropic exponent n s is no longer equal to the specific heat ratio γ . The n s also involves the isothermal compressibility β T in addition to the γ , which is significantly different from the perfect gas.
Note that in the derivation of Equation (10), it assumes that the isentropic exponent remains constant from the total to static conditions ( n s , t = n s ). This assumption is reasonable when the fluid state (both total and static) is not close to the critical point. In this case, the variations in n s are small enough such that an average value between the total and static conditions can be used.
The speed of sound for the real gas under the static and total conditions can be respectively written as
a = n s p ρ ;   a t = n s , t p t ρ t
Substituting Equation (10) into Equation (13) yields
a a t = ( 1 + n s 1 2 M 2 ) 1 2
Concretely, substituting the impeller inlet parameters into Equations (10) and (14), and replacing the absolute Mach number by the relative one using Equation (8) yields
ρ 1 ρ t 1 = ( 1 + n ¯ s 1 1 2 M w 1 2 cos 2 β 1 s cos 2 α 1 ) 1 n ¯ s 1 1 a 1 a t 1 = ( 1 + n ¯ s 1 1 2 M w 1 2 cos 2 β 1 s cos 2 α 1 ) 1 2
where n ¯ s 1 is an average value between the total and static conditions of the impeller inlet. It reads
n ¯ s 1 = 1 2 ( γ t 1 β T , t 1 p t 1 + γ 1 β T , 1 p 1 )
Substituting Equation (15) into Equation (9) yields
Φ = π k 4 M w 1 3 M u 2 2 cos 3 β 1 s ( tan β 1 s + tan α 1 ) 2 ( 1 + n ¯ s 1 1 2 M w 1 2 cos 2 β 1 s cos 2 α 1 ) 3 2 + 1 n ¯ s 1 1
It is clear from Equation (17) that the mass flow function Φ can be generally expressed as the function of the non-dimensional parameters such as M w 1 , M u 2 , β 1 s , and α 1 .
Eliminating the machine Mach number M u 2 in Equation (17) yields the modified mass flow function Φ as
Φ = 4 M u 2 2 π k Φ = M w 1 3 cos 3 β 1 s ( tan β 1 s + tan α 1 ) 2 ( 1 + n ¯ s 1 1 2 M w 1 2 cos 2 β 1 s cos 2 α 1 ) 3 2 + 1 n ¯ s 1 1
Equation (18) contains four parameters ( M w 1 , β 1 s , α 1 , and n ¯ s 1 ), but only M w 1 and β 1 s are independent variables. The prewhirl angle α 1 is usually specified as a constant. Additionally, the inlet total condition is often given at the preliminary design phase for a compressor, leading to a determined value of n ¯ s 1 . Therefore, from Equation (18) it is possible to achieve the maximum swallowing capacity (maximum Φ ) of the SCO2 compressor under a certain inlet velocity (specified M w 1 ).
In Equation (18), letting Φ / β 1 s = 0 . This yields the criterion of the maximum swallowing capacity as
cos β 1 s = sin β 1 s tan α 1 + 1 3 cos β 1 s + M w 1 2 3 cos 2 α 1 ( cos 3 β 1 s tan α 1 cos 2 β 1 s sin β 1 s n ¯ s 1 cos β 1 s )
Equation (19) is expressed in an implicit form, and the iteration method is used to solve this criterion.
If the prewhirl angle α 1 is zero (axial inlet), the Equations (17)–(19) are simplified to be
Φ = π 4 k M w 1 3 M u 2 2 cos β 1 s sin 2 β 1 s ( 1 + n ¯ s 1 1 2 M w 1 2 cos 2 β 1 s ) 3 2 + 1 n ¯ s 1 1
Φ = M w 1 3 cos β 1 s sin 2 β 1 s ( 1 + n ¯ s 1 1 2 M w 1 2 cos 2 β 1 s ) 3 2 + 1 n ¯ s 1 1
cos β 1 s = n ¯ s 1 M w 1 2 + 3 + 2 M w 1 n ¯ s 1 M w 1 2 + 3 2 M w 1 2 M w 1
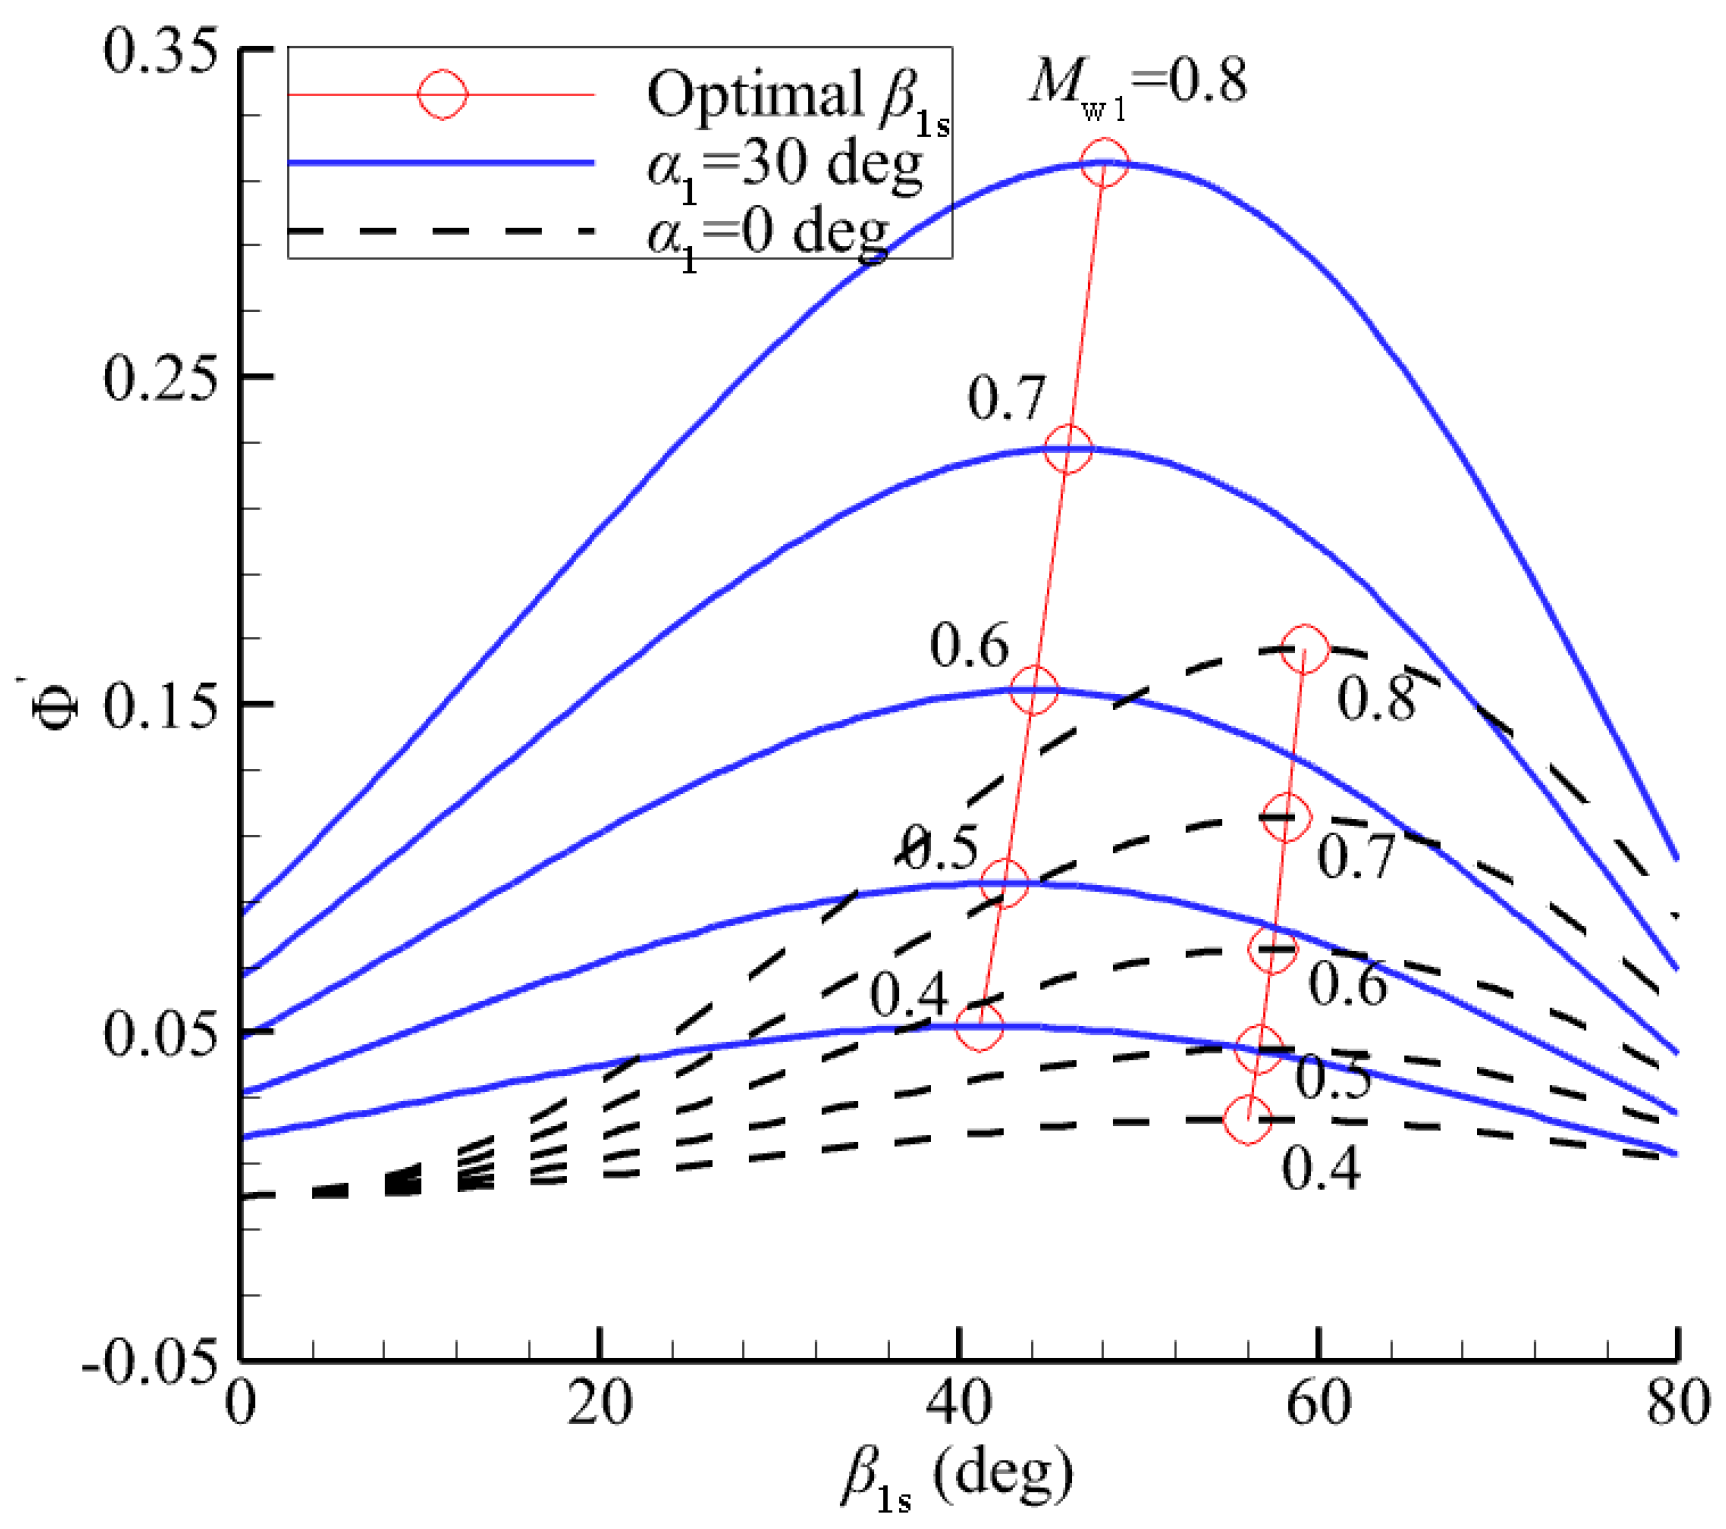
The modified mass flow function Φ is plotted over β 1 s for a series of M w 1 at two different values of prewhirl angle ( α 1 = 0 deg and 30 deg ) in Figure 6. It shows that for a given M w 1 , there exists an optimal β 1 s leading to the maximum swallowing capacity (maximum Φ ). In other words, for a specified flow capacity (given Φ ), there is a certain β 1 s corresponding to the minimum M w 1 . It is widely recognized that reducing M w 1 is one of the most important design objectives for high speed compressors since it can minimize the passage aerodynamic losses and improve the isentropic efficiency. On the other hand, M w 1 is related to the fluid acceleration at impeller inlet. Thus, restricting M w 1 may help limit the condensation near the impeller inducer, which is a special design criterion for SCO2 compressors.
Therefore, the maximum swallowing capacity concept for impeller inlet design has the potential to balance the inlet condensation and compressor compactness while maintain the cycle efficiency. At the preliminary design phase, the parameters Φ , M u 2 , α 1 and n ¯ s 1 can be usually predefined based on the design specification, and the variables k , M w 1 , and β 1 s are expected to be determined. However, there are only two independent Equations (17) and (19) for the above three unknown variables, for which an additional equation should be supplemented. As a matter of fact, the condensation design principle in the next subsection tends to provide this equation.

3.2. Condensation Design Principle

Though the total condition at the impeller inlet is located in the supercritical region, the flow acceleration at the impeller inducer may cause the local static properties of the fluid to enter the two-phase region (reach or cross the saturation line). As a result, the aerodynamic losses will increase since the two-phase fluid will break the original flow structures. Meanwhile, the flow becomes unstable due to the sharp discontinuity of the fluid properties near the saturation line. The term “condensation” in this study is not limited to represent the change of the physical state of a fluid from the gas phase into the liquid phase. This term is generalized to deal with the fluid reaching or crossing the saturation line (including the condensation and vaporization), which will be further explained in Figure 7.
In order to limit the condensation near the impeller inlet, an effective and objective indicator should be firstly defined to estimate the probability of entering the condensation. The inlet absolute Mach number M c 1 represents the degree of the fluid expansion from the total to static conditions (the first acceleration). This parameter is selected as the indicator of potential condensation. Further, M c 1 is linked to the inlet relative Mach number M w 1 as follows
M w 1 = M c 1 cos α 1 cos β 1 s
Equation (23) is actually the third independent equation for the impeller inlet design in addition to Equations (17) and (19). Therefore, if we can determine a reasonable value of M c 1 , it is possible to limit the inlet condensation and achieve a compact compressor design simultaneously. Here, it is assumed that M c 1 is the function of the impeller inlet total condition as
M c 1 = g ( T t 1 , p t 1 )
The remaining task is to determine the specific form of the function g in Equation (24).
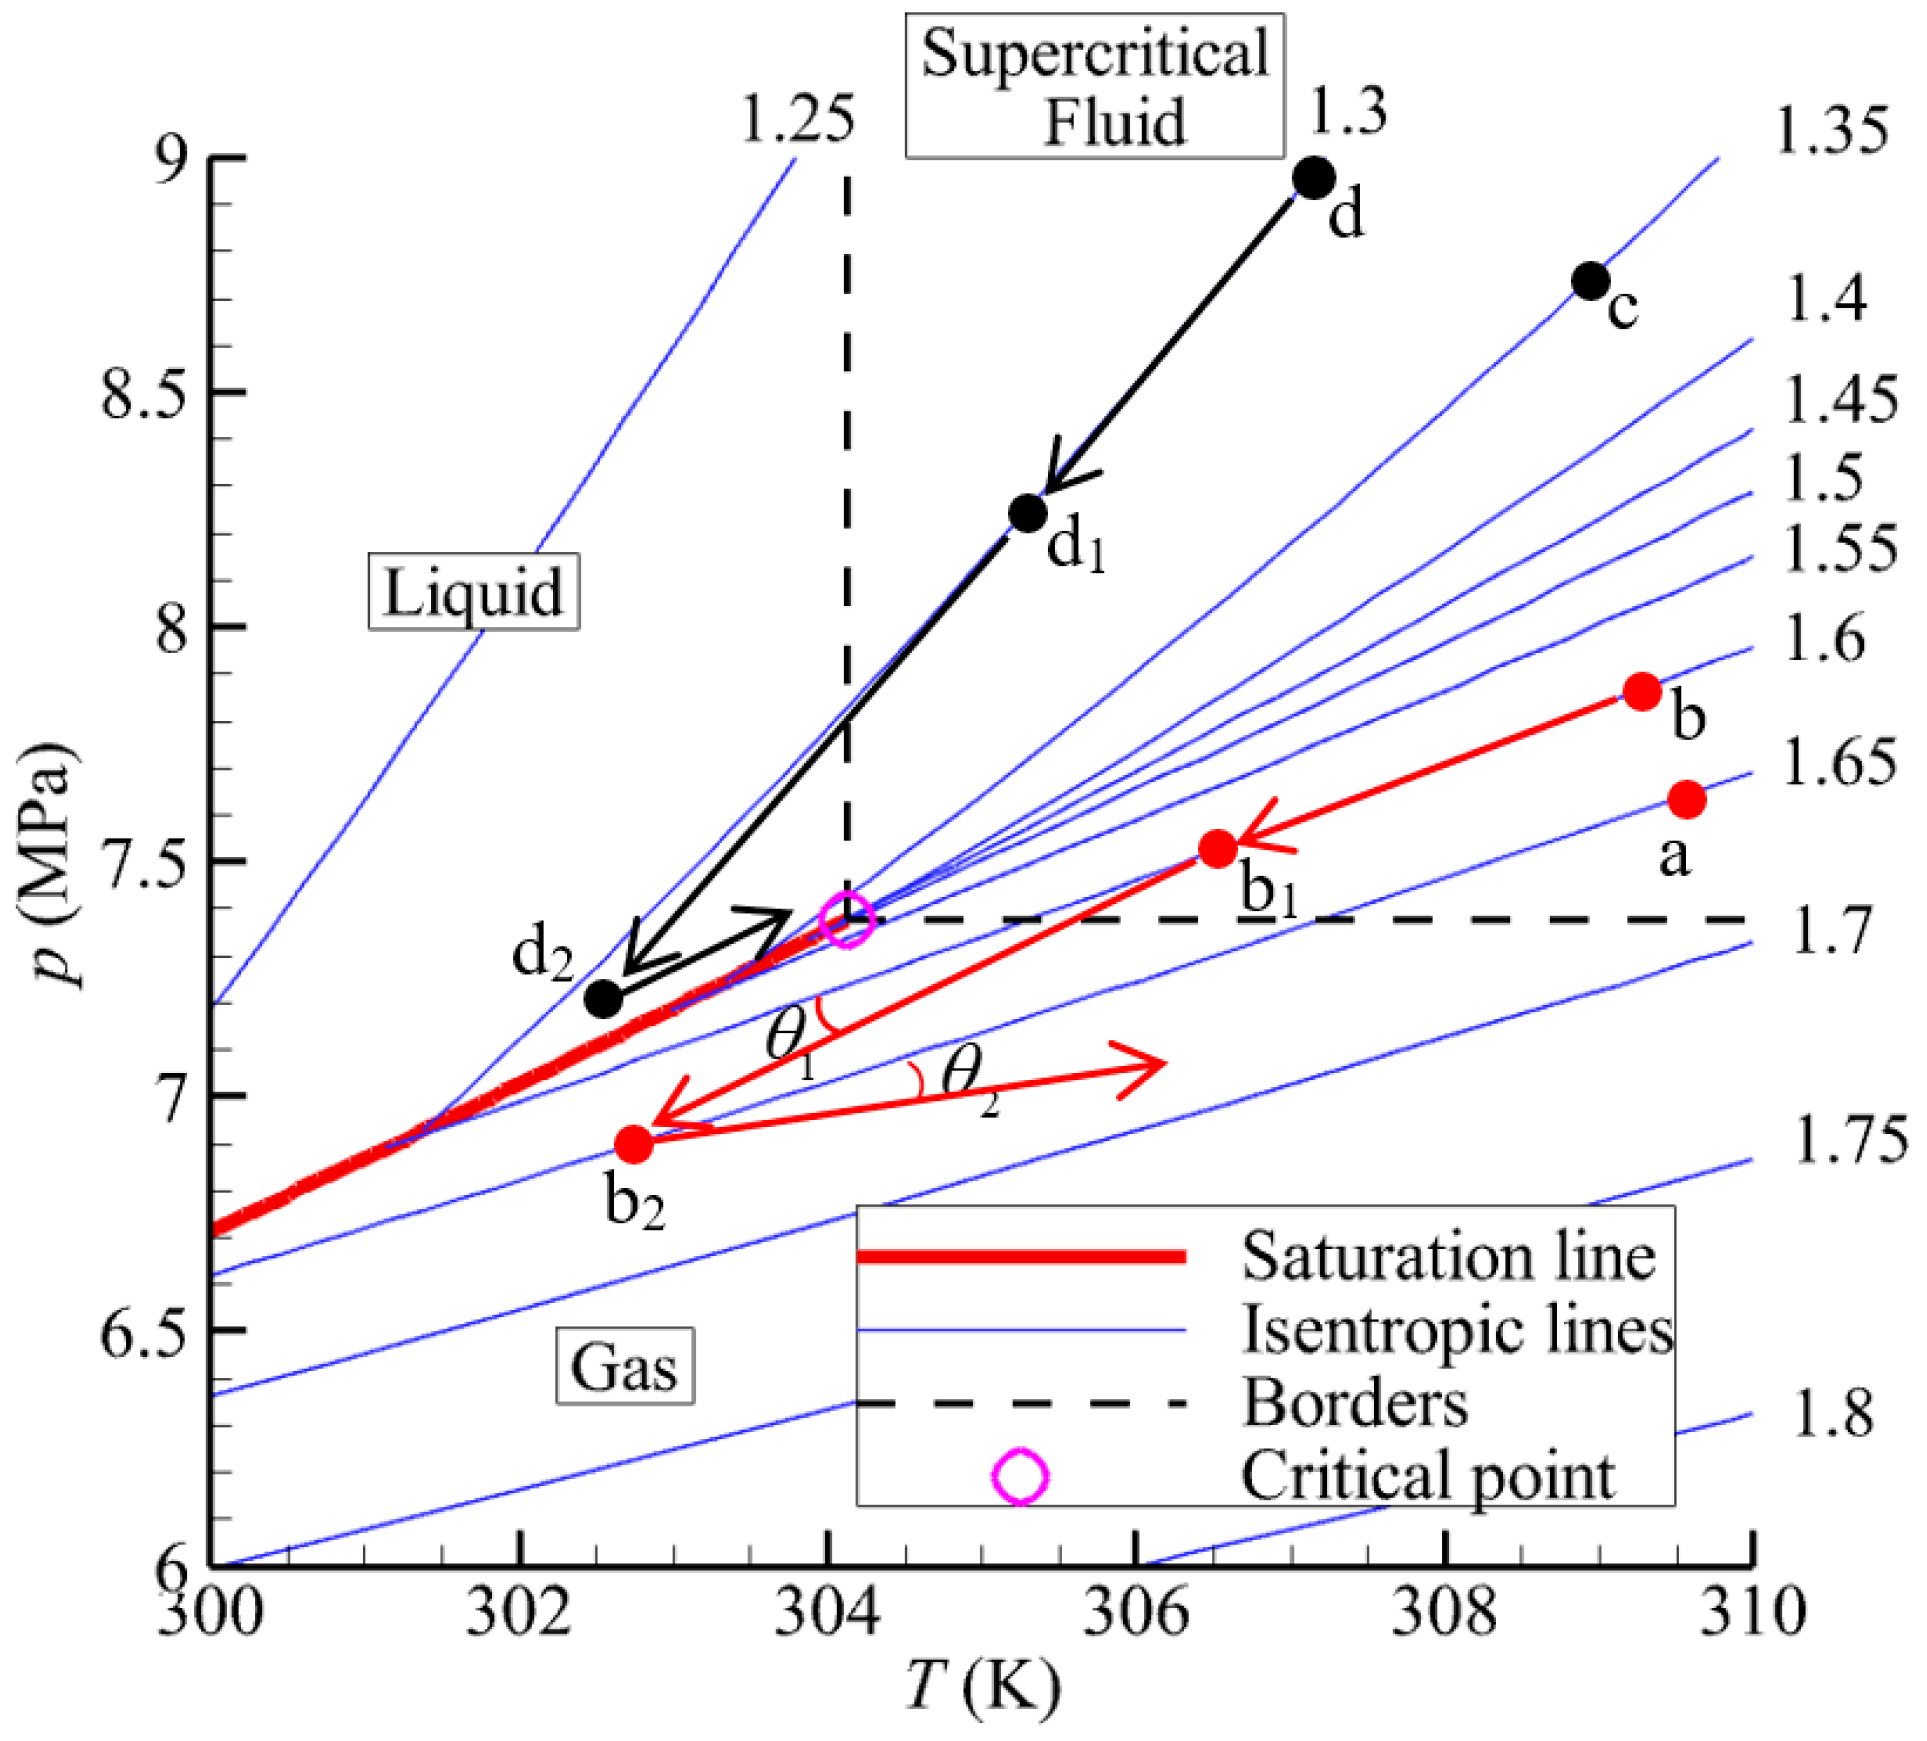
Now, we consider the expansion process at the impeller inlet. As shown in Figure 7, the red thick line is the saturation line, and the blue lines are the isentropic lines, for which the clockwise direction indicates increasing entropy. The pink hollow circle is the critical point. The whole region is divided into three parts: gas, liquid, and supercritical fluid.
Taking point b as an example: point b represents the total condition, point b 1 is the corresponding static state. At the impeller inlet, point b reaches point b 1 through the isentropic expansion along the isentropic line (the first acceleration), and the red arrow shows the changing direction. Then, due to the contraction of the impeller inducer area and the curvature of the blade leading edge, the flow will further accelerate from point b 1 to point b 2 (the second acceleration). This expansion process is nearly adiabatic rather than isentropic. Therefore, the changing direction deviates from the isentropic line and points to a region with larger entropy, and the deviation angle θ 1 > 0 . Finally, as the fluid flows through the impeller passage, both pressure and temperature increase along the passage. The entropy of this process rises, and the corresponding deviation angle θ 2 > 0 .
Point d shows a similar process as point b illustrated above. However, the results of the two cases are completely different. From point b 1 to point b 2 , and further to a downstream point, the fluid moves away from the saturation line. In contrast, from point d 1 to point d 2 , and further to a downstream point, the fluid gets close to the saturation line. The moving trends indicate that point d is more likely stuck in the two-phase region than point b .
Therefore, the supercritical inlet total conditions for the SCO2 compressor should be split into two zones: Zone I and Zone II. Zone I contains the points a and b , which expand isentropically to the saturation line through the gas region, whereas Zone II comprises the points c and d , which go through the liquid region. The two types of inlet total conditions have the opposite directions to cross the saturation line and then enter the two-phase region (Zone I for condensation and Zone II for vaporization). Hence, different measures should be taken to limit two-phase flow for the two cases. Note that there is not phase change when the fluid crosses the border lines (dashed lines in Figure 7), since the isolines of thermodynamic properties (like isobar and isentropic lines) are continuous from supercritical fluid to gas or liquid.
Here, a simple procedure is proposed to judge the type of a specific inlet total condition ( T t 1 , p t 1 ) as follows:
Procedure I
(1) Obtain the total entropy S t 1 = f ( T t 1 , p t 1 ) according to Equation (1); from the total to static condition through the isentropic expansion, the static entropy equals the total one S 1 = S t 1 .
(2) Assume that it reaches the critical temperature through the isentropic expansion, then the corresponding reference pressure is p ref = f ( T cr , S 1 ) .
(3) Compare the reference pressure p ref and the critical pressure p cr , if p ref > p cr , the point is in Zone II, otherwise, the point belongs to Zone I.
Supposing that the fluid does not enter the two-phase region, the maximum degree of the isentropic expansion is to reach the saturation line. The maximum achievable Mach number in this expansion process, called MAM (maximum acceleration margin), is used to represent the degree of the expansion. In essence, MAM can be considered as an equivalent distance between the inlet total condition and the saturation line. Obviously, the impeller inlet absolute Mach number M c 1 is smaller than MAM.
Here, an algorithm is given to obtain MAM for a specified inlet total condition ( T t 1 , p t 1 ), and the procedure is:
Procedure II
(1) Obtain the total entropy S t 1 = f ( T t 1 , p t 1 ) according to Equation (1); from the total condition to the saturation line through the isentropic expansion, the static entropy equals the total one S 1 = S t 1 .
(2) Use Procedure I to judge the type of the total condition, if it is in Zone I, Q = 1 ; Otherwise, Q = 0 .
(3) Set an initial temperature range [ T 1 , lower , T 1 , upper ] , the recommended values for T 1 , lower and T 1 , upper are 216.6 K and 304.13 K, respectively.
(4) Guess the value of temperature T 1 , g = ( T 1 , lower + T 1 , upper ) / 2 .
(5) Calculate corresponding values of entropy S 1 , g = f ( T 1 , g , Q ) , S 1 , lower = f ( T 1 , lower , Q ) .
(6) Check the error between S 1 and S 1 , g , if it meets the minimum error criterion, then T 1 = T 1 , g , go to the next step; otherwise, update the temperature range by the following rule:
{if ( S 1 , g S 1 ) ( S 1 , lower S 1 ) < 0 , then T 1 , upper = T 1 , g , else T 1 , lower = T 1 , g }, and go back to step (4).
(7) Calculate the total enthalpy h t 1 = f ( T t 1 , p t 1 ) , the static enthalpy h 1 = f ( T 1 , Q ) , the speed of sound a 1 = f ( T 1 , Q ) , the fluid velocity c 1 = 2 ( h t 1 h 1 ) , and the Mach number M c 1 = c 1 / a 1 . Here M c 1 is the MAM corresponding to the given total condition.
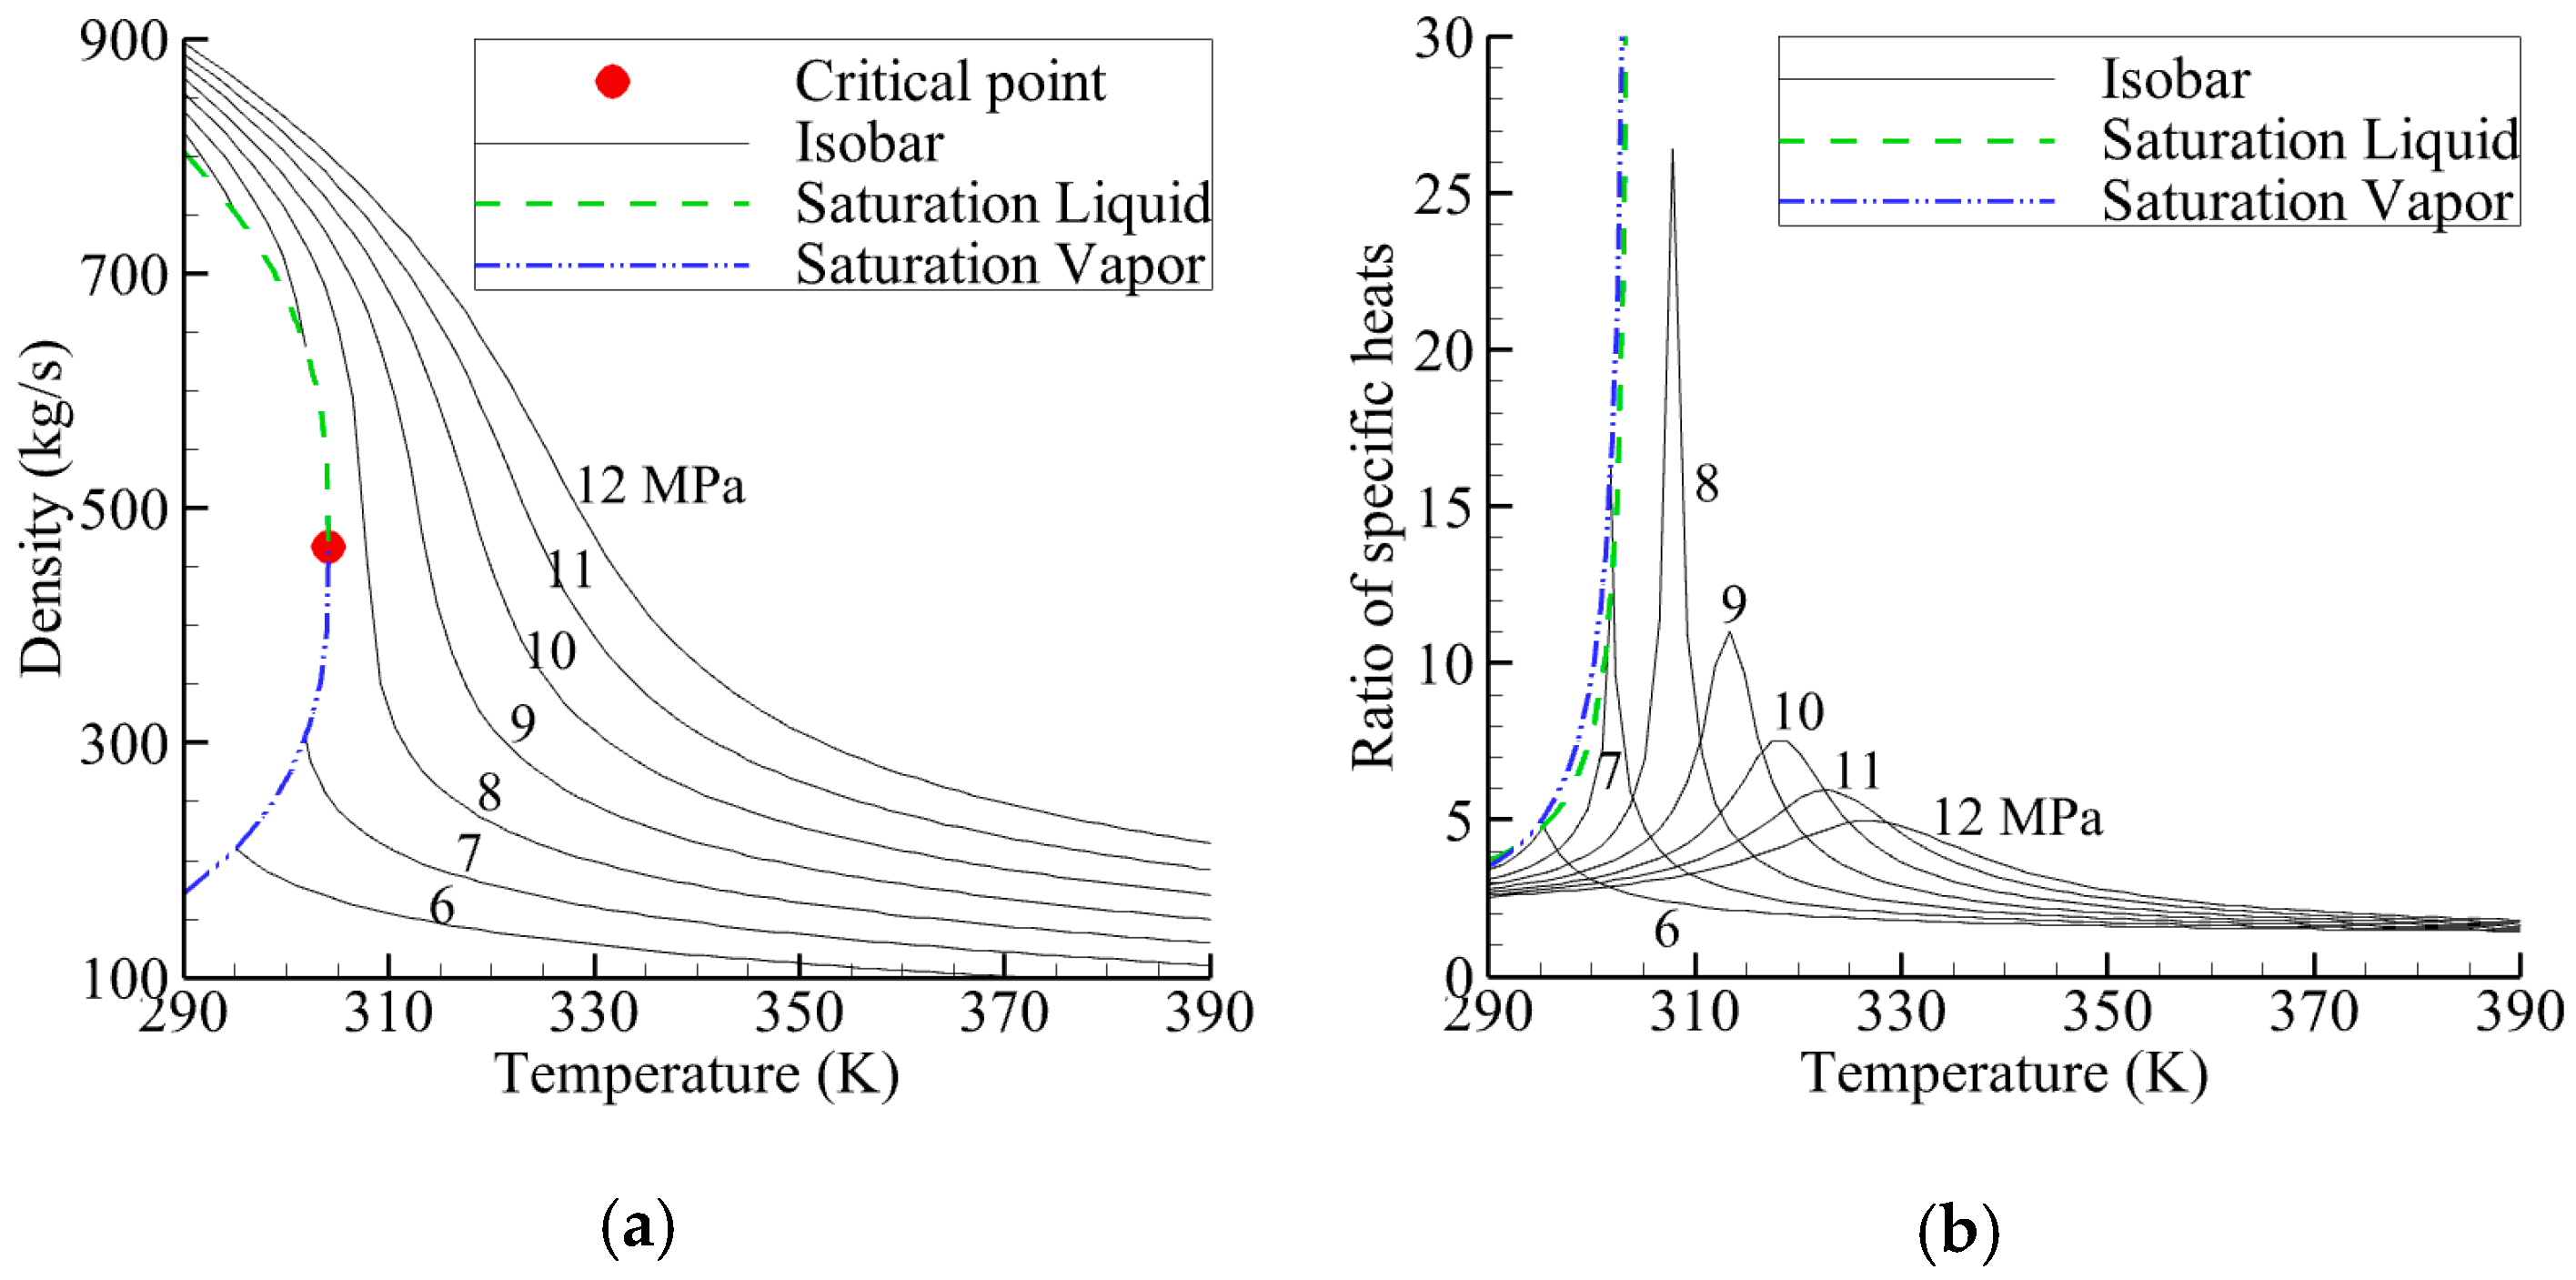
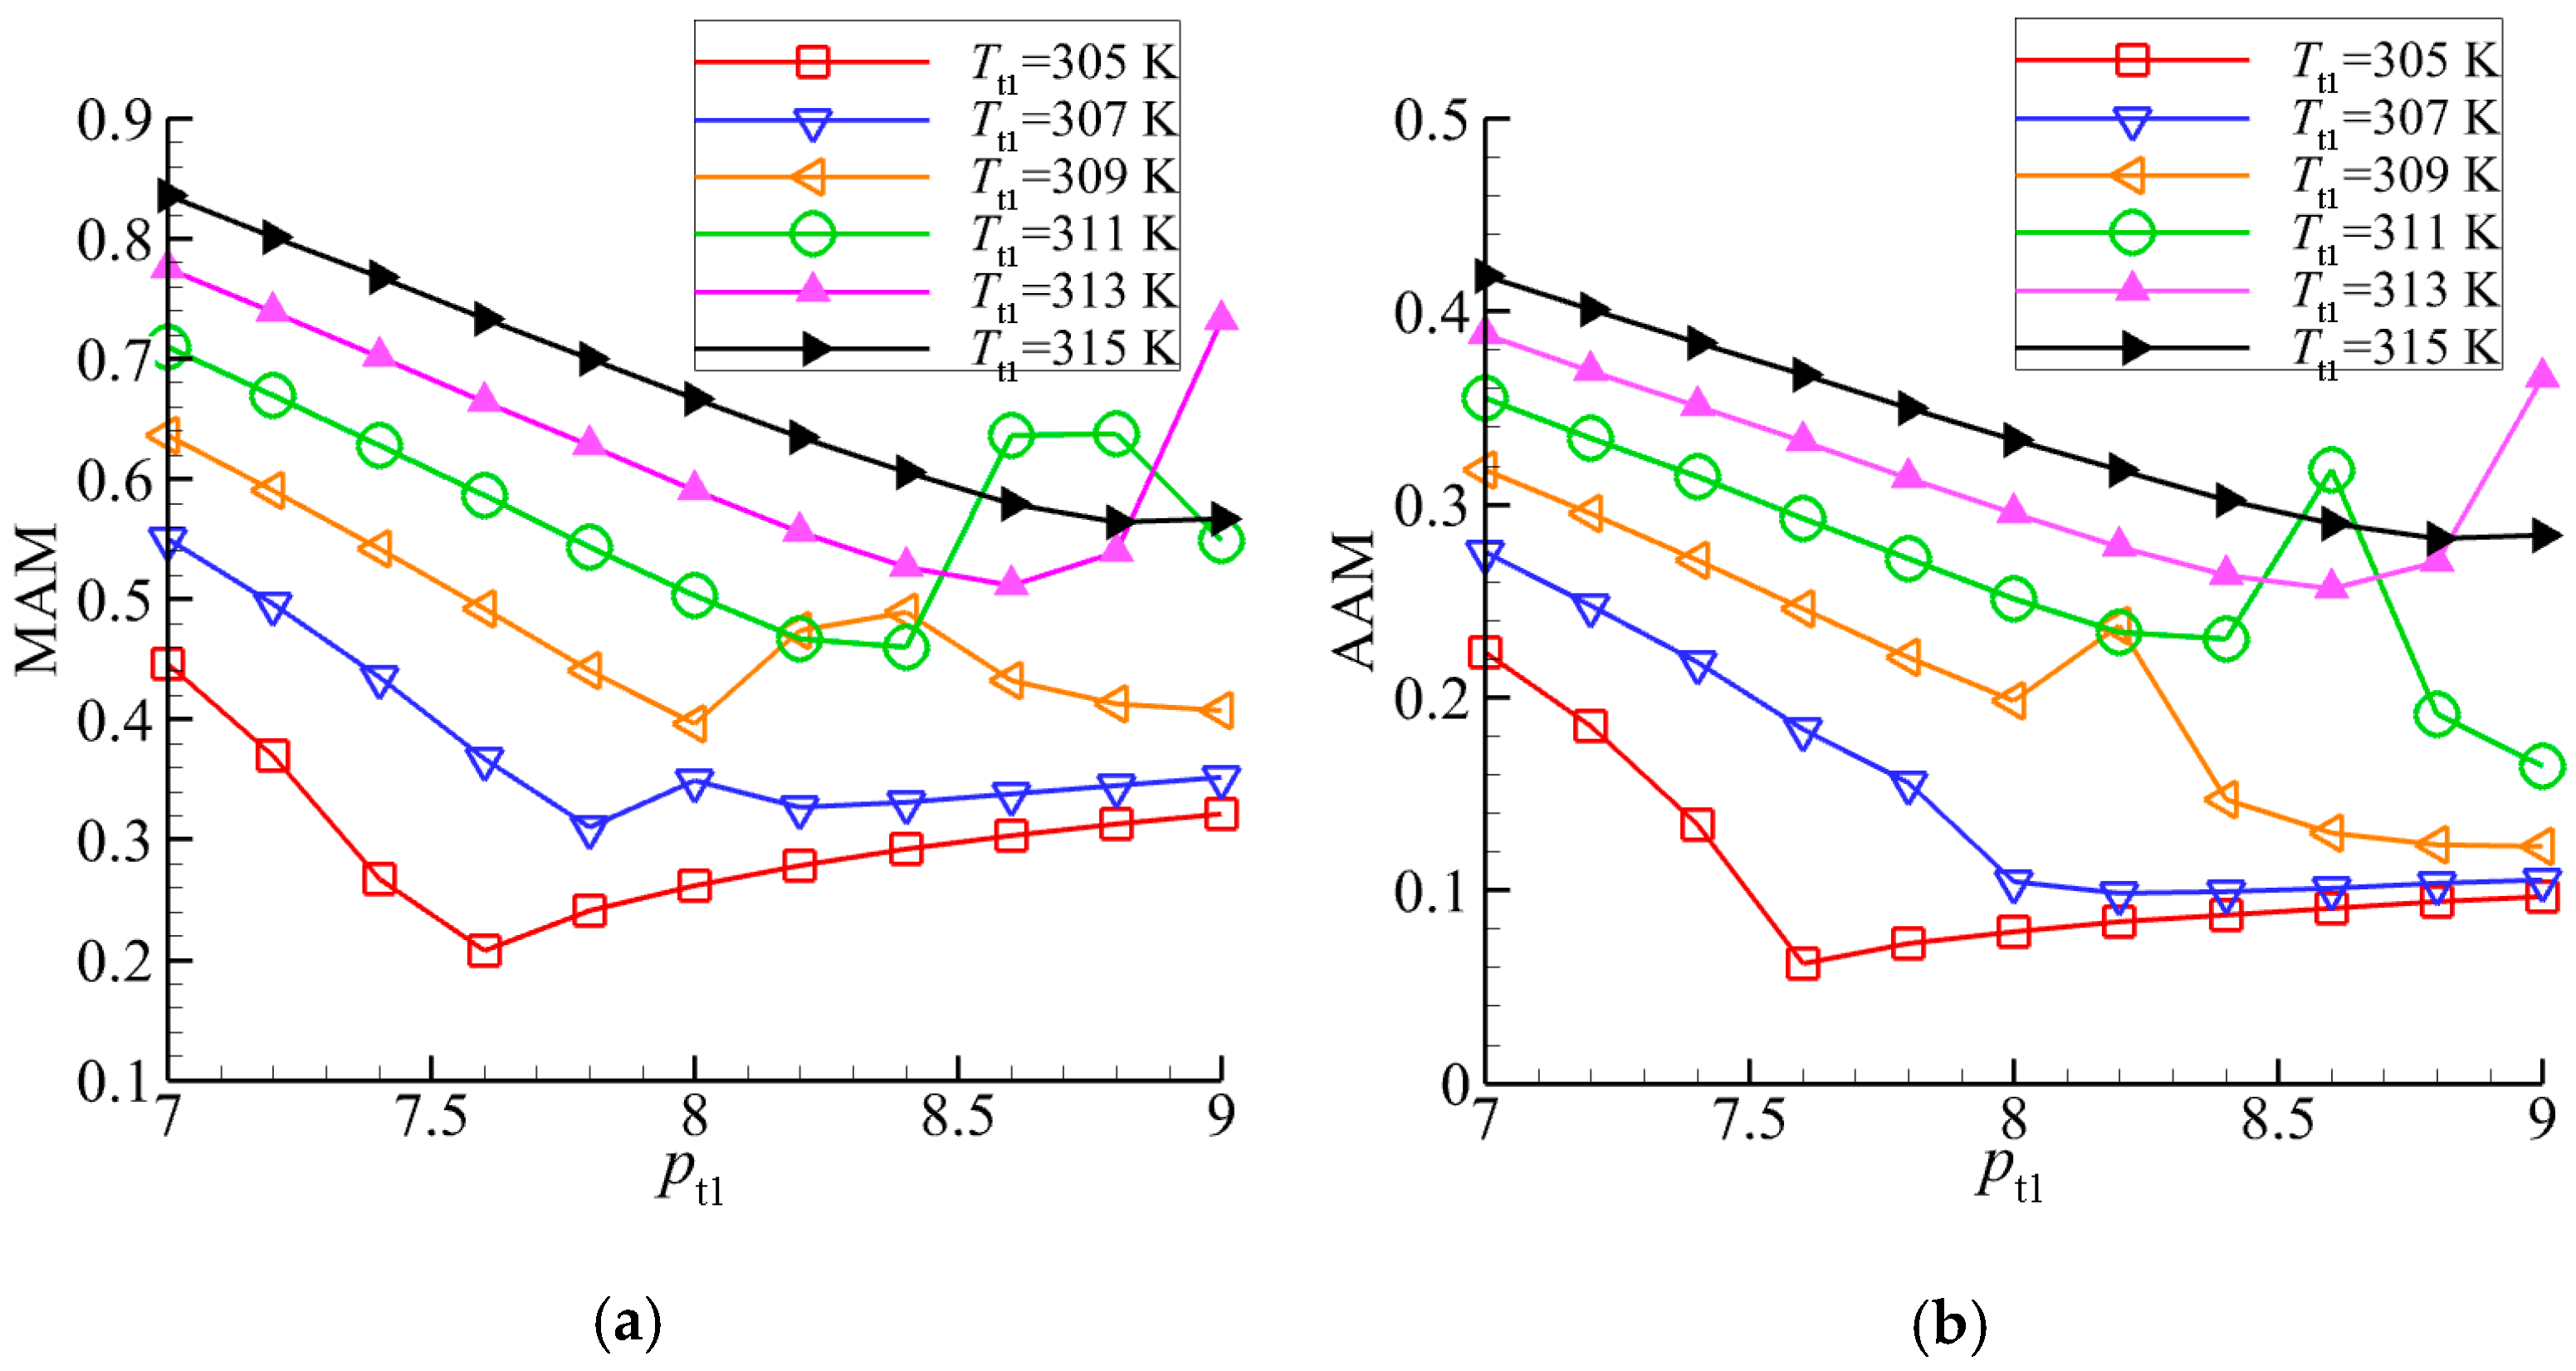
Based on Procedure II, MAM versus the impeller inlet total condition is plotted in Figure 8a. As shown in the figure, a severe nonlinear relationship between MAM and the total pressure under certain temperature is observed. The inflection points of those isotherms appear at higher pressure regions when the temperature increases. The value of MAM should be as high as possible in order to avoid two-phase flow at the impeller throat. At the same time, however, the cycle efficiency is reduced since the impeller inlet total condition is now far away from the critical point. According to the correlation between the cycle efficiency and the inlet total condition [18], 0 . 4 MAM 0 . 6 seems to be an acceptable range to balance the performance and condensation. In fact, MAM provides an alternative criterion to select the suitable inlet total condition, while it cannot be directly applied to the impeller inlet design with specified total condition.
Here, a more practical criterion for impeller inlet design is proposed: AAM (acceptable acceleration margin), which is an acceptable Mach number to limit condensation at impeller throat. AAM is defined as
AAM = λ × MAM
For a given inlet total condition, MAM is uniquely determined by procedure II, the remaining task is to find the empirical coefficient λ .
As illustrated in Figure 7, the flow near impeller leading edge will be further accelerated (the second acceleration) in addition to the acceleration from total to static condition (the first acceleration). According to the area ratio of throat-to-inlet, and local curvature of the blade leading edge, this second acceleration is about 2 times compared to the first acceleration. Assuming that after further acceleration, the fluid just reaches the saturation line, then the local Mach number equals MAM . Thus, AAM should be 0.5 times of MAM ( λ = 0.5 ). As analyzed in Figure 7, the condensation is more likely to take place for Zone II than Zone I. Therefore, a more conservative value of λ is selected for Zone II. The following expression is recommended for λ as
λ = { 0.5 , total condition Zone I 0.3 , total condition Zone II
The AAM versus impeller inlet total condition is plotted in Figure 8b, and the patterns of isotherms in the figure are similar to Figure 8a. By checking Figure 8b, we can quickly obtain AAM for a certain inlet condition.
In order to limit condensation, the impeller inlet absolute Mach number M c 1 should meet the criterion as
M c 1 = g ( T t 1 , p t 1 ) AAM
In design practice, M c 1 is selected based on the above equation.
At this point, all equations for impeller inlet design have been derived. By combining Equations (17), (19), (23) and (27), the key parameters such as k , M w 1 , and β 1 s are determined, which are able to limit the impeller condensation and achieve a compact compressor while maintain a high cycle efficiency.
To validate the condensation design principle, a method is proposed to detected fluid condensation based on the impeller inlet total condition ( T t 1 , p t 1 ) and the local flow parameters ( T , p , ρ ). For the detection of a certain point, the procedure is:
Procedure III
(1) Use Procedure I to judge the type of the impeller inlet total condition, if it is in Zone I, Q = 1 ; Otherwise, Q = 0 .
(2) Assume that the local flow parameters T , p , ρ are known. If T T cr , then the point is not in condensation, stop the procedure; otherwise, go next.
(3) Get reference pressure p ref = f ( T , Q ) and reference density ρ ref = f ( T , Q ) .
(4) If ( Q = 1 and p p ref and ρ ρ ref ) or ( Q = 0 and p p ref and ρ ρ ref ) , then the point is in condensation; otherwise, the point is not in condensation; stop the procedure.
Note that Procedure III assumes that condensation occurs suddenly as soon as the fluid reaches the saturation line, and this process has no delay. The heterogeneous nucleation on the passage wall and the homogeneous nucleation into the stream bulk are ignored.

4. Design Method Validation

A low-flow-coefficient SCO2 compressor stage is designed based on the inlet design method, and the flow field is simulated and analyzed to verify the effectiveness of the design approach.

4.1. Preliminary Design and Numerical Simulation

The design specification is given in Table 4. Based on the stage aerodynamic performance, the total pressure ratio and isentropic efficiency of the impeller are estimated as ε i = 2 , η i = 88.5 % . According to the inlet total condition, MAM is calculated by Procedure II and yields 0.4514, which is in the recommended range between 0.4 and 0.6. This means that the inlet total condition can achieve a high cycle efficiency. From Procedure I, we find that the inlet total condition belongs to Zone I, thus the empirical coefficient λ = 0.5 in Equation (26). By combining Equations (17), (19), (23), and (27), the key parameters of the optimal impeller inlet are obtained, and they are listed in Table 5 (the second column, Optimal Design). The inlet relative Mach number M c 1 of the optimal design is selected as M c 1 = 0.92 × AAM .
The optimal design meets the criterion of the maximum swallowing capacity (Equation (19)). This means that the compressor should be much more compact than those without the criterion. In order to validate this criterion, two additional compressors (reference design I and design II) are developed that do not follow the criterion (see Table 5). Their inlet flow angles β 1 s are specified as a constant (70 deg), instead of being calculated by Equation (19).
By comparing the optimal design and the reference I, we find that for a specified flow capacity (given mass flow function), this criterion is able to achieve a smaller inlet relative Mach number (smaller aerodynamic losses), and smaller impeller trim and impeller inlet area (more compact inlet geometry). If we compare the optimal design and the reference II, it is clear that for a given inlet relative Mach number, this criterion can increase the swallowing capacity of compressors (larger mass flow function). We can also find a more interesting phenomenon: even though the swallowing capacity is increased, a more compact impeller inlet might be also achieved.
The above results agree well with the theorical analysis in Section 3.1. Therefore, the design criterion of the maximum swallowing capacity (Equation (19)) has the potential to achieve a more compact design with smaller aerodynamic losses.
The optimal design in Table 5 is selected as the final preliminary design scheme for further three-dimensional design and CFD simulation. Table 6 summarizes the geometrical parameters of the optimal SCO2 compressor stage after three-dimensional design. Figure 9 illustrates the solid models of the impeller and volute. The numerical method established and validated in Section 2.2 is used for the simulation of the low-flow-coefficient SCO2 compressor stage. Similarly, the mesh independency and RGP table resolution investigations are also implemented for the compressor stage. As a result, the mesh with the total cell number of 3.49 million (1.79 million for the single impeller and 1.70 million for the volute) in combination with RGP-2 could achieve a better balance between the simulation accuracy and computational effort. Figure 10 presents the computational domain and mesh of the compressor stage. Note that an unstructured mesh with hexahedral cells is adopted for the volute. The wall cell width and expansion ratio of viscous layers are consistent with those of the impeller.
Table 7 shows the relative errors between the preliminary design (based on analytical equations in Section 3 and REFPROP database) and numerical simulation (from Navier–Stokes equations coupled with RGP table) for the SCO2 compressor at the design condition. In the Table 7, S1, S2, and S6 are the cross-sections of the impeller inlet, impeller outlet, and volute outlet, respectively. It is found that the numerical simulation results show satisfactory agreement with the preliminary design. Generally, the three-dimensional design meets the design specifications. It also confirms that the RGP table is able to reproduce the thermodynamic properties of REFPROP points with small errors, and RGP-2 is accurate and reliable for SCO2 compressor simulations.
Figure 11 shows the overall aerodynamic performance of the compressor at the design speed that is obtained from the numerical simulation. The isentropic efficiency peaks at the design mass flow rate (5 kg/s), which matches the design expectation. Overall, the compressor has a satisfactory aerodynamic performance over the whole speed line. However, simulation stability issues are encountered for the mass flow rate larger than 7.5 kg/s. The convergence problem is due to the potential condensation of the working fluid at the impeller inducer.

4.2. Results Analysis

This section presents the detailed flow analyses based on the numerical simulations to validate the inlet design method. As mentioned in Section 4.1, MAM of the designed compressor is in the recommended range. This implies that the inlet total condition can maintain a high cycle efficiency. Moreover, the compressor meets the criterion of the maximum swallowing capacity (Equation (19)), which means that the compressor compactness is theoretically guaranteed. This conclusion is further validated by the preliminary design results illustrated in Table 5. Therefore, the main task is to check whether this method can limit the condensation in the impeller inducer.
From the simulation results it is found that the low-pressure regions are mainly located upstream of the impeller, where the condensation is easy to happen. Thus, for the analysis of the condensation phenomenon, the focus is on the impeller instead of the volute.
Figure 12 illustrates the static pressure contours which are below the critical pressure for the design and off-design operating conditions at 10%, 50%, and 80% spans of the impeller. Three operating conditions: 3 kg/s, 5 kg/s, and 7 kg/s are analyzed, which correspond to the near surge condition, design condition, and near choke condition.
At the design condition (5 kg/s), low-pressure regions are found at the leading-edge suction sides of full and splitter blades. The regions result from the flow acceleration around the suction side of the blade leading edge due to the geometrical curvature. The condensation might take place in those regions.
When the compressor runs near the surge condition (3 kg/s), the mass flow rate decreases, leading to smaller inlet velocity and higher static pressure. On the other hand, according to the inlet velocity triangle, the smaller inlet velocity means a larger positive incidence angle at the leading edge, which intensifies flow acceleration on the suction side. The combined effect of the above two factors depends on their relative intensity. As a result, the flow acceleration is strengthened at 10% and 50% spans but is weakened at 80% span near the full blade. Furthermore, the acceleration is decreased over the whole span near the leading edge of the splitter blade.
Conversely, as the compressor operates near the choke condition (7 kg/s), the increasing mass flow rate will result in larger inlet velocity and lower static pressure. In addition, it forms a negative attack angle at the full blade, which contributes to the flow acceleration near the pressure sides of the blade leading edge. Both effects further aggravate the acceleration of the working fluid. As a consequence, a large low-pressure region has been found near the pressure side of the full blade leading edge. Sheltered by the full blades, the splitter blades are less affected by the change of the incidence angle, and the low-pressure region is still located on the suction side.
However, identifying low-pressure regions is not sufficient to justify the occurrence of the fluid condensation. Procedure III in Section 3.2 is used to detect the condensation near the impeller inducer based on the numerical simulation results. Figure 13 displays the condensation regions (marked in red) of the impeller near the surge condition, at the design condition and near the choke condition. Figure 13a shows the computational domain, in which region A is the leading edge of the full blade and region B represents the leading edge of the splitter blade. At the design condition, only a tiny condensation region is found near the suction side of the splitter blade leading edge (Figure 13c). When the mass flow rate decreases to approach the surge condition, the condensation region becomes larger and transforms to the suction side of the full blade leading edge (Figure 13b). This process is consistent with the local acceleration of the working fluid in Figure 12a. In contrast, when the compressor operates near the choke condition, the condensation is observed on the leading-edge pressure side of the full blade (Figure 13d) and the suction side of the splitter blade (Figure 13e), which corresponds to the low-pressure regions in Figure 12c.
By comparing Figure 12 and Figure 13, we can conclude that the low-pressure regions are mainly generated by the increased mean inlet velocity, while the condensation is mainly created by the local acceleration of the working fluid due to the geometrical curvature of the blade leading edge. Moreover, for the full blades, the fluid incidence angle (positive for the surge condition and negative for the choke condition) determines whether the condensation occurs on the leading-edge suction side or pressure side. However, sheltered by the full blades, the splitter blades are insensitive to the incidence angle, and the condensation is always observed on the leading-edge suction side.
Figure 13 confirms that the inlet design method can in general limit the condensation in the impeller inducer under the whole operating conditions.
To further discuss the flow characteristics of the compressor stage at design and off-design conditions, all computational points (control volumes) from the numerical simulations are plotted for the impeller (Figure 14) and the volute (Figure 15), respectively.
As shown in Figure 14, the blue filled triangle denotes the inlet total condition, and the green filled square stands for the inlet static one. The distance between them represents the degree of the isentropic expansion (the first acceleration), which can be quantified by the inlet absolute Mach number M c 1 . Obviously, this expansion tends to increase with the ascending mass flow rate. The outspread points below the green filled square denote the further expansion near the blade leading edge (the second acceleration). This expansion also presents an increasing trend with the rising mass flow rate. The distribution laws of the computational points below the inlet total condition completely correspond to those of the low-pressure regions in Figure 12. These phenomena can be explained by the following facts.
As mentioned in Section 3.2, the second acceleration in impeller inducer is due to two factors: (I) the contraction of the impeller inducer area; and (II) the curvature of the blade leading edge. When the mass flow rate increases, both the first acceleration and the factor (I) of the second acceleration will increase the mean inlet velocity of impeller, as a result, the outspread computational points below the inlet total condition are increased, and vice versa. However, once the mass flow rate deviates from the design condition (attack angle appears), the factor (II) of the second acceleration will boost the local velocity of working fluid near the suction side or pressure side of the blade leading edge, which causes the fluid to enter condensation. These analyses further conform the conclusion: the low-pressure regions (or computational points below the inlet total condition) are mainly generated by the increased mean inlet velocity, while the condensation is mainly created by the local acceleration due to the geometrical curvature of the blade leading edge.
Now, the partially enlarged details of Figure 14a–c are analyzed. During the second acceleration process of the working fluid near the blade leading edge (adiabatic but not isentropic), all computational points deviate from the isentropic line, resulting in a delay to reach the saturation line (the condensation). In this design case, the inlet total condition belongs to Zone I, which should be less likely to achieve the condensation as illustrated in Figure 7. Therefore, the numerical simulation results completely agree with the theorical analysis in Section 3.2, indicating that the condensation design principle is reliable.
Additionally, it is clear from Figure 14 that the computational points at the design condition are generally located along the isentropic line. However, the patterns of the computational points near the surge and choke conditions present larger scales. It means that the off-design conditions have caused more aerodynamic losses.
Figure 15 shows the simulation results of all computational points (control volumes) in the volute under the design and off-design conditions. It is found that the pattern scale of the computational points at the design condition is small, while those near the surge and choke conditions are large. This shows that more energy losses are observed in the volute under the off-design conditions.
Figure 15a shows that near the surge condition some computational points are below the critical point of the working fluid, and they might enter the two-phase region. Procedure III in Section 3.2 is used to detect condensation, showing that no condensation occurs in the volute.
As shown in Figure 15c, the croci filled circle denotes the average static condition at the volute outlet. Near the choke condition, the outspread computational points above the croci filled circle are much more than those under the other operating conditions. This means that the diffusion process in the volute is significantly non-uniform near the choke condition, and this will cause much more additional aerodynamic losses.

5. Conclusions and Remarks

In order to seek a better balance between the cycle efficiency, compressor geometrical compactness, and inducer condensation, a new method for designing impeller inlet is proposed for SCO2 compressors. In this method, the concept of the maximum swallowing capacity of real gas is coupled with a new condensation design principle. Based on the approach, a low-flow-coefficient SCO2 compressor stage is designed and analyzed. The following conclusions are drawn:
The mass flow function is generally expressed by a set of non-dimensional parameters for real gas compressors. An optimal inlet flow angle is derived to achieve the maximum swallowing capacity at a certain inlet relative Mach number, which contributes to the minimum energy losses and a more compact compressor geometry.
A new condensation design principle is developed, in which a novel concept of the two-zone inlet total condition for SCO2 compressors is firstly proposed, and then the acceptable acceleration margin (AAM) is derived as a criterion to limit the impeller inlet condensation.
A low-flow-coefficient compressor stage is designed based on the inlet design method. The mechanisms of the flow acceleration, which forms low-pressure regions and further produces the condensation, are analyzed under different operating conditions. It is found that the condensation is mainly created by the local acceleration of the working fluid due to the geometrical curvature of the blade leading edge rather than the mean inlet velocity. In addition, the fluid incidence angle determines the location of the condensation near the impeller leading edge. It is also found that the numerical simulation results agree well with the theorical analysis of the two-zone inlet total condition. The condensation design principle is efficient to limit the two-phase region in the impeller inducer.
Furthermore, there are some remarks of the proposed method:
The first one is that the method tends to obtain a compact geometry of compressors by achieving the maximum swallowing capacity and the minimum inlet relative Mach number. As a consequence, the design condition of the compressor developed by the method is much closer to its choke condition. Hence, the method is not suitable for designs that require a large choke margin (i.e., ultra-low-speed compressors). But this is not a serious limitation, since modern compressors are usually high-speed or even transonic/supersonic, where the design condition is very close to the choke condition (operating at unique incidence condition).
Another aspect is that the blade leading edge of the impeller in this study is elliptical type. This means that the local acceleration is ineluctable even at the design condition. Special features of blade leading edge could be adopted, such as extremely thin blades with reduced suction surface curvature, and leading-edge sweepback, then the fluid condensation at impeller inducer under the design condition would be further reduced. However, the effects of those special features on off-design conditions are much more complicated due to potential flow separations. For transonic or supersonic SCO2 compressors design, the interactions among shock waves, boundary layer separations, tip leakage vortexes, and phase transition might be the most tough challenge to balance the compressor compactness, cycle efficiency and inlet condensation.
A further limitation of the impeller inlet design method is that the condensation detection criterion (Procedure III) is conservative. It assumes that condensation (or evaporation) occurs suddenly as soon as the fluid reaches the saturation line, and this process has no delay. In fact, in an impeller inducer, phase transition proceeds at a finite time instead of an instant. If the expansion of the gas is rapid enough, the fluid attains a nonequilibrium state (crosses the saturation line) without condensation, since there is no enough time for fluid to form droplet when it just reaches the saturation line [34]. Thus, it is conservative to judge the occurrence of condensation by checking whether the fluid crosses the saturation line. A more accurate method is to define a ratio of timescales (the ratio of the residence time of fluid in the saturated region to the time of liquid droplet formation) to consider the condensation effects. When the ratio of timescales is below 1, the nucleation time is longer than the residence time, which means that condensation cannot really occur [16]. However, the determination of the timescales becomes challenging near the critical point, due to the increased coalescence of the molecules [12]. Hence, Procedure III in this article is a “rough” but much “safer” criterion. The focus of this study is on the trade-off exploration among the non-dimensional impeller inlet parameters and to achieve an optimal inlet geometry, rather that the nucleation mechanism. Therefore, the proposed method is still able to provide some useful information for compressor impeller inlet design at the preliminary design phase. In addition, this conservative condensation detection criterion (Procedure III) might be more suitable for off-design conditions of SCO2 compressors, since the accelerations of working fluid under such conditions are further intensified compared to the design condition (see Figure 14), and the condensation (or evaporation) is more likely to occur. Anyway, a more accurate condensation detection criterion should be developed to make the impeller inlet design method more accurate and robust over the whole operating range of SCO2 compressors.
The in-depth investigations of the above limitations are the authors’ future work.

Author Contributions

Conceptualization, X.L. and Z.L.; methodology, X.L.; validation, Y.Z. and H.Y.; formal analysis, X.L., Y.Z., and M.Z.; investigation, X.L.; writing—original draft preparation, X.L., H.Y., and M.Z.; and supervision and project administration and funding acquisition, Z.L. All authors have read and agreed to the published version of the manuscript.

Funding

This research is supported by National Natural Science Foundation of China [Grant No.11672206 and 11972250] and the National Key R & D Program of China [2018YFB0106200].

Conflicts of Interest

The authors declare no potential conflict of interest with respect to the research, authorship, and publication of this article.

Nomenclature

Notation
A Impeller inlet area (m2)
a Speed of sound (m/s)
AAMAcceptable Acceleration Margin
AMCAcceleration Margin to Condensation
C P Specific heat at constant pressure (J/(kg K))
C V Specific heat at constant volume (J/(kg K))
c Absolute velocity (m/s)
c ref Reference velocity (m/s)
CFDComputational Fluid Dynamics
CFLCourant–Friedrichs–Lewy
D Diameter (m)
DNSDirect Numerical Simulation
EOSEquation of State
f Function provided by REFPROP software
h Enthalpy (J/kg)
IVRInlet Velocity Ratio
k Impeller inlet shape factor, k = 1 ( D 1 h / D 1 s ) 2
L Thermal conductivity (W/(m K))
L ref Reference length
LKLee-Kesler model
M Mach number
M c 1 Inlet absolute Mach number
M w 1 Inlet relative Mach number at shroud
M u 2 Machine Mach number
m ˙ Mass flow rate (kg/s)
MAMMaximum Acceleration Margin
n s Isentropic exponent
n ¯ s Average isentropic exponent
p Pressure (MPa)
Q Quality (vapor fraction)
R Gas constant (J/(kg K))
RGPReal Gas Property
S Entropy (J/(kg K))
SCO2Supercritical Carbon Dioxide
SWSpan-Wagner model
T Temperature (K)
u Impeller blade speed (m/s)
v Specific volume (m3/kg)
w Relative velocity (m/s)
y wall Size of the first cell to the wall
y + Non-dimensional distance of first cell to the wall
Greek Symbols
α 1 Inlet prewhirl angle (deg)
β 1 s Inlet flow angle (deg) at shroud, relative to meridional direction
β T Isothermal compressibility (1/Pa)
γ Specific heat ratio
ε Total pressure ratio
η Isentropic efficiency, total to total
λ Empirical coefficient of AAM
μ Dynamic viscosity (Pa s)
ν Kinematic viscosity (m2/s)
ρ Density (kg/m3)
Φ Mass flow function
Φ Modified mass flow function
ω Angular velocity (rad/s)
Subscripts
1Impeller inlet
2Impeller outlet
4Diffuser outlet
6Volute outlet
c Absolute value
cr Properties at the critical point
g Guess value
h Hub
i Impeller
m Meridional
ref Reference value
s Shroud, Compressor stage
t Total condition
u Tangential direction
w Relative value

References

  1. Liang, Y.; Bian, X.; Qian, W.; Pan, M.; Ban, Z.; Yu, Z. Theoretical analysis of a regenerative supercritical carbon dioxide Brayton cycle/organic Rankine cycle dual loop for waste heat recovery of a diesel/natural gas dual-fuel engine. Energy Convers. Manag. 2019, 197, 111845. [Google Scholar] [CrossRef]
  2. Sharan, P.; Neises, T.; McTigue, J.D.; Turchi, C. Cogeneration using multi-effect distillation and a solar-powered supercritical carbon dioxide Brayton cycle. Desalination 2019, 459, 20–33. [Google Scholar] [CrossRef]
  3. Ma, T.; Chu, W.X.; Xu, X.Y.; Chen, Y.T.; Wang, Q.W. An experimental study on heat transfer between supercritical carbon dioxide and water near the pseudo-critical temperature in a double pipe heat ex-changer. Int. J. Heat Mass Transf. 2016, 93, 379–387. [Google Scholar] [CrossRef]
  4. Huang, Y.; Wang, J. Application of supercritical carbon dioxide in nuclear reactor system. Nucl. Power Eng. 2012, 33, 21–27. [Google Scholar]
  5. Di Bella, F.A. Gas turbine engine exhaust waste heat recovery using supercritical CO2 Brayton cycle with thermoelectric generator technology. In Proceedings of the ASME 2015 9th International Conference on Energy Sustainability, San Diego, CA, USA, 28 June–2 July 2015. [Google Scholar]
  6. Ma, Z.; Turchi, C.S. Advanced supercritical carbon dioxide power cycle configurations for use in con-centrating solar power systems. In Proceedings of the Supercritical CO2 Power Cycle Symposium, Boul-der, CO, USA, 24–25 May 2011. [Google Scholar]
  7. Frank, E.D.; Sullivan, J.L.; Wang, M.Q. Life cycle analysis of geothermal power generation with super-critical carbon dioxide. Environ. Res. Lett. 2012, 7, 034030. [Google Scholar] [CrossRef]
  8. Clementoni, E.M.; Cox, T.L. Effect of compressor inlet pressure on cycle performance for a supercritical carbon dioxide Brayton cycle. In Proceedings of the ASME Turbo Expo 2018: Turbomachinery Technical Conference and Exposition, Oslo, Norway, 11–15 June 2018. [Google Scholar]
  9. Lee, J.; Baik, S.; Cho, S.K.; Cha, J.E.; Lee, J.I. Issues in performance measurement of CO2 compressor near the critical point. Appl. Therm. Eng. 2016, 94, 111–121. [Google Scholar] [CrossRef]
  10. Chen, H.; Zhuge, W.; Zhang, Y.; Liu, H. Effect of compressor inlet condition on supercritical carbon dioxide compressor performance. In Proceedings of the ASME Turbo Expo 2019: Turbomachinery Technical Conference and Exposition, Phoenix, AZ, USA, 17–21 June 2019. [Google Scholar]
  11. Ameli, A.; Afzalifar, A.; Turunen-Saaresti, T.; Backman, J. Effects of real gas model accuracy and operat-ing conditions on supercritical CO2 compressor performance and flow field. J. Eng. Gas Turbines Power 2018, 140, 062603. [Google Scholar] [CrossRef]
  12. Baltadjiev, N.D.; Lettieri, C.; Spakovszky, Z.S. An Investigation of Real Gas Effects in Supercritical CO2 Centrifugal Compressors. J. Turbomach. 2015, 137, 091003. [Google Scholar] [CrossRef] [Green Version]
  13. Kim, S.G.; Lee, J.; Ahn, Y.; Lee, J.I.; Addad, Y.; Ko, B. CFD investigation of a centrifugal compressor derived from pump technology for supercritical carbon dioxide as a working fluid. J. Supercrit. Fluids 2014, 86, 160–171. [Google Scholar] [CrossRef]
  14. Saxena, S.; Mallina, R.; Moraga, F.; Hofer, D. Numerical approach for real gas simulations: Part II—Flow simulation for supercritical CO2 centrifugal compressor. In Proceedings of the ASME Turbo Expo 2017: Turbomachinery Technical Conference and Exposition, Charlotte, NC, USA, 26–30 June 2017. [Google Scholar]
  15. Brinckman, K.W.; Hosangadi, A.; Liu, Z.; Weathers, T. Numerical simulation of non-equilibrium con-densation in supercritical CO2 compressors. In Proceedings of the ASME Turbo Expo 2019: Tur-bomachinery Technical Conference and Exposition, Phoenix, AZ, USA, 17–21 June 2019. [Google Scholar]
  16. Lettieri, C.; Yang, D.; Spakovszky, Z. An Investigation of Condensation Effects in Supercritical Carbon Dioxide Compressors. J. Eng. Gas Turbines Power 2015, 137, 082602. [Google Scholar] [CrossRef] [Green Version]
  17. Pecnik, R.; Rinaldi, E.; Colonna, P. Computational Fluid Dynamics of a Radial Compressor Operating With Supercritical CO2. J. Eng. Gas Turbines Power 2012, 134, 122301. [Google Scholar] [CrossRef]
  18. Brenes, B.M. Design of Supercritical Carbon Dioxide Centrifugal Compressors. Ph.D. Thesis, University of Seville, Seville, Spain, 2014. [Google Scholar]
  19. Shao, W.; Wang, X.; Yang, J.; Liu, H.; Huang, Z. Design parameters exploration for supercritical CO2 centrifugal compressors under multiple constraints. In Proceedings of the ASME Turbo Expo 2019: Turbomachinery Technical Conference and Exposition, Seoul, Korea, 13–17 June 2016. [Google Scholar]
  20. Liu, Z.; Luo, W.; Zhao, Q.; Zhao, W.; Xu, J.Z. Preliminary Design and Model Assessment of a Supercritical CO2 Compressor. Appl. Sci. 2018, 8, 595. [Google Scholar] [CrossRef] [Green Version]
  21. Lettieri, C.; Baltadjiev, N.; Casey, M.; Spakovszky, Z.S. Low-Flow-Coefficient Centrifugal Compressor Design for Supercritical CO2. J. Turbomach. 2014, 136, 081008. [Google Scholar] [CrossRef]
  22. Lee, B.I.; Kesler, M.G. A generalized thermodynamic correlation based on three-parameter corresponding states. AIChE J. 1975, 21, 510–527. [Google Scholar] [CrossRef]
  23. Span, R.; Wagner, W. A new equation of state for carbon dioxide covering the fluid region from the triple-point temperature to 1100 K at pressures up to 800 MPa. J. Phys. Chem. Ref. Data 1996, 25, 1509–1596. [Google Scholar] [CrossRef] [Green Version]
  24. NIST Reference Fluid Thermodynamic and Transport Properties Database (REFPROP): Version 10. Available online: https://www.nist.gov/srd/refprop (accessed on 17 August 2020).
  25. Baltadjiev, N.D. An Investigation of Real Gas Effects in Supercritical CO2 Compressors. Master’s Thesis, Massachusetts Institute of Technology, Cambridge, MA, USA, 2012. [Google Scholar]
  26. Wright, S.A.; Radel, R.F.; Vernon, M.E.; Rochau, G.E.; Pickard, P.S. Operation and Analysis of a Supercritical CO2 Brayton Cycle; Sandia Report SAND2010-0171; Sandia National Laboratories: Albuquerque, NM, USA, 2010; pp. 1–101.
  27. Ameli, A.; Turunen-Saaresti, T.; Backman, J. Numerical investigation of the flow behavior inside a su-percritical CO2 centrifugal compressor. J. Eng. Gas Turbines Power 2018, 140, 122604. [Google Scholar] [CrossRef]
  28. Numeca Inc. Numeca Theoretical Manual, FINE/Turbo v8.9 Flow Integrated Environment; Numeca Inc.: Brabant, Belgium, 2011. [Google Scholar]
  29. Hakimi, N. Preconditioning Methods for Time Dependent Navier-Stokes Equations. Ph.D. Thesis, Free University of Brussels, Brussels, Belgium, 1997. [Google Scholar]
  30. Jiang, X.; Tian, Y.; Shao, W.; Xiao, Y. Numerical simulation of supercritical CO2 compressors characteris-tics. J. Aerosp. Power 2018, 33, 1685–1694. (In Chinese) [Google Scholar]
  31. Pham, H.; Alpy, N.; Ferrasse, J.-H.; Boutin, O.; Tothill, M.; Quenaut, J.; Gastaldi, O.; Cadiou, T.; Saez, M. An approach for establishing the performance maps of the sc-CO2 compressor: Development and qualification by means of CFD simulations. Int. J. Heat Fluid Flow 2016, 61, 379–394. [Google Scholar] [CrossRef]
  32. Li, X.; Zhao, Y.; Liu, Z.; Chen, H. A new methodology for preliminary design of centrifugal impellers with prewhirl. Proc. Inst. Mech. Eng. Part A J. Power Energy 2020, 234, 251–262. [Google Scholar] [CrossRef]
  33. Nederstigt, P. Real Gas Thermodynamics: And the Isentropic Behavior of Substances. Master’s Thesis, Delft University of Technology, Delft, The Netherlands, 2017. [Google Scholar]
  34. Gorbunov, V.N.; Ryzhov, Y.A.; Pirumov, U.G.; Ryzhov, I.A.; Ryzhov, I.A. Nonequilibrium Condensation in High-Speed Gas Flows; Grodon and Breach Science Publishers: New York, NY, USA, 1989. [Google Scholar]
Figure 1. Thermodynamic properties of CO2 versus temperature under different pressure: (a) Density; (b) Ratio of specific heats.
Energies 13 05049 g001
Figure 2. Solid model of the Sandia SCO2 compressor.
Energies 13 05049 g002
Figure 3. Independency study of the meshes and real gas property (RGP) resolution: (a) Mesh independency; (b) RGP resolution.
Energies 13 05049 g003
Figure 4. Computational meshes of the impeller and vaned diffuser: (a) Impeller; (b) Vaned diffuser.
Energies 13 05049 g004
Figure 5. The impeller inlet velocity triangle near the shroud.
Energies 13 05049 g005
Figure 6. Modified mass flow function Φ versus inlet flow angle β 1 s for centrifugal impellers with different prewhirl angles based on Equations (18) and (19), where n ¯ s 1 = 1.529 .
Energies 13 05049 g006
Figure 7. Expansion process of SCO2 near impeller inlet.
Energies 13 05049 g007
Figure 8. MAM and AAM as the functions of total pressure and temperature at impeller inlet: (a) MAM; and (b)AAM.
Energies 13 05049 g008
Figure 9. The solid model of the optimal compressor stage: (a) Impeller; and (b) Volute.
Energies 13 05049 g009
Figure 10. The computational domain and mesh of the optimal compressor stage.
Energies 13 05049 g010
Figure 11. The characteristic curves of the isentropic efficiency η s and total pressure ratio ε s for the optimal compressor stage.
Energies 13 05049 g011
Figure 12. The static pressure contours below the critical pressure of the three operating conditions (3 kg/s, 5 kg/s, and 7 kg/s) at 10%, 50%, and 80% spans: (a) m ˙ = 3 kg / s ; (b) m ˙ = 5 kg / s ; and (c) m ˙ = 7 kg / s .
Energies 13 05049 g012
Figure 13. The condensation regions marked in red color at three operating conditions (3 kg/s, 5 kg/s, and 7 kg/s): (a) Computational domain; (b) m ˙ = 3 kg / s : Region A; (c) m ˙ = 5 kg / s : Region B; (d) m ˙ = 7 kg / s : Region A; and (e) m ˙ = 7 kg / s : Region B.
Energies 13 05049 g013
Figure 14. The simulation results of all computational points (control volumes) and partial enlarged details in the impeller at three operating conditions: (a) m ˙ = 3 kg / s ; (b) m ˙ = 5 kg / s ; and (c) m ˙ = 7 kg / s .
Energies 13 05049 g014
Figure 15. The simulation results of all computational points (control volumes) in the volute at three operating conditions: (a) m ˙ = 3 kg / s ; (b) m ˙ = 5 kg / s ; and (c) m ˙ = 7 kg / s .
Energies 13 05049 g015
Table 1. Design parameters of the Sandia Supercritical Carbon Dioxide (SCO2) compressor.
ParametersValues
Shaft speed59,584 rpm
Design mass flow rate2.609 kg/s
Number of full/splitter blades6/6
Impeller tip diameter 37.4 mm
Impeller outlet width1.8 mm
Impeller outlet blade angle−50 deg
Tip clearance0.25 mm
Diffuser outlet diameter52 mm
Number of vanes17
Inlet total pressure8.22 MPa
Inlet total temperature308.33 K
Table 2. Four types of RGP tables with the corresponding maximum Courant–Friedrichs–Lewy (CFL) numbers to achieve a convergent solution under design condition.
RGPp (MPa)T (K)SamplesMax CFLRunning Time (hour)
Baseline1–80216.6–10001010.19
RGP-11–40220–6001010.0514
RGP-21–40220–6003010.0516
RGP-31–40220–6009010.0158
Table 3. Comparison of the predicted and measured total pressure ratio of the Sandia SCO2 compressor at diffuser outlet.
Shaft Speed (rpm)Inlet Total Temperature (K)Inlet Total Pressure (MPa)Mass Flow Rate (kg/s)Experimental Total Pressure RatioCalculated Total Pressure RatioError (%)
10,000305.576.760.4541.0391.0460.675
20,000305.576.760.7711.0511.0600.886
28,000305.576.761.1341.1121.1060.517
29,888306.7879.21.3151.0821.0931.035
39,000305.677.111.4511.2041.2281.999
49,000306.378.541.8161.3551.3942.885
55,000306.478.92.0431.4391.4692.085
56,000306.678.262.0881.4691.4670.133
59,584308.3382.242.6091.3651.4224.176
60,000306.979.972.2251.5181.5965.108
64,384308.7182.862.861.4411.5165.222
64,900307.982.112.4061.5741.6665.824
Table 4. Design specification of the SCO2 compressor stage.
ParametersValues
Shaft speed40,000 rpm
Design mass flow rate5 kg/s
Stage isentropic efficiency>78%
Stage total pressure ratio>1.8
Inlet total temperature310 K
Inlet total pressure8 MPa
Inlet prewhirl angle0 deg
Table 5. Preliminary design parameters of the three design schemes: Optimal Design, Reference Design I, and Reference Design II.
ParametersOptimal DesignReference Design IReference Design II
Inlet relative Mach number0.36950.39810.3695
Inlet flow angle at shroud (deg)55.803470.000070.0000
Mass flow function0.01180.01180.0095
Inlet absolute Mach number0.20770.13620.1264
Inlet flow angle at hub (deg)41.295759.128859.1088
Impeller inlet shroud diameter (mm)27.934.432.0
Impeller inlet hub diameter (mm)16.621.019.5
Impeller trim11.662317.808415.3741
Impeller inlet area (mm2)392.84586.43506.74
Average isentropic exponent1.52901.53861.5396
Machine Mach number0.8799
Impeller tip diameter (mm)81.6
Work coefficient0.7824
Inlet prewhirl angle (deg)0
Table 6. Geometrical parameters of the optimal SCO2 compressor stage.
ParametersValues
Number of full/splitter blades9/9
Impeller tip diameter 81.6 mm
Impeller inlet hub diameter16.6 mm
Impeller inlet shroud diameter27.9 mm
Impeller outlet blade angle−30 deg
Impeller outlet width1.2 mm
Impeller tip clearance0.2 mm
Diffuser outlet diameter88 mm
Volute cross-sectional outlet diameter21.5 mm
Table 7. The relative errors of the preliminary design results against the numerical simulation solutions for the optimal compressor stage.
ParametersS1S2S6
Total temperature0.01%0.27%0.34%
Static temperature0.08%0.17%0.47%
Total pressure0.05%0.04%0.46%
Static pressure0.13%0.07%0.91%
Density1.75%1.61%0.87%
Absolute velocity0.86%0.30%2.70%
Overall Performance
Stage isentropic efficiency0.03%Stage total pressure ratio0.44%

