Thermophysical Properties of 1-Butanol at High Pressures †


Abstract
1. Introduction
2. Experimental Section
2.1. Chemical
2.2. Speed of Sound Measurements
2.3. Density Measurements
3. Results and Discussion
4. Summary
Author Contributions
Funding
Conflicts of Interest
References
- Salleh, M.S.M.; Ibrahim, M.F.; Roslan, A.M.; Abd-Aziz, S. Improved biobutanol production in 2-L simultaneous saccharification and fermentation with delayed yeast extract feeding and in-situ recovery. Sci. Rep. 2019, 9, 7443. [Google Scholar] [CrossRef] [PubMed]
- Tucki, K.; Orynycz, O.; Wasiak, A.; Świć, A.; Mruk, R.; Botwińska, K. Estimation of carbon dioxide emissions from a diesel engine powered by lignocellulose derived fuel for better management of fuel production. Energies 2020, 13, 561. [Google Scholar] [CrossRef]
- Meng, L.; Zeng, C.; Li, Y.; Nithyanandan, K.; Lee, T.H.; Lee, C. An experimental study on the potential usage of acetone as an oxygenate additive in PFI SI engines. Energies 2016, 9, 256. [Google Scholar] [CrossRef]
- Rodríguez-Fernández, J.; Hernández, J.J.; Calle-Asensio, A.; Ramos, Á.; Barba, J. Selection of blends of diesel fuel and advanced biofuels based on their physical and thermochemical properties. Energies 2019, 12, 2034. [Google Scholar] [CrossRef]
- Kamiński, W.; Tomczak, E.; Górak, A. Biobutanol—Production and purification methods. Atmosphere 2011, 2, 3. [Google Scholar]
- Gan, L.; Chidambaram, A.; Fonquernie, P.G.; Light, M.E.; Choquesillo-Lazarte, D.; Huang, H.; Solano, E.; Fraile, J.; Viñas, C.; Teixidor, F.; et al. A highly water-stable meta-carborane-based copper metal—Organic framework for efficient high-temperature butanol separation. J. Am. Chem. Soc. 2020, 142, 8299–8311. [Google Scholar] [CrossRef] [PubMed]
- Azambuja, S.P.H.; Goldbeck, R. Butanol production by Saccharomyces cerevisiae: Perspectives, strategies and challenges. World J. Microbiol. Biotechnol. 2020, 36, 48. [Google Scholar] [CrossRef] [PubMed]
- Li, S.; Huang, L.; Ke, C.; Pang, Z.; Liu, L. Pathway dissection, regulation, engineering and application: Lessons learned from biobutanol production by solventogenic clostridia. Biotechnol. Biofuels 2020, 13, 39. [Google Scholar] [CrossRef] [PubMed]
- Qureshi, N.; Lin, X.; Liu, S.; Saha, B.C.; Mariano, A.P.; Polaina, J.; Ezeji, T.C.; Friedl, A.; Maddox, I.S.; Klasson, K.T.; et al. Global view of biofuel butanol and economics of its production by fermentation from sweet sorghum bagasse, food waste, and yellow top presscake: Application of novel technologies. Fermentation 2020, 6, 58. [Google Scholar] [CrossRef]
- El-Dalatony, M.M.; Salama, E.-S.; Kurade, M.B.; Hassan, S.H.A.; Oh, S.-E.; Kim, S.; Jeon, B.-H. Utilization of microalgal biofractions for bioethanol, higher alcohols, and biodiesel production: A review. Energies 2017, 10, 2110. [Google Scholar] [CrossRef]
- Mahmud, N.; Rosentrater, K.A. Life-cycle assessment (LCA) of different pretreatment and product separation technologies for butanol bioprocessing from oil palm frond. Energies 2020, 13, 155. [Google Scholar] [CrossRef]
- Dzida, M.; Prusakiewicz, P. The effect of temperature and pressure on the physicochemical properties of petroleum diesel oil and biodiesel fuel. Fuel 2008, 87, 1941–1948. [Google Scholar] [CrossRef]
- Oakley, B.A.; Barber, G.; Worden, T.; Hanna, D. Ultrasonic parameters as a function of absolute hydrostatic pressure. I. A review of the data for organic liquids. J. Phys. Chem. Ref. Data 2003, 32, 1501–1533. [Google Scholar] [CrossRef][Green Version]
- Khasanshin, T.S. Sonic velocity in liquid primary normal alcohols. Teplofiz. Vys. Temp. 1991, 29, 710–716. [Google Scholar]
- Plantier, F.; Daridon, J.L.; Lagourette, B. Nonlinear parameter (B/A) measurements in methanol, 1-butanol and 1-octanol for different pressures and temperatures. J. Phys. D Appl. Phys. 2002, 35, 1063–1067. [Google Scholar] [CrossRef]
- Safarov, J.; Ahmadov, B.; Mirzayev, S.; Shahverdiyev, A.; Hassel, E.P. Thermophysical properties of 1-butanol over a wide range of temperatures and pressures up to 200 Mpa. J. Mol. Liq. 2015, 209, 465–479. [Google Scholar] [CrossRef]
- Dávila, M.J.; Alcalde, R.; Atilhan, M.; Aparicio, S. PρT measurements and derived properties of liquid 1-alkanols. J. Chem. Thermodyn. 2012, 47, 241–259. [Google Scholar] [CrossRef]
- Khasanshin, T.S. “Structure-property” quantitative correlations for the density of primary normal alcohols. Teplofiz. Vys. Temp. 1997, 35, 886–895. [Google Scholar]
- Cibulka, I.; Ziková, M. Liquid densities at elevated pressures of 1-alkanols from C1 to C10: A critical evaluation of experimental data. J. Chem. Eng. Data 1994, 39, 876–886. [Google Scholar] [CrossRef]
- Dzida, M. Speeds of sound, densities, isobaric thermal expansion, compressibilities and internal pressures of heptan-1-ol, octan-1-ol, nonan-1-ol and decan-1-ol at temperatures from (293 to 318) K and pressures up to 100 MPa. J. Chem. Eng. Data 2007, 52, 521–531. [Google Scholar] [CrossRef]
- Dzida, M. Study of the effects of temperature and pressure on the thermodynamic and acoustic properties of pentan-1-ol, 2-methyl-2-butanol, and cyclopentanol in the pressure range from (0.1 to 100) MPa and temperature from (293 to 318) K. J. Chem. Eng. Data 2009, 54, 1034–1040. [Google Scholar] [CrossRef]
- Zábranský, M.; Růžička, V.; Majer, V. Heat Capacities of Organic Compounds in Liquid State. I. C1 to C18 1-Alkanols. J. Phys. Chem. Ref. Data 1990, 19, 719–762. [Google Scholar] [CrossRef]
- Davis, L.A.; Gordon, R.B. Compression of mercury at high pressure. J. Chem. Phys. 1967, 46, 2650–2660. [Google Scholar] [CrossRef]
- Sun, T.F.; Seldam, C.A.T.; Kortbeek, P.J.; Trappeniers, N.J.; Biswas, S.N. Acoustic and Thermodynamic Properties of ethanol from 273.15 to 333.1 5 K and up to 280 MPa. Phys. Chem. Liq. 1988, 18, 107–116. [Google Scholar] [CrossRef]
- Zorębski, E.; Deć, E. Speeds of sound and isentropic compressibilities for binary mixtures of 1,2-ethanediol with 1-butanol, 1-hexanol, or 1-octanol in the temperature range from 293.15 to 313.15 K. J. Mol. Liq. 2012, 168, 61–68. [Google Scholar] [CrossRef]
- Outcalt, S.L.; Laesecke, A.; Fortin, T.J. Density and speed of sound measurements of 1- and 2-butanol. J. Mol. Liq. 2010, 151, 50–59. [Google Scholar] [CrossRef]
- Cristino, A.F.; Nobre, L.C.S.; Bioucas, F.E.B.; Santos, Â.F.S.; de Castro, C.A.N.; Lampreia, I.M.S. Volumetric and sound speed study of aqueous 1-butanol liquid mixtures at different temperatures. J. Chem. Thermodyn. 2019, 134, 127–135. [Google Scholar] [CrossRef]
- Gascón, I.; Martin, S.; Cea, P.; López, M.C.; Royo, F.M. Density and speed of sound for binary mixtures of a cyclic ether with a butanol isomer. J. Sol. Chem. 2002, 31, 905–916. [Google Scholar] [CrossRef]
- Troncoso, J.; Tovar, C.A.; Cerdeiriña, C.A.; Carballo, E.; Romaní, L. Temperature dependence of densities and speeds of sound of nitromethane + butanol isomers in the range (288.15−308.15) K. J. Chem. Eng. Data 2001, 46, 312–316. [Google Scholar] [CrossRef]
- Zorębski, E.; Geppert-Rybczyńska, M. Thermodynamic and transport properties of (1-Butanol +1,4-Butanediol) at temperatures from (298.15 to 318.15) K. J. Chem. Thermodyn. 2010, 42, 409–418. [Google Scholar] [CrossRef]
- Kiyohara, O.; Benson, G.C. Ultrasonic speeds and isentropic compressibilities of n-alkanol + n-heptane mixtures at 298.15 K. J. Chem. Thermodyn. 1979, 11, 861–873. [Google Scholar] [CrossRef]
- Troncoso, J.; Carballo, E.; Cerdeiriña, C.A.; González, D.; Romaní, L. Systematic determination of densities and speeds of sound of nitroethane + isomers of butanol in the range (283.15–308.15) K. J. Chem. Eng. Data 2000, 45, 594–599. [Google Scholar] [CrossRef]
- Żak, A.; Dzida, M.; Zorębski, M.; Ernst, S. A high pressure system for measurements of the speed of sound in liquids. Rev. Sci. Instrum. 2000, 71, 1756–1765. [Google Scholar] [CrossRef]
- Zúñiga-Moreno, A.Z.; Galicia-Luna, L.A.; Camacho-Camacho, L.E. Compressed liquid densities of 1-butanol and 2-butanol at temperatures from 313 K to 363 K and pressures up to 25 MPa. J. Chem. Thermodyn. 2007, 39, 254–260. [Google Scholar] [CrossRef]
- Musiał, M.; Zorębski, M.; Dzida, M.; Safarov, J.; Zorębski, E.; Hassel, E. High pressure speed of sound and related properties of 1-ethyl-3-methylimidazolium methanesulfonate. J. Mol. Liq. 2019, 276, 885–896. [Google Scholar] [CrossRef]
- Dzida, M.; Żak, A.; Ernst, S. Thermodynamic and acoustic properties of binary mixtures of alcohols and alkanes. I. Speed of sound in (ethanol + n-heptane) under elevated pressures. J. Chem. Thermodyn. 2005, 37, 405–414. [Google Scholar] [CrossRef]
- Dzida, M.; Marczak, W. Thermodynamic and acoustic properties of binary mixtures of alcohols and alkanes. II. Density and heat capacity of (ethanol + n-heptane) under elevated pressures. J. Chem. Thermodyn. 2005, 37, 826–836. [Google Scholar] [CrossRef]
- Dzida, M.; Cempa, M. Thermodynamic and acoustic properties of (heptane + dodecane) mixtures under elevated pressures. J. Chem. Thermodyn. 2008, 40, 1531–1541. [Google Scholar] [CrossRef]
- Knothe, G.; Sharp, C.A.; Ryan, T.W. Exhaust emissions of biodiesel, petrodiesel, neat methyl esters, and alkanes in a new technology engine. Energy Fuels 2006, 20, 403–408. [Google Scholar] [CrossRef]
- Luo, Z.; Som, S.; Sarathy, S.M.; Plomer, M.; Pitz, W.J.; Longman, D.E.; Lu, T. Development and validation of an n-dodecane skeletal mechanism for spray combustion applications. Comb. Theory Model. 2014, 18, 187–203. [Google Scholar] [CrossRef]
- Lemmon, E.W.; Huber, M.L. Thermodynamic properties of n-dodecane. Energy Fuels 2004, 18, 960–967. [Google Scholar] [CrossRef]
- Hildebrand, J.H. Theory of solubility. Phys. Rev. 1923, 21, 46–52. [Google Scholar] [CrossRef]
- Hildebrand, J.H.; Prausnitz, J.M.; Scott, R.L. Regular and Related Solutions; Van Nostrand-Reinhold: Princeton, NJ, USA, 1970. [Google Scholar]
- Barton, A.F.M. Solubility parameters. Chem. Rev. 1975, 75, 731–753. [Google Scholar] [CrossRef]
- Dack, M.R.J. The importance of solvent internal pressure and cohesion to solution phenomena. Chem. Soc. Rev. 1975, 4, 211–229. [Google Scholar] [CrossRef]
- Dack, M.R.J. Solvent structure. The use of internal pressure and cohesive energy density to examine contributions to solvent-solvent interactions. Aust. J. Chem. 1975, 28, 1643–1648. [Google Scholar] [CrossRef]
- Verdier, S.; Andersen, S.I. Internal pressure and solubility parameter as a function of pressure. Fluid Phase Equlib. 2005, 231, 125–137. [Google Scholar] [CrossRef]
- Bagley, E.B.; Nelson, T.P.; Scigliano, J.M. Three-dimensional solubility parameters and their relation to internal pressure measurements in polar and hydrogen bonding solvents. J. Paint Technol. 1971, 43, 35–42. [Google Scholar]
- Allen, G.; Gee, G.; Wilson, G.J. Intermolecular forces and chain flexibilities in polymers: I. Internal pressures and cohesive energy densities of simple liquids. Polymer 1960, 1, 456–466. [Google Scholar] [CrossRef]
- Kartsev, V.N.; Rodnikova, M.N.; Bartel, I.; Shtykov, S.N. The temperature dependence of internal pressure in liquids. Rus. J. Phys. Chem. 2002, 76, 903–905. [Google Scholar]
- Kartsev, V.N.; Rodnikova, M.N.; Shtykov, S.N. Inversion of the temperature coefficient of internal pressure and structural organization of liquid phase systems. J. Struct. Chem. 2004, 45, 91–95. [Google Scholar] [CrossRef]
- Kartsev, V.N.; Rodnikova, M.N.; Shtykov, S.N. On internal pressure, its temperature dependence, and the structure of liquid-phase systems. J. Struct. Chem. 2004, 45, 96–99. [Google Scholar] [CrossRef]
- Kartsev, V.N. To the understanding of the structural sensitivity of the temperature coefficient of internal pressure. J. Struct. Chem. 2004, 45, 832–837. [Google Scholar] [CrossRef]
- Zorębski, E. Internal pressure as function of pressure for alkanols. Mol. Quant. Acoust. 2007, 28, 319–326. [Google Scholar]
- Dzida, M. Study of the effects of temperature and pressure on the thermodynamic and acoustic properties of 2-methyl-1-butanol at temperatures from (293 to 318) K and pressures up to 100 Mpa. Int. J. Thermophys. 2010, 31, 55–69. [Google Scholar] [CrossRef]
- Zorębski, E.; Musiał, M.; Dzida, M. Relation between temperature-pressure dependence of internal pressure and intermolecular interactions in ionic liquids—Comparison with molecular liquids. J. Chem. Thermodyn. 2019, 131, 347–359. [Google Scholar] [CrossRef]


| T (K) | This Work | Literature | |
|---|---|---|---|
| u (m·s−1) * | 293.15 | 1256.33 | 1256.25 [25], 1256.8 [26], 1257.5 [27] |
| 298.15 | 1239.29 | 1239.2 [28], 1239.22 [25], 1239.29 [29] 1239.3 [27], 1239.39 [30,31], 1239.8 [26] | |
| 303.15 | 1222.36 | 1222.25 [25],1222.36 [14], 1222.4 [27] 1222.9 [26], 1223.6 [15] | |
| 308.15 | 1205.54 | 1205.53 [25], 1205.79 [32], 1206.2 [26] | |
| 313.15 | 1188.81 | 1188.65 [25], 1189.6 [26], 1190.1 [15] | |
| 318.15 | 1172.19 | 1173.0 [26] | |
| ρ (kg·m−3) ** | 293.15 | 809.58 | 809.5 [26], 809.60 [27], 809.64 [16] |
| 298.15 | 805.79 | 805.7 [26], 805.770 [30], 805.77 [16] 805.78 [27] | |
| 303.15 | 801.95 | 801.9 [26], 801.928 [30], 801.94 [27] | |
| 308.15 | 798.10 | 798.0 [26], 798.054 [30] | |
| 313.15 | 794.22 | 794.1 [26], 794.146 [30], 794.35 [16] | |
| 318.15 | 790.24 | 790.1 [26], 790.196 [30] |
| T (K) | p (MPa) | u (m·s−1) | T (K) | p (MPa) | u (m·s−1) | T (K) | p (MPa) | u (m·s−1) |
|---|---|---|---|---|---|---|---|---|
| 292.65 | 0.1 | 1258.06 | 303.16 | 0.1 | 1222.26 | 313.16 | 0.1 | 1188.85 |
| 292.86 | 15.2 | 1336.38 | 302.98 | 15.21 | 1304.62 | 313.10 | 15.21 | 1274.40 |
| 292.85 | 30.39 | 1406.63 | 302.97 | 30.39 | 1376.93 | 313.13 | 30.39 | 1348.79 |
| 292.85 | 45.59 | 1470.61 | 303.00 | 45.59 | 1442.45 | 313.12 | 45.59 | 1416.05 |
| 292.85 | 60.80 | 1529.80 | 302.98 | 60.80 | 1502.93 | 313.11 | 60.79 | 1477.91 |
| 292.87 | 76.00 | 1583.46 | 303.05 | 76.00 | 1557.55 | 313.11 | 76.01 | 1533.90 |
| 292.87 | 91.19 | 1633.68 | 303.01 | 91.19 | 1608.67 | 313.03 | 91.19 | 1585.65 |
| 292.83 | 101.32 | 1665.21 | 302.98 | 101.33 | 1640.91 | 312.99 | 101.33 | 1618.69 |
| 298.16 | 0.1 | 1239.24 | 308.16 | 0.1 | 1205.55 | 318.60 | 0.1 | 1170.66 |
| 298.00 | 15.20 | 1319.99 | 308.00 | 15.2 | 1289.43 | 318.52 | 15.18 | 1257.86 |
| 298.00 | 30.40 | 1391.35 | 308.01 | 30.39 | 1362.92 | 318.52 | 30.39 | 1333.80 |
| 297.99 | 45.59 | 1456.21 | 308.00 | 45.59 | 1429.35 | 318.47 | 45.60 | 1402.24 |
| 297.99 | 60.79 | 1516.04 | 308.03 | 60.79 | 1490.34 | 318.46 | 60.80 | 1464.54 |
| 298.00 | 75.99 | 1570.22 | 307.99 | 76.00 | 1545.86 | 318.45 | 76.01 | 1521.23 |
| 298.00 | 91.19 | 1620.86 | 307.99 | 91.19 | 1596.96 | 318.45 | 91.19 | 1573.46 |
| 297.99 | 101.34 | 1652.77 | 308.02 | 101.33 | 1629.34 | 318.46 | 101.34 | 1606.71 |
| c0 (m·s−1) | c1 (m·s−1·K−1) | c2·103 (m· s−1·K−2) | δu0a (m·s−1) |
| 2436.59 | −4.63487 | 2.07654 | 0.07 |
| ρ0 (kg·m−3) | ρ1 (kg·m−3·K−1) | ρ2·104 (kg·m−3·K−2) | δρa (kg·m−3) |
| 964.750 | −0.304950 | −7.65424 | 0.01 |
| a1j | a2j | a3j | δua | |
|---|---|---|---|---|
| (K−j·MPa·s·m−1) | (K−j·MPa·s2·m−2) | (K−j·MPa·s3·m−3) | (m·s−1) | |
| j | ||||
| 0 | 0.282824 | 1.38485·10−4 | 1.37252·10−7 | 0.29 |
| 1 | - | - | - | |
| 2 | −1.20119·10−6 | - | 7.92802·10−13 |
| p (MPa) | ρ (kg·m−3) | |||||
|---|---|---|---|---|---|---|
| T (K) | ||||||
| 293.15 | 298.15 | 303.15 | 308.15 | 313.15 | 318.15 | |
| 0.1 * | 809.58 | 805.79 | 801.96 | 798.10 | 794.20 | 790.26 |
| 10 | 816.60 | 812.99 | 809.36 | 805.69 | 801.98 | 798.24 |
| 20 | 823.12 | 819.67 | 816.19 | 812.68 | 809.14 | 805.57 |
| 30 | 829.18 | 825.86 | 822.52 | 819.15 | 815.75 | 812.32 |
| 40 | 834.86 | 831.66 | 828.43 | 825.18 | 821.90 | 818.59 |
| 50 | 840.20 | 837.11 | 833.99 | 830.84 | 827.67 | 824.47 |
| 60 | 845.27 | 842.27 | 839.24 | 836.19 | 833.11 | 830.00 |
| 70 | 850.08 | 847.17 | 844.23 | 841.26 | 838.27 | 835.25 |
| 80 | 854.67 | 851.84 | 848.98 | 846.09 | 843.17 | 840.23 |
| 90 | 859.06 | 856.30 | 853.51 | 850.70 | 847.86 | 844.99 |
| 100 | 863.27 | 860.58 | 857.86 | 855.12 | 852.34 | 849.54 |
| p (MPa) | Cp (J·mol−1·K−1) | |||||
|---|---|---|---|---|---|---|
| T (K) | ||||||
| 293.15 | 298.15 | 303.15 | 308.15 | 313.15 | 318.15 | |
| 0.1 * | 173.70 | 177.17 | 180.82 | 184.62 | 188.57 | 192.62 |
| 10 | 172.8 | 176.2 | 179.9 | 183.6 | 187.5 | 191.5 |
| 20 | 172.0 | 175.4 | 179.0 | 182.7 | 186.6 | 190.6 |
| 30 | 171.3 | 174.7 | 178.2 | 181.9 | 185.8 | 189.7 |
| 40 | 170.6 | 174.0 | 177.5 | 181.2 | 185.0 | 188.9 |
| 50 | 170.0 | 173.4 | 176.9 | 180.5 | 184.3 | 188.2 |
| 60 | 169.4 | 172.7 | 176.2 | 179.8 | 183.6 | 187.5 |
| 70 | 168.8 | 172.2 | 175.6 | 179.2 | 183.0 | 186.8 |
| 80 | 168.3 | 171.6 | 175.0 | 178.6 | 182.3 | 186.2 |
| 90 | 167.8 | 171.1 | 174.5 | 178.0 | 181.7 | 185.6 |
| 100 | 167.2 | 170.5 | 173.9 | 177.5 | 181.2 | 185.0 |
| p (MPa) | κS·109 (Pa−1) | |||||
|---|---|---|---|---|---|---|
| T (K) | ||||||
| 293.15 | 298.15 | 303.15 | 308.15 | 313.15 | 318.15 | |
| 0.1 | 0.7826 | 0.8080 | 0.8345 | 0.8621 | 0.8909 | 0.9209 |
| 10 | 0.7150 | 0.7361 | 0.7579 | 0.7805 | 0.8038 | 0.8279 |
| 20 | 0.6586 | 0.6765 | 0.6949 | 0.7138 | 0.7332 | 0.7532 |
| 30 | 0.6117 | 0.6272 | 0.6430 | 0.6592 | 0.6757 | 0.6926 |
| 40 | 0.5720 | 0.5855 | 0.5994 | 0.6134 | 0.6278 | 0.6423 |
| 50 | 0.5379 | 0.5499 | 0.5622 | 0.5746 | 0.5872 | 0.5999 |
| 60 | 0.5083 | 0.5191 | 0.5300 | 0.5411 | 0.5523 | 0.5636 |
| 70 | 0.4823 | 0.4920 | 0.5019 | 0.5119 | 0.5219 | 0.5321 |
| 80 | 0.4592 | 0.4681 | 0.4771 | 0.4861 | 0.4952 | 0.5044 |
| 90 | 0.4387 | 0.4468 | 0.4550 | 0.4633 | 0.4716 | 0.4799 |
| 100 | 0.4202 | 0.4277 | 0.4353 | 0.4428 | 0.4504 | 0.4580 |
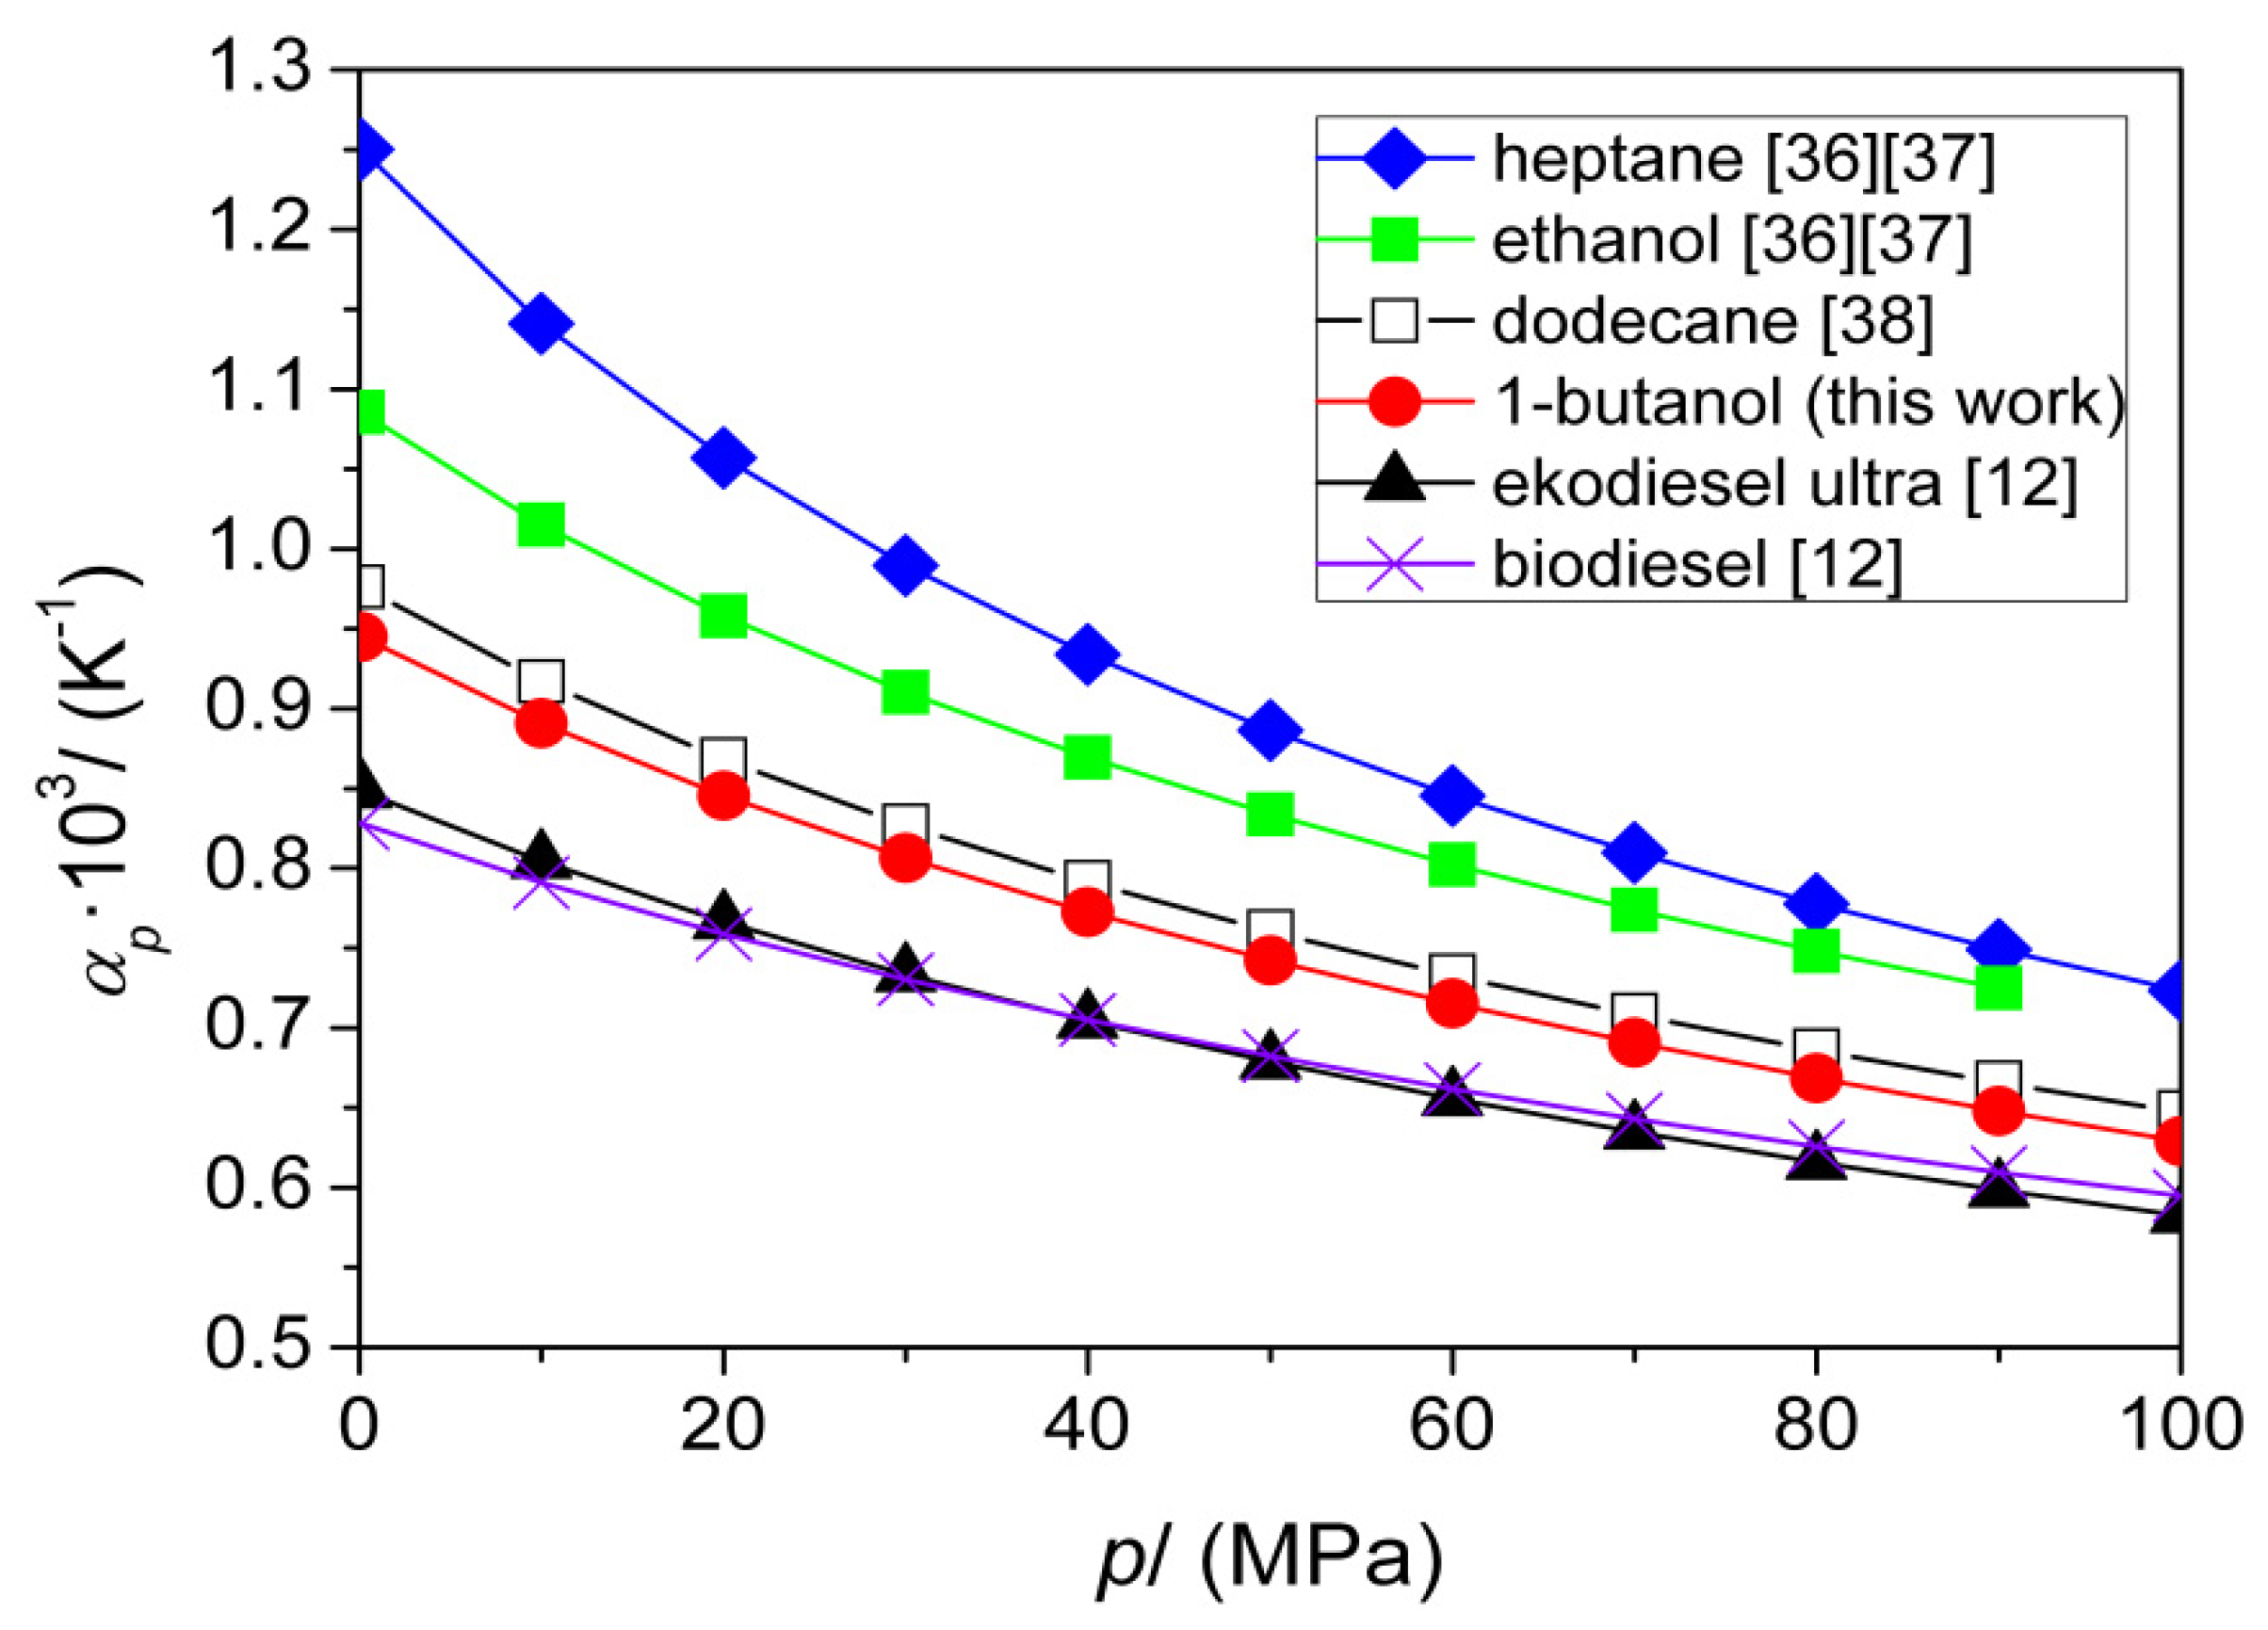
| p (MPa) | αp·103 (K−1) | |||||
|---|---|---|---|---|---|---|
| T (K) | ||||||
| 293.15 | 298.15 | 303.15 | 308.15 | 313.15 | 318.15 | |
| 0.1 | 0.931 | 0.945 | 0.959 | 0.973 | 0.988 | 1.002 |
| 10 | 0.879 | 0.891 | 0.903 | 0.915 | 0.928 | 0.941 |
| 20 | 0.834 | 0.845 | 0.856 | 0.868 | 0.879 | 0.890 |
| 30 | 0.796 | 0.806 | 0.817 | 0.827 | 0.837 | 0.848 |
| 40 | 0.763 | 0.772 | 0.782 | 0.792 | 0.802 | 0.812 |
| 50 | 0.733 | 0.742 | 0.752 | 0.761 | 0.770 | 0.780 |
| 60 | 0.707 | 0.715 | 0.724 | 0.733 | 0.742 | 0.751 |
| 70 | 0.682 | 0.691 | 0.699 | 0.708 | 0.717 | 0.726 |
| 80 | 0.660 | 0.668 | 0.677 | 0.686 | 0.694 | 0.703 |
| 90 | 0.640 | 0.648 | 0.656 | 0.665 | 0.673 | 0.682 |
| 100 | 0.621 | 0.629 | 0.637 | 0.646 | 0.654 | 0.663 |
| p (MPa) | κT·109 (Pa−1) | |||||
|---|---|---|---|---|---|---|
| T (K) | ||||||
| 293.15 | 298.15 | 303.15 | 308.15 | 313.15 | 318.15 | |
| 0.1 | 0.917 | 0.946 | 0.977 | 1.009 | 1.042 | 1.077 |
| 10 | 0.834 | 0.858 | 0.884 | 0.910 | 0.937 | 0.964 |
| 20 | 0.766 | 0.786 | 0.808 | 0.830 | 0.852 | 0.875 |
| 30 | 0.709 | 0.727 | 0.745 | 0.764 | 0.783 | 0.803 |
| 40 | 0.661 | 0.677 | 0.693 | 0.709 | 0.726 | 0.743 |
| 50 | 0.620 | 0.634 | 0.648 | 0.663 | 0.677 | 0.692 |
| 60 | 0.584 | 0.597 | 0.610 | 0.623 | 0.636 | 0.649 |
| 70 | 0.553 | 0.564 | 0.576 | 0.588 | 0.600 | 0.612 |
| 80 | 0.525 | 0.536 | 0.546 | 0.557 | 0.568 | 0.579 |
| 90 | 0.500 | 0.510 | 0.520 | 0.530 | 0.540 | 0.550 |
| 100 | 0.478 | 0.487 | 0.496 | 0.506 | 0.515 | 0.524 |
| p (MPa) | CV (J·mol−1·K−1) | |||||
|---|---|---|---|---|---|---|
| T (K) | ||||||
| 293.15 | 298.15 | 303.15 | 308.15 | 313.15 | 318.15 | |
| 0.1 | 148.3 | 151.3 | 154.4 | 157.8 | 161.2 | 164.8 |
| 10 | 148.2 | 151.1 | 154.2 | 157.5 | 160.9 | 164.4 |
| 20 | 148.0 | 150.9 | 154.0 | 157.2 | 160.6 | 164.1 |
| 30 | 147.8 | 150.7 | 153.8 | 157.0 | 160.3 | 163.7 |
| 40 | 147.7 | 150.6 | 153.6 | 156.7 | 160.0 | 163.4 |
| 50 | 147.6 | 150.4 | 153.4 | 156.5 | 159.7 | 163.1 |
| 60 | 147.4 | 150.2 | 153.2 | 156.3 | 159.5 | 162.8 |
| 70 | 147.3 | 150.1 | 153.0 | 156.1 | 159.2 | 162.5 |
| 80 | 147.2 | 150.0 | 152.8 | 155.9 | 159.0 | 162.2 |
| 90 | 147.1 | 149.8 | 152.7 | 155.6 | 158.7 | 162.0 |
| 100 | 147.0 | 149.7 | 152.5 | 155.4 | 158.5 | 161.7 |
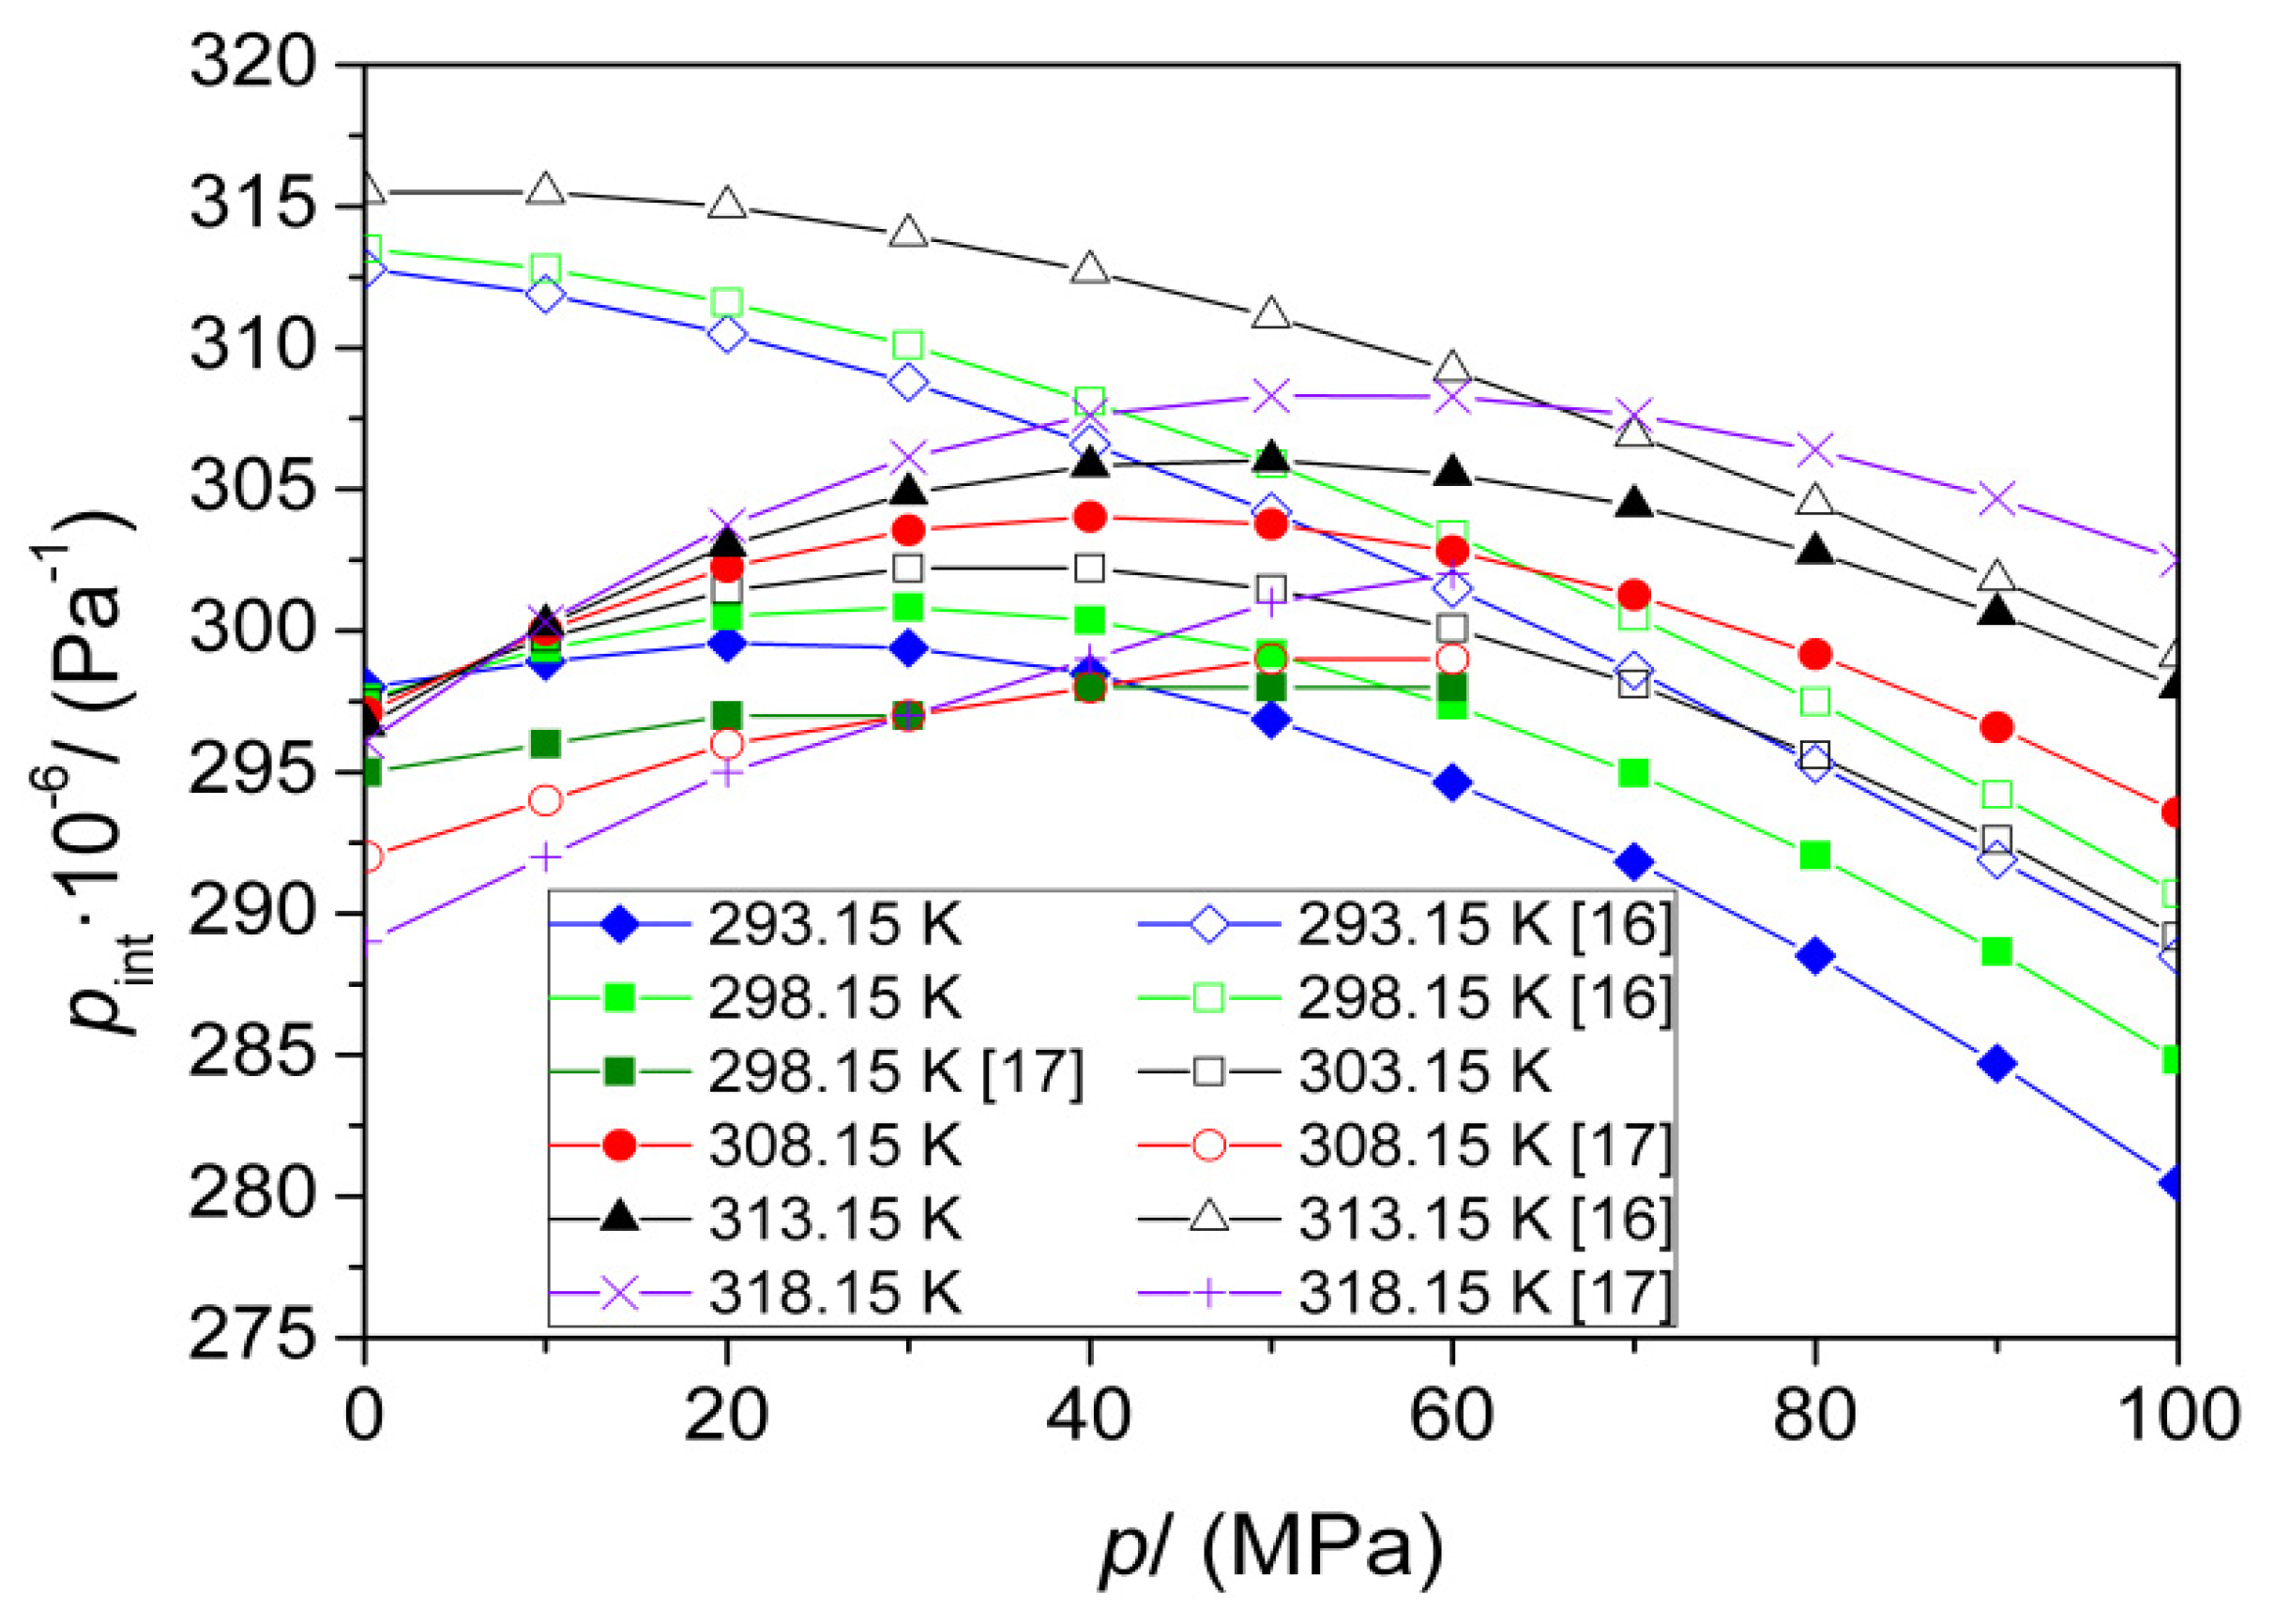
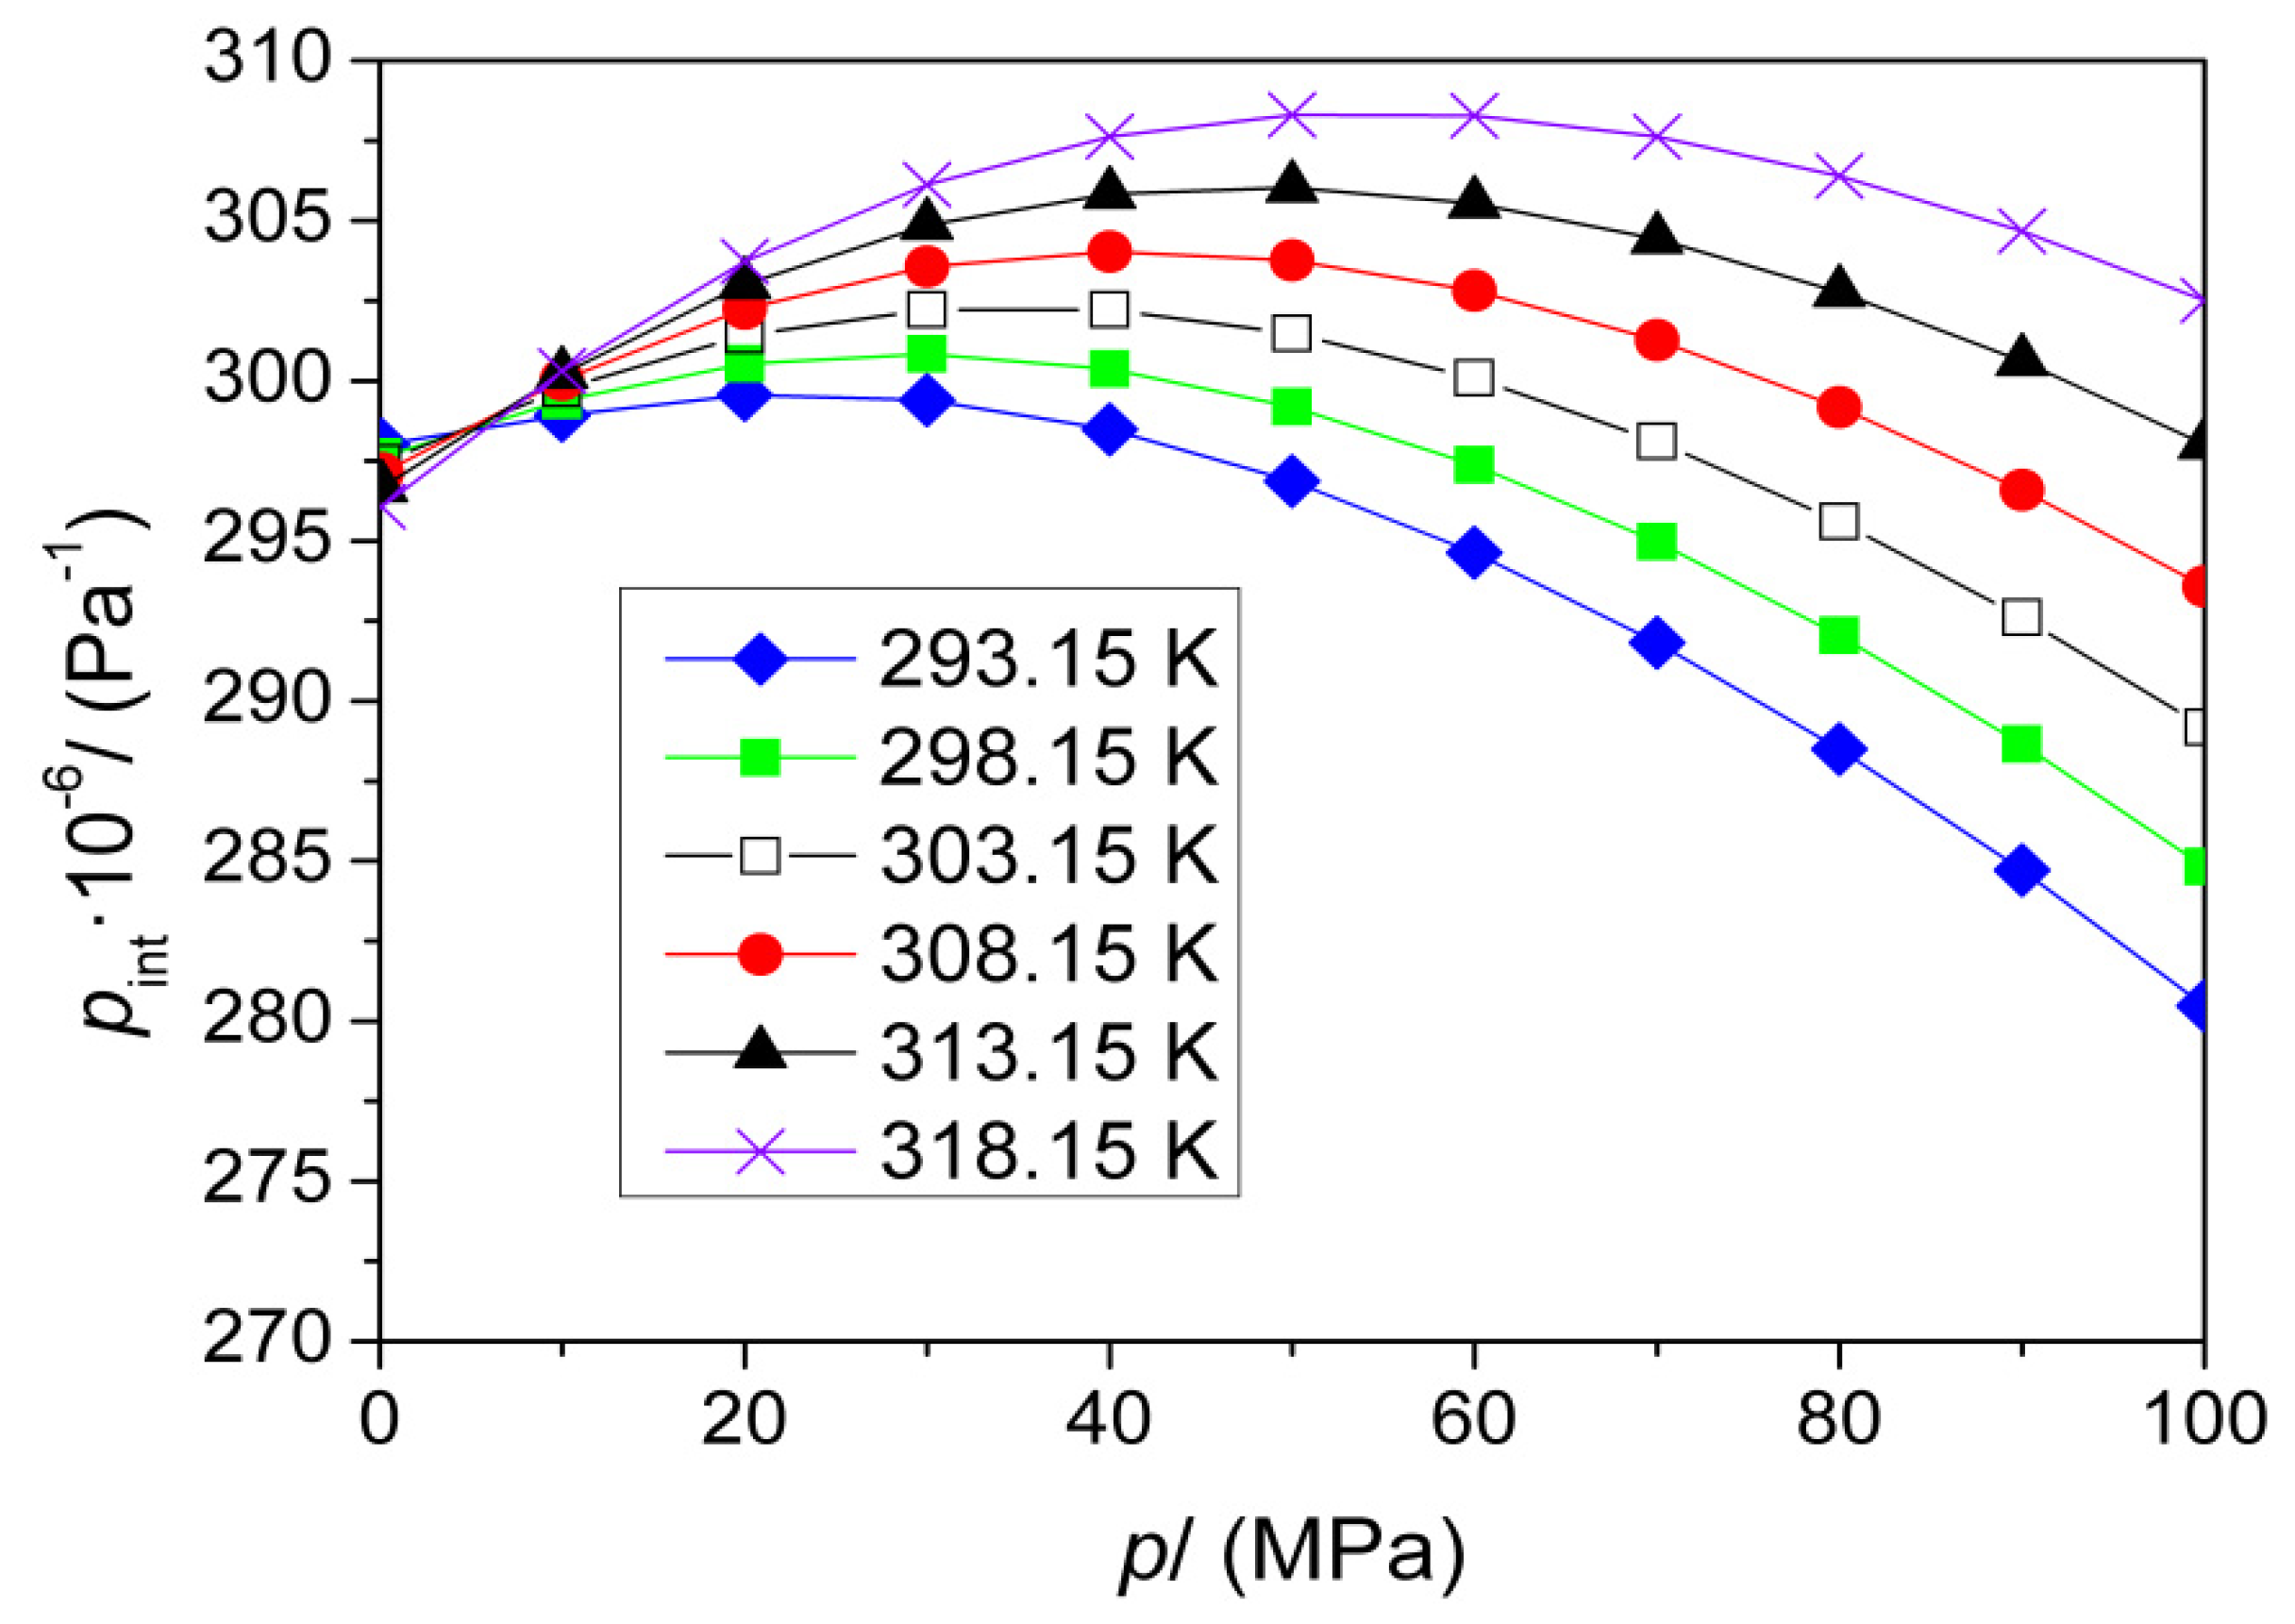
| p (MPa) | pint·10−6 (Pa) | |||||
|---|---|---|---|---|---|---|
| T (K) | ||||||
| 293.15 | 298.15 | 303.15 | 308.15 | 313.15 | 318.15 | |
| 0.1 | 297.9 | 297.4 | 297.2 | 296.9 | 296.5 | 295.9 |
| 10 | 299.1 | 299.4 | 299.7 | 300.0 | 300.2 | 300.5 |
| 20 | 299.6 | 300.5 | 301.4 | 302.2 | 303.0 | 303.7 |
| 30 | 299.4 | 300.8 | 302.2 | 303.6 | 304.9 | 306.1 |
| 40 | 298.5 | 300.4 | 302.2 | 304.0 | 305.8 | 307.6 |
| 50 | 296.9 | 299.2 | 301.5 | 303.8 | 306.0 | 308.3 |
| 60 | 294.6 | 297.4 | 300.1 | 302.8 | 305.5 | 308.3 |
| 70 | 291.8 | 295.0 | 298.1 | 301.3 | 304.4 | 307.6 |
| 80 | 288.5 | 292.0 | 295.6 | 299.2 | 302.8 | 306.4 |
| 90 | 284.7 | 288.6 | 292.6 | 296.6 | 300.6 | 304.7 |
| 100 | 280.5 | 284.8 | 289.2 | 293.6 | 298.0 | 302.5 |
© 2020 by the author. Licensee MDPI, Basel, Switzerland. This article is an open access article distributed under the terms and conditions of the Creative Commons Attribution (CC BY) license (http://creativecommons.org/licenses/by/4.0/).
Share and Cite
Dzida, M. Thermophysical Properties of 1-Butanol at High Pressures. Energies 2020, 13, 5046. https://doi.org/10.3390/en13195046
Dzida M. Thermophysical Properties of 1-Butanol at High Pressures. Energies. 2020; 13(19):5046. https://doi.org/10.3390/en13195046
Chicago/Turabian StyleDzida, Marzena. 2020. "Thermophysical Properties of 1-Butanol at High Pressures" Energies 13, no. 19: 5046. https://doi.org/10.3390/en13195046
APA StyleDzida, M. (2020). Thermophysical Properties of 1-Butanol at High Pressures. Energies, 13(19), 5046. https://doi.org/10.3390/en13195046