Article

Performance Evaluation of a Direct Absorption Collector for Solar Thermal Energy Conversion

1
Department of Mechanical Engineering, University of Engineering and Technology Lahore, New Campus-KSK 54800, Pakistan
2
Department of Chemical Engineering, University of Engineering and Technology Lahore, Faisalabad Campus 54800, Pakistan
3
Industrial Engineering Department, College of Engineering, King Saud University, P.O. Box 800, Riyadh 11421, Saudi Arabia
4
Centre for Energy Science, Department of Mechanical Engineering, University of Malaya, Kuala Lumpur 50603, Malaysia
5
School of Mechanical Engineering, Federal University of Uberlandia (UFU), Uberlandia 38408-100, Brazil
6
Department of Mechanical Engineering, College of Engineering and Technology, University of Sargodha, Sargodha 40100, Pakistan
7
Department of Mechanical Engineering & Design, School of Engineering and Applied Science, Aston University, Aston Triangle, Birmingham B4 7ET, UK
8
Sotacarbo S.p.A., Grande Miniera di Serbariu, 09013 Carbonia, Italy
*
Author to whom correspondence should be addressed.
Energies 2020, 13(18), 4956; https://doi.org/10.3390/en13184956
Submission received: 28 July 2020 / Revised: 15 September 2020 / Accepted: 17 September 2020 / Published: 21 September 2020

Abstract

:
The solar absorption efficiency of water as a base-fluid can be significantly improved by suspending nanoparticles of various materials in it. This experimental work presents the photo thermal performance of water-based nano-fluids of graphene oxide (GO), zinc oxide (ZnO), copper oxide (CuO), and their hybrids under natural solar flux for the first time. Nanofluid samples were prepared by the two-step method and the photothermal performance of these nanofluid samples was conducted under natural solar flux in a particle concentration range from 0.0004 wt % to 0.0012 wt %. The photothermal efficiency of water-based 0.0012 wt % GO nanofluid was 46.6% greater than that of the other nanofluids used. This increased photothermal performance of GO nanofluid was associated with its good stability, high absorptivity, and high thermal conductivity. Thus, pure graphene oxide (GO) based nanofluid is a potential candidate for direct absorption solar collection to be used in different solar thermal energy conversion applications.

1. Introduction

Solar energy is the most abundant renewable source, and can be used for space heating [1], electricity generation, desalination, and many other similar applications [2]. Owing to the increase of the population, the depleting trend of non-renewable energy resources must be taken into consideration [3]. Efficient energy use is a difficult task [4]. The existing literature describes different type of collectors that rely upon surface-based solar absorption and heat transfer, which is engaged by collectors to a fluid flowing inside [5]. The low thermal efficiency of conventional solar thermal collectors is a serious concern because of extensive heat losses [6,7,8]. Thus, the conventional surface-based solar collector cannot be used at high temperatures because of the heat losses [9]. Therefore, to decrease these heat losses, a volumetric type of solar collector was suggested, which uses nanoparticle suspension as the absorbing medium [10,11]. In volumetric solar collectors, working fluid absorbs solar radiation directly from sun [12]. This type of solar collector has certain advantages over the surface-based type of solar collectors including minor heat losses, lower thermal resistance, radiation trapping, and increased thermal conductivity [13]. Thus, all this helps in enhancing the overall performance of the solar collector [14]. Volumetric solar collectors result in the achievement of higher temperatures due to volumetric absorption and radiation trapping phenomenon [15,16]. The solar absorption efficiency is improved by suspending nanoparticles of various materials in heat transfer fluid [17].
The existing literature describes the different properties of individual nanofluids and binary nanofluids like solar absorptivity, stability, and viscosity [18,19,20]. These reported experimental studies have shown numerous problems with individual nanofluids as a result of high cost, low solar absorptivity, and low stability [21]. Moreover, individual nanofluids have poor heat transfer properties [22,23,24]. Radiation flux has a significant role in driving the process of desalination from seawater [25]. However, formerly used solar-based evaporation systems generally depended on intense sunlight and are not appropriate for seawater, and a severely limited number of applications are linked with this technology [26].
In current years, the nanofluid formulated of binary nanoparticles has received special attention [27]. Binary nanoparticles may possess many distinctive properties because of the mixing of two different materials [28,29]. The photothermal performance of different nanoparticles, like metals (copper, gold, silver, and aluminium) [30], metal oxides (Fe2O3, and TiO2), and carbon nanotubes (CNTs), is subjected to evaluation under different outdoor and laboratory conditions [31,32,33,34]. A pure carbon-based nanofluid, metal oxides, and mixtures of carbon and metal oxides-based binary nanofluid are more suitable for increased photo thermal efficiency [35] owing to good potential to absorb radiations compared with individual metals and metal oxides nanofluids [36,37]. Previous works [29,38,39] on binary nanofluids (CuO-MWCNTs) show that they are more suitable because of the good solar radiation absorbing capability in the solar spectrum, and their photothermal performance and transmittance are quite satisfactory, showing they are feasible materials for a direct solar absorption solar collector [40].
Now, the current need is the improvement of heat transfer capacity, cost of the nanofluids, and type of solar collectors to increase maximum absorption, which is used for solar desalination [36,37]. The solar absorption efficiency can be significantly improved by suspending nanoparticles of various materials in the base fluid [41]. A pure carbon-based nanofluid, metal oxides, and mixtures of carbon and metal oxides-based binary nanofluid are proposed to maximize the solar absorption over a broader solar spectrum [42,43]. This achievement in the nanotechnology plays an important role in improving thermal desalination processes and efficiencies. Different carbon-based nanofluids and binary nanofluids, which are combination of carbon and metal oxides, are proposed to broaden the absorption spectrum. Carbon-based nanofluids and mixtures of carbon and metal oxides-based binary nanofluid and the volumetric type of solar collectors have been developed to maximize photo absorption, which increased the photothermal efficiency [35]. Metals and metal oxides are the potential candidates for this research work [44].
The purpose of this research is to examine the photothermal efficiency of nanofluids based on their optical absorption. To this aim, a comparison is made between photothermal performance and specific absorption rate (SAR) for different nanofluids. So, in this context, the photothermal efficiency and specific absorption rate of three different nanofluids, that is, copper oxide (CuO), zinc oxide (ZnO), graphene oxide (GO), and their hybrids (binary nanofluids), at three different weight concentration under natural solar flux are studied in this work. The change in temperature of the different nanofluid samples at different weight concentrations is measured with three equally spaced K-type thermocouples. The photothermal performance and specific absorption rate of the individual and binary nanofluids are used for performance comparison.

2. Material and Methods

2.1. Experimental Setup

Nanoparticles of three different materials (CuO, ZnO, and GO) were used in this experimental investigation. The experimental setup consisted of a pyranometer, direct solar absorber, digital scale, K-type thermocouples, and data acquisition system or data logger. The solar radiations were absorbed by the nanofluid present in the sample container. The pyranometer interfaced with the computer through a data logger. As a result of evaporation, weight losses occur, which were measured using a digital scale. K-type thermocouples were used to measure the average temperature of nanofluid. Thermocouples were calibrated using a NIST (National Institute of Standards and Technology) traceable precision glass thermometer with ±0.01 °C and the uncertainty in temperature measurement was ±0.25 °C. The data logger was used to record the data over the time of the experiment. A simplified experimental setup scheme is shown in Figure 1.
Deionized water (IPEX, Inc., Oakville, ON, Canada) was used as a base fluid to prepare nanofluid samples. A petri dish was used as a sample container to hold nanofluid samples. It was so deep that three different thermocouples at three different heights were installed to take the average temperature. It helped in the direct absorption of solar irradiation. It was a cylindrical container with a diameter and height of 7 cm each. Before the start of each experiment, 250 g of water was filled in this petri dish, with different concentrations of nanoparticles.
The petri dish was placed on a digital scale for measuring weight loss in the fluids. Change in bulk fluid temperature was determined by three K-type thermocouples (OEM WRR2-130), which were placed at three typical depths; just at the top surface of the nanofluid, in the middle, and close to the bottom of the petri dish. Ambient temperature was measured with the help of a fourth k-type thermocouple. Light irradiance was measured with a pyranometer (SR30-D1). All data were registered to the computer via a data logger (CX402-XXM).

2.2. Nanofluids’ Preparation

Water nanofluids of ZnO, CuO, GO, and their hybrids were prepared by the two-step method. For example, in the preparation of copper oxide nanofluid, sodium hydroxide (NaOH) and copper chloride dehydrate (CuCl2:2H2O) were used as chemical reagents for synthesis. Copper chloride and sodium hydroxide were used according to a molar ratio (CuCl2:NaOH) of 0.5:1 to prepare the solution sample. The amount of CuCl2 as per the molar ratio was dissolved in 100 ml of deionized water. Precipitating agent (NaOH) was added dropwise in this solution under constant stirring. pH value of 12 was maintained throughout the reaction. NaOH was used as a precipitate agent to control the pH value. NaOH was added dropwise under constant stirring and the solution was mixed with precipitating agent (NaOH) to obtain less chemically dispersed nanoparticles. There is no time limit to control the pH value during the preparations of nanofluids. The precipitate settled down upon the completion of the reaction process. The sample was aged for 10 h afterwards. The precipitate was collected and washed a number of times with deionized water through filter paper to make it free from sodium and chloride ions. These precipitates were dried in an oven at 80 °C for 10 h. The precipitate was ground using a pestle and mortar to a clear black powder. The black powder was sintered at 600 °C in a muffle furnace for 3 h. After the completion of the reaction, the samples were aged for 10 h, because of the nanofluids are settled down on the surface of the beaker and in order to obtain less dispersed nanoparticles. Afterwards, samples were put in the muffle furnace for different times and some changes in the nanofluids were observed, that is, change in the crystal structure, size of the nanofluids, and length of the nanofluid. In this new work, a co-precipitation method was used to prepare nanoparticles, where NaOH was used as the precipitating agent and serves as a terminator for growing the nano-particles because the particles cannot come together easily. Furthermore, it expands during the calcination process, which is why the temperature was 80 °C for 10 h and 600 °C for 3 h. The same procedure was followed for the synthesis of other nanomaterials, that is, GO and ZnO [28]. To make a nanofluid sample in base fluid, a measured amount of nano powder was mixed with a given base fluid volume and the acquired mixture was sonicated for 30 min before starting the photothermal conversion experiment. Three different concentrations (0.0004 wt %, 0.0008 wt %, and 0.0012 wt %) of nanoparticles were used in this research. Nanopowders with a maximum concentration of 0.0012 wt % in the experimental range were suspended in the basefluid using ultrasonication and magnetic stirring. A visual method and absorption spectra were used to evaluate the nanoparticle sedimentation. No sedimentation was observed after suspending the nanoparticles in the base fluid until 30 minutes.
Photothermal conversion experiment of the nanofluids was conducted in a particle concentration range from 0.0004 wt % to 0.0012 wt % for individual water-based nanofluids of GO, ZnO, and CuO. The hybrids (binary nanofluids) GO–CuO and GO–ZnO were analysed at 0.0004 wt % concentration under natural solar flux. Table 1 shows that experiments were carried out on 0.0004 wt % for individual nanofluids of GO, ZnO, and CuO and the hybrid combination of GO–CuO and GO–ZnO. The amount of GO is different, but weight concentrations of hybrid nanofluids are still same by varying the concentration of other nanoparticles used in this study. It was observed that adding a very small amount of nanoparticles in the base fluid enhanced the thermo physical properties of the base fluid and heat transfer rate. Photothermal efficiency was sensitive to concentration mixing ratio in the case of binary nanofluids GO–CuO and GO–ZnO, and extreme addition of an individual nanoparticle component ZnO or CuO lowered performance.

3. Results and Discussion

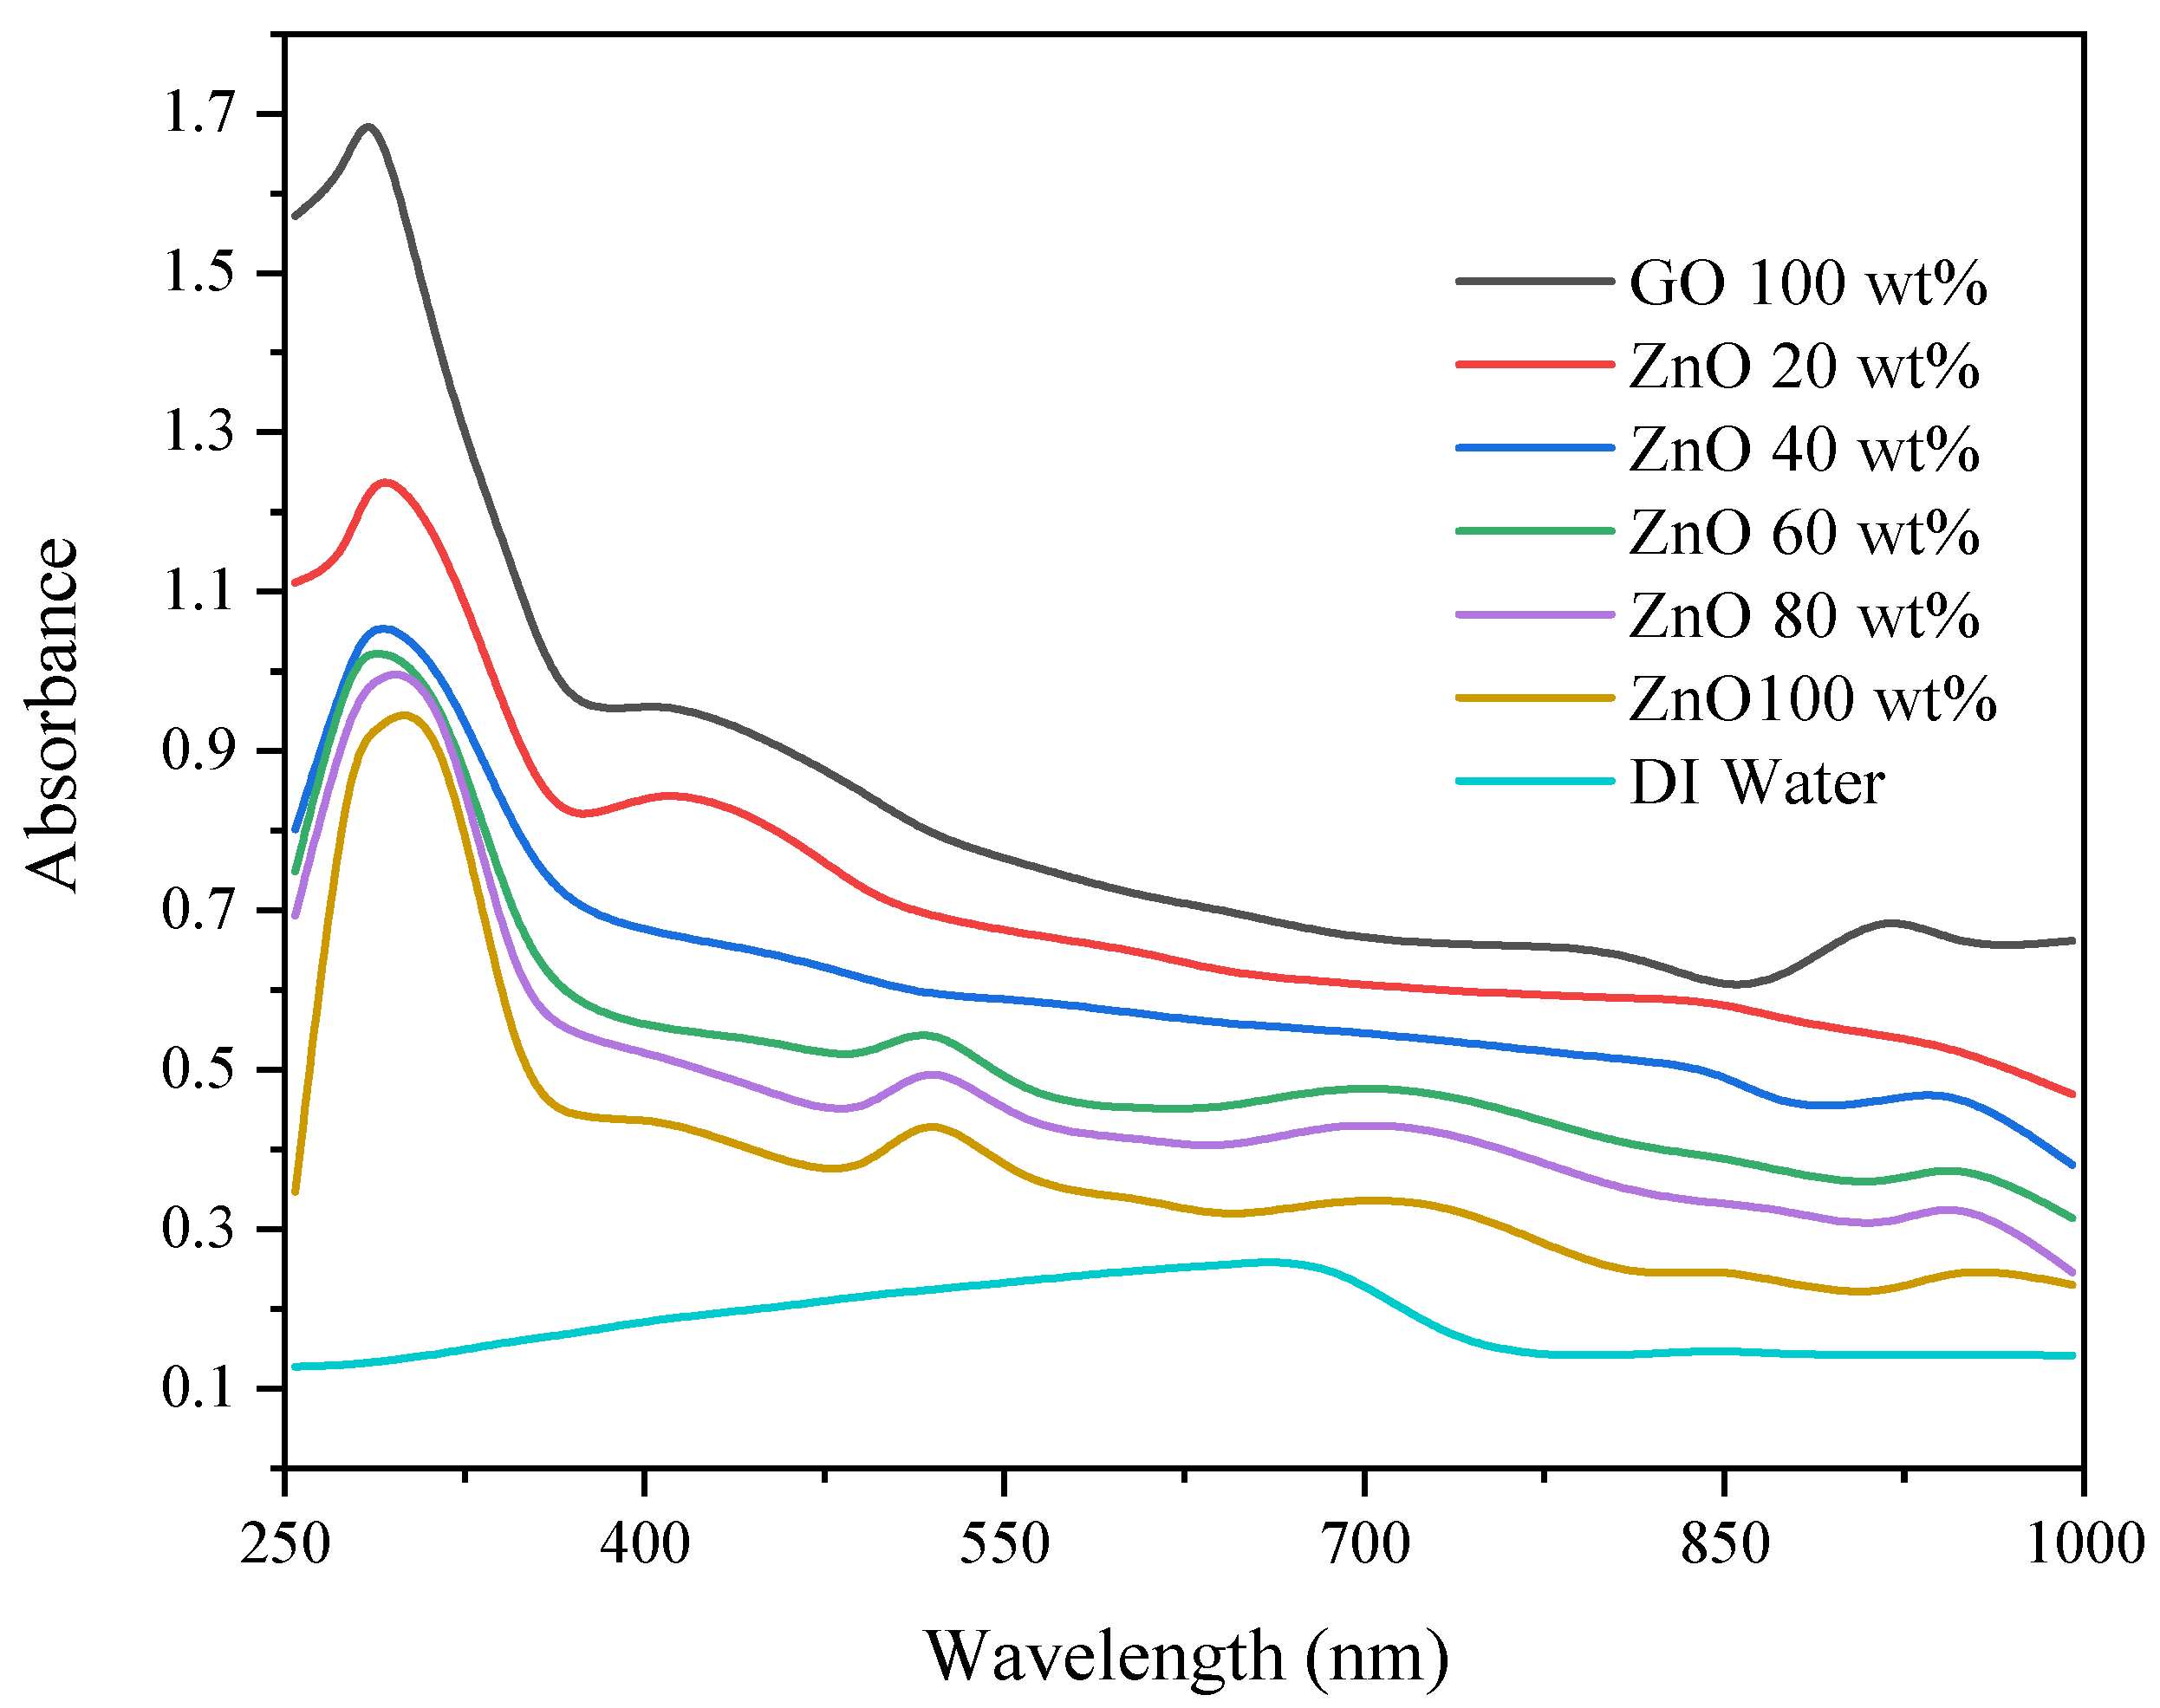
3.1. Optical Absorbance

In this study, a UV–vis spectrophotometer (Shimadzu 1800, Japan) was used for evaluating the dispersion stability of the prepared nanofluids. Incident scanning light is thrown on the sample in the wavelength range of 300 to 1000 nm. All data were recorded at room temperature (25 °C). The spectrophotometer works on the principle of Lambert–Beer’s law ( A = ε c l ) , where A shows absorbance, ε shows the molar absorption coefficient, c shows the molar concentration, and l shows the optical path length. Two cuvettes of weight capacity of 0.0001 g each are used. One cuvette contains the reference base fluid, while other is filled with nanofluid. Incident light of equal intensity is thrown on both the cuvettes and difference in the light is measured by the detectors after passing through the solutions. Hence, a spectrum is obtained between the absorbance and wavelength, which gives the concentration of nanoparticles in nanofluids. After comparing this spectrum trend at a specific wavelength after defined time intervals, the concentration and thus stability of nanoparticles are noted.
In UV–visible regions, different types of nanofluids at 0.0004 wt %, 0.0008 wt %, and 0.0012 wt % concentrations have different absorption peaks. The experimental results showed that different nano-fluids have different peaks of optical absorption over the UV–visible spectrum. The display of copper oxide, zinc oxide, and graphene oxide nanofluids was a broad shoulder around 275 nm, 314 nm and 287 nm, respectively, at three different weight concentrations. The intensity of absorption peaks increased with the rise in the concentration of the nanofluid. The graphene oxide nanofluid absorption peak is higher than that of all the other nanofluids used in this research compared at the same weight particle concentration of 0.0004 wt %, 0.0008 wt %, and 0.0012 wt %, respectively. This is because of the augmented performance of carbon-based nanofluids (GO), which have good stability, high absorptivity, and high thermal conductivity properties, which make them distinct from the others. It can fluoresce over a wide range of wavelengths (from near-infrared to ultraviolet) and effectually reduce the fluorescence of other fluorescent dyes. In contrast, minimum absorbance was observed in the case of deionized (DI) water because, in the visible light spectrum, water is a poor absorber of solar energy. Adding nanoparticles that have good absorptivity in the visible region can significantly enhance the solar absorption of water. Compared with graphene oxide, other nanofluids have their absorption peaks in the UV–visible region. Although nanofluids of ZnO and CuO do not have very strong absorption peaks in the UV region, their absorption is far better than water, which is shown below in Figure 2.
In Figure 3 and Figure 4, the optical properties of composite nanoparticles (GO–ZnO and GO–CuO) are evaluated in UV–vis spectroscopy [45,46]. The spectrum exhibits absorption in the visible and infrared regions, but prominent absorption occurs in the UV region. In both situations of GO–ZnO and GO–CuO composites binary nanoparticles, the absorption peaks of pure GO, pure ZnO, and pure CuO are observed at 275 nm, 314 nm, and 287 nm, correspondingly. Peaks’ intensity decreases with the decrease in GO concentration. A maximum absorption peak is observed in the case of pure GO nanofluids compared with other individual and binary nanofluids used in this research.

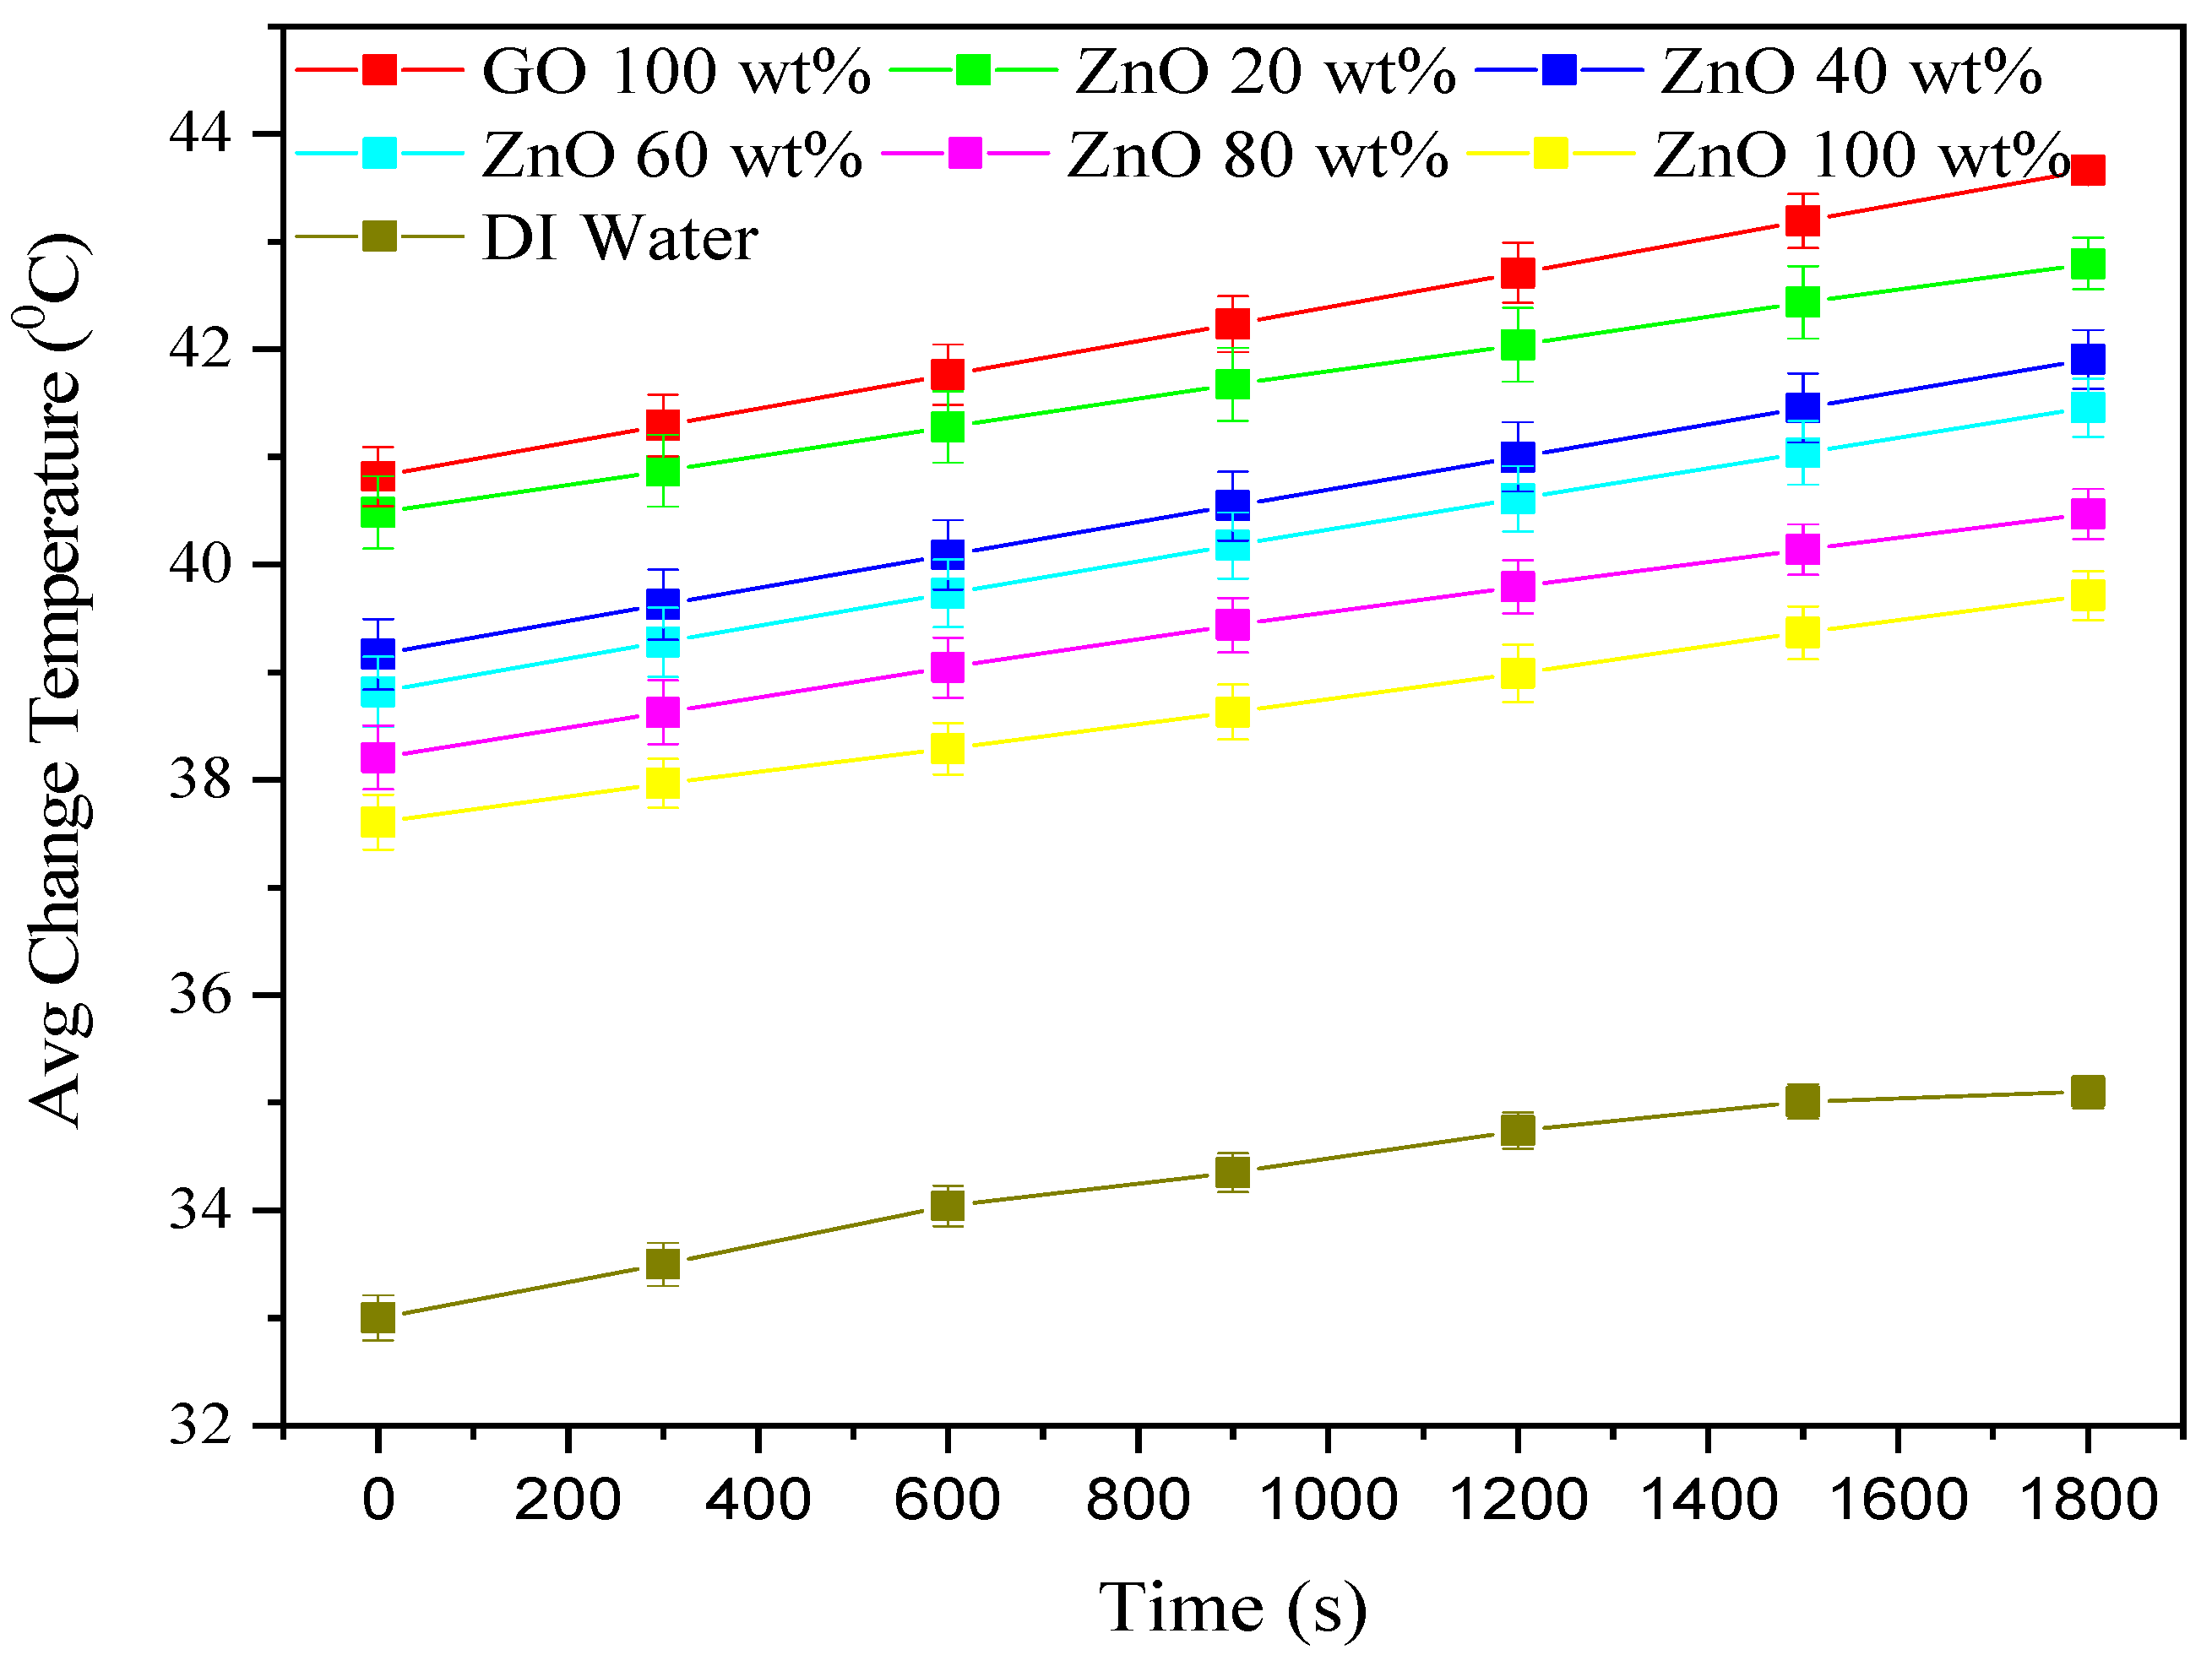
3.2. Change in Fluid Volume Temperature

Figure 5 represents the temperature variations of copper oxid, zinc oxide, and graphene oxide nanofluid samples at 0.0004 wt % concentrations in the base fluid under natural sunlight during the experiments. Supposing that the temperature of particles in the base fluid is approximately equal to that of the complete solution because of very minute loading. All nanofluid samples and the deionized water are heated under the natural sun for a duration of half an hour. Changes in the temperature readings of all three installed thermocouples (TC1, TC2, and TC3) are depicted by the average temperature profiles of copper oxide, zinc oxide, graphene oxide, and their hybrids. The average temperature of the nanofluids is calculated by the formula (ΔT = (TC1 + TC2 + TC3)/3) and plotted with respect to time for all the nanofluids.
An increasing linear trend in bulk fluid temperature can be seen by the reading of all three thermocouples at the start of the experiments. However, this increasing trend is not continued later. This is because, at the beginning of the experiment, most of the transferred heat energy results in a linear rise in temperature, and very little heat is wasted to the environment. As the nanofluid temperature increases, the temperature of the nanofluid sample and environment is also increased, which is the reason for the enhanced heat loss and linearity not being observed. The increase in temperature is very little when the value of temperature difference reaches the maximum value, and it is clear that, after 600 s, the linear trend finished and the non-linear trend started somehow during the experiment. Moreover, the temperature rises at a greater rate for TC1 than for that of the other two remaining thermocouples (TC2 and TC3). This is because of the decreasing tendency in solar light irradiance accomplished with the optical length. The highest temperature variation between the top and bottom surfaces of the nanofluid was 3.86 °C.
The environmental temperature remained almost the same during the experiment throughout this study. If the comparison is made between the nanofluids and deionized water temperature, it can be realized that all nanofluids have greater temperature gradients than DI water (see Figure 5). It can also be seen that nanofluids’ temperature increased with the increase in nanoparticles’ concentration, as presented in Figure 6 and Figure 7. The greatest increase in the average change in temperature (2.51 °C) was achieved in GO nanofluid compared with the other nanofluids used in this study because of high solar absorptivity. The specific capacity of nanofluids was observed to be very close to that of water. Moreover, the difference in the increase in temperature is due to the high absorbance of graphene nanofluid (GO) in the visible region. GO is black and carbon-based nanofluid. Thanks to this characteristic, it shows augmented absorptivity of solar irradiation.
The temperature variations for the 0.0004 wt % hybrid nanofluids GO–CuO and GO–ZnO and DI water are displayed in Figure 6 and Figure 7 respectively. The average change in temperature increased initially and then decreased with the increasing copper oxide and zinc oxide concentration, which is still higher than that of individual ZnO and CuO nanofluids. The increase in the wt % of of CuO and ZnO nanoparticles in GO reduced the mixture performances even at lower fractions of of CuO and ZnO nanoparticles, but they were superior to that of DI water. Thus, it can be observed that the addition of GO in metal-oxides nanoparticles, that is, binary nanoparticles, enhanced the overall solar energy absorption. This increased the average change in temperature, which resulted in the enhancement in photo thermal efficiency as compared with individual nanofluids, except for pure GO nanofluid, because pure GO nanofluid is a carbon-based nanofluid having the highest solar absorptivity compared with other individual nanofluids (ZnO, CuO) and binary nanofluids GO–CuO and GO–ZnO used in this study.

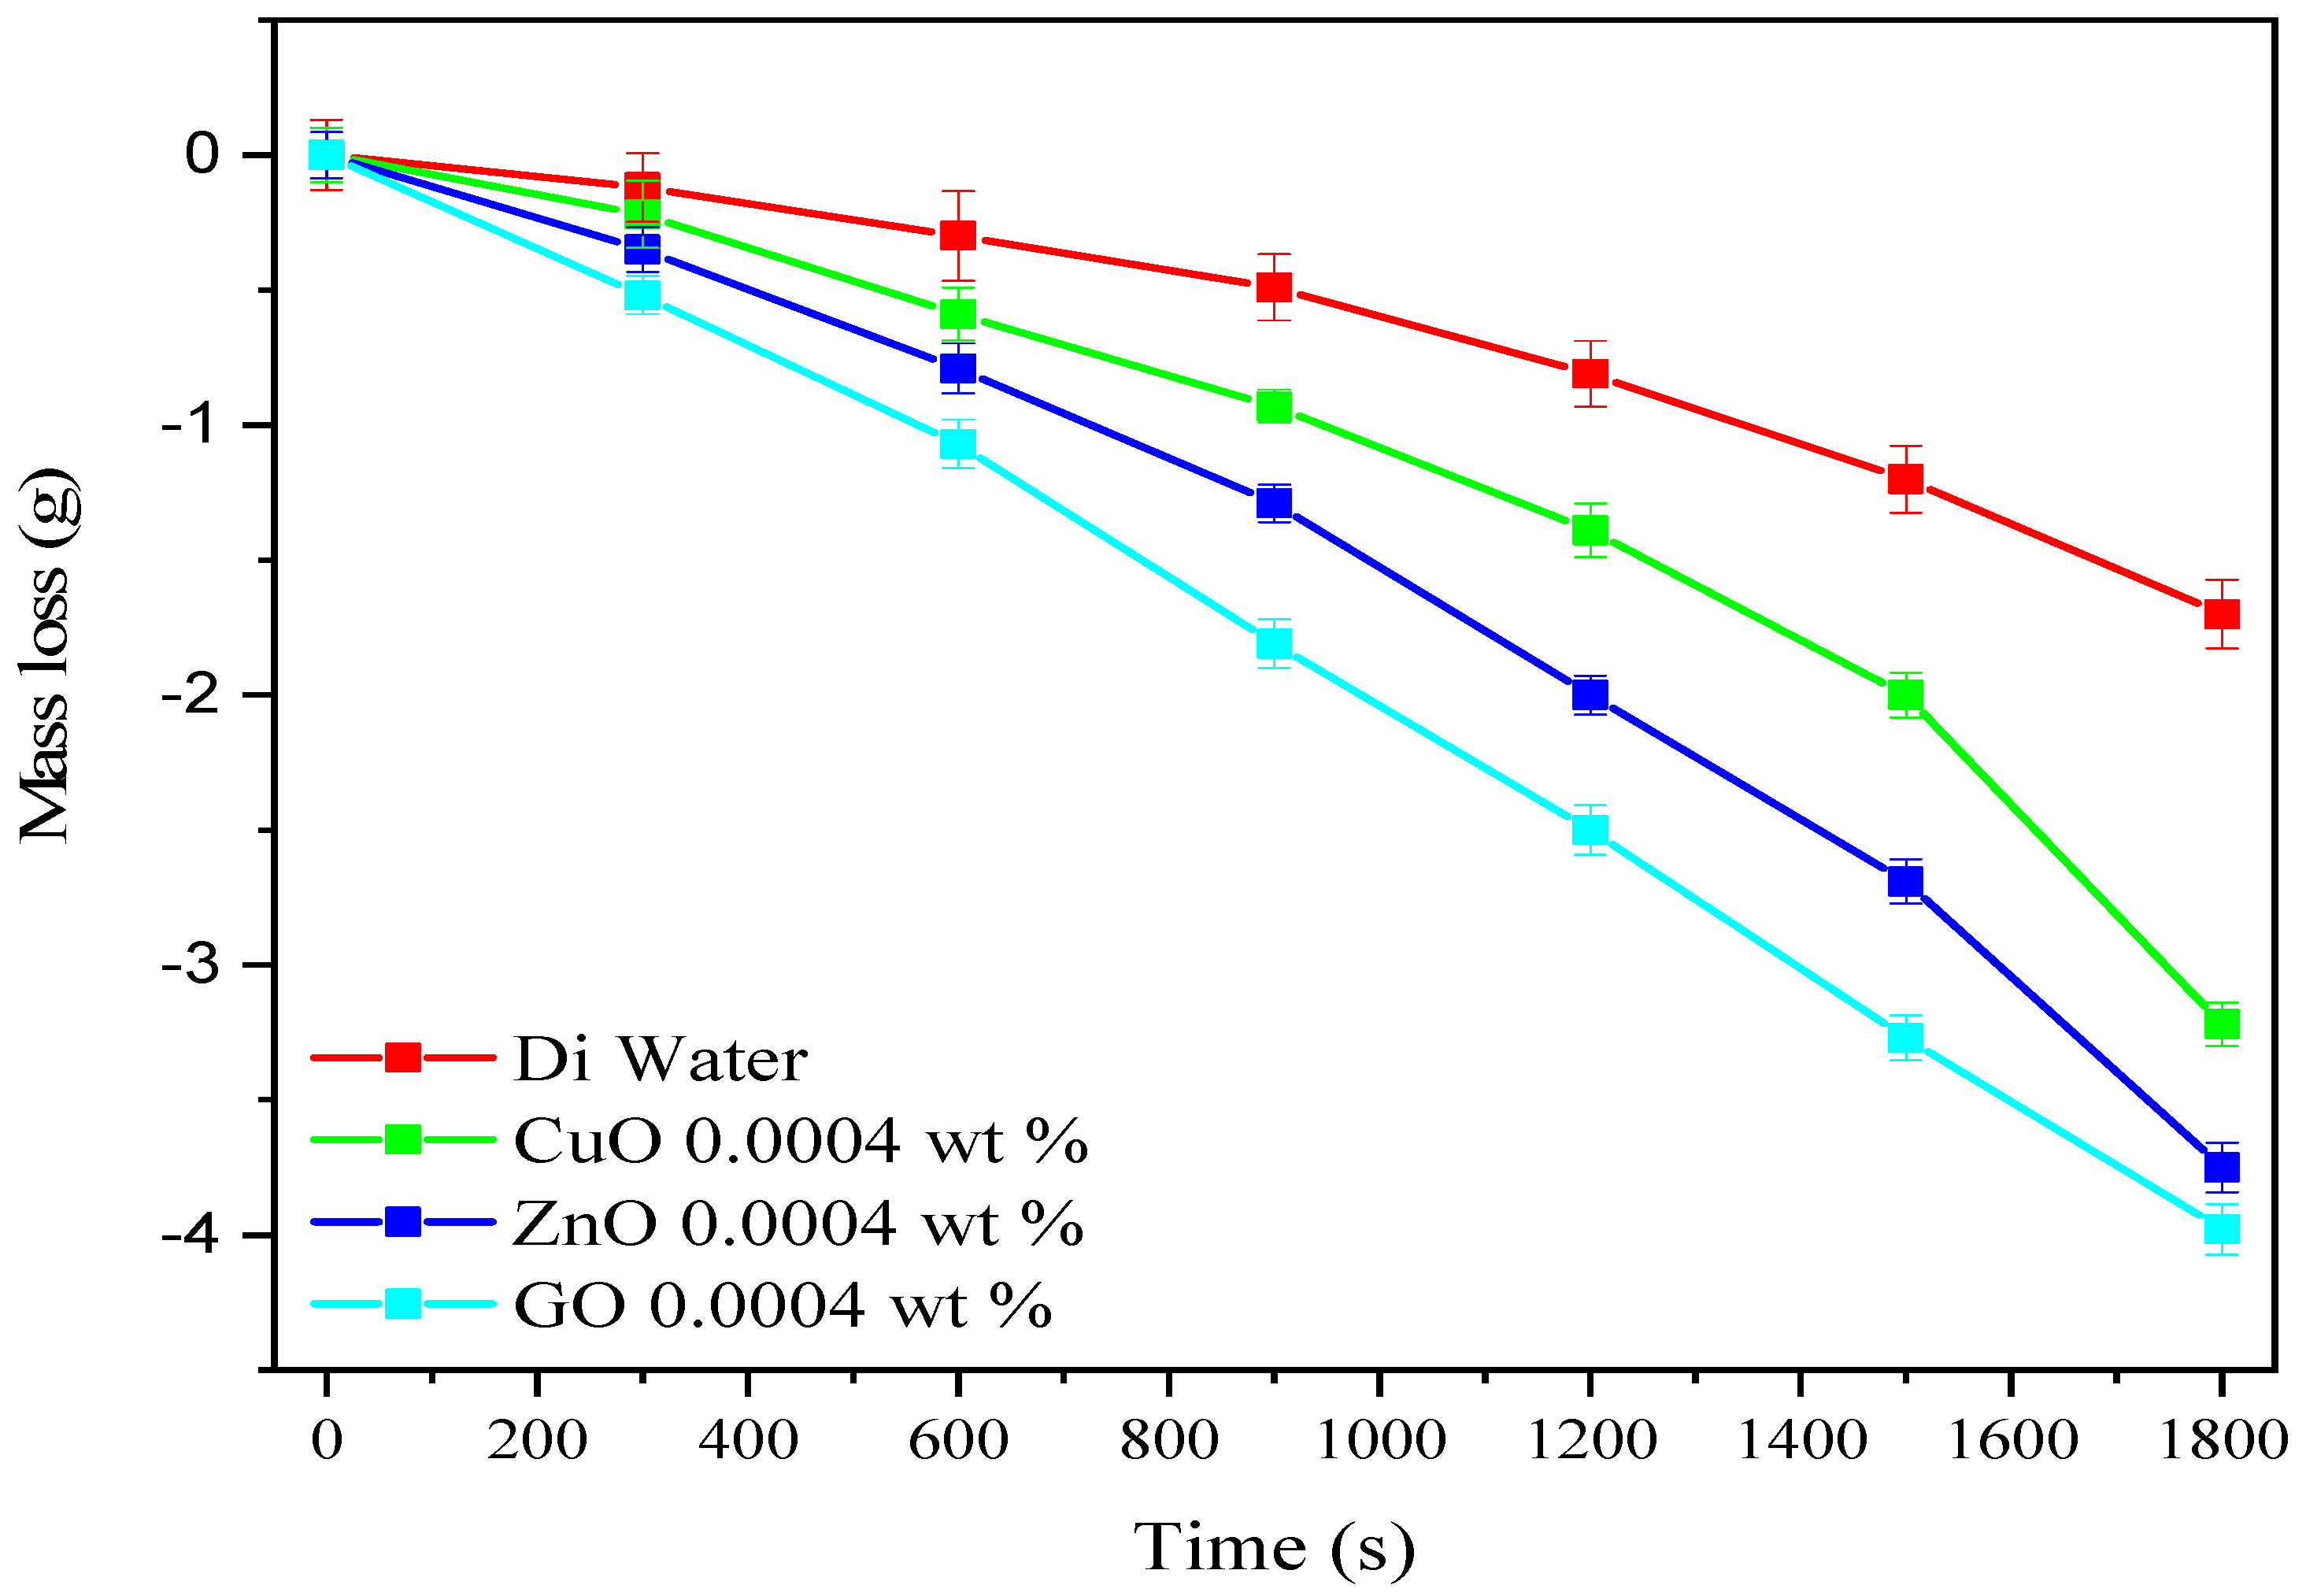
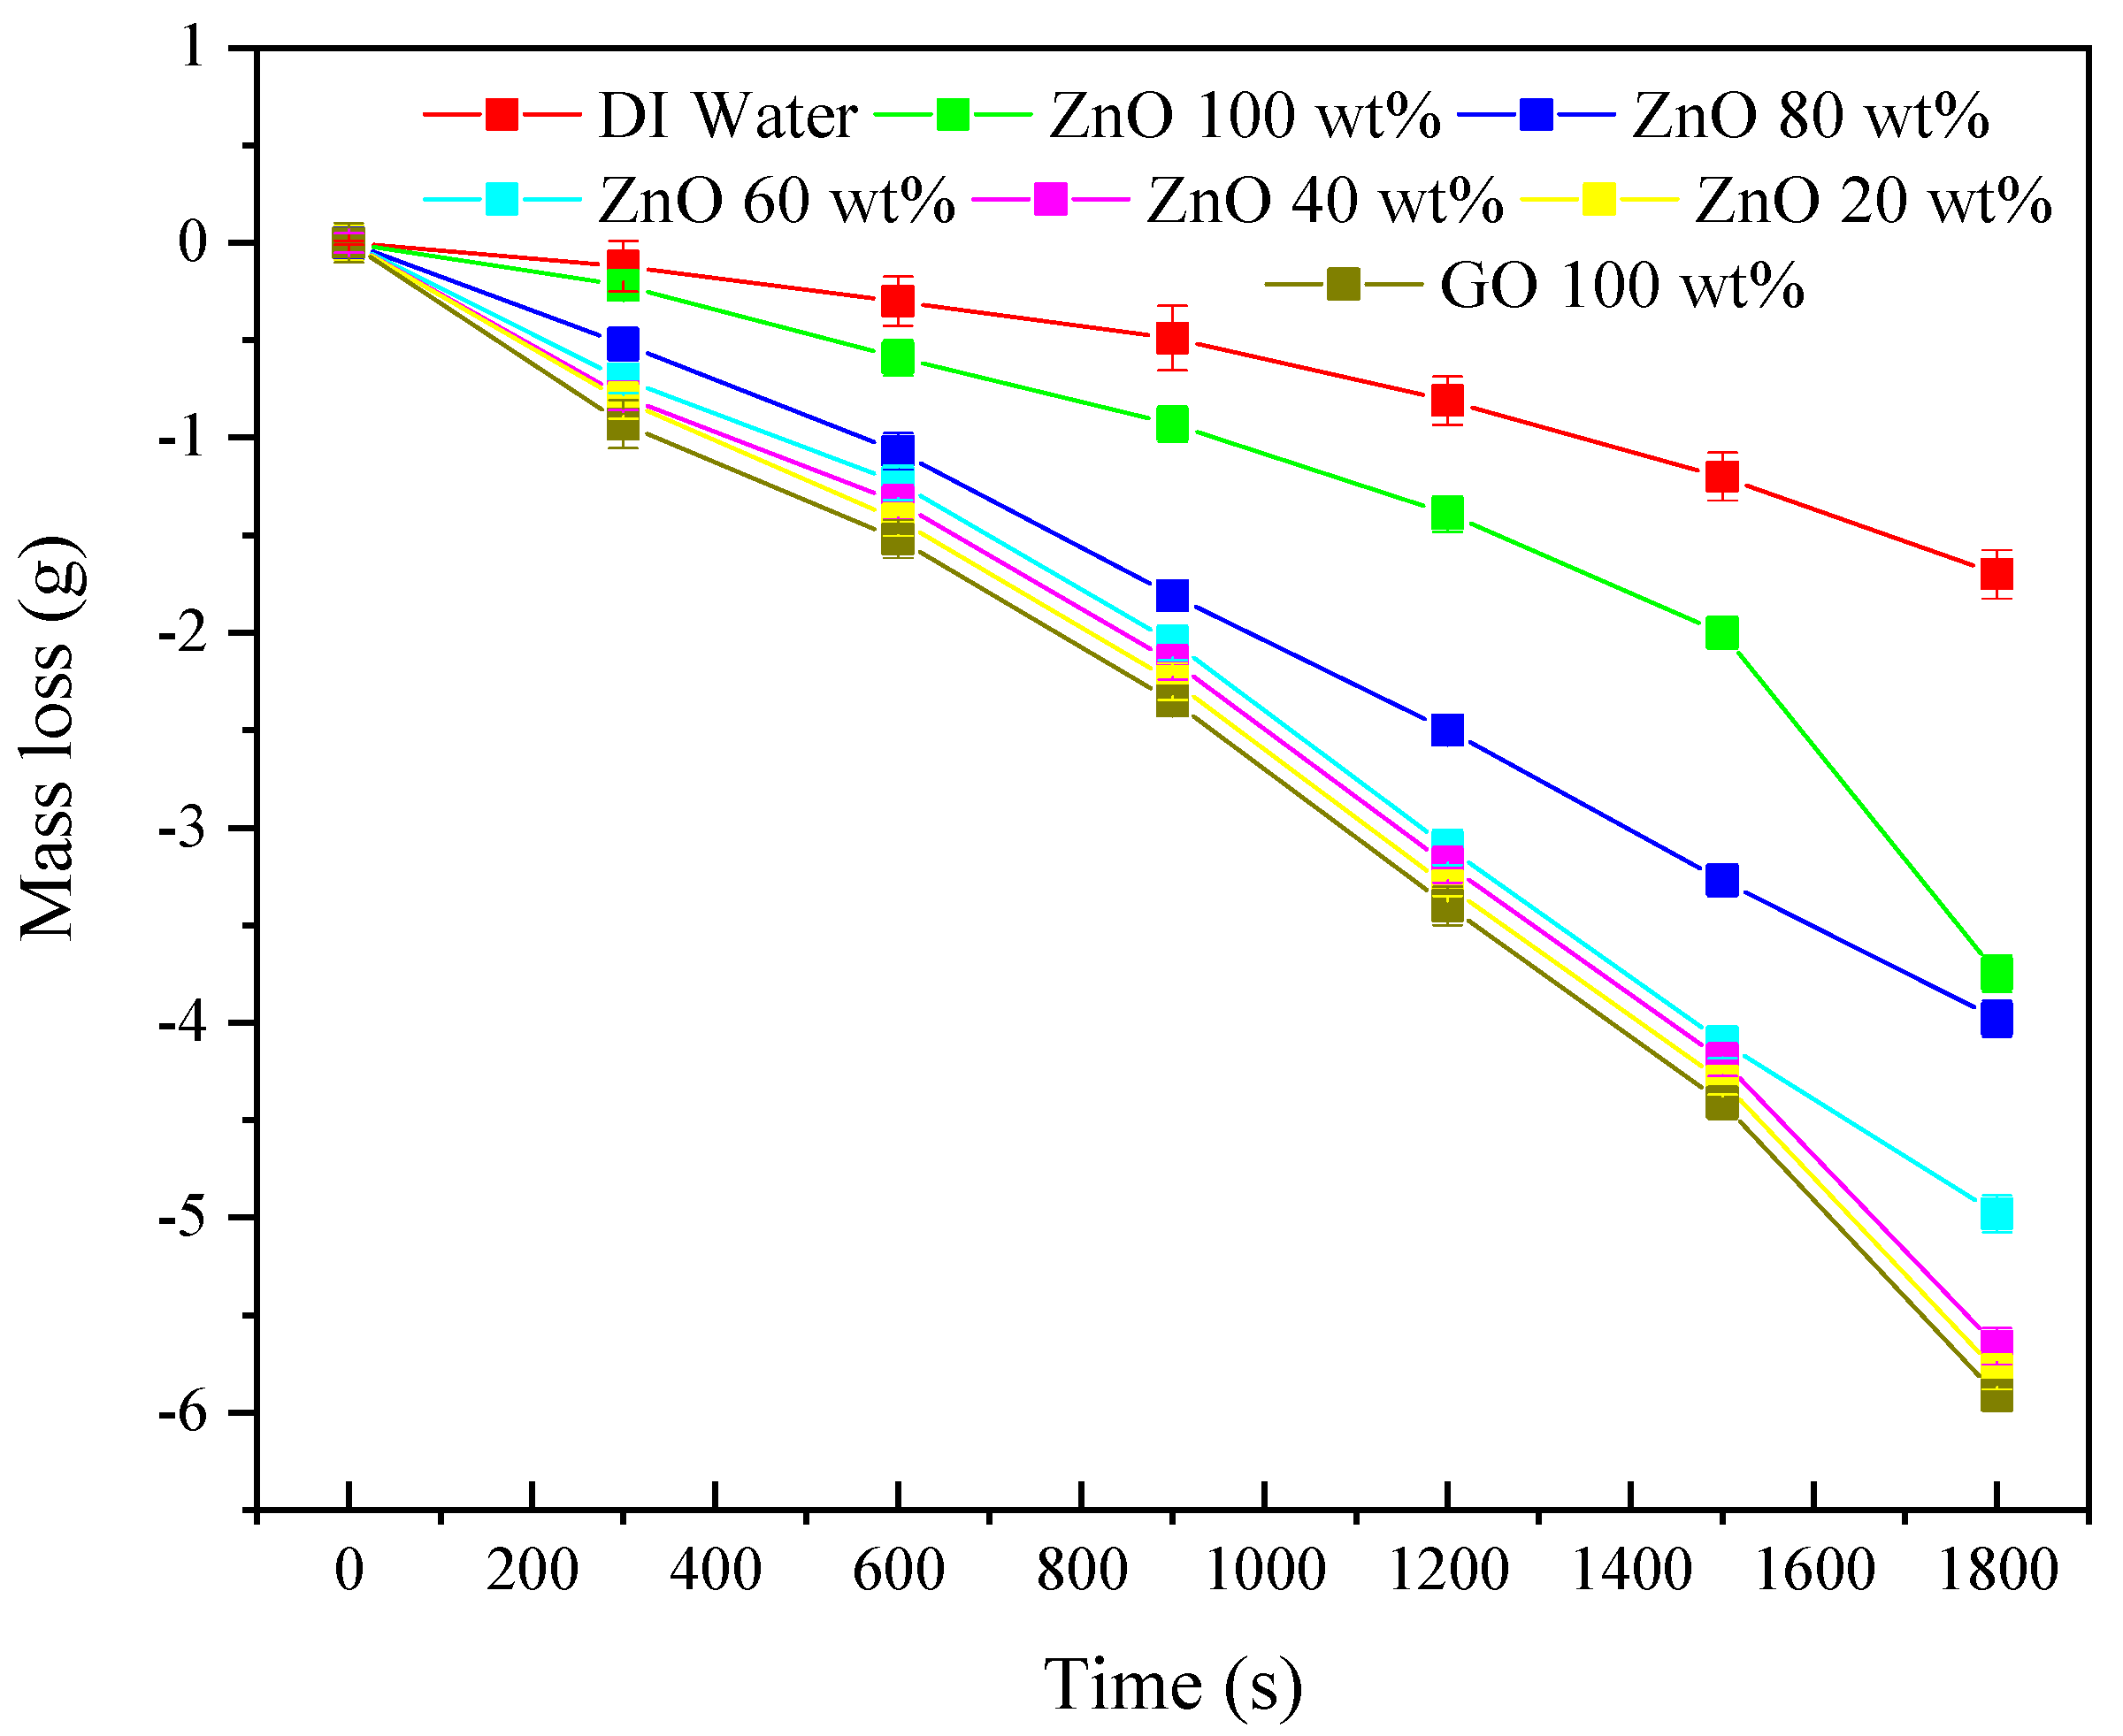
3.3. Mass Loss of Nanofluids

A digital balance was used to calculate the reduction in mass of the nanofluids because of the evaporation phenomena. The time duration for this measurement was selected as 1800 s under natural sunlight. It is observed that a reduction in the mass of the nanofluids is directly related to the bulk temperature increment. Instead of heating bulk fluid, most of the absorbed energy is used to evaporate fluid. An increment in the temperature of the sample as a whole means that more heat loss occurs to the environment.
Figure 8, Figure 9 and Figure 10 show the average mass loss of water-based (GO, ZnO, CuO) nano-fluids and their composites nanofluids (ZnO–GO and CuO–GO) at 0.0004 wt % concentrations under natural sun light during the experiment for the time period of 30 min. The maximum mass loss was observed for GO nanofluid and minimum for DI water. It can be observed during the experimentation that the mass loss of all types of nanofluids was enhanced with the enhancement in the concentration of the nanoparticles. Maximum mass loss was achieved in GO nanofluid compared with other nanofluids used in this study because of the high solar absorptivity. The average mass loss of binary nanofluids increased first and then reduced with the increasing CuO and ZnO concentration, which is higher than that of individual CuO and ZnO nanofluid as seen in Figure 9 and Figure 10 respectively. The addition of CuO and ZnO nanoparticles in GO nanoparticles reduced the mixture performance even at a low CuO and ZnO mass fraction, but greater than that of DI water. Figure 8 shows the mass loss for a specific time duration in the nanofluid of CuO, ZnO, and GO under natural sun over the period of 1800 s of DI water base nanofluids at 0.0004 wt % concentration.

3.4. Photothermal Efficiency

Photothermal efficiency (PTE) is the ratio between the internal energy increase of fluid to the total incident solar radiation [46].
η P T E = 0 t ( C W m W ) · Δ T · d t + 0 t L V m l o s s · d t 0 t I · A · d t
where CW defines the specific heat capacity of water measured in (J/kgK); Lv is the latent heat of vaporization (J/kg) at a pressure of 1 bar; mloss is the mass loss (mloss = minitial/t) of nanofluid in time t, measured in kg/s; I is the solar irradiance, which is equal to 850 W/m2, measured by the pyranometer; mw is the mass of water in (kg); A is the illumination area of the nanofluid sample, measured in m2; and ΔT is the average change in temperature value in time t of three thermocouples. Equation (1) gives this energy analysis, which is translated in the form of photothermal efficiency.
Figure 11 and Figure 12 show the photothermal efficiency of water base (GO, ZnO/H2O, CuO) nanofluids and their composites (GO–ZnO and GO–CuO) at different wt % concentrations (0.0004 wt %, 0.0008 wt %, and 0.0012 wt %). It can be observed that the photothermal efficiency of all types of nanofluids is directly related to nanoparticle concentration, which is enhanced with the enhancement of the nanoparticle concentration.
Pure GO nanofluid has the highest efficiency relative to other nanofluids used in this research because of its high absorptivity and high thermal conductivity compared with the others. Photothermal efficiency would be higher for nanoparticles of higher thermal conductivity. According to the Fourier law of heat conduction, the heat transfer rate depends on thermal conductivity, which is directly related to temperature. At a higher thermal conductivity, a higher temperature will be achieved, which is the main parameter in calculating the photothermal efficiency.

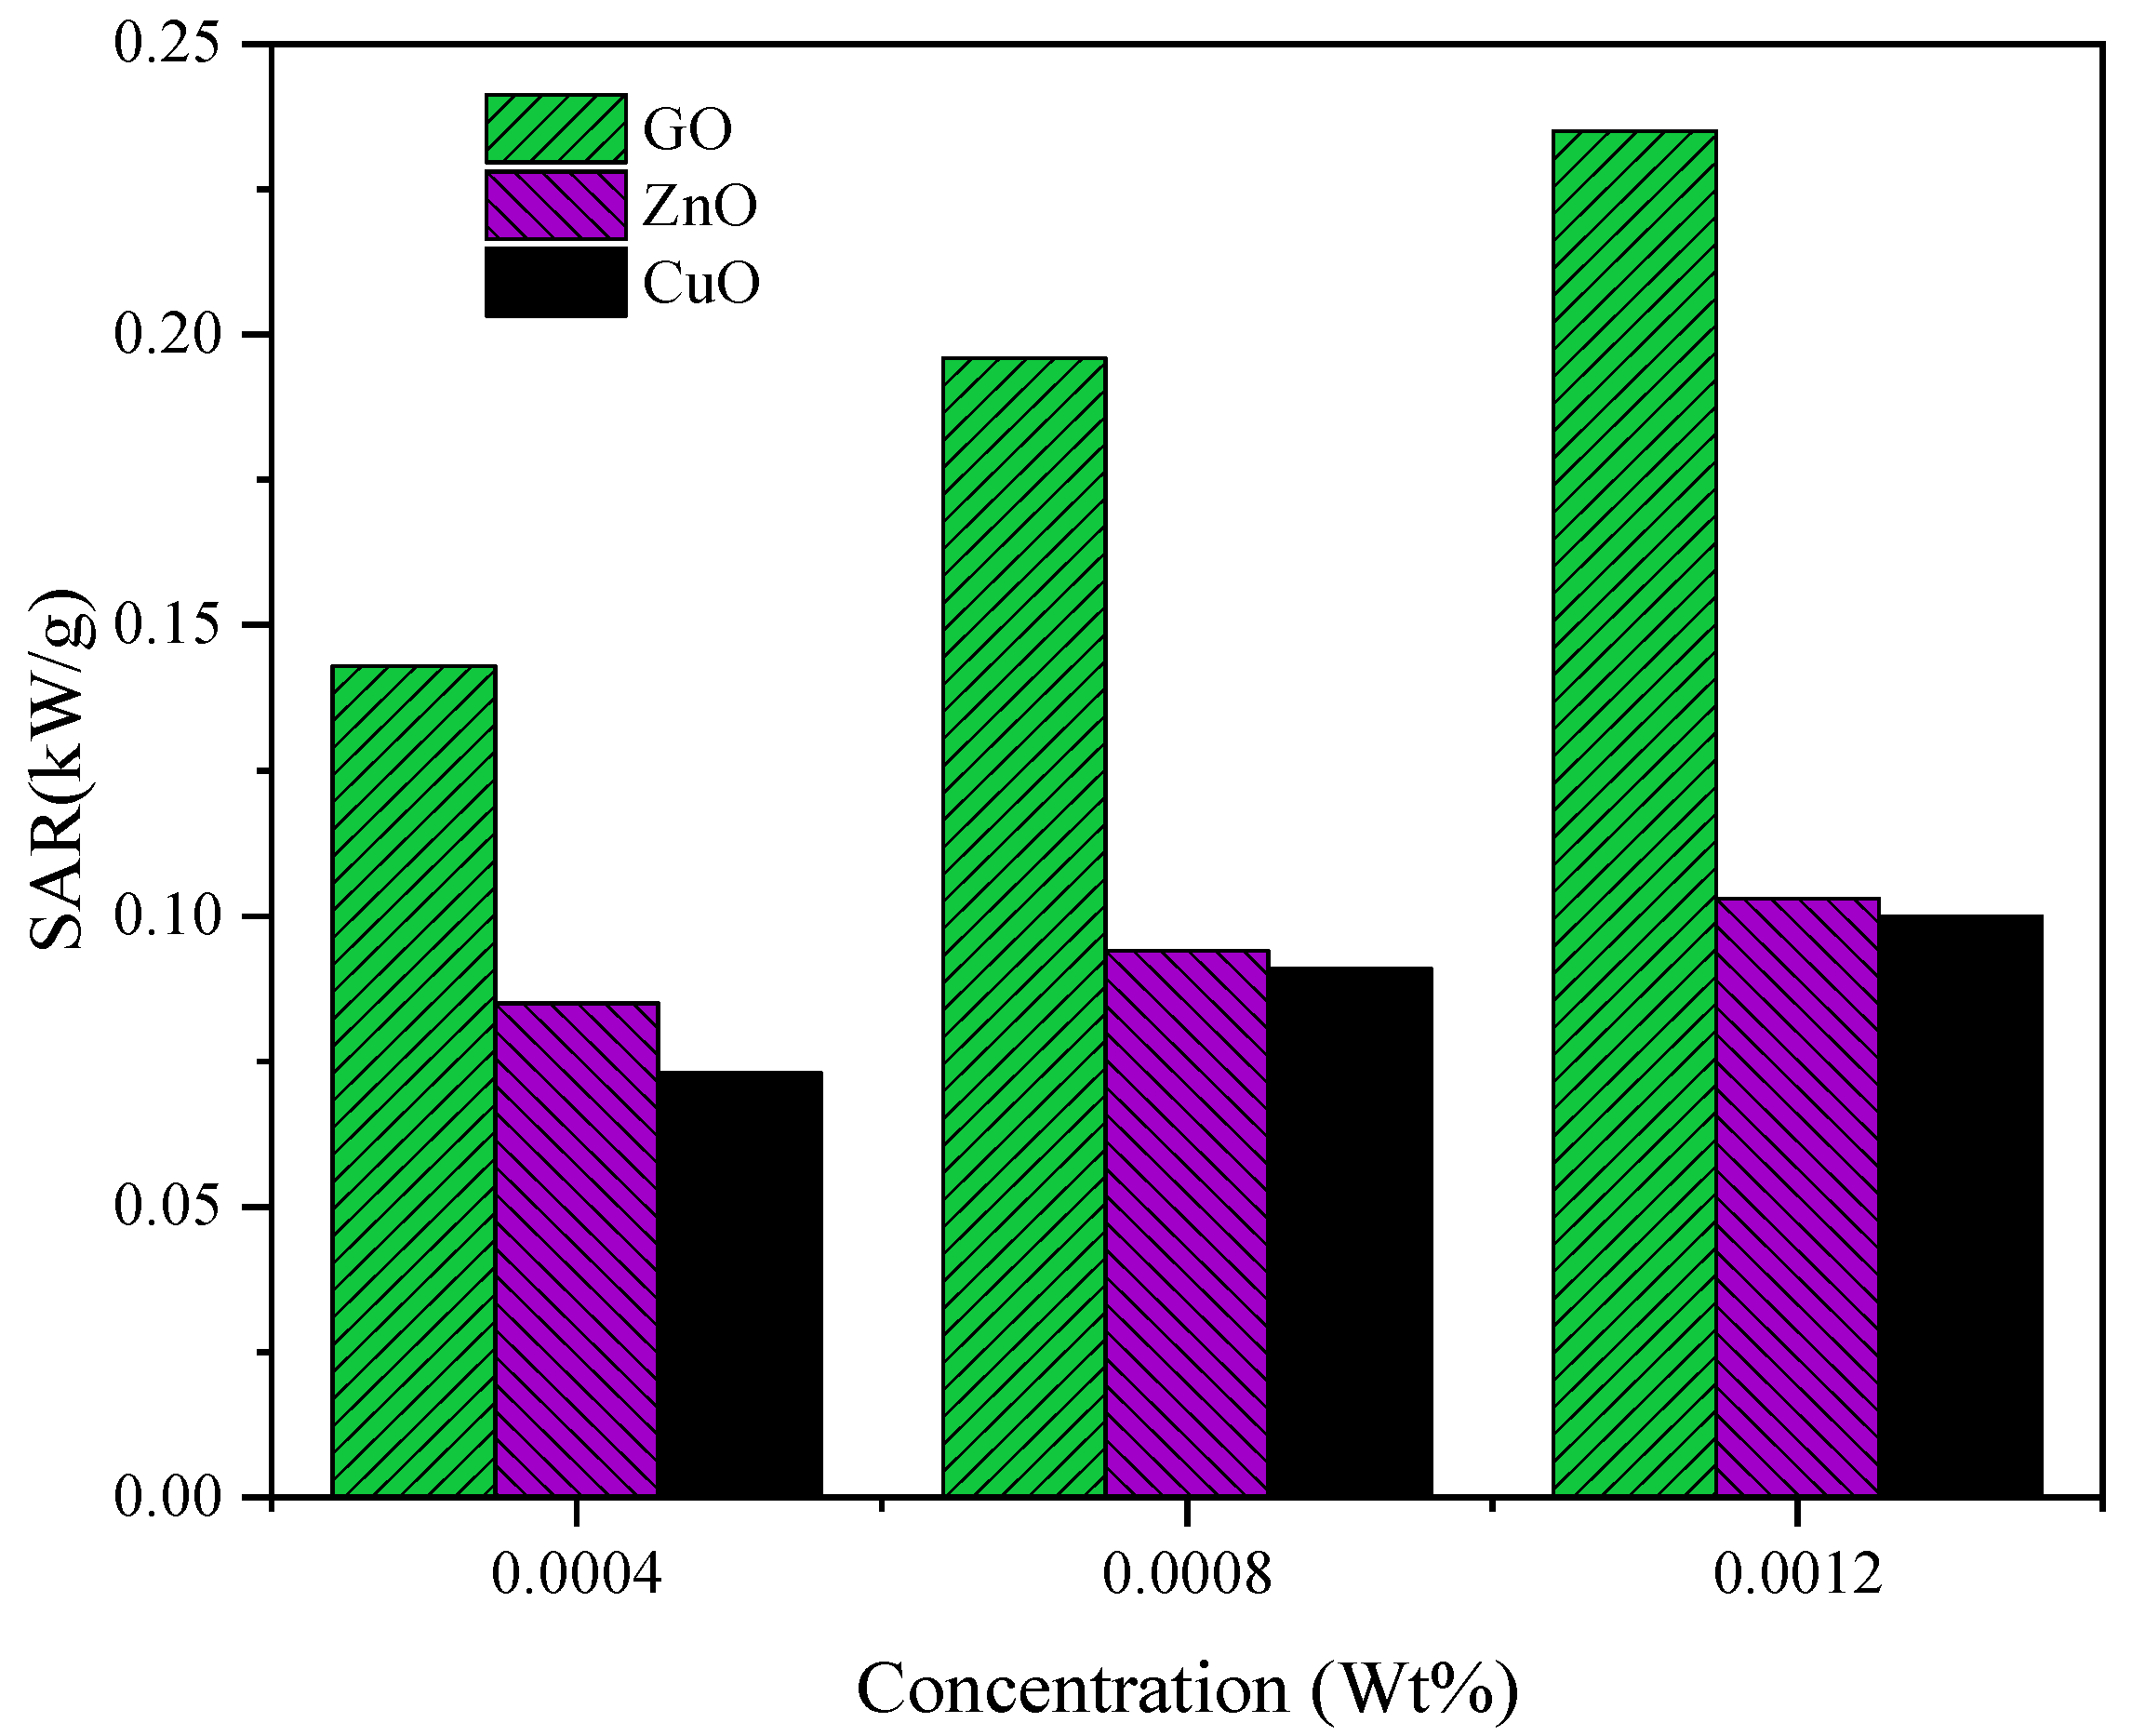
3.5. Specific Absorption Rate (SAR)

The specific absorption rate is conventionally defined as energy absorbed per unit mass of nanoparticles. It is an important factor that is also used to calculate the photothermal efficiency of different types of nanofluids. It can be calculated in (kW/g) using Equation (1) [46].
SAR = ( C W m W ) ( Δ T n Δ T w ) + L V m l o s s 1000 Δ t m n
In Equation (2), Cw and mw symbolise the specific heat capacity (J/kgK) and mass (kg) of base fluid (water), respectively. Lv is the latent heat of vaporization (J/kg) at a pressure of 1 bar. ΔTn and ΔTw show the change in nanofluid temperature and base fluid (water) in time Δt, respectively. Figure 13 and Figure 14 show the specific absorption rate (SAR) of binary nanofluids (ZnO–GO and CuO–GO) and individual nanofluids (ZnO, CuO, and GO). Comparing all the nanofluids used, pure GO nanofluid has the maximum specific absorption rate (SAR) at different wt % concentration.

4. Conclusions

The collection of direct solar absorption-based nanofluids is an encouraging technique for solar power generation systems. Many studies on different types of nanoparticles for solar energy state that a comparison for photothermal performance characteristics of various nanofluids at the same experimental conditions is much needed. In direct absorption solar collectors (DASCs), the photothermal conversion efficiency of three nanomaterials (GO, ZnO, and CuO) and their composites (GO–CuO and GO–ZnO) is experimentally examined under natural sun. The contribution of optical absorption, changes in fluid volume temperature, and reduction in the mass of the nanofluids are disclosed in the perspective of their photothermal conversion efficiencies. Experimental outcomes describe that all nanofluids and their composites have higher solar energy absorption, higher temperature gain, and higher mass loss than base fluid (DI water), and GO nanofluid proved to be the best because of its strong solar absorptivity nature. A 46.61% enhancement in photothermal conversion efficiency of GO nanofluids is accomplished within experimental domain at 0.0012 wt % concentration. It is quantitatively observed during experimentation that the addition of a small amount of nanoparticle in the base fluid can significantly increase and improve its photothermal performance. Compared with the base fluid, the growing tendency and order of nanofluids with respect to photothermal performance in this experimentation is GO, GO–ZnO, GO–CuO, ZnO, and CuO.

Author Contributions

Conceptualization, A.S., M.F. and M.A.; methodology, M.A.S. and S.N.; validation, M.A.M. and S.N.; formal analysis, M.A. and A.S.; investigation, M.E.M.S. and E.P.B.F.; resources, A.P. and M.I.; data curation, Q.A.; writing—original draft preparation, A.S. and M.A.; writing—review and editing, S.A., A.M.E.-S. and A.P.; visualization, Q.A.; supervision, M.A. and M.F.; project administration, M.A., M.F. and A.P.; funding acquisition, S.A. and A.M.E.-S. All authors have read and agreed to the published version of the manuscript.

Funding

This research was funded by King Saud University, RSP-2020/133.

Acknowledgments

The authors extend their appreciation to King Saud University for funding this work through Researchers supporting project number (RSP-2020/133), King Saud University, Riyadh, Saudi Arabia.

Conflicts of Interest

The authors declare no conflict of interest.

References

  1. Saçık, S.Y.; Yokus, N.; Alagöz, M.; Yokuş, T. Optimum Renewable Energy Investment Planning in Terms of Current Deficit: Turkey Model. Energies 2020, 13, 1509. [Google Scholar] [CrossRef] [Green Version]
  2. Bhalla, V.; Khullar, V.; Tyagi, H. Experimental investigation of photo-thermal analysis of blended nanoparticles (Al2O3/Co3O4) for direct absorption solar thermal collector. Renew. Energy 2018, 123, 616–626. [Google Scholar] [CrossRef]
  3. Zeren, F.; Akkuş, H.T. The relationship between renewable energy consumption and trade openness: New evidence from emerging economies. Renew. Energy 2020, 147, 322–329. [Google Scholar] [CrossRef]
  4. Lu, Y.; Alghassab, M.; Alvarez-Alvarado, M.; Gunduz, H.; Khan, Z.A.; Imran, M. Optimal Distribution of Renewable Energy Systems Considering Aging and Long-Term Weather Effect in Net-Zero Energy Building Design. Sustainability 2020, 12, 5570. [Google Scholar] [CrossRef]
  5. Hussain, M.I.; Ménézo, C.; Kim, J.-T. Advances in solar thermal harvesting technology based on surface solar absorption collectors: A review. Sol. Energy Mater. Sol. Cells 2018, 187, 123–139. [Google Scholar] [CrossRef]
  6. Kasaeian, A.; Daneshazarian, R.; Pourfayaz, F. Comparative study of different nanofluids applied in a trough collector with glass-glass absorber tube. J. Mol. Liq. 2017, 234, 315–323. [Google Scholar] [CrossRef]
  7. Khullar, V.; Bhalla, V.; Tyagi, H. Potential Heat Transfer Fluids (Nanofluids) for Direct Volumetric Absorption-Based Solar Thermal Systems. J. Therm. Sci. Eng. Appl. 2017, 10, 011009. [Google Scholar] [CrossRef]
  8. Wang, L.; Zhu, G.; Wang, M.; Yu, W.; Zeng, J.; Yu, X.; Xie, H.; Li, Q. Dual plasmonic Au/TiN nanofluids for efficient solar photothermal conversion. Sol. Energy 2019, 184, 240–248. [Google Scholar] [CrossRef]
  9. Moon, G.-H.; Ko, R.; Joo, S.-K. Integration of Smart Grid Resources into Generation and Transmission Planning Using an Interval-Stochastic Model. Energies 2020, 13, 1843. [Google Scholar] [CrossRef]
  10. Cui, W.; Shen, Z.; Yang, J.; Wu, S.; Bai, M. Influence of nanoparticle properties on the thermal conductivity of nanofluids by molecular dynamics simulation. RSC Adv. 2014, 4, 55580–555894. [Google Scholar] [CrossRef]
  11. Amjad, M.; Gardy, J.; Hassanpour, A.; Wen, D. Novel draw solution for forward osmosis based solar desalination. Appl. Energy 2018, 230, 220–231. [Google Scholar] [CrossRef]
  12. Abdul-Ganiyu, S.; Quansah, D.A.; Ramde, E.W.; Seidu, R.; Adaramola, M.S. Investigation of Solar Photovoltaic-Thermal (PVT) and Solar Photovoltaic (PV) Performance: A Case Study in Ghana. Energies 2020, 13, 2701. [Google Scholar] [CrossRef]
  13. Vall, S.; Medrano, M.; Solé, C.; Castell, A. Combined Radiative Cooling and Solar Thermal Collection: Experimental Proof of Concept. Energies 2020, 13, 893. [Google Scholar] [CrossRef] [Green Version]
  14. Suh, J.; Yoon, M.; Jung, S. Practical Application Study for Precision Improvement Plan for Energy Storage Devices Based on Iterative Methods. Energies 2020, 13, 656. [Google Scholar] [CrossRef] [Green Version]
  15. Sang, L.; Ai, W.; Wu, Y.; Ma, C. Enhanced specific heat and thermal conductivity of ternary carbonate nanofluids with carbon nanotubes for solar power applications. Int. J. Energy Res. 2019, 44, 334–343. [Google Scholar] [CrossRef]
  16. Garg, K.; Khullar, V.; Das, S.K.; Tyagi, H. Application of Nanofluid-Based Direct Absorption Solar Collector in Once-Through Multistage Flash Desalination System. In Advances in Solar Energy Research; Springer: Berlin/Heidelberg, Germany, 2019; pp. 519–535. [Google Scholar]
  17. Jin, H.; Lin, G.; Bai, L.; Amjad, M.; Filho, E.P.B.; Wen, D. Photothermal conversion efficiency of nanofluids: An experimental and numerical study. Sol. Energy 2016, 139, 278–289. [Google Scholar] [CrossRef] [Green Version]
  18. Marcano, D.C.; Kosynkin, D.V.; Berlin, J.M.; Sinitskii, A.; Sun, Z.; Slesarev, A.; Alemany, L.B.; Lu, W.; Tour, J.M. Improved Synthesis of Graphene Oxide. ACS Nano 2010, 4, 4806–4814. [Google Scholar] [CrossRef]
  19. Mishra, P.C.; Nayak, S.K.; Mukherjee, S. Thermal conductivity of nanofluids-an extensive literature review. Int. J. Eng. Res. Technol. 2013, 2, 734–745. [Google Scholar]
  20. Alade, I.O.; Rahman, M.A.A.; Saleh, T.A. Predicting the specific heat capacity of alumina/ethylene glycol nanofluids using support vector regression model optimized with Bayesian algorithm. Sol. Energy 2019, 183, 74–82. [Google Scholar] [CrossRef]
  21. Al Shdaifat, M.Y.; Zulkifli, R.; Sopian, K.; Salih, A.A. Thermal and Hydraulic Performance of CuO/Water Nanofluids: A Review. Micromachines 2020, 11, 416. [Google Scholar] [CrossRef] [Green Version]
  22. Wang, X.; Ou, G.; Wang, N.; Wu, H. Graphene-Based Recyclable Photo-Absorbers for High-Efficiency Seawater Desalination. ACS Appl. Mater. Interfaces 2016, 8, 9194–9199. [Google Scholar] [CrossRef] [PubMed]
  23. Ahmed, F.E.; Hashaikeh, R.; Hilal, N. Solar powered desalination—Technology, energy and future outlook. Desalination 2019, 453, 54–76. [Google Scholar] [CrossRef]
  24. Palenzuela, P.; Alarcón-Padilla, D.C. Concentrating Solar Power and Desalination Plants. In Solar Resources Mapping; Springer: Berlin/Heidelberg, Germany, 2019; pp. 327–340. [Google Scholar]
  25. Amin, I.; Ali, M.E.; Bayoumi, S.; Oterkus, S.; Shawky, H.; Oterkus, E. Conceptual Design and Numerical Analysis of a Novel Floating Desalination Plant Powered by Marine Renewable Energy for Egypt. J. Mar. Sci. Eng. 2020, 8, 95. [Google Scholar] [CrossRef] [Green Version]
  26. Menbari, A.; Alemrajabi, A.A.; Ghayeb, Y. Investigation on the stability, viscosity and extinction coefficient of CuO–Al2O3/Water binary mixture nanofluid. Exp. Therm. Fluid Sci. 2016, 74, 122–129. [Google Scholar] [CrossRef]
  27. Męczyńska-Wielgosz, S.; Wojewódzka, M.; Matysiak-Kucharek, M.; Czajka, M.; Jodłowska-Jędrych, B.; Kruszewski, M.; Kapka-Skrzypczak, L. Susceptibility of HepG2 Cells to Silver Nanoparticles in Combination with other Metal/Metal Oxide Nanoparticles. Materials 2020, 13, 2221. [Google Scholar] [CrossRef]
  28. Soysal, F.; Çıplak, Z.; Getiren, B.; Gökalp, C.; Yıldız, N. Synthesis and characterization of reduced graphene oxide-iron oxide-polyaniline ternary nanocomposite and determination of its photothermal properties. Mater. Res. Bull. 2020, 124, 110763. [Google Scholar] [CrossRef]
  29. Gimeno-Furio, A.; Hernandez, L.; Navarrete, N.; Mondragón, R. Characterisation study of a thermal oil-based carbon black solar nanofluid. Renew. Energy 2019, 140, 493–500. [Google Scholar] [CrossRef]
  30. Amjad, M.; Raza, G.; Xin, Y.; Pervaiz, S.; Xu, J.; Du, X.; Wen, D. Volumetric solar heating and steam generation via gold nanofluids. Appl. Energy 2017, 206, 393–400. [Google Scholar] [CrossRef] [Green Version]
  31. Wang, X.; He, Y.; Liu, X.; Shi, L.; Zhu, J. Investigation of photothermal heating enabled by plasmonic nanofluids for direct solar steam generation. Sol. Energy 2017, 157, 35–46. [Google Scholar] [CrossRef]
  32. Filho, E.P.B.; Mendoza, O.S.H.; Beicker, C.L.L.; Menezes, A.; Wen, D. Experimental investigation of a silver nanoparticle-based direct absorption solar thermal system. Energy Convers. Manag. 2014, 84, 261–267. [Google Scholar] [CrossRef]
  33. Jeon, J.; Park, S.; Lee, B.J. Analysis on the performance of a flat-plate volumetric solar collector using blended plasmonic nanofluid. Sol. Energy 2016, 132, 247–256. [Google Scholar] [CrossRef]
  34. Cabaleiro, D.; Hamze, S.; Fal, J.; Marcos, M.A.; Estellé, P.; Żyła, G. Thermal and Physical Characterization of PEG Phase Change Materials Enhanced by Carbon-Based Nanoparticles. Nanomaterials 2020, 10, 1168. [Google Scholar] [CrossRef] [PubMed]
  35. Qu, J.; Zhang, R.; Wang, Z.; Wang, Q. Photo-thermal conversion properties of hybrid CuO-MWCNT/H2O nanofluids for direct solar thermal energy harvest. Appl. Therm. Eng. 2019, 147, 390–398. [Google Scholar] [CrossRef]
  36. Xiao, X.; Jia, H.; Wen, D.; Zhao, X. Thermal performance analysis of a solar energy storage unit encapsulated with HITEC salt/copper foam/nanoparticles composite. Energy 2020, 192, 116593. [Google Scholar] [CrossRef]
  37. Khullar, V.; Tyagi, H.; Hordy, N.; Otanicar, T.; Hewakuruppu, Y.; Modi, P.; Taylor, R.A. Harvesting solar thermal energy through nanofluid-based volumetric absorption systems. Int. J. Heat Mass Transf. 2014, 77, 377–384. [Google Scholar] [CrossRef]
  38. Hordy, N.; Rabilloud, D.; Meunier, J.-L.; Coulombe, S. High temperature and long-term stability of carbon nanotube nanofluids for direct absorption solar thermal collectors. Sol. Energy 2014, 105, 82–90. [Google Scholar] [CrossRef]
  39. Wang, Q.; Yang, H.; Pei, G.; Yang, H.; Cao, J.; Hu, M. Assessment of Performance Enhancement Potential of a High-Temperature Parabolic Trough Collector System Combining the Optimized IR-Reflectors. Appl. Sci. 2020, 10, 3744. [Google Scholar] [CrossRef]
  40. Nagarajan, P.; Subramani, J.; Suyambazhahan, S.; Sathyamurthy, R. Nanofluids for Solar Collector Applications: A Review. Energy Procedia 2014, 61, 2416–2434. [Google Scholar] [CrossRef] [Green Version]
  41. Mehrali, M.; Ghatkesar, M.K.; Pecnik, R. Full-spectrum volumetric solar thermal conversion via graphene/silver hybrid plasmonic nanofluids. Appl. Energy 2018, 224, 103–115. [Google Scholar] [CrossRef]
  42. Campos, C.; Vasco, D.A.; Angulo, C.; Burdiles, P.A.; Cardemil, J.M.; Palza, H. About the relevance of particle shape and graphene oxide on the behavior of direct absorption solar collectors using metal based nanofluids under different radiation intensities. Energy Convers. Manag. 2019, 181, 247–257. [Google Scholar] [CrossRef]
  43. Chen, M.; He, Y.; Ye, Q.; Wang, X.; Hu, Y. Shape-dependent solar thermal conversion properties of plasmonic Au nanoparticles under different light filter conditions. Sol. Energy 2019, 182, 340–347. [Google Scholar] [CrossRef]
  44. Chavan, S.; Babrekar, M.; More, S.; Jadhav, K. Structural and optical properties of nanocrystalline Ni–Zn ferrite thin films. J. Alloy. Compd. 2010, 507, 21–25. [Google Scholar] [CrossRef]
  45. Kumar, R.; Ali, S.A.; Mahur, A.K.; Virk, H.S.; Singh, F.; Khan, S.; Avasthi, D.K.; Prasad, R. Study of optical band gap and carbonaceous clusters in swift heavy ion irradiated polymers with UV–Vis spectroscopy. Nucl. Instrum. Methods Phys. Res. Sect. B Beam Interact. Mater. Atoms 2008, 266, 1788–1792. [Google Scholar] [CrossRef]
  46. Amjad, M.; Jin, H.; Du, X.; Wen, D. Experimental photothermal performance of nanofluids under concentrated solar flux. Sol. Energy Mater. Sol. Cells 2018, 182, 255–262. [Google Scholar] [CrossRef] [Green Version]
Figure 1. Schematic diagram of the setup used in the experiments under natural sun. TC, thermocouple.
Energies 13 04956 g001
Figure 2. UV absorption spectra of GO, ZnO, and CuO nanoparticles at 0.0004 wt % concentration.
Energies 13 04956 g002
Figure 3. UV absorption spectra of GO–CuO binary nanocomposites at 0.0004 wt % concentration.
Energies 13 04956 g003
Figure 4. UV absorption spectra of GO–ZnO binary nanocomposites at 0.0004 wt % concentrations.
Energies 13 04956 g004
Figure 5. Average change in the temperature profile of DI water base CuO, ZnO, and GO nanofluids at 0.0004 wt % concentration.
Energies 13 04956 g005
Figure 6. Average change temperature profile of DI water base binary CuO–GO nanofluids at 0.0004 wt %.
Energies 13 04956 g006
Figure 7. Average change temperature profile of DI water base binary CuO–GO nanofluids at 0.0004 wt % concentration.
Energies 13 04956 g007
Figure 8. Mass loss for a specific time duration in nanofluid of CuO, ZnO, and GO under natural sun over the period of 1800 s of DI water base nanofluids at 0.0004 wt % concentration.
Energies 13 04956 g008
Figure 9. Mass loss for a specific time duration for binary nanofluids CuO–GO under natural sun over the period of 1800 s of DI water base nanofluids at 0.0004 wt % concentration.
Energies 13 04956 g009
Figure 10. Mass loss for a specific time duration for binary nanofluids ZnO–GO under a natural sun over the period of 1800 s of DI water base nanofluids at 0.0004 wt % concentrations.
Energies 13 04956 g010
Figure 11. Photothermal conversion efficiency of CuO, ZnO, and GO nanofluids at three different wt %.
Energies 13 04956 g011
Figure 12. Photothermal conversion efficiency of binary nanofluids CuO–GO and ZnO–GO at 0.0004 wt % concentrations.
Energies 13 04956 g012
Figure 13. Specific absorption rate (SAR) of CuO, ZnO, and GO nanofluids at three different wt % concentration.
Energies 13 04956 g013
Figure 14. Specific absorption rate of binary nanofluids, ZnO–GO and CuO–GO, at 0.0004 wt % concentrations.
Energies 13 04956 g014
Table 1. Various nanofluids with different ratios of different nanoparticles. GO, graphene oxide; CuO, copper oxide; ZnO, zinc oxide.
Sr. No.Nanofluid (%)Amount of GO (g)Nanofluid Concentration (wt %)
1100% GO0.00010.0004
280%GO + 20%CuO0.000080.0004
360%GO + 40%CuO0.0000600.0004
440%GO + 60%CuO0.0000400.0004
520%GO + 80%CuO0.0000200.0004
6100%CuO0.00000.0004
780%GO + 20%ZnO0.0000800.0004
860%GO + 40%ZnO0.0000600.0004
940%GO + 60%ZnO0.0000400.0004
1020%GO + 80%ZnO0.0000200.0004
11100%ZnO0.00000.0004

