Abstract
Various types of support structures for offshore wind turbine have been developed, and concrete structures have attracted attention due to many advantages. Although many studies have been conducted on the design of the existing steel structures, information and research on the design of concrete support structures are insufficient. Therefore, in this paper, a structural analysis model of conical concrete support structure (CCSS) is established and design optimization is presented. A detailed performance evaluation and the design of prestressed concrete were performed under the marine conditions of Phase 1 test site of southwest offshore wind project in Korea. The fluid–soil–structure interaction (FSI) was applied using the added mass method and soil spring model to represent the effects of water and soil. With the result of quasi-static analysis, a post-tensioning design was implemented by applying prestressing steel, and CCSS showed sufficient rigidity. From the natural frequency analysis, CCSS has a dynamic structural stability, and, in response spectrum and time-history analyses, the CCSS was safe enough under the earthquake loads. The methods and conclusions of this study can provide a theoretical reference for the structural analysis and design of concrete support structures for offshore wind turbines.
1. Introduction
Many fixed types of support structures for offshore wind turbines have been developed. Steel monopiles and jackets are most commonly used due to their advantages associated with manufacturing and installation, but they also have several problems, such as corrosion and high costs. To overcome these problems, concrete has been used in support structures. Concrete has many advantages, such as high erosion resistance, high stiffness, good damping properties, a short installation time, and a long service life. Cost is a critical consideration when selecting the type of support structure for a given site. Concrete is more cost-efficient than steel because it has a low material cost. Referring to tender results of two projects named Middelgrunden and Nysted [1], market response in both cases very clearly showed that a concrete solution could be manufactured and installed at a lower price.
Due to the advantages of concrete, many studies have focused on concrete support structures. The first concrete gravity-based structure (GBS), called Condeep B, was built in Stavanger, Norway, in 1975 [2]. GBS was designed for the great water depths and extreme weather conditions in the North Sea. Since 1991, eleven GBSs for 5-MW offshore wind farms have been installed off the coast of Lolland, Denmark [3]. In 2009, GBSs for 5-MW offshore wind turbines were constructed in water depths of 27.5 m at Thornton Bank 1 along the coast of Vlaanderen, Belgium [4], and GBSs for 2.3-MW offshore wind turbines were installed by COWI at Red Sand 2, Denmark, where the maximum water depth is 15.0 m [5]. Currently, conceptual GBS structures for deep water areas are being studied in Europe. Vici Ventus developed a massive concrete GBS for use in water depths of 30–100 m [6]. The construction of the structure was not complicated because it uses concrete from the tower base to bottom, and this GBS was designed to use either a gravity base or a skirt pile. Esteban identified the processes and methods used in installations of the most relevant types of GBSs in the offshore wind facilities operating in Europe [7]. In 2016, Yan et al. developed novel gravity based arctic offshore structure [8]. This is a steel–concrete–steel sandwich system to resist ice loads and low temperature. Yuzhu et al. numerically analzed wave-induced poro-elastic seabed response around a hexagonal gravity-based offshore foundation [9]. The effect of isotropic and anisotropic soil permeability on the pore pressure distribution was investigated and 3D numerical analysis is performed to investigate the wave-induced soil response and liquefaction risk around a hexagonal gravity-based offshore foundation. Zhao et al. implemented stochastic dynamic analysis of an offshore wind turbine concrete suction bucket foundation by the path integration method [10]. The structure is simplified as a linear single-degree-of-freedom system and path integration method is applied to calculate joint probability density function of dynamic responses.
However, concrete GBSs are difficult to construct on the weak soil along the coast because the GBS must withstand the horizontal loads caused by its own weight. To overcome this problem, hybrid types of foundations consisting of concrete and steel have been investigated. In 2013, Kim suggested a hybrid type of foundation composed of a concrete tripod and a steel shaft and performed a preliminary analysis and design [11]. Kim suggested a new hybrid concrete support structure that is supported not only by a gravity-type foundation but also by driven piles, and this design reduces the weight of the structure [12]. In 2018, Kim et al. carried out a feasibility study of a hybrid pile-concrete foundation for a 5-MW offshore wind turbine by performing a quasi-static analysis and seismic analysis with 3D solid elements [13].
Park et al. proposed a hybrid substructure with multiple cylinders to reduce the hydrodynamic effects in the shortwave region [14]. The cylinders have different radii in the upper and lower areas, which leads to decreased wave forces.
Abdelkader suggested a hybrid structure involving a hollow steel pile connected to a precast concrete cap [15]. The structure includes monopiles with diameters of 4 and 6 m and a hybrid system with a pile diameter of 4 m attached to a concrete plate with and without ribs, and the plate diameter is 12 or 16 m. In 2016, Lee et al. studied a hybrid substructure with a concrete base-to-sleeve connection [16]. This hybrid substructure has a concrete base, multiple concrete piles, and a tower connection member, and a composite section is used to reduce the weight of the structure.
The hydrodynamic pressure and water-added mass affect the dynamic behavior of a structure in water, and it is essential to consider the fluid–soil–structure interaction (FSI) to accurately evaluate the performance of the structure. Numerous studies have focused on FSI, and different approaches have been presented. Fish et al. studied FSI using Morison’s equation and proposed a simplified method to calculate the wave forces [17]. Tao et al. considered the additional mass of moving structures in water using Morison’s equation and considered the fluid effects [18]. The added mass method of Liaw et al. is commonly used to consider the effects of the surrounding water [19]. Yang et al. proposed a new added mass calculation method called the added mass ratio method (AMRM) to reduce the errors in the simple added mass method of Liaw [20].
Although many studies have investigated the FSI of monopiles or jacket structures, few studies have considered the FSI of concrete structures. Due to the heavy weight and large projected area of the fluid, an analysis model for a concrete structure that considers FSI is needed. Lim et al. implemented FSI analysis of GBS offshore platform with partitioned coupling method [21]. This approach is to utilize the advantage of the existing numerical algorithms in solving the complex fluid and structural interactions. A previous study examined the feasibility of a 5-MW-class concrete foundation structure [13]. For the structural analysis, 3D solid elements were used, and the tendon was included in the model. The results confirm that the tensile stress generated in the concrete foundation structure can be effectively controlled by introducing prestressing in advance by applying wire strands. However, in this study, the analysis of the CCSS was performed without applying prestressing, and the design was implemented by applying strand wire to reduce the tensile stress. In 2020, Kim et al. presented an efficient analysis method of a piled concrete foundation considering FSI [22]. Three analytical parameters, the type of pile, boundary conditions, and location of stress concentration, were considered for analysis models, and it showed that consideration of piled foundation has a reasonable result and influences the natural frequency.
The existing GBS is known to be applied to shallow water depth since the deeper the water depth, the greater the diameter of structure, and this leads to increase the manufacturing cost. However, hybrid type of CCSS can be applied to deep water as it serves to connect the pile foundation and the tower by extending the upper shaft while keeping the cross section of the support structure. In addition, the trend of offshore turbines is large-capacity turbines of 15 MW [23,24], and, to secure economic efficiency according to the increase in turbine capacity, concrete materials that are advantageous in terms of cost need to be used. Thus, CCSS is a support structure that can secure economical advantage and can be applied to large-capacity turbines and deep water.
The objectives of this paper are to establish a structural analysis model of a concrete support structure for an offshore wind turbine and to optimize the design of a conical concrete support structure (CCSS) for a 3-MW-class offshore wind turbine. A CCSS is a hybrid type of concrete foundation with a conical shape and driven piles that uses steel and concrete unlike gravity-type foundations. This support structure consists of a concrete base, a steel shaft, and steel piles. The marine conditions of Phase 1 test site of southwest offshore wind project in Korea are considered, and FSI is analyzed with the added mass method and a soil spring model to consider the effects of the surrounding water and soil. A quasi-static analysis was carried out to design the CCSS, and a natural frequency analysis with an added mass was performed to investigate the dynamic behavior of the CCSS. Moreover, to evaluate the seismic behavior of the CCSS, response spectrum and time-history analyses were performed.
2. Theoretical Background
2.1. Prestressed Concrete
Prestressed concrete is defined as concrete in which internal stresses have been introduced with a magnitude and distribution to counteract the stresses resulting from a given external load to a desired degree [25]. In reinforced concrete members, the prestress is commonly introduced by tensioning the steel reinforcement.
The flow chart for the design of prestressed concrete is shown in Figure 1. The sections of the members are designed based on a quasi-static analysis. Prestressing tendons can be applied to reduce the tensile stress, and the optimized section of concrete can be designed.
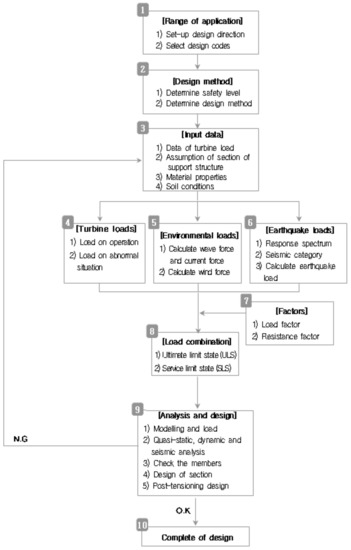
Figure 1.
Flow chart of the design process for prestressed concrete foundations.
2.2. Morison’s Equation
The wave force is calculated using the Morison equation [26]. Morison equation is the sum of an inertia force in phase with a fluid velocity and a drag force in phase with fluid acceleration. When the diameter of the circular cylinder is small compared to its length , the equation can be applied, and the wave distortion in the circular cylinder can be ignored due to this limitation. For a fixed vertical cylinder of diameter , the wave force per unit length is , and the Morison equation is as follows:
The wave force per unit length of a fixed vertical cylinder that has a diameter is expressed by Equation (1).
where denotes the fluid density and and denote the coefficient of drag and the inertia, respectively. is the horizontal fluid velocity and is the fluid acceleration, which are calculated from wave theory.
When the structure is being submerged, wave slamming is caused on the parts near the water surface. Slamming is generated by sudden retardation of a volume of fluid, and this force acts on the structure with considerable force.
The slamming force per unit length for a cylindrical structural member can be expressed by Equation (2).
where denotes the mass density of the fluid, denotes the slamming coefficient, denotes the diameter of member, and denotes the relative velocity between water and member normal to the member surface.
2.3. Added Mass Method
When a structure is located in water, the natural frequencies tend to be reduced due to the effect of the water. To quantify this effect, many researchers have proposed various methods. In 2013, the added mass ratio method (AMRM) was presented by Yang et al. [18,20]. This new added mass method simplified the existing added mass method to improve the efficiency of the added mass calculation and to easily estimate the added mass, as shown in Figure 2. The new equations for the added mass of a circular pier with a diameter D in water with depth H was determined by a parametric study, and these equations are presented in Equations (3) and (4).
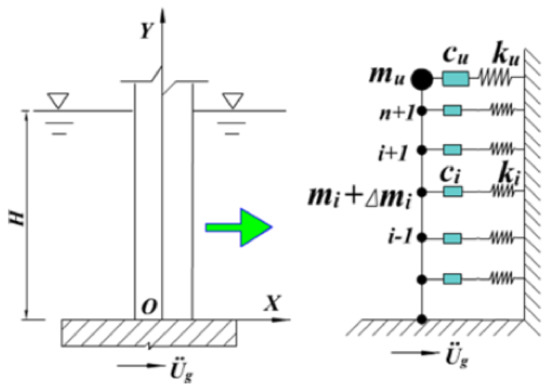
Figure 2.
FSI based on the added mass ratio method.
2.4. Soil Spring Model
The Winker model was used for the soil spring model, and the soil spring stiffnesses in the vertical and horizontal directions were calculated [27]. At any depth , the soil spring stiffness in the horizontal direction was estimated using Equation (5).
where is the distance between the springs at that depth and is the subgrade reaction modulus , which is calculated from the various methods, such as a linear distribution, constant distribution, the equation provided in CSN 73 1004, the equation given by Matlock and Reese, and the equation given by Vesic [28]. The soil spring stiffness in the vertical direction consists of the end bearing stiffness and skin friction resistance stiffness , as shown in Figure 3.
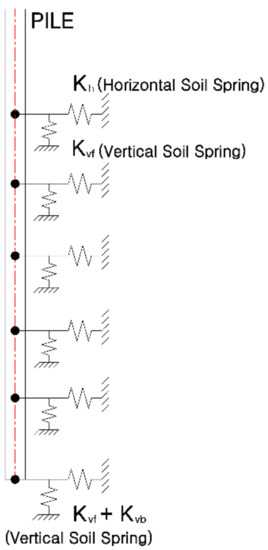
Figure 3.
Soil spring model in the horizontal and vertical directions.
The end bearing stiffness is calculated using Equation (6).
where is the pile length and and are the diameter and the nominal diameter of the pile, respectively.
The skin friction resistance stiffness is calculated using Equation (7) [29].
where is the elastic modulus, is the ratio of the pile, and is the soil–pile stiffness ratio. For the total soil spring stiffness in the vertical direction, the end bearing stiffness and the skin friction resistance stiffness are combined.
3. MW-Class Conical Concrete Support Structure
3.1. CCSS Model
In Korea, several offshore wind farm construction projects have been implemented, and more projects will be developed for large wind farms. The offshore area of Korea contains up to 58 m of relatively weak soil layers, which prevents the use of conventional GBSs. Thus, CCSSs with pile foundations can be considered for this area. The marine conditions of Phase 1 test site of southwest offshore wind project in Korea shown in Figure 4 were considered for the analysis of the CCSS. At the selected site, from 2018 to 2019, the track record was secured under state-led, and 20 wind turbine systems have been operating since 2019. Figure 4 shows national wind distribution over 5 m/s per year in Korea and wind distribution in the selected site shows more than 60%. The conditions at this site are presented in Table 1. The water depth is 17.73 m, and the maximum wave height and period are 13.76 m and 12.42 s, respectively, for the extreme wave conditions with a recurrence period of 50 years.
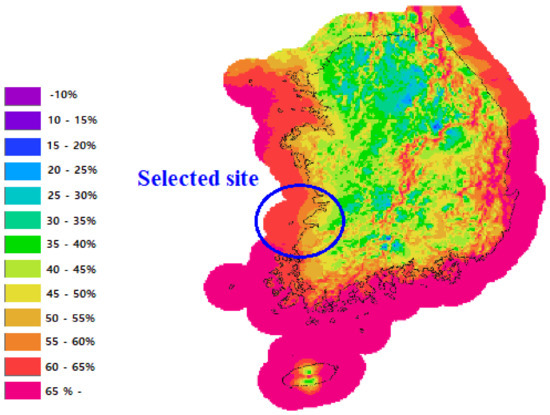
Figure 4.
Selected site of southwest coast in Korea [30].

Table 1.
Marine conditions in Korea.
The dimensions of the CCSS are shown in Figure 5, and the material properties are presented in Table 2. Due to the use of concrete, the heavy weight of the structure causes a problem with barge transportation from the fabrication yard to the installation site. To solve this problem, the CCSS consists of a conical concrete structure and a steel shaft, which reduces the weight of the structure. The shaft that connects the concrete interface to the tower or platform is made of steel, and the shaft allows the position of the platform to be adjusted at different depths. The concrete part of the CCSS consists of three parts, including interface, cone, and sleeve. A large diameter RCD pile was applied considering the weak soil at depth.
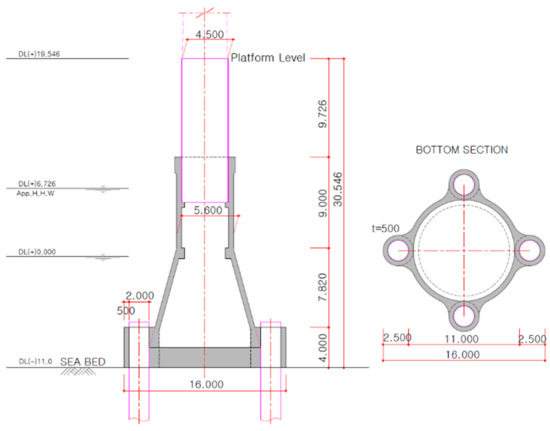
Figure 5.
Dimensions of the CCSS.
Table 2.
Material properties.
The shaft has a diameter of 4.5 m, which is the same as the diameter of the tower bottom and allows the load of the tower to be transferred to the shaft. The concrete base is 0.75 m thick, and the part connecting the concrete section to the shaft has a diameter of 6.0 m to consider the tendon anchorage. RCD (reverse circulation drilling) piles with a diameter of 2.0 m are used, and the concrete sleeve and pile are connected by grout to ensure the verticality of the pile and the shear resistance. During the production of the CCSS, a concrete formwork is required, and many CCSSs can be manufactured with one formwork. This leads the reduction of production cost as the number of CCSSs increases. The concretes used for the structure and grout have design strengths of 45 and 40 MPa, respectively, and the steel used for the tower, shaft, and pile sleeve has an elastic modulus of 210,000 MPa.
For the structural analysis of the CCSS, the modeling of the structure was performed with the general-purpose structural analysis software MIDAS Civil, which is widely used for structural design [31]. The model is shown in Figure 6. The shaft and concrete base were modeled by frame elements, and the piles and concrete sleeve were also modeled by frame elements to present the behavior of the CCSS due to the effects of the piles. The concrete foundation, pile, and sleeve need to be connected with the efficient connection method, and, by using rigid links, the four piles were connected with the pile sleeve and concrete foundation. The self-weight of the concrete base is 771 tons and that of the entire structure, including the shaft, is 1259 tons.
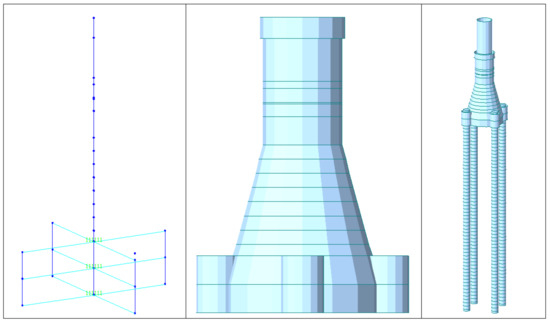
Figure 6.
Model of the CCSS.
3.2. Fluid–Soil Interaction Model
The soil was modeled as an elastic foundation with vertical and horizontal elastic springs, and the spring stiffnesses for each soil layer in the vertical and horizontal directions were calculated according to Table 3 and Equations (4)–(6) and are shown in Table 4. To consider the effect of the water surrounding the CCSS, added masses were calculated using Equations (2) and (3). The total added mass was 578,496 kg, and this was applied to the parts of the CCSS below the water surface.
Table 3.
Soil strata on offshore in Korea.
Table 4.
Horizontal and vertical spring stiffnesses.
3.3. Turbine Model
A 3-MW reference wind turbine was used for the offshore wind turbine [14]. The specifications of the rotor, nacelle, and blades are presented in Table 5.
Table 5.
Specifications of the WinDS3000 turbine.
Based on the pitch angle, wind speed, and deflections of the blade and tower, the bending moments and torques of the wind turbine are originally generated from nonlinearities. The wind forces and moments on the turbine were determined from the wind speed, which was quasi-statically applied. Due to the difficulties in obtaining the turbine properties, the thrust was estimated, and it was applied to the tower top or tower bottom for the analysis and the preliminary design. In this study, a 3-MW-class turbine model was used and was applied at the top of the shaft with point loads of the twelve load cases according to the IEC design code in Table 6.
Table 6.
Design load cases according to the IEC design code.
3.4. Load Combinations
A load combination is required for the quasi-static analysis for the design of the CCSS. To apply the wave force to the CCSS, the appropriate wave theory was used according to the application of wave theory in the API design code [32]. Based on the marine conditions, and were 0.009 and 0.012, respectively, where is the wave height, is the water depth, and g is the gravitational acceleration. The intersection points of and is in the region of the wave theory of the ninth-order stream function. Thus, the wave force based on the stream function wave theory [33] was applied with the wave pressure with the Morison equation.
To evaluate the behavior of the CCSS, the loads were applied with the combinations of self-weight, turbine load, wave load, current load, and wind load, as shown in Figure 7. All of the loads were combined in ULS (ultimate limit state) and SLS (service limit state). For design by ULS, the environmental load effect was taken as the 98% quantile in the distribution of the annual maximum environmental load effect. For the load effect, return period is 50 years, and associated probability of exceedance is 0.02. For load factor of ULS, load factors of permanent load and variable functional load are taken as 1.0, environmental load is taken as 1.35, and deformation load is taken as 1.0. For analysis of SLS, the load factor for all load categories is 1.0. Twelve load cases were defined for the different design conditions according to the IEC design code presented in Table 6 [34]. DLC6.1ab, DLC6.2da, DLC6.2ka, DLC6.2fb, DLC6.2kb, and DLC6.2db are parked and idling conditions; DLC2.2cc and DLC2.3bc are power generation and fault conditions; DLC1.4af and DLC1.3a are power production conditions; DLC3a is a parked and fault condition; and DLC8.1al represents transport, assembly, maintenance, and repair.
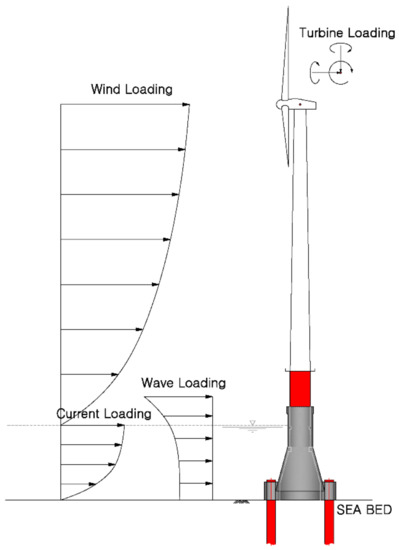
Figure 7.
Load application to the support structure model.
4. Structural Analysis and Design
4.1. Quasi-Static Analysis
The displacements and stresses of the CCSS were examined under quasi-static loads. The maximum displacement was 0.033 m, and it occurred at the top of the CCSS in DCL1.3ca3, as shown in Figure 8 and Figure 9. To evaluate whether the CCSS is safe or not, the maximum displacement was compared with the limiting deflection value from the DNV design standard [35]. The limiting value for vertical deflections in the design standard is L/100 for cantilever beams with a length L. Since the total length of the CCSS is 30.546 m, the limiting value is 0.3055 m. The maximum displacement is substantially smaller than the limiting value of 0.3055 m; therefore, it can be concluded that the CCSS is safe with regard to the displacement.
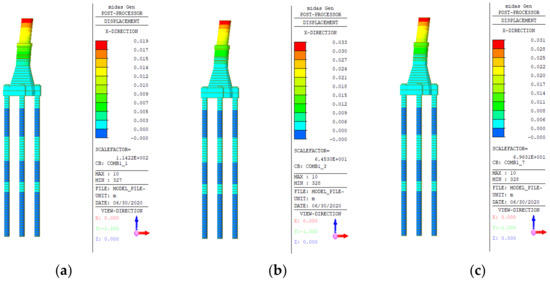
Figure 8.
Deformations of the CCSS for the load cases (unit = m): (a) DLC6.1ab; (b) DLC6.2da; and (c) DLC6.2fb.
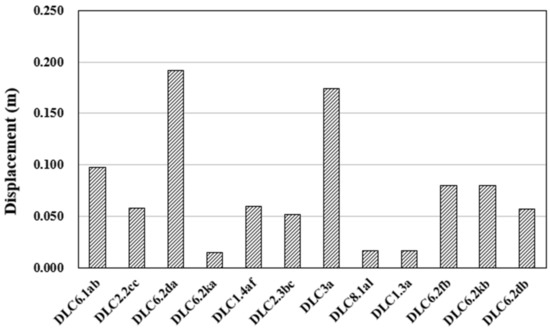
Figure 9.
Maximum displacements in each load case.
To evaluate the stresses in the steel shaft and pile sleeve, the maximum stresses were compared with the allowable stress , where is the yield strength of steel (250 MPa); therefore, the allowable stress is 150 MPa. Figure 10 shows the maximum stresses in each load case. The largest value occurred in DCL1.3ca3. The shaft and pile sleeve have the maximum stresses of 61.6 and 7.06 MPa, respectively, which are located at the center of each. Therefore, the steel parts are safe because the maximum stresses do not exceed the allowable stress of 150 MPa.
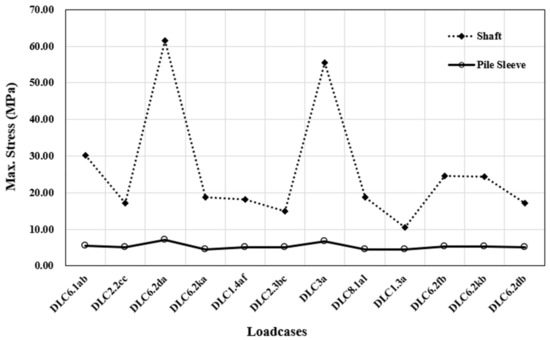
Figure 10.
Maximum stresses of the steel components in each load case.
To evaluate the concrete base, the maximum stresses are compared with the allowable stresses in tension and compression. The maximum allowable compressive and tensile stresses are and , respectively, according to KCI design code [36]. Here, denotes the design compressive strength. Because of the concrete is 45 MPa, the allowable compressive stress is 27 MPa, and the allowable tensile stress is 4226 MPa.
The stress distributions of the concrete parts in some of the load cases are shown in Figure 11. Figure 12 shows the maximum stresses in the concrete sleeve (CS) and tapered section (TS). The compressive stresses in the TS are greater than those in the CS in all load cases, and the tensile stresses in the TS are greater than those in the CS except in DLC1.4aa and DLC1.3ea3. This implies that the concrete sleeve needs to be modeled to evaluate the CCSS, and the detailed analysis and design need to be considered for further study. The maximum compressive and tensile stresses are 12.026 and 9.249 MPa, respectively, in DLC1.3ca3. The maximum compressive stress does not exceed the allowable compressive stress, but the maximum tensile stress exceeds the allowable tensile stress. To reduce the tensile stress to less than the allowable value, prestressing steel can be applied [37]. A post-tensioning design is implemented in Section 4.5.
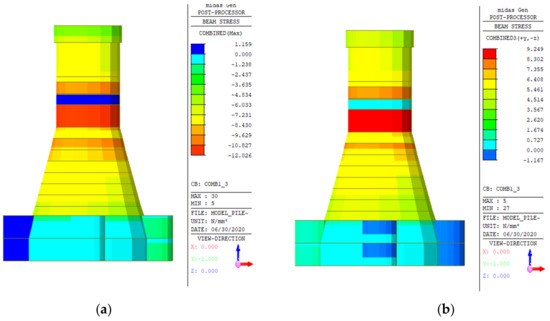
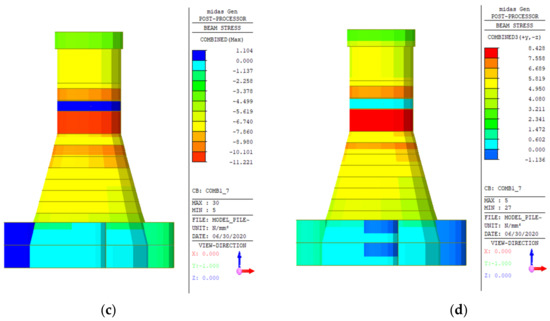
Figure 11.
Stress distributions in the concrete parts (unit = MPa): (a) maximum compression in DLC6.2da; (b) maximum tension in DLC6.2da; (c) maximum compression in DLC6.2fd; and (d) maximum tension in DLC6.2fd.
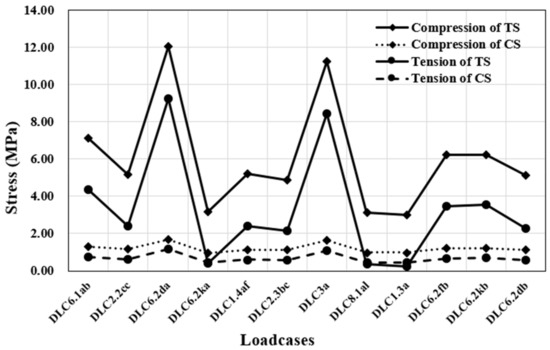
Figure 12.
Maximum stresses in the concrete parts in each load case.
4.2. Evaluation of the Pile
Deflections and stresses occur in the piles due to the loads acting on the CCSS. Accordingly, the evaluation of the bearing capacities of the piles is important, and the maximum deflections, rotation angles, end bearing and pulling capacities of the piles were calculated. According to the DNV design code and the Upwind final report, the deflection and rotation angle of the pile at the seabed level should be less than 0.1 m and 0.5 deg, respectively [35,38]. The maximum deflections and rotation angles in the load cases are presented in Table 7, and the maximum values are 0.0014 m and 0.0111 deg, respectively, in DLC1.3ca3. These are less than the allowable values; therefore, the piles are safe with regard to the deflection and rotation angle.
Table 7.
Maximum deflections and rotation angles of the piles at the mud line.
Depending on the soil conditions where the structure is installed, the allowable bearing and pullout capacities may vary, and these capacities are calculated by dividing the ultimate bearing capacities by the safety factor of 1.5 that is recommended by the API design standard [32]. The ultimate bearing capacities of the end bearing and pulling are 1,423,481 and 1,407,101 kN, respectively, and the allowable capacities are 948,988 and 938,067 kN, respectively.
Table 8 shows the compressive and tensile forces at the tops of the piles; the maximum values are 8,007 kN and 17,961 kN, respectively, in DLC1.3ca3. The allowable capacities are greater than the forces at the tops of the piles. Therefore, the piles have sufficient pulling and end bearing capacities for the soil conditions and applied load.
Table 8.
Allowable capacities and loads of the piles.
4.3. Natural Frequency Analysis
The dynamic responses of the CCSS were evaluated based on the natural frequency analysis. The masses of the tower and turbine were considered as added masses, as presented in Table 5, and the effect of the surrounding water was applied as an added mass calculated using Equations (2) and (3). The design ranges for the fundamental frequencies of the support structure (Figure 13) were necessary to evaluate the CCSS. The first natural frequency of the CCSS must not be in the ranges of the rotor frequency or the blade passing frequency to avoid resonance because this resonance induces large displacements of the structure. Table 9 shows the frequencies and periods, and the first four eigenmode shapes are presented in Figure 14. Because more than two modes do not occur in a real structure, the first natural frequency is evaluated.
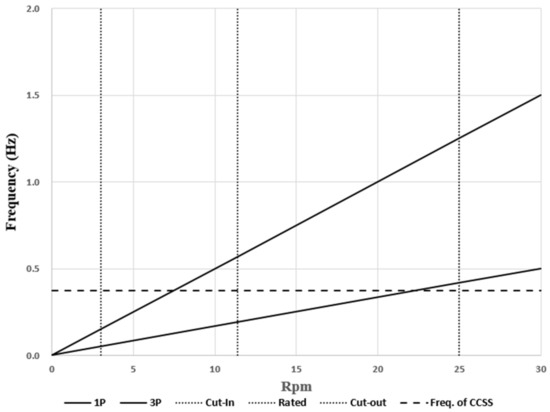
Figure 13.
Design ranges for the fundamental frequencies of the support structure with the WinDS3000 turbine.
Table 9.
Natural frequencies and periods.
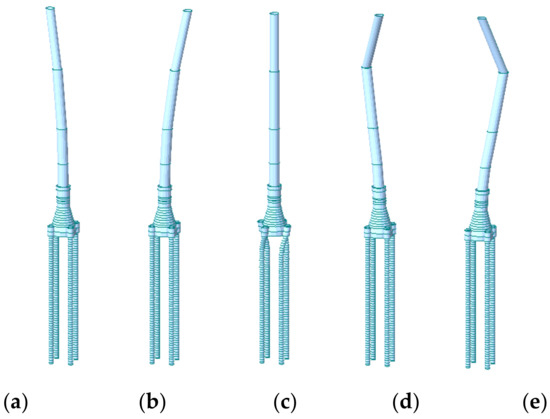
Figure 14.
First five eigenmode shapes: (a) first mode; (b) second mode; (c) third mode; (d) fourth mode; and (e) fifth mode.
The first natural frequency of the CCSS was 0.3 Hz, and this was between the ranges of the rotor frequency and the blade passing frequency. Generally, the first natural frequencies of jacket and tripod support structures are in this range. Thus, the dynamic responses of the CCSS are similar to those of jacket and tripod support structures.
4.4. Response Spectrum Analysis for Seismic Evaluation
The response spectrum curve of ISO standard was used for the response spectrum analysis [39]. The 5% damped spectral response accelerations ( and ) for the southwest coast of Korea are 0.05 g for 1.0 s oscillator periods and 0.15 g for 0.2 s oscillator periods. For deep pile foundations, the site coefficients and are 1.0 and 1.8, respectively, for Class E sites, where the soil profile ranges from soft soil to firm soil. From the site coefficients and the spectral response accelerations, a spectrum curve is plotted in Figure 15.
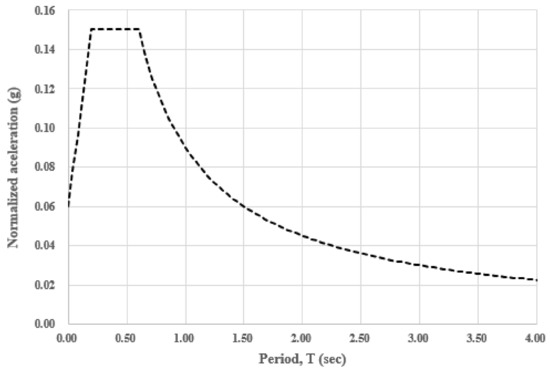
Figure 15.
Response spectrum curve.
The results of the analysis show that the maximum displacement is 0.102 m at the top of the shaft, which is small compared to the limiting displacement of 0.349 m from the DNV standard. The maximum stress on the concrete base is 5.719 MPa, which is smaller than the allowable stress of 27.00 MPa.
4.5. Time-History Analysis for Seismic Evaluation
To evaluate the dynamic response of the CCSS over time, a time-history analysis was carried out using the mode-superposition method. The Pohang earthquake in Korea was used for the earthquake time history, and a maximum acceleration of 0.0173 g was used, as shown in Figure 16. The El Centro (1940) earthquake was also considered as in Lee [40], and the maximum acceleration was adjusted to 0.05 g, as shown in Figure 17.
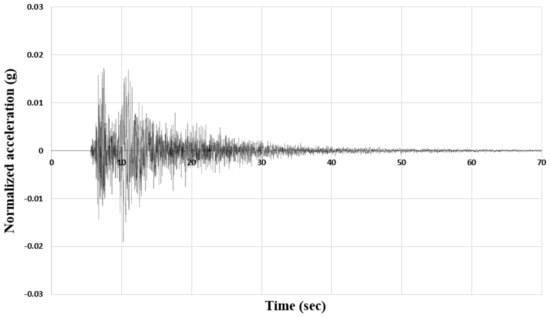
Figure 16.
Normalized acceleration of the Pohang earthquake.
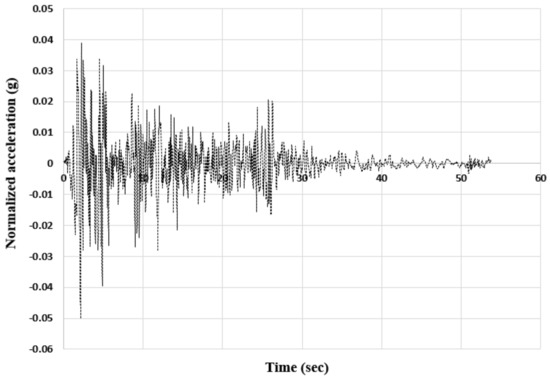
Figure 17.
Normalized acceleration of the El Centro earthquake.
The maximum displacements at the top of the structure, the taper section, the concrete cone, and the concrete sleeve over time are plotted in Figure 18. The maximum displacement of 0.009 m occurs at the top of the structure at 17.0 s. This value does not exceed the limiting displacement of 0.3055 m from DNV standard. The maximum stresses on the concrete base over time are shown in Figure 19. A maximum stress of 0.758 MPa occurs at the top of the structure at 14.0 s, and this value is smaller than the allowable stress of 27.00 MPa. The maximum stress caused by the El Centro earthquake is 4.385 MPa at 7.0 s, which is also smaller than the allowable stress. The result from the El Centro earthquake is greater than that from the Pohang earthquake due to the greater acceleration at each time. Consequently, the CCSS is safe under the applied loads of the Pohang and El Centro earthquakes.
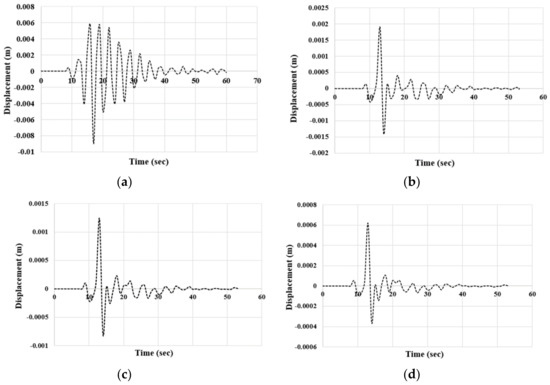
Figure 18.
Maximum displacements over time from the Pohang earthquake: (a) top of structure; (b) taper section; (c) concrete cone; and (d) concrete sleeve.
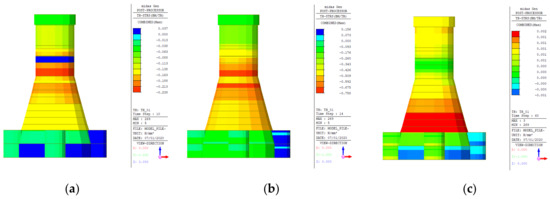
Figure 19.
Maximum stresses in the concrete base over time caused by the Pohang earthquake: (a) 10 s; (b) 14 s; and (c) 60 s.
4.6. Post-Tensioning Design
From the results of previous analysis, it is shown that prestressing steel needs to be applied to reduce the tensile stress of CCSS. From the Korean industrial standards KS D 7002 [41], prestressing steel was chosen, and it has the ultimate strength () of 1900 MPa and yield strength () of 1600 MPa. Nineteen SWPC7B prestressing strands were considered, with a diameter of about 15 mm and low relaxation. Total nominal cross-sectional area () of prestressing steel is 138.700 mm2. According to the outer and inner diameters of the structure, the number of tendons and arrangement must be decided. Thirty tendons were used by considering the section area of top structure is 8.01e + 06 mm2, and the arrangement of tendon is presented in Figure 20.
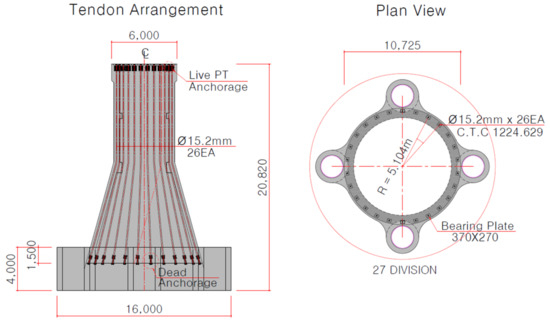
Figure 20.
Arrangement of prestressed tendons.
The procedure to calculate the prestressing force and effective stress are presented in Table 10. To calculate the force of 1 strand, 1368 MPa of the ultimate strength of 72%, was considered. From this strength and the number of strands and tendons, the total stress of 30 tendons was calculated as 11.702 MPa. Finally, the effective stress was calculated as 9.36 MPa by considering a 20% loss of the prestressing. Using this stress value, the total compressive and tensile stresses of CCSS after applying the prestressing steel could be calculated. These total stresses were evaluated by comparing them with the allowable compressive and tensile stresses. The quasi-static analysis showed that the maximum compressive were 12.03 MPa and tensile stresses were 9.25 MPa. Therefore, the total compressive and tensile stresses could be calculated, as shown in Figure 21. Note that the maximum tensile stress changed to a compressive stress because the effective stress of 9.36 MPa was greater than the stress of 9.25 MPa. Consequently, the results of the evaluation show that the total stresses of CCSS after applying the prestressing steel are safe.
Table 10.
Prestressing force.
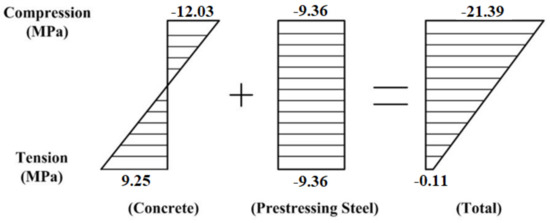
Figure 21.
Total stress on CCSS.
5. Conclusions
This paper presents an analysis model and design optimization for a CCSS. A structural analysis model of the CCSS that considered FSI was established from the dynamic analysis. The design optimization was performed based on a flow chart of the design process for prestressed concrete foundations.
The marine conditions of Phase 1 test site of southwest offshore wind project in Korea and a 3-MW-class offshore wind turbine were considered, and FSI was applied using the added mass method and a soil spring model to take into account for the effects of the surrounding water and soil.
The quasi-static analysis showed that the CCSS has sufficient rigidity because the maximum displacements are smaller than the allowable values. The results of the natural frequency analysis revealed the importance of dynamic structural stability, with particular attention being given to the resonance. The natural frequency of the CCSS was in a safe range to avoid a resonance, indicating that the CCSS has superior dynamic behavior. Through a response spectrum analysis and time-history analysis, the CCSS was found to be sufficiently safe under the applied earthquake loads.
To reduce the tensile stress in the CCSS, which exceeded the allowable stress, a post-tensioning design was implemented by applying prestressing steel. The results confirm that the CCSS with the optimized section can attain structural stability through the prestressed concrete design.
Consequently, the results show that the CCSS is sufficiently safe under the extreme loads of the marine conditions along the southwest coast of Korea. The methods and conclusions of this study provide a theoretical reference for the structural analysis and design of concrete support structures for offshore wind turbines.
Author Contributions
Conceptualization, H.-G.K; methodology, H.-G.K. and B.-J.K.; data curation, H.-G.K. and B.-J.K.; writing—original draft preparation, H.-G.K. and B.-J.K; writing—review and editing, H.-G.K.; supervision, H.-G.K and B.-J.K.; All authors have read and agreed to the published version of the manuscript.
Funding
This research received no external funding.
Conflicts of Interest
The authors declare no conflict of interest.
References
- Vølund, P. Concrete is the future for offshore foundations. Wind Eng. 2005, 29, 531–563. [Google Scholar] [CrossRef]
- Chakrabarti, S. Handbook of Offshore Engineering; 2-Volume Set; Elsevier: Amsterdam, The Netherlands, 2005. [Google Scholar]
- Nikolaos, N. Deep Water Offshore Wind Technologies. Ph.D. Thesis, University of Strathclyde, Glasgow, UK, September 2004. [Google Scholar]
- Peire, K.; Nonneman, H.; Bosschem, E. Gravity base foundations for the thornton bank offshore wind farm. Terra Aqua 2009, 115, 19–29. [Google Scholar]
- COWI. Gravity Base Foundation for Red Sand2; COWI Project: Lyngby, Denmark, 2010. [Google Scholar]
- Vici Ventus. Offshore Wind Turbines: Concrete Foundations; Vici Ventus: Lysaker, Norway, 2010. [Google Scholar]
- Esteban, M.D.; Couñago, B.; López-Gutiérrez, J.S.; Negro, V.; Vellisco, F. Gravity-based support structures for offshore wind turbine generators: Review of the installation process. Ocean Eng. 2015, 110, 281–291. [Google Scholar] [CrossRef]
- Yan, J.B.; Liu, X.M.; Liew, J.R.; Qian, X.; Zhang, M.H. Steel–concrete–steel sandwich system in Arctic offshore structure: Materials, experiments, and design. Mater. Des. 2016, 91, 111–121. [Google Scholar] [CrossRef]
- Li, Y.; Ong, M.C.; Tang, T. Numerical analysis of wave-induced poro-elastic seabed response around a hexagonal gravity-based offshore foundation. Coast. Eng. 2018, 136, 81–95. [Google Scholar] [CrossRef]
- Zhao, Y.; Lian, J.; Lian, C.; Dong, X.; Wang, H.; Liu, C.; Wang, P. Stochastic Dynamic Analysis of an Offshore Wind Turbine Structure by the Path Integration Method. Energies 2019, 12, 3051. [Google Scholar] [CrossRef]
- Kim, H.G. A study on the static and dynamic behaviors for hybrid support structure of offshore wind turbines. Ph.D. Thesis, Konkuk University, Seoul, Korea, August 2013. [Google Scholar]
- Kim, H.G.; Kim, B.J.; Kim, K.D. New development of hybrid concrete support structure with driven piles for offshore wind turbines. J. Korean Soc. Steel Constr. 2013, 25, 307–320. [Google Scholar] [CrossRef]
- Kim, H.G.; Kim, B.J. Feasibility study of new hybrid piled concrete foundation for offshore wind turbine. Appl. Ocean Res. 2018, 76, 11–21. [Google Scholar] [CrossRef]
- Park, J.W.; Kim, J.I.; Shin, Y.H.; Lee, J.H.; Park, J.P. 3 MW class offshore wind turbine development. Curr. Appl. Phys. 2009, 10, 307–310. [Google Scholar] [CrossRef]
- Abdelkader, A.M.R. Investigation of Hybrid Foundation System for Offshore Wind Turbine. Ph.D. Thesis, The University of Western Ontario, London, ON, Canada, November 2015. [Google Scholar]
- Lee, J.H.; Byun, N.J.; Kim, S.H.; Park, J.H.; Kang, Y.J. Experimental study for concrete base to sleeve connection of hybrid substructure for offshore wind turbine. J. Korea Acad. Ind. Coop. Soc. 2016, 17, 79–87. [Google Scholar]
- Fish, P.R.; Dean, R.B.; Heaf, N.J. Fluid-structure interaction in Morison’s equation for the design of offshore structures. Eng. Struct. 1980, 2, 15–26. [Google Scholar] [CrossRef]
- Tao, M.; Yang, Y.W.; Liu, Z.X. Research on natural frequencies and dynamical response of submerged moving structure. J. Shanghai Jiaotong Univ. 1997, 31, 137–143. (In Chinese) [Google Scholar]
- Liaw, C.Y.; Chopra, A.K. Earthquake analysis of axisymmetric towers partially submerged in water. Earthq. Eng. Struct. Dyn. 1974, 3, 233–248. [Google Scholar] [CrossRef]
- Yang, W.; Qiao, L. A new added mass method for fluid-structure interaction analysis of deep-water bridge. KSCE J. Civ. Eng. 2013, 17, 1413–1424. [Google Scholar] [CrossRef]
- Lim, W.Z.; Xiao, R.Y. Fluid-structure interaction analysis of gravity-based structure (GBS) offshore platform with partitioned coupling method. Ocean Eng. 2016, 114, 1–9. [Google Scholar] [CrossRef]
- Kim, H.G.; Kim, B.J.; Lee, K.H. Analysis of Piled Concrete Foundation for a 3-MW Class Offshore Wind Turbine along the Southwest Coast in Korea. J. Mar. Sci. Eng. 2020, 8, 215. [Google Scholar] [CrossRef]
- Saruwatari, M.; Yun, K.; Iwakuma, M.; Tamura, K.; Hase, Y.; Sasamori, Y.; Izumi, T. Design study of 15-MW fully superconducting generators for offshore wind turbine. IEEE Trans. Appl. Supercond. 2016, 26, 1–5. [Google Scholar] [CrossRef]
- Gaertner, E.; Rinker, J.; Sethuraman, L.; Zahle, F.; Anderson, B.; Barter, G.E.; Scott, G.N. IEA Wind TCP Task 37: Definition of the IEA 15-Megawatt Offshore Reference Wind Turbine (No. NREL/TP-5000-75698); National Renewable Energy Lab. (NREL): Golden, CO, USA, 2020. [Google Scholar]
- Lin, T.Y.; Burns, N.H. Design of Prestressed Concrete Structures; No. 624.183 L55 1963; Wiley: New York, NY, USA, 1963. [Google Scholar]
- Dawson, T.H. Offshore Structural Engineering; Prentice Hall: Upper Saddle River, NJ, USA, 1983. [Google Scholar]
- Fleming, K.; Weltman, A.; Randolph, M.; Elson, K. Piling Engineering; CRC Press: Boca Raton, FL, USA, 2008. [Google Scholar] [CrossRef]
- Anjos, G.; Cunha, R.; Kuklik, P.; Miroslav, B. Numerical Evaluation of Bored Piles in Tropical Soils by Means of the Geo-Technical Engineering Geo4 Fine Software. In III European Conference on Computational Mechanics; Springer: Heidelberg, The Netherlands, 2006; p. 131. [Google Scholar] [CrossRef]
- Pender, M. Aseismic pile foundation design analysis. Bull. N. Z. Natl. Soc. Earthq. Eng. 1993, 26, 49–160. [Google Scholar] [CrossRef]
- KMA. Annual Report; Korea Meteorological Administration: Seoul, Korea, 2012; pp. 26–27. [Google Scholar]
- MIDAS Information Technology. MIDAS/CIVIL 2012 Analysis Reference; MIDAS IT: Seoul, Korea, 2012. [Google Scholar]
- API. Recommended Practice for Planning, Designing and Constructing Fixed Offshore Platforms—Working Stress Design; RP2A-WSD; American Petroleum Institute: Washington, DC, USA, 2007. [Google Scholar]
- Dean, R.G. Stream function representation of nonlinear ocean waves. J. Geophys. Res. 1965, 70, 4561–4572. [Google Scholar] [CrossRef]
- IEC. Wind Turbines: Part 3: Design Requirements for Offshore Wind Turbines; International Electrotechnical Commission: Geneva, Switzerland, 2009. [Google Scholar]
- DNV. Design of Offshore Wind Turbine Structures; DNV-OS-J101; Det Norske Veritas: Høvik, Norway, 2011. [Google Scholar]
- KCI. Recommended Practice for Planning. In Structural Concrete Design Code; Korea Concrete Institute: Seoul, Korea, 2012. [Google Scholar]
- Lian, J.; Ding, H.; Zhang, P.; Yu, R. Design of large-scale prestressing bucket foundation for offshore wind turbines. Trans. Tianjin Univ. 2012, 18, 79–84. [Google Scholar] [CrossRef]
- Vries, W.D. Support Structure Concepts for Deep Water Sites EU Project Upwind, Final Report wp 4.2; Delft University of Technology: Delft, The Netherlands, 2011. [Google Scholar]
- Snell, R.O.; Wisch, D.J. Offshore Structures Standards. ISO 19900 Series. In Proceedings of the Offshore Technology Conference, Houston, TX, USA, 5–8 May 2008. [Google Scholar]
- Lee, J.H.; Lee, S.B.; Kim, J.K. Earthquake Response Analysis of an Offshore Wind Turbine Considering Fluid-Structure-Soil Interaction. J. Earthq. Eng. Soc. Korea 2012, 16, 1–12. [Google Scholar] [CrossRef][Green Version]
- Korean Industrial Standards Association (KSA). Korean Industrial Standards ks d 7002; KSA: Seoul, Korea, 2012. [Google Scholar]


© 2020 by the authors. Licensee MDPI, Basel, Switzerland. This article is an open access article distributed under the terms and conditions of the Creative Commons Attribution (CC BY) license (http://creativecommons.org/licenses/by/4.0/).