Article

Impact of Nonlinear Lighting Loads on the Neutral Conductor Current of Low Voltage Residential Grids

1
Instituto de Energía Eléctrica, Universidad Nacional de San Juan, San Juan 5400, Argentina
2
Institut für Elektrische Energieversorgung und Hochspannungstechnik (IEEH), Technische Universität Dresden, 01062 Dresden, Germany
*
Author to whom correspondence should be addressed.
Energies 2020, 13(18), 4851; https://doi.org/10.3390/en13184851
Submission received: 20 August 2020 / Revised: 11 September 2020 / Accepted: 14 September 2020 / Published: 16 September 2020
(This article belongs to the Special Issue Harmonics and Quality of Power)

Abstract

:
In the last decade, mainly due to political incentives towards energy efficiency, the share of lamps with power electronic interfaces, like Compact Fluorescent Lamps (CFL) and Light Emitting Diode (LED) lamps, has significantly increased in the residential sector. Their massive use might have a substantial impact on harmonic currents and, consequently, on the current flowing in the neutral conductor. This paper analyzes the impact of modern energy-efficient lighting technologies on the neutral conductor current by using a synthetic Low Voltage residential grid. Different load scenarios reflecting the transition from incandescent lamps, via CFL, to LED lamps are compared concerning the neutral conductor current at different points in the network. The inherent randomness related to the use of lighting devices by each residential customer is considered employing a Monte Carlo simulation. Obtained results show that the use of CFL has a greater impact on the neutral conductor current of Low Voltage (LV) residential grids and that, with increasing use of LED lamps, a decreasing impact can be expected in the future.

1. Introduction

In recent years, Light Emitting Diode (LED) lamp technology has significantly improved. The continuing innovation of LED manufacturers has led to an increase in their efficiency (more lumens per watt) and a drop in market prices. As a result, LED global sales have grown since 2010, achieving 46% of the global residential market in 2019. Compact Fluorescent Lamps (CFL) have the same market share but a decreasing tendency, while the remaining 8% corresponds to incandescent and halogen lamps (IHL) [1]. Moreover, the International Energy Agency (IEA) predicts the LED’s share will almost double in 2030, reaching 87% of the global residential market [1]. This data confirms a shift in the lamp technology installed in Low Voltage (LV) residential networks from IHL, via CFL, towards LED, resulting in a significant increase of nonlinear loads in the lighting sector.
CFL and LED lamps require rectifier frontends and are consequently a significant source of odd harmonic currents [2]. In typical three-phase four-wire (3P4W) networks, these harmonics will also flow in the neutral conductor, particularly those harmonic orders that form a zero-sequence system under balanced conditions (3rd, 9th, 15th, etc.). On the other hand, as IHL are linear loads, they will contribute almost exclusively to the fundamental current only depending on their unbalanced distribution to the phase conductors.
According to Reference [3], the research regarding harmonics caused due to the lamps can be divided into two major topics: (1) the accurate modeling in the frequency domain of CFL and LED lamps [4,5,6,7], and (2) studies on the influence of nonlinear lighting loads on harmonics distortion [2,4,5,8,9,10,11,12,13,14,15,16,17]. Most works covering the former rely on the use of models based on Frequency Coupling Matrices (FCM) [5,6,7], where the accuracy of a determined model is usually assessed by comparison with laboratory measurements. Although well-known models for CFL and LED lamps have been developed, the effects of their combined operation on voltage and current distortion levels in LV residential networks has not been comprehensively studied, especially the effect on the neutral conductor current.
Aggregation of CFL and its relationship with excessive neutral conductor currents in 3P4W networks, which predominant component is the third harmonic, have been studied through measurements at two installations [8], laboratory tests [15], and determining analytical expressions to estimate the value of the neutral current [9]. The replacement of certain luminaires by LED lamps and their impact on voltage and current distortion levels in LV grids [13,14], as well as on the reduction of the neutral conductor current [14,16,17], has been analyzed performing laboratory or on-site measurements. Further research has focused on the harmonic aggregation of commercially available LED lamps by experimental measurements [10,11,16]. For instance, Reference [11] demonstrates the cancellation and summation of harmonics by the combined use of different LED lamps. Other studies exist on the model aggregation of LED lamps regarding parameter estimation for an equivalent circuit of these lamps [4] and analysis of their wide-spread use in a determined grid through harmonic iterative methods [5,12].
However, there is a lack of system-level studies regarding the large-scale aggregation of different brands of lamps, distributed to different households and phase conductors, and their impact on harmonic levels in public LV distribution networks and the neutral conductor current. Especially the impact of the transition from IHL, via CFL, to LED lamps has not been studied so far.
This paper aimed to fill this gap by analyzing the impact of different lighting technologies on the neutral conductor current of a LV residential grid simulating the transition from IHL, via CFL, to LED lamps. Five scenarios representing different combinations of lamp technologies were defined. The assessment was performed on a synthetic distribution LV residential network, which was developed in Reference [18] for the San Juan province in Argentina, but is also representative of other countries with similar housing areas. A Monte Carlo (MC) simulation was used to address the randomness in the distribution of lamps. One thousand iterations were performed for each scenario, which ensures confidence of 95% and an error of 2% for the results [19]. As it was intended to provide a first estimate of the impact, all lamps were represented by harmonic current sources [20] and, consequently, the series impedance of the lines and the supply transformer were omitted. The current harmonic spectra were obtained from a large sample of measurements of commercially available lamps provided by PANDA (equiPment hArmoNic Database, Dresden, Germany) [21]. The impact of a flat-top supply voltage distortion [22,23], which is common for public LV networks, was compared with the behavior under perfect sinusoidal condition, which represents the reference for testing compliance with emission limits. The effect of load unbalance on the harmonic content of the neutral conductor current [8,15] was also analyzed. The results indicate that the lamp technology, as well as the supply voltage distortion, can have a significant impact on the neutral conductor current. The highest values were obtained for the scenario with CFL only.
The remainder of this paper is divided into four sections. The first one includes a description of the synthetic distribution network used to perform the assessment, the set of lamps, the simulation scenarios, and the implementation of the simulation. Obtained results are presented and discussed in the third and fourth sections, respectively. Conclusions and recommendations for future work are detailed in the final section.

2. Simulation Framework

2.1. LV Network

The presented study is based on the layout of a synthetic network shown in Figure 1 and developed in [18]. It represents a typical LV grid in an urban environment of Argentina and is characterized by a high density of individual houses and the absence of large apartment buildings. It has 126 single-phase customers which are almost uniformly distributed to the phases (a: 42, b: 43, c: 41) and indicated by small colored diamonds (a: blue, b: orange, c: green). They are fed by a transformer with a rated power of 250 kVA, which is connected in Dy with the LV-side solidly grounded. Overhead lines are used for energy distribution. The main feeders of the grid have 3P4W branches, which are depicted by black lines, and/or single-phase two wires (1P2W) branches that are represented by colored lines; their lengths are the following:
  • Feeder (i). A 280 m 3P4W branch, with single 3P4W branches of 20 m, located every 40 m.
  • Feeder (ii). A 240 m 3P4W branch, with double 3P4W branches of 40 m, located every 40 m.
  • Feeder (iii). An 80 m 3P4W branch, with three 1P2W branches of 60 m located at the end of the three-phase branch.
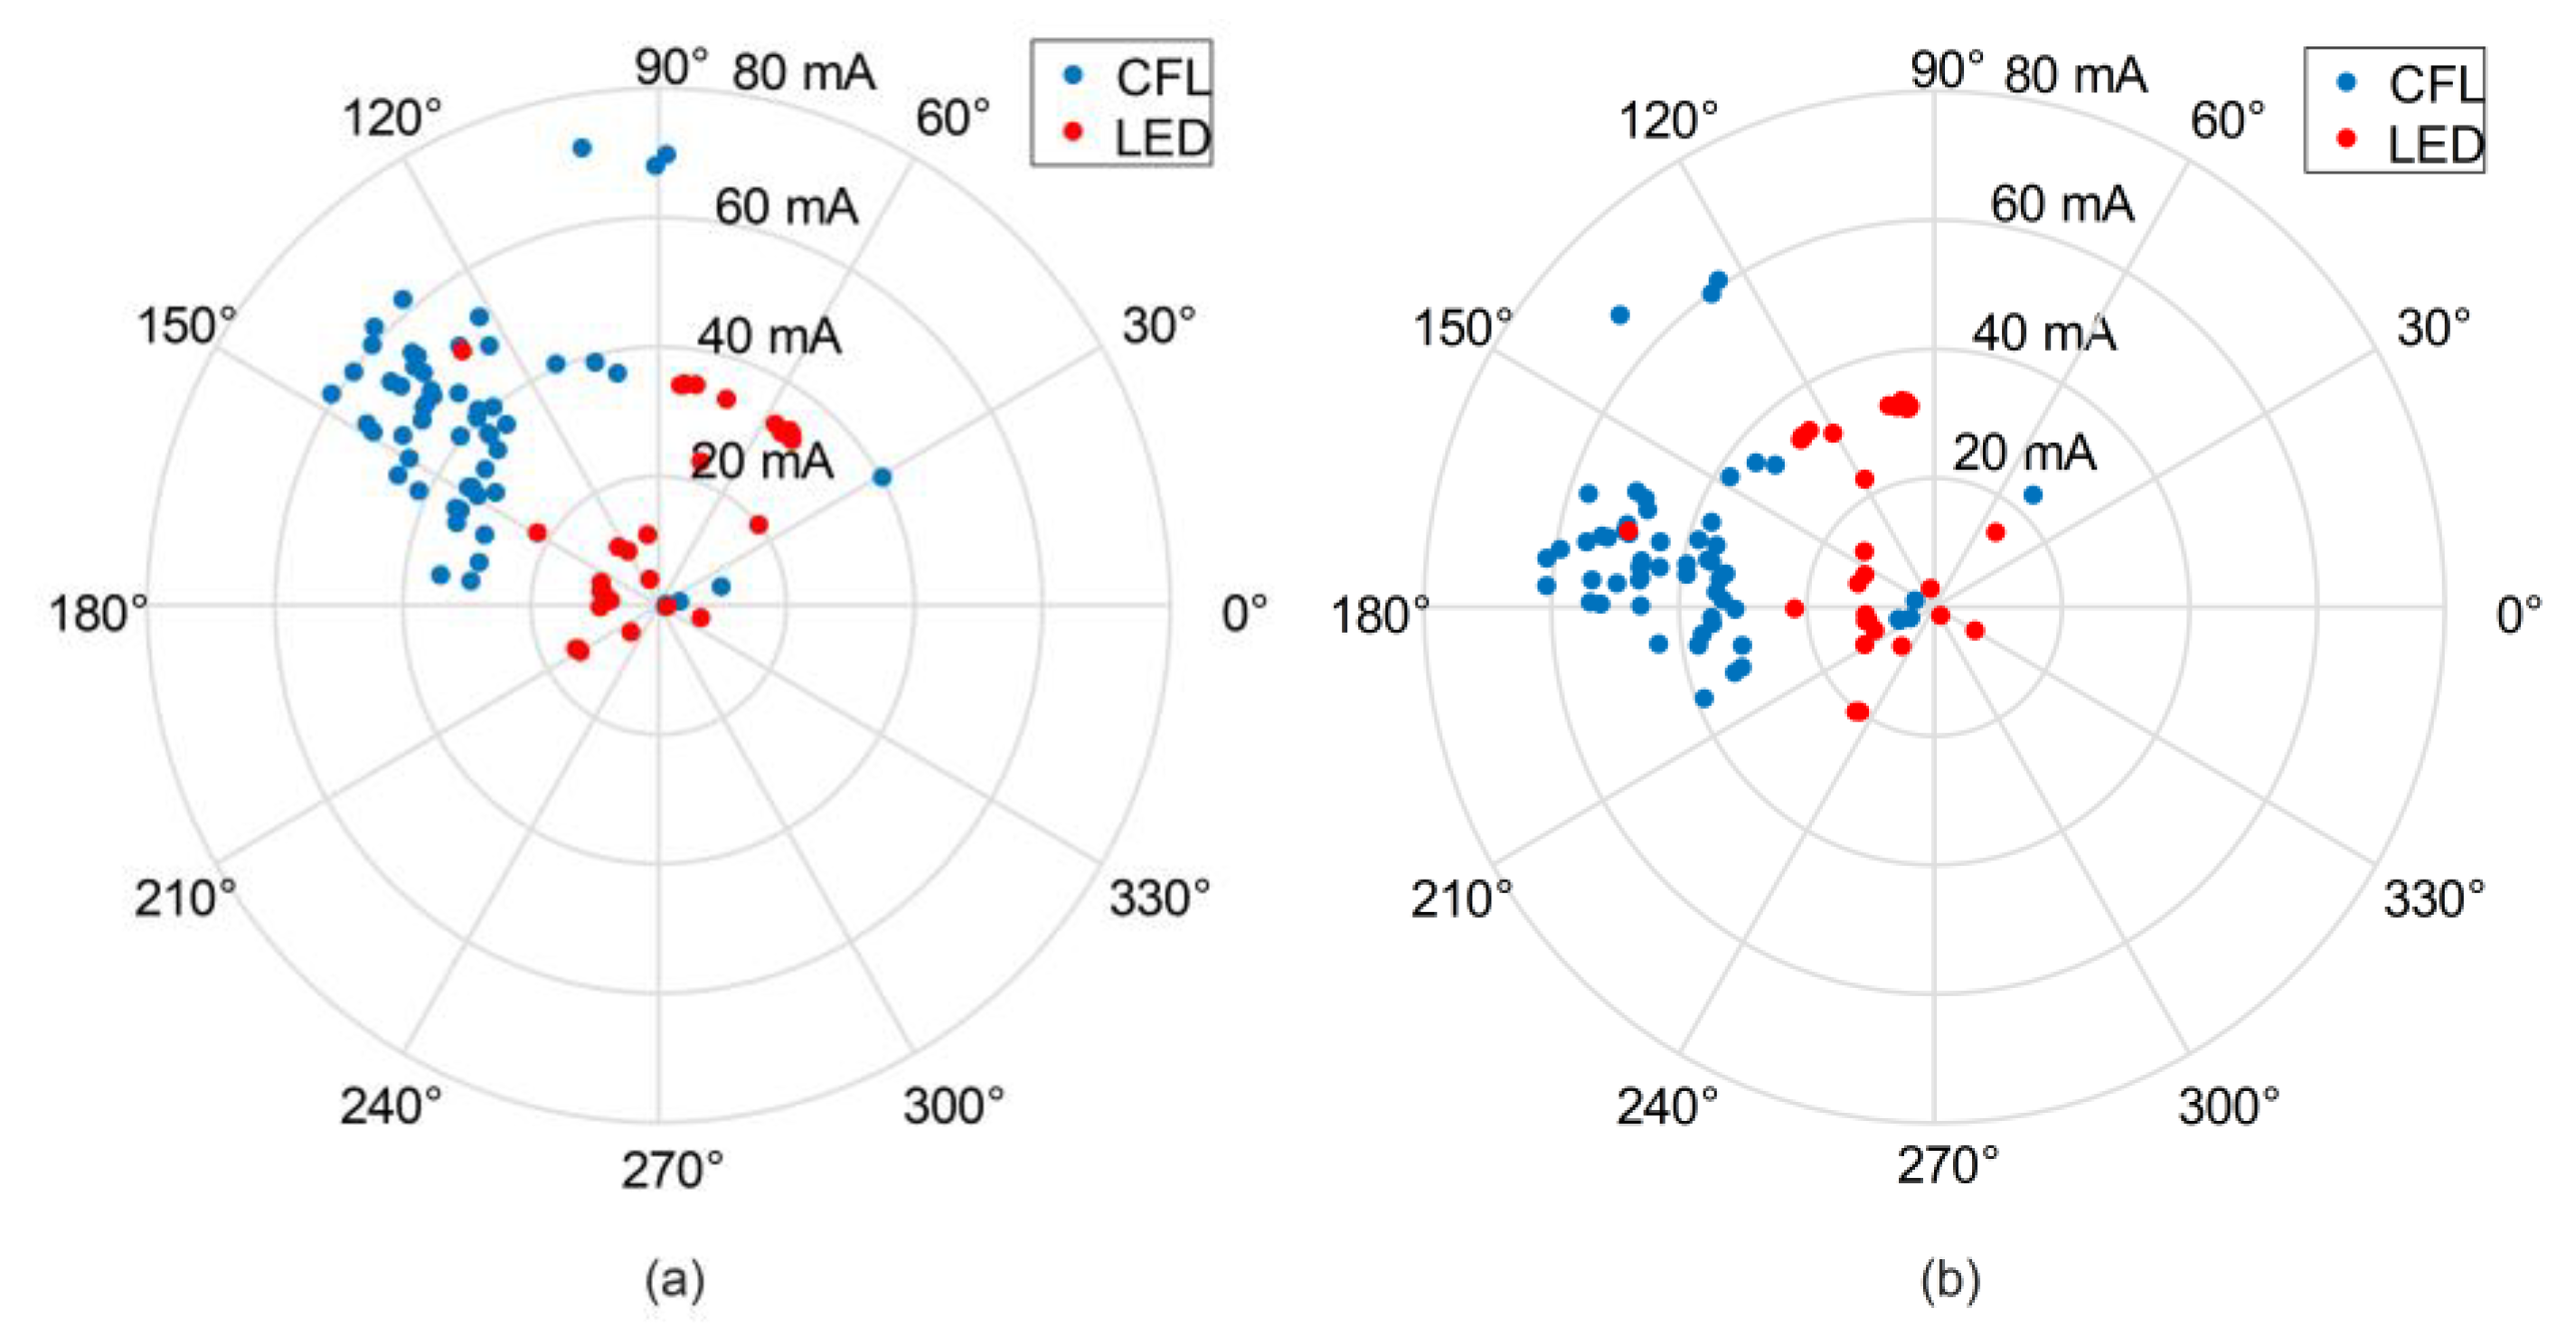
Customer connection terminals are identified through enumerated black points. Seven analysis points are specified to evaluate the neutral conductor current. They are depicted as red points and are tagged with red numbers (cf. Figure 1). Their location in the network is selected to assess the neutral conductor current at different aggregation levels represented by different numbers of households. The enumeration of the locations increases with a decreasing number of users (Table 1).
As the aim of this study was an initial assessment of the impact of different lamp technologies on the neutral conductor current, but not the voltage harmonics in the network, the lamps were modeled by constant current sources. This assumption disregards the interaction between the lamps and will provide slightly higher current magnitudes (conservative estimate). At the same time, it allows us to neglect all series impedances (lines, transformer).

2.2. Lamps

IHL, CFL, and LED lamps are considered for this study with the main intention to obtain a first but conservative estimate of the impact of lamps on the harmonic current distortion, particularly in the neutral conductor. Usually, for lamps with a power electronic interface, the current harmonic spectra depend on the supply voltage distortion at the point of connection [23]. However, in this study, voltage distortion is assumed to be approximately equal at every location in the LV network, i.e., harmonic interaction between voltage and current is not considered. Only lighting loads are taken into account, which are represented for simplicity, independently of their location in the network, by complex current sources including the fundamental and the odd harmonics up to order 15 [20]. All harmonic current sources are modeled using measurements of commercially available lamps provided by the PANDA database [21]. To study the difference between theoretical sinusoidal supply voltage (230 V Root Mean Square (RMS)) and the more realistic flat-top distorted supply voltage (224 V RMS and Total Harmonic Distortion of 3%), two-parameter sets for the complex current sources are applied for each lamp.
Three types of IHL were used in this project. The models contain only the fundamental current component (Table 2) since, for sinusoidal voltage, no current harmonics are emitted (linear loads), and, for flat-top supply voltage, the harmonic currents are negligibly small. Regarding CFL and LED lamps, a comprehensive pool was selected from the PANDA database. The selection is based on keeping the required light output in lumens per lamp approximately constant between IHL, CFL, and LED lamps. This assumes that typical households will replace old IHL by modern and energy-efficient lamps (CFL and LED) providing a similar amount of light. Thus, 57 CFL with rated power between 15 W and 30 W were selected, which correspond in their light output to the IHL presented in Table 2. Similarly, 35 LED lamps with rated power between 7 W and 20 W were chosen.
Figure 2 exemplarily presents the 5th harmonic current emission of the chosen CFL and LED lamps under sinusoidal and flat-top supply voltage. The flat-top supply voltage has a minor impact on the harmonic magnitudes of both types of lamps, while the impact on their phase angles is high. The current characteristics for all considered harmonics of the selected CFL and LED lamps are included in the Appendix A.
To quantify the impact of the voltage distortion on the harmonic emission of the selected CFL and LED lamps, the relative difference in magnitude and the absolute difference in phase angle of the considered harmonic currents under sinusoidal and flat-top supply voltage are analyzed. Besides the individual assessment of the CFL and the LED lamps, a mix of 70 lamps (35 CFL and 35 LED lamps) is also considered. Figure 3 presents the distribution of the difference in current magnitude for each considered harmonic order, including the fundamental. The upper edge, the black line, and the lower edge of the boxes depict the 95th, 50th, and 5th percentiles of the data, respectively. The relative difference is calculated taking the harmonic magnitude under sinusoidal supply voltage as a reference, and the difference is expressed in percent. In general, the flat-top distortion can produce deviations of up to −15%/+25% in the harmonic magnitudes. The impact is qualitatively different for CFL and LED lamps. For instance, Figure 3a indicates a significant reduction of the third harmonic current for the CFL, while Figure 3b shows a slight increase of the third harmonic current for most LED lamps. The opposite behavior is observed, e.g., for the 7th harmonic. The mix of CFL and LED lamps represents a better diversity of the relative difference due to the combination of lamps from diverse lighting technologies (cf. Figure 3c). On the other hand, Figure 4 shows the distribution of the difference in the phase angle between flat-top and sinusoidal supply voltage for all considered harmonics. These box-plots show that the phase angles of CFL tend to be less affected than that of LED lamps (cf. Figure 4a,b, respectively). In general, the fundamental and 3rd harmonic are the least affected harmonic orders. The higher deviation and diversity of LED lamps indicate a better potential for cancellation effects, particularly in the mixed scenario.

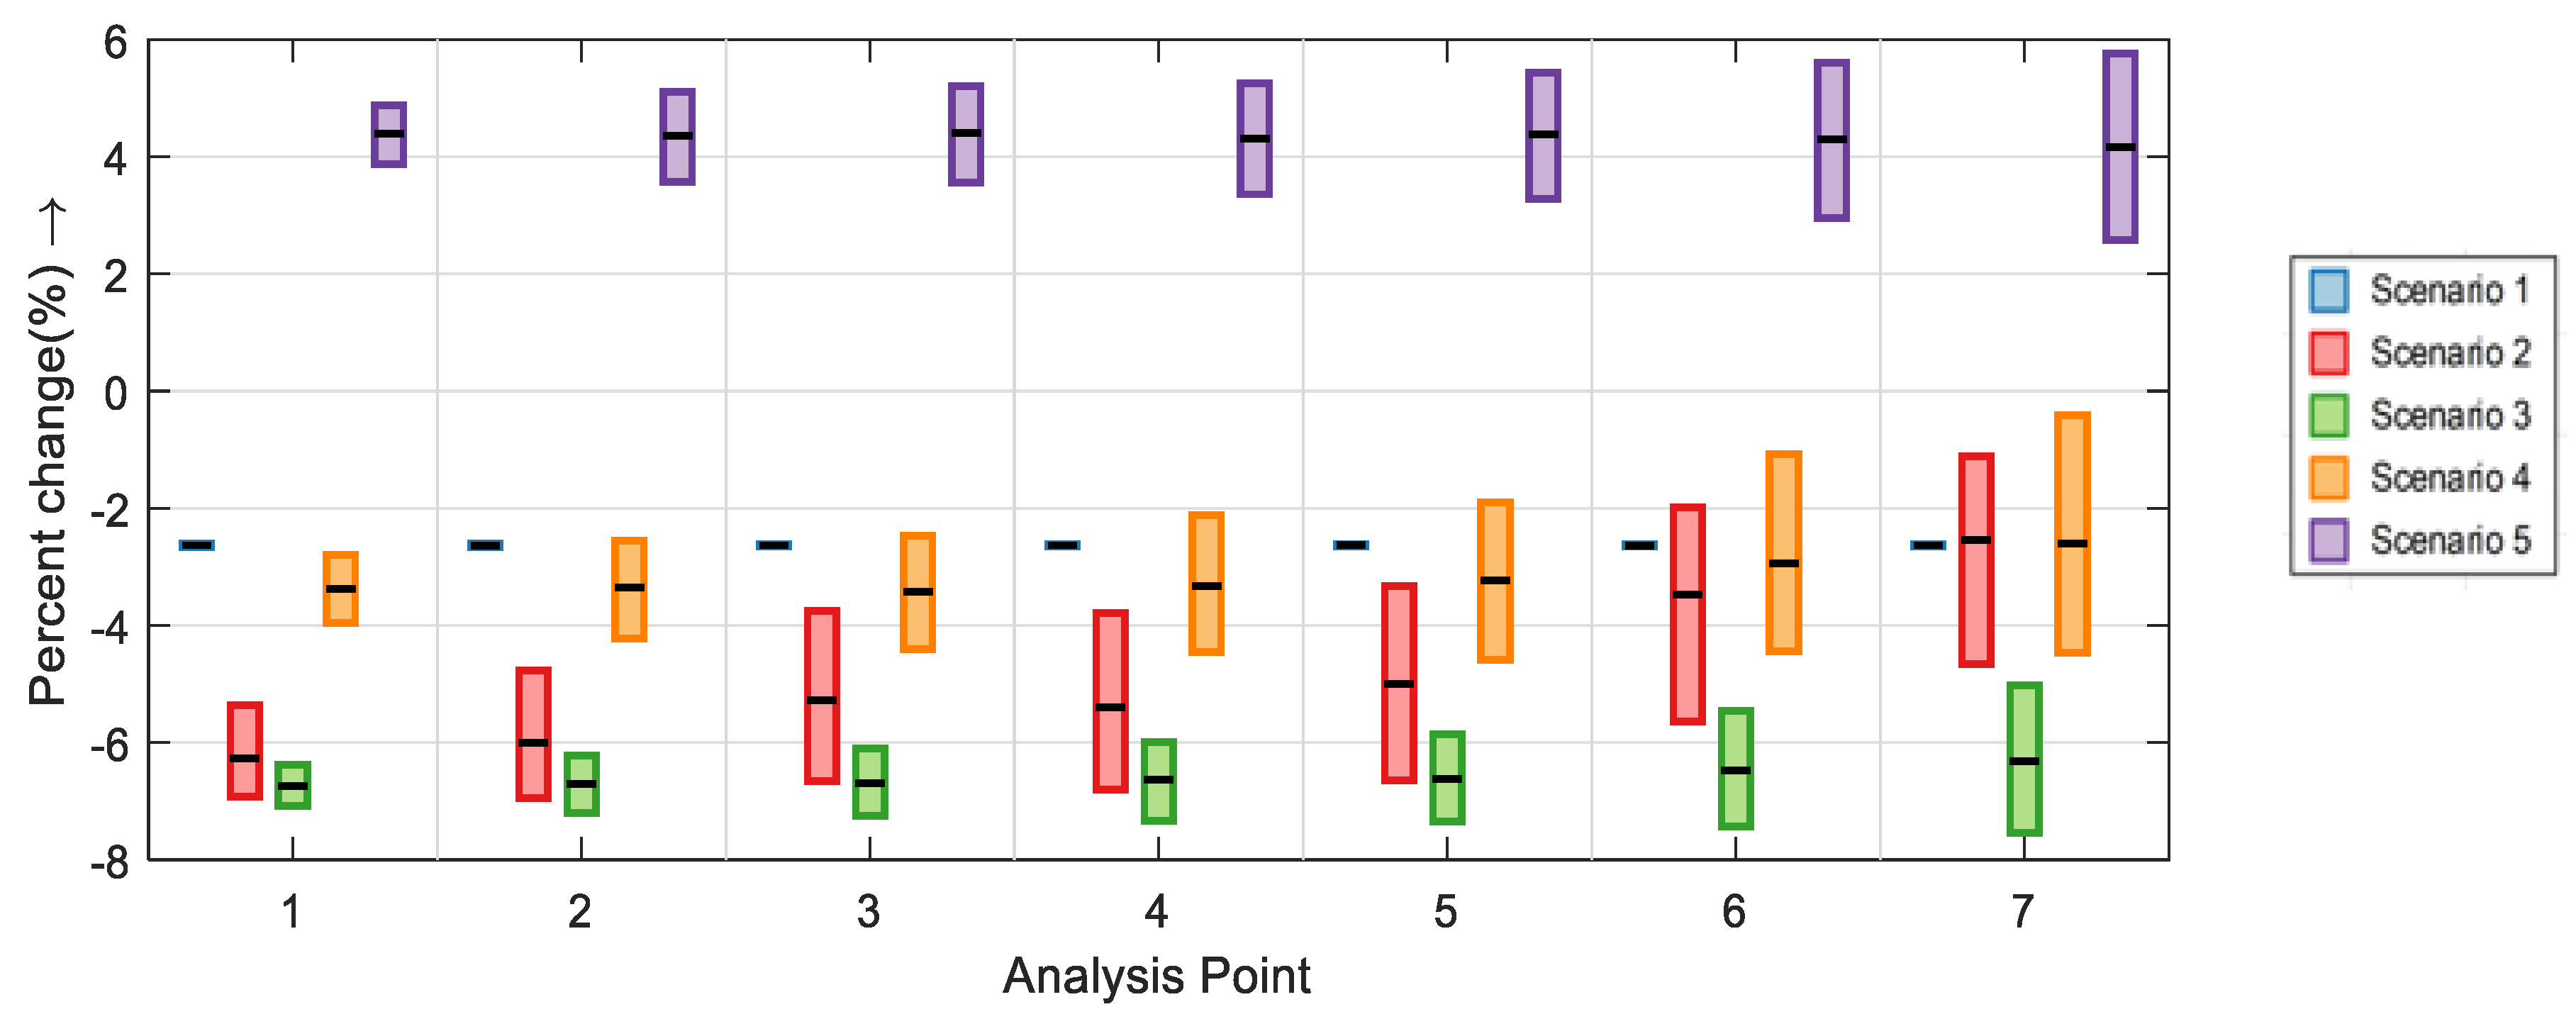
2.3. Simulation Scenarios

The impact of different lamp technologies and the transition from IHL (past), via the mix of CFL and LED (today), to LED (future) on the neutral conductor current is evaluated with five simulation scenarios. To assess the impact of supply voltage distortion [22,23], all scenarios are simulated for two cases: flat-top and sinusoidal voltage waveform. To obtain a conservative estimate, all scenarios are considered for an evening of a winter day, i.e., at 7 p.m. when the peak load occurs, and it is expected that more lamps are simultaneously switched on [24]. Table 3 reports the share of lighting units for each scenario.
In Reference [25], a survey is conducted for a medium-class residential area in Bogotá, a Latin-American city with similar housing characteristics compared to the synthetic distribution network used in this study. The survey found an average of fifteen lamps installed per house. Based on this result, this study assumes that each house (user) has a maximum of fifteen lamps, which means there are 1890 lamps in the LV grid.

2.4. Implementation

2.4.1. Monte Carlo Simulation

MC simulation is used to consider the randomness related to the use of lamps by residential customers. The brand of the lamps installed in each house, as well as the number of lamps in operation, are randomly determined in each iteration for all simulation scenarios. The brand of each lamp is randomly selected from the set of lamps described in Section 2.2, and it is assumed that all lamps in the set have the same probability to be installed in a house. To determine the number of operating lamps in each house, a weighted uniform distribution is applied, where the weights represent the different probability that the respective number of lamps is in operation. Lower weights (probabilities) are applied for 0–5 and 11–15 lamps operated together, while a higher probability is applied for 6–10 lamps (Table 4). This is also in agreement with the findings of the survey developed in Reference [25]. The distribution to the phase conductors of each household is determined by the single-line diagram of the LV network described in Section 2.1.
The number of MC iterations is estimated initially to obtain neutral conductor current values with a 95% confidence level and an error within 2% of the true values. Hence, the percent error of the sample mean criterion is considered and the number of iterations is calculated using
n = ( 100 · s · z c ε · x ¯ ) 2
where n stands for the number of iterations, ε for the percent error, s for the sample standard deviation, x ¯ for the sample mean, and z c for the quantile of the normal distribution (Gaussian distribution) [19]. The value of zc is obtained from the normal distribution for the before mentioned confidence level, which yields to 1.96. A sample of 50 iterations is considered initially to calculate s and x ¯ . Then, using Equation (1), it is obtained that at least 810 iterations are required to estimate neutral conductor currents for all scenarios and all analysis points with a confidence level of 95% and 2% error. To be on the conservative side, 1000 iterations are defined for each MC simulation.

2.4.2. Neutral Conductor Current Calculation

The current spectrum of each lamp is obtained for each simulation run from the PANDA database. All phase angles (fundamental and harmonics) of individual harmonic currents ( I ˉ h , z , k ) are referred to the zero-crossing of the fundamental voltage and can be directly used for phase A. However, all harmonic current phase angles, as well as the fundamental current phase angle, have to be recalculated in case a lamp is connected to phase B or C to consider the −120°/+120° phase shift in relation to phase A. Based on the introduced simplifications, aggregated harmonic components of phase currents at each analysis point ( I ˉ t o t , p , h , z ) are calculated by
I ¯ t o t , p , h , z = I t o t , p , h , z r e a l + j I t o t , p , h , z i m a g = k = 1 N I p , h , z , k r e a l + j k = 1 N I p , h , z , k i m a g ,
where h stands for the harmonic order, N for the number of lamps installed downstream an analysis point z, and p for the network’s phase. Harmonic components of the neutral conductor current ( I ˉ n , h , z ) are determined according to Equation (3). The RMS value of each harmonic current in the neutral conductor at each analysis point (In,h,z) is calculated using Equation (4) and the total RMS current (In,rms,z) according to Equation (5).
I ¯ n , h , z = p = 1 3 I t o t , p , h , z r e a l + j p = 1 3 I t o t , p , h , z i m a g ,
I n , h , z = ( p = 1 3 I t o t , p , h , z r e a l ) 2 + ( p = 1 3 I t o t , p , h , z i m a g ) 2 ,
I n , r m s , z = m = 1 8 I n , h , z 2   ;   h = 2 × m 1 .

2.4.3. Neutral Conductor Current Assessment

In order to evaluate the impact of the different scenarios and the type of supply voltage on the harmonic summation characteristics in the neutral conductor current, the prevailing ratio (PR) is used [26], which compares the magnitude of the phasor sum with the sum of the phasor magnitudes. This index assesses the level of phase angle diversity and, consequently, the level of cancellation when harmonic components of multiple devices are summed up. It is calculated as follows:
P R z ( h ) = | I ¯ n , h , z | k = 1 N | I ¯ h , z , k |
where h is the harmonic order, N is the total number of lamps installed downstream an analysis point z, | I ¯ n , h , z | is the magnitude of the neutral harmonic current at the analysis point z, and | I ¯ h , z , k | is the magnitude of a lamp’s certain harmonic current. The PR varies between 0 (perfect cancellation) and 1 (no cancellation). Table 5 presents four ranges for the PR, and the corresponding level of cancellation as defined in Reference [26].

3. Simulation Results

3.1. Impact of the Lighting Technology

The range of estimated neutral current RMS values under sinusoidal supply voltage is depicted in Figure 5 for all analysis points and scenarios. The boxes represent the 95th, 50th, and 5th percentiles of the respective dataset. The figure shows that the neutral current increases with the number of users for all scenarios. As expected, the LV side of the transformer (i.e., analysis point 1) represents the highest values of neutral currents in the LV distribution network. Scenario 3 (100% CFL) presents the highest neutral currents for the first five analysis points (1–5) with a tendency to overlap with other scenarios for a lower number of users (analysis points 6 and 7). Scenario 5 (100% LED) shows the lowest neutral currents between the scenarios with power electronic-based lighting (scenarios 2 to 5). Scenario 1 shows the highest variation of the neutral currents, which is caused by the unbalance of the load and the higher-rated current drawn by the IHL in comparison with the CFL and LED lamps.
Figure 6 illustrates the harmonic components of the neutral currents and their PRs at analysis point 1 for all scenarios. The following characterizing properties of the neutral currents are identified: (a) scenario 1 only presents the fundamental component because IHL are linear loads, (b) in scenario 2 the fundamental and the 3rd harmonic are the predominant components, and (c) in the other scenarios the 3rd harmonic is the predominant component. These findings indicate that the considered type of lighting technology significantly influences the resulting harmonic content of the neutral current.
For instance, the neutral current in scenario 1 is a consequence of load unbalance in the LV network. This is also the reason why the fundamental is one of the two predominant components of the neutral current in scenario 2. The 3rd harmonic current is emitted by both the CFL and LED lamps, with the CFL having magnitudes with a minimum of two times higher than the LED lamps. The 3rd harmonic current adds up almost arithmetically because of a very low phase angle diversity, which is lower for the CFL compared to the LED lamps. Therefore, the highest neutral current RMS value and the highest 3rd harmonic neutral current occur at analysis point 1 for scenario 3 (cf. Figure 5 and Figure 6a, respectively). The mix of CFL and LED lamps in scenario 4 leads to a better cancellation for the 3rd harmonic (low level of cancellation), and, consequently, the neutral currents in this scenario are lower than those in scenario 3. The level of cancellation even improves (medium level of cancellation) for scenario 5 (100% LED lamps) due to the higher diversity of driver technologies in the market. Along with the generally lower magnitudes, the expected 3rd harmonic for scenario 5 (future) is less than 50% compared to scenario 3 (100% CFL).
On the other hand, Figure 6b shows that the PRs of the characteristic non-zero-sequence harmonics (i.e., 5, 7, 11, and 13) and the fundamental are below 0.2 in all scenarios. This indicates a high level of cancellation with the dominating share of currents not flowing in the neutral conductor. They form positive or negative sequence currents. However, the unbalance causes at least a small share of non-zero-sequence harmonic currents forming a zero-sequence, which can be observed in the neutral conductor. In all scenarios, the magnitude of these harmonic currents in the neutral conductor decreases as the harmonic order increases. Meanwhile, the PRs of the 9th and 15th harmonic indicate an increasing and high level of cancelation in all scenarios. Specifically, the PR of the 9th harmonic in scenario 4 demonstrates that the high diversity for the combined use of CFL and LED lamps decreases the magnitude of the 9th harmonic current magnitude in the neutral conductor considerably compared to scenarios 2, 3, and even 5.
To study the impact of aggregation and, consequently, cancellation between multiple users, the neutral current harmonics are analyzed depending on the number of users. A normalized magnitude (current per user) is calculated for all analysis points and all scenarios by dividing the 95th percentile of neutral current harmonics by the respective number of users. Results are depicted in Figure 7 exemplarily for the 3rd and 5th harmonics representing a zero-sequence and a non-zero-sequence harmonic order, respectively. The harmonic currents in the neutral conductor do not increase linearly with the number of users for all scenarios but exhibit a cancellation, which is significantly higher for the 5th harmonic than for the 3rd harmonic. Table 6 presents the ratio of reduction between the normalized current harmonics for 11 users (analysis point 7) and 126 users (analysis point 1). It confirms the significantly higher level of cancellation for the non-zero-sequence harmonics but also an increase of cancellation for increasing order of zero-sequence harmonics, with the 3rd harmonic being the lowest one with about 11 to 15% for all scenarios.

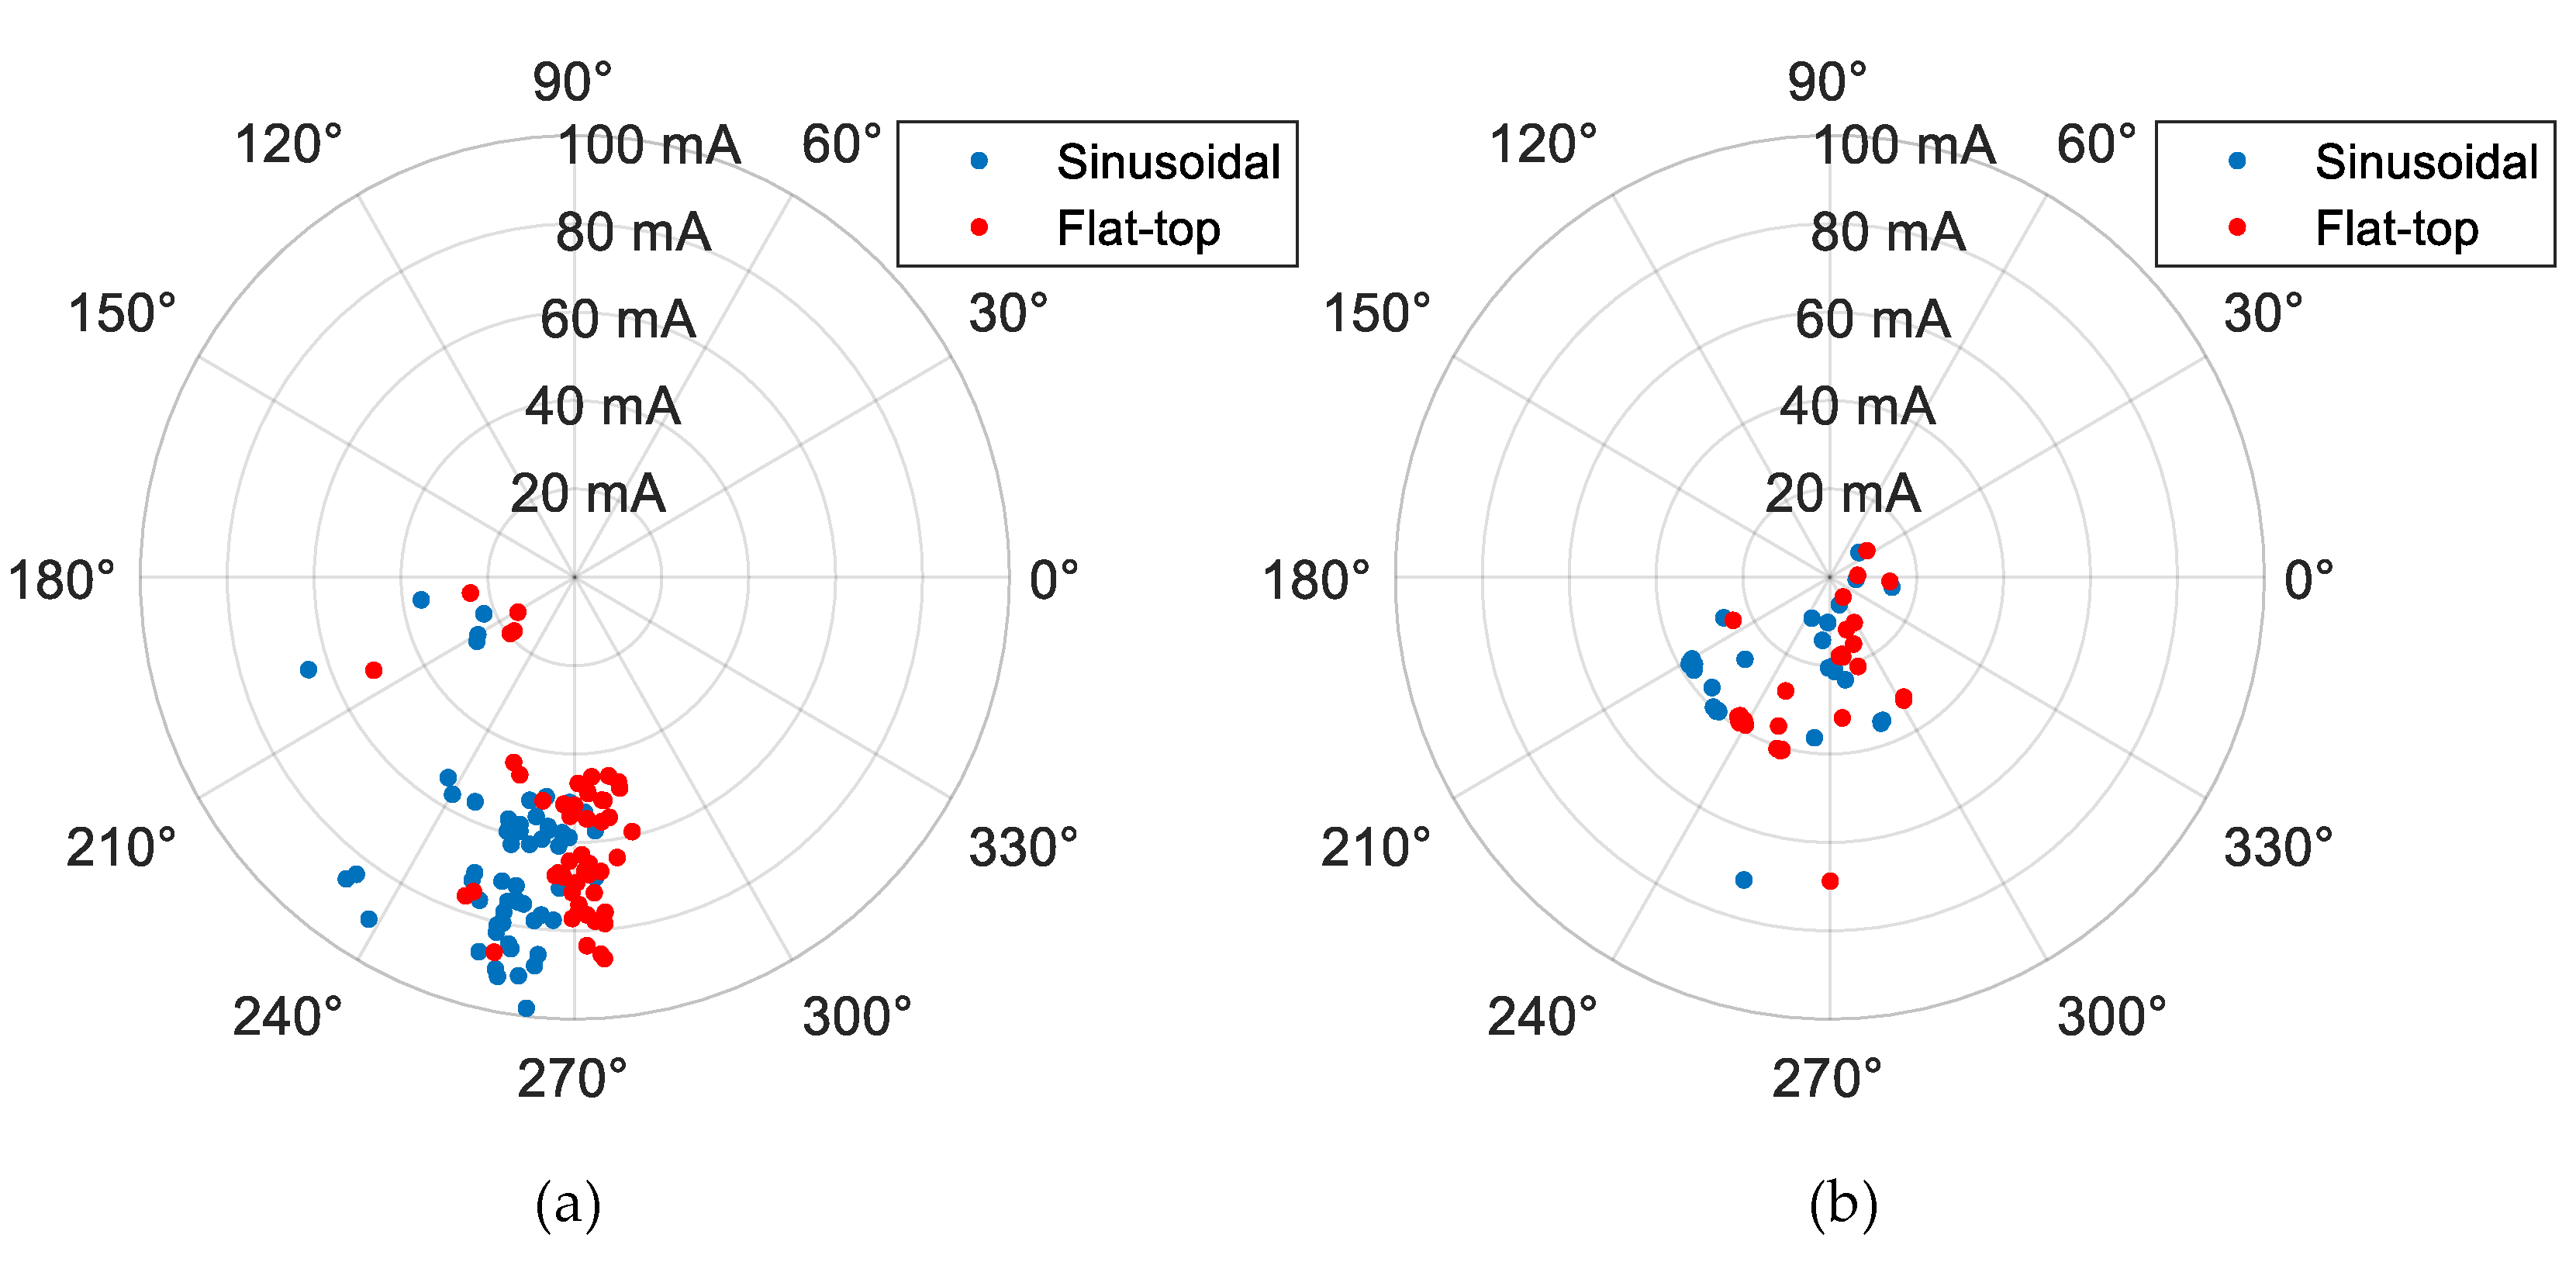
3.2. Impact of Supply Voltage Distortion

Figure 8 presents the relative difference between the neutral current RMS values under the two types of supply voltage, taking currents under sinusoidal voltage as reference. This figure shows that, for all scenarios, except scenario 5 (100% LED lamps), the flat-top supply voltage decreases the neutral current RMS values. The increase for scenario 5 is about 4%, while the highest decrease is observed for scenario 3 with more than −6%. Scenario 1 (100% IHL) does not show a variation at all as all lamps behave exactly similar (resistive), which means that the difference between the two types of the supply voltage is virtually constant.
In order to explain the reasons for the change in the neutral current RMS values, Figure 9 presents the box plots for selected individual neutral current harmonics comparing the two different types of supply voltage at analysis point 1. Figure 10 presents the respective prevailing ratios.
Figure 9 shows that the fundamental and the 5th harmonic current magnitude are virtually not affected by the flat-top supply voltage. The 7th harmonic current tends to be higher for scenarios 2–4 in case of the flat-top supply voltage because the CFL exhibit a significant increase of the 7th harmonic current under flat-top supply voltage (cf. Figure 3a). However, its impact on the neutral current RMS is not significant, as it is not a dominant contributor to this current. The difference in neutral current RMS values between the two types of the supply voltage is mainly caused by the change in magnitude and phase angle diversity of their predominant harmonic components (i.e., scenario 1: fundamental; scenario 2: fundamental and 3rd harmonic; scenarios 3–5: 3rd harmonic).
Scenario 1 presents a slight decrease in the neutral current because the fundamental component of IHL for flat-top voltage is slightly smaller than for sinusoidal voltage (cf. Table 2). The scenarios where CFL are used (i.e., 2, 3, and 4) exhibit a lower neutral current 3rd harmonic under flat-top supply voltage because the 3rd harmonic current of the CFL also decreases for flat-top supply voltage (cf. Figure 3a). Despite the fact that Figure 10 indicates the level of cancellation of the 3rd harmonic in these scenarios decreases and, consequently, the 3rd harmonic current should increase, the impact of the magnitude reduction is more significant. The increase of neutral current RMS values in scenario 5 under flat-top voltage (Figure 8) is mainly determined by the increased 3rd harmonic current magnitude of most LED lamps (cf. Figure 3b), along with a decreasing level of cancellation, as depicted in Figure 10.
Regarding the magnitudes of the other zero-sequence harmonics, Figure 9 depicts that the 9th current harmonic shows an opposite behavior compared to the 3rd harmonic, with an increase for scenarios 2–4 but a decrease for scenario 5. The 15th harmonic shows again lower values for the flat-top supply voltage except for scenario 5, where under flat-top supply voltage the current magnitude is about 3 times higher compared to that obtained under sinusoidal supply voltage. This is mainly caused by the characteristics of LED lamps as discussed in Section 2.2 (cf. Figure 3b). This significantly higher 15th harmonic current under flat-top supply voltage might also be a reason for the presently observed trend of increasing 15th harmonic voltage levels, particularly in urban residential LV networks.
PRs of the 9th and 15th harmonics are also compared in Figure 10 for the two types of the supply voltage. The flat-top voltage waveform changes the phase angle diversity of CFL’s 9th harmonic and results in a medium cancellation effect. Along with the increase of the 9th harmonic current magnitude (cf. Figure 3a), this leads to the before-mentioned rise of the 9th neutral current harmonics in scenarios 2, 3, and 4. For the 15th neutral current harmonic, a considerably decreasing cancellation is only observed for scenario 5, which supports its previously mentioned amplification in scenario 5 under flat-top voltage. The findings derived from Figure 10 indicate that under typical supply voltage distortion in the LV networks, a lower level of cancellation for certain zero-sequence harmonics has to be expected compared to laboratory studies based on the sinusoidal supply voltage. On the other hand, Figure 10 compares the PRs of the fundamental and two non-zero-sequence harmonics (i.e., 5 and 7) for the two types of supply voltage. Results for 11th and 13th harmonic current in the neutral are similar to 5th and 7th harmonic and, therefore, are not separately shown in this paper. In all scenarios, the high cancellation effect of these harmonic components is virtually not affected by the type of supply voltage.
The relation between the aggregation of users and the neutral current harmonics under flat-top supply voltage shows the same findings as explained in Section 3.1 and is therefore not further discussed at this point.

3.3. Impact of Load Unbalance

As an effect of load unbalances, characteristic non-zero-sequence harmonics (i.e., 5, 7, 11, and 13), as well as a fundamental component, flow in the neutral conductor. This produces a rise of the neutral current compared to an ideal reference case in which the harmonic currents of the lamps are perfectly balanced. On the other hand, a decrease for the zero-sequence harmonics could be expected because the unbalanced conditions cause that a part of these currents show up as positive or negative sequence currents and will consequently not flow in the neutral conductor.
In order to obtain an estimate of the impact of unbalance, the percentage deviation of the neutral current harmonics from the theoretically ideal and perfectly balanced case (all zero-sequence harmonic currents but no non-zero-sequence harmonics flowing in the neutral conductor) is determined for all scenarios and types of supply voltage at analysis point 1. Results are presented in Figure 11 and Figure 12. Non-zero-sequence current harmonics of up to 60% of the line current under ideal balanced conditions have to be expected with a general trend to increase with increasing harmonic order. While the type of supply voltage has virtually no impact on scenario 3, scenario 4 shows significant differences for the 7th, 11th, and 13th harmonic (cf. Figure 11).
Regarding zero-sequence harmonics, it is observed in Figure 12 that the dominating 3rd harmonic does not decrease at all and the 9th and 15th harmonic only slightly, except for the 9th harmonic in scenario 4. Under flat-top supply voltage, the 15th harmonic tends to decrease in particular for scenarios 2–4, where the CFL are involved.
Based on the simulation results, the possible correlation between load unbalance, which is expressed by the commonly used negative sequence unbalance factor of line currents CUF (ratio of negative sequence current to positive sequence current), and the magnitude of the neutral current harmonics is analyzed. The Pearson correlation coefficient ( ρ ) is used to describe the relationship between both variables. This coefficient varies between −1 and 1, where +1 indicates a strong positive linear correlation, 0 indicates no linear correlation, and −1 indicates a strong negative linear correlation [27].
Figure 13 shows exemplarily, for scenarios 2–4, the relation between the CUF factor and the magnitude of the fundamental, 3rd, and 5th harmonic of the neutral current under sinusoidal supply voltage at analysis point 1. The 3rd harmonic is virtually independent of the CUF with a tendency to slightly decrease with increasing unbalance of the load for scenario 2. The fundamental component increases with the unbalance. The 5th harmonic also increases with the unbalance for scenarios 3, 4, and 5, but it does not have a strong correlation with the unbalance for scenario 2.
Table 7 compares the ρ coefficients obtained for all harmonic orders and all scenarios at analysis point 1. It confirms that the fundamental neutral current has a strong positive correlation with values larger than 0.9. The zero-sequence harmonics have ρ coefficients close to zero, which confirms their independence of the unbalance. Interestingly, scenario 2 shows a weak correlation also for the non-zero-sequence harmonics due to the presence of IHL in the LV network, which significantly weakens the link between unbalance and current harmonics. The mix of CFL and LED lamps (scenario 4) results in a lower correlation for the 7th and 11th harmonic.

4. Discussion of Results

The results of this study show that neutral conductor currents caused by lighting loads in LV residential networks are mainly influenced by three factors: lighting technology, supply voltage distortion, and load unbalance. Due to the lower harmonic emission, LED lamps have a minor impact on the neutral conductor current than CFL. Although LED lamps do not yet represent the majority of the global lighting residential market, their increasing use [1] is expected to decrease the contribution of lighting to the neutral conductor current.
A flat-top supply voltage, which can be typically found in residential LV networks, results in lower neutral conductor currents compared to a sinusoidal supply voltage as long as a considerable amount of CFL is involved. In the case of 100% LED lamps, a flat-top supply voltage is expected to result in higher magnitudes of neutral currents compared to the sinusoidal supply voltage, especially for the 15th harmonic. This occurs because the supply voltage distortion modifies the reference current harmonic spectra of these lamps, as discussed in Reference [22,23].
The unbalanced distribution of lamps to the phases results in additional non-zero-sequence harmonics (5th, 7th, 11th, 13th), as well as in additional fundamental currents in the neutral conductor, which tend to increase the neutral conductor current compared to the balanced case. Zero-sequence harmonics (3rd, 9th, 15th) are almost not affected by minor load unbalances and no significant reduction of their content in the neutral conductor current can be expected for higher unbalances. These findings confirm the results presented in Reference [8,15] concerning the impact of load unbalances on the neutral conductor current of a 3P4W network supplying fluorescent lamps and, also, they extend the discussion to the case of LED lamps.
The aggregation of neutral current harmonics depending on the number of users shows that the non-zero-sequence harmonics exhibit a considerable cancellation with about 80% less harmonic currents per user for 126 users compared to 11 users. On the other hand, the dominant 3rd harmonic shows only a reduction of 11%, which indicates a relation only slightly lower than constant. In general, the results of scenario 4 represent the actual impact of nonlinear lighting loads on the neutral conductor current of LV residential grids.

5. Conclusions

This paper presents a probabilistic simulation to assess the impact of different lighting technologies on the neutral conductor current in low voltage residential networks. The simulation uses a network model developed for a typical urban area in Argentina, but the results are also transferrable to many other regions of the world. The simulation results are analyzed with respect to the impact of lighting technology, supply voltage distortion, and load unbalances on the odd current harmonics up to order 15.
The results show that the highest neutral conductor current has to be expected in the case of 100% CFL. The values are more than two times higher than for the scenario with 100% incandescent lamps. In the future, a scenario with 100% LED lamps is expected, which will provide neutral conductor currents in the same range as the scenario with 100% incandescent lamps. However, the current will contain a significant share of 3rd, 9th, and 15th harmonic. A flat-top supply voltage can impact the neutral conductor current differing by almost −8%/+6% from the current obtained for the sinusoidal supply voltage. The unbalanced distribution of lamps to the phases tends to increase the neutral conductor current only slightly.
The study presented in this paper provides a solid first estimate of the impact of different lighting technologies on the neutral conductor current. It intentionally does not take other residual loads into account in order to obtain an initial indication on the safe side. Further studies are planned to consider residual loads, background distortion, network’s impedances, as well as more comprehensive models of the lamps (e.g., coupled Norton model). In this way, the impact of nonlinear lighting loads on the voltage distortion can be comprehensively studied, and neutral current magnitudes can be compared to the ones obtained in this initial assessment.

Author Contributions

Data curation, A.A.R., J.M. and A.M.B.; Investigation, J.H.; Methodology, J.M.; Software, J.H.; Visualization, A.M.B.; Writing–original draft, J.H.; Writing–review & editing, A.A.R., J.M. and A.M.B. All authors have read and agreed to the published version of the manuscript.

Funding

This research received no external funding.

Acknowledgments

The authors want to thank Joaquín Caicedo for providing the synthetic network and technical data related to it, which was fundamental to develop this research.

Conflicts of Interest

The authors declare no conflict of interest.

Nomenclature

IHLIncandescent and Halogen Lamps
CFLCompact Fluorescent Lamps
LEDLight Emitting Diode
RMSRoot Mean Square
nNumber of Monte Carlo iterations
εPercent error
sSample standard deviation
x ¯ Sample mean
z c Quantile of the normal distribution
hHarmonic order
NNumber of installed lamps
kLamp number
zAnalysis point
pNetwork’s phase
I ¯ n , h , z , k Individual harmonic currents
I ¯ n , h , z Harmonic components of the neutral conductor current
In,h,zRMS value of individual harmonic components of the neutral conductor current
In,rms,zTotal RMS neutral conductor current
PRPrevailing Ratio
CUFNegative sequence unbalance factor of line currents
ρ Pearson coefficient

Appendix A

Figure A1. Fundamental current emission of the selected lamps under the two types of supply voltage: (a) CFL and (b) LED lamps.
Energies 13 04851 g0a1
Figure A2. Third harmonic current emission of the selected lamps under the two types of supply voltage: (a) CFL and (b) LED lamps.
Energies 13 04851 g0a2
Figure A3. Fifth harmonic current emission of the selected lamps under the two types of supply voltage: (a) CFL and (b) LED lamps.
Energies 13 04851 g0a3
Figure A4. Seventh harmonic current emission of the selected lamps under the two types of supply voltage: (a) CFL and (b) LED lamps.
Energies 13 04851 g0a4
Figure A5. Ninth harmonic current emission of the selected lamps under the two types of supply voltage: (a) CFL and (b) LED lamps.
Energies 13 04851 g0a5
Figure A6. Eleventh harmonic current emission of the selected lamps under the two types of supply voltage: (a) CFL and (b) LED lamps.
Energies 13 04851 g0a6
Figure A7. Thirteenth harmonic current emission of the selected lamps under the two types of supply voltage: (a) CFL and (b) LED lamps.
Energies 13 04851 g0a7
Figure A8. Fifteenth harmonic current emission of the selected lamps under the two types of supply voltage: (a) CFL and (b) LED lamps.
Energies 13 04851 g0a8

References

  1. Abergel, T. “International Energy Agency—Lighting Report.”. 2020. Available online: https://www.iea.org/reports/lighting (accessed on 19 July 2020).
  2. Blanco, A.M.; Stiegler, R.; Meyer, J.; Meyer, J. Power quality disturbances caused by modern lighting equipment (CFL and LED). In Proceedings of the 2013 IEEE Grenoble Conference, Grenoble, France, 16–20 June 2013; Institute of Electrical and Electronics Engineers (IEEE): Piscataway, NJ, USA, 2013; pp. 1–6. [Google Scholar]
  3. Ronnberg, S.K.; Bollen, M. Power quality issues in the electric power system of the future. Electr. J. 2016, 29, 49–61. [Google Scholar] [CrossRef]
  4. Xu, X.; Gunda, J.; Fang, D. Modelling and Aggregation of LED Lamps for Network Harmonic Analysis. In Proceedings of the 2018 Power Systems Computation Conference (PSCC), Dublin, Ireland, 11–15 June 2018; Institute of Electrical and Electronics Engineers (IEEE): Piscataway, NJ, USA, 2018; pp. 1–7. [Google Scholar]
  5. Molina, J.; Mesas, J.J.; Mesbahi, N.; Sainz, L. LED lamp modelling for harmonic studies in distribution systems. IET Gener. Transm. Distrib. 2017, 11, 1063–1071. [Google Scholar] [CrossRef]
  6. Collin, A.J.; Drapela, J.; Langella, R.; Testa, A.; Djokic, S.Z.; Watson, N.R. Harmonic Modelling of LED lamps by Means of Admittance Frequency Coupling Matrices. In Proceedings of the 2019 IEEE Milan PowerTech, Milan, Italy, 23–27 June 2019; pp. 1–6. [Google Scholar] [CrossRef]
  7. Martinez-Penaloza, A.; Carrillo-Sandoval, L.; Osma-Pinto, G. Determination and Performance Analysis of the Norton Equivalent Models for Fluorescents and LED Recessed Lightings. In Proceedings of the 2019 IEEE Workshop on Power Electronics and Power Quality Applications (PEPQA), Manizales, Colombia, 30–31 May 2019; Institute of Electrical and Electronics Engineers (IEEE): Piscataway, NJ, USA, 2019; pp. 1–6. [Google Scholar]
  8. Liew, A.-C. Excessive neutral currents in three-phase fluorescent lighting circuits. IEEE Trans. Ind. Appl. 1989, 25, 776–782. [Google Scholar] [CrossRef]
  9. Cunill-Solà, J.; Sainz, L.; Mesas, J.J. Neutral conductor current in three-phase networks with compact fluorescent lamps. Electr. Power Syst. Res. 2013, 103, 70–77. [Google Scholar] [CrossRef] [Green Version]
  10. Phannil, N.; Jettanasen, C.; Ngaopitakkul, A. Harmonics and Reduction of Energy Consumption in Lighting Systems by Using LED Lamps. Energies 2018, 11, 3169. [Google Scholar] [CrossRef] [Green Version]
  11. Jarkovoi, M.; Iqbal, M.N.; Kutt, L. Analysis of Harmonic Current Stability and Summation of LED Lamps. In Proceedings of the 2019 Electric Power Quality and Supply Reliability Conference (PQ) & 2019 Symposium on Electrical Engineering and Mechatronics (SEEM), Kärdla, Estonia, 12–15 June 2019; Institute of Electrical and Electronics Engineers (IEEE): Piscataway, NJ, USA, 2019; pp. 1–8. [Google Scholar]
  12. Shabbir, H.; Rehman, M.U.; Rehman, S.A.; Sheikh, S.K.; Zaffar, N. Assessment of harmonic pollution by LED lamps in power systems. In Proceedings of the 2014 Clemson University Power Systems Conference, Clemson, SC, USA, 11–14 March 2014; Institute of Electrical and Electronics Engineers (IEEE): Piscataway, NJ, USA, 2014; pp. 1–7. [Google Scholar]
  13. Veloso, P.; Gonçalves, B.; Morgado, S.; Bastião, F.; Tavares, R. LED Technology in Public Lighting—Analysis of the Impact in Power Quality in the Low Voltage Grid Distribution. In Proceedings of the 25th International Conference on Electricity Distribution, Madrid, Spain, 3–6 June 2019; AIM: Sydney, Austalia, 2019. [Google Scholar]
  14. Hermoso-Orzáez, M.J.; Rojas-Sola, J.; Gago-Calderón, A. Electrical consequences of large-scale replacement of metal halide by LED luminaires. Light. Res. Technol. 2016, 50, 282–293. [Google Scholar] [CrossRef]
  15. Desmet, J.; Sweertvaegher, I.; Vanalme, G.; Stockman, K.; Belmans, R. Analysis of the neutral conductor current in a three phase supplied network with non-linear single phase loads. In Proceedings of the International Electric Machines and Drives Conference, Cambridge, MA, USA, 17–20 June 2001; IEEE: Piscataway, NJ, USA, 2001; pp. 448–453. [Google Scholar]
  16. Milardovich, N.; Prevosto, L.; Lara, M.A.; Milardovich, D. The Impact of the Use of Large Non-Linear Lighting Loads in Low-Voltage Networks. In Light-Emitting Diode—An Outlook on the Empirical Features and Its Recent Technological Advancements; IntechOpen: London, UK, 2018; pp. 57–76. [Google Scholar]
  17. Ruuth, K.; Hilden, A.; Rekola, J.; Pakonen, P.; Verho, P. The Impact of LED Lighting Systems to the Power Quality and Recommendations for Installation Methods to Achieve the Expected Energy Efficiency. In Proceedings of the 25th International Conference on Electricity Distribution, Madrid, Spain, 3–6 June 2019; AIM: Sydney, Australia, 2019. [Google Scholar]
  18. Caicedo Navarro, J.E. Methodological Contribution to the Assessment of the Harmonic Distortion in Residential Distribution Networks, Considering the Penetration of Plug-In Electric Vehicles. Ph.D. Thesis, Universidad Nacional de San Juan, San Juan, Argentina, 2019. [Google Scholar]
  19. Oberle, W. Monte Carlo Simulations: Number of Iterations and Accuracy; Army Research Lab: Aberdeen Proving Ground, MD, USA, 2015. [Google Scholar]
  20. Langella, R.; Testa, A. IEEE Recommended Practice and Requirements for Harmonic Control in Electric Power Systems; IEEE: Piscataway, NJ, USA, 2014. [Google Scholar]
  21. Blanco, A.M.; Gasch, E.; Meyer, J.; Schegner, P. Web-based platform for exchanging harmonic emission measurements of electronic equipment. In Proceedings of the 2012 IEEE 15th International Conference on Harmonics and Quality of Power, Hong Kong, China, 17–20 June 2012; Institute of Electrical and Electronics Engineers (IEEE): Piscataway, NJ, USA, 2012; pp. 943–948. [Google Scholar]
  22. Gil-De-Castro, A.; Medina-Gracia, R.; Rönnberg, S.; Blanco, A.; Meyer, J. Differences in the performance between CFL and LED lamps under different voltage distortions. In Proceedings of the 2018 18th International Conference on Harmonics and Quality of Power (ICHQP), Ljubljana, Slovenia, 13–16 May 2018; Institute of Electrical and Electronics Engineers (IEEE): Piscataway, NJ, USA, 2018; pp. 1–6. [Google Scholar]
  23. Blanco, A.M.; Gupta, M.; Gil de Castro, A.; Ronnberg, S.; Meyer, J. Impact of flat-top voltage waveform distortion on harmonic current emission and summation of electronic household appliances. Renew. Energy Power Qual. J. 2018, 1, 698–703. [Google Scholar] [CrossRef]
  24. Domagk, M.; Meyer, J.; Schegner, P.; Max, D. Seasonal variations in long-term measurements of power quality parameters. In Proceedings of the 2015 IEEE Eindhoven PowerTech, Eindhoven, The Netherlands, 29 June–2 July 2015; pp. 1–6. [Google Scholar] [CrossRef]
  25. Vega-Escobar, A.M. Gestión de la Energía Eléctrica Domiciliaria con Base en la Gestión Activa de la Demanda; Universidad Distrital Francisco José de Caldas: Bogota, Colombia, 2017. [Google Scholar]
  26. Meyer, J.; Blanco, A.-M.; Domagk, M.; Schegner, P. Assessment of Prevailing Harmonic Current Emission in Public Low-Voltage Networks. IEEE Trans. Power Deliv. 2017, 32, 962–970. [Google Scholar] [CrossRef]
  27. Fisher, R.A. Statistical Methods for Research Workers, 5th ed.; Oliver and Boyd Ltd.: Edinburgh, UK, 1934. [Google Scholar]
Figure 1. Topology of the synthetic Low Voltage (LV) distribution network.
Energies 13 04851 g001
Figure 2. Fifth harmonic current emission under: (a) sinusoidal supply voltage; (b) flat-top supply voltage.
Energies 13 04851 g002
Figure 3. Relative difference in current magnitude between flat-top and sinusoidal supply voltage: (a) CFL; (b) LED lamps; (c) mix.
Energies 13 04851 g003
Figure 4. Difference in phase angle between flat-top and sinusoidal supply voltage: (a) Compact Fluorescent Lamps (CFL); (b) Light Emitting Diode (LED) lamps; (c) mix.
Energies 13 04851 g004
Figure 5. Neutral current RMS values for all scenarios under sinusoidal supply voltage.
Energies 13 04851 g005
Figure 6. Overview of the neutral currents under sinusoidal supply voltage at analysis point 1: (a) harmonic components; (b) prevailing ratios.
Energies 13 04851 g006
Figure 7. Normalized neutral harmonic currents under sinusoidal supply voltage: (a) 3rd harmonic and (b) 5th harmonic.
Energies 13 04851 g007
Figure 8. Relative difference between the neutral current RMS values under flat-top and sinusoidal supply voltage.
Energies 13 04851 g008
Figure 9. Comparison of selected neutral harmonic currents at analysis point 1.
Energies 13 04851 g009
Figure 10. Comparison of selected prevailing ratios (PRs) at analysis point 1.
Energies 13 04851 g010
Figure 11. Deviation of non-zero-sequence harmonic currents from the ideal balanced case (0%) at analysis point 1: (a) sinusoidal and (b) flat-top.
Energies 13 04851 g011
Figure 12. Deviation of zero-sequence harmonic currents from the ideal balanced case (100%) at analysis point 1: (a) sinusoidal and (b) flat-top.
Energies 13 04851 g012
Figure 13. Correlation between the CUF (ratio of negative sequence current to positive sequence current) and selected neutral harmonic currents under sinusoidal supply voltage at analysis point 1: (a) fundamental, (b) 3rd harmonic, and (c) 5th harmonic.
Energies 13 04851 g013
Table 1. Overview of analysis points.
Analysis Point.1234567
Bus Number12323094750
Supplied Users126604934261711
Table 2. Characteristics of incandescent and halogen lamps (IHL).
Rated Power (W)Current (A),
Sinusoidal Supply Voltage
Current (A),
Flat-Top Supply Voltage
600.2610.254
750.3260.318
1000.4350.423
Table 3. Percentage of lamps per scenario.
ScenarioIHL (%)CFL (%)LED (%)
110000
250500
301000
405050
500100
Table 4. Weighted distributions to determine the number of operating lamps.
Lamps in OperationWeight per Lamp Number
0–50.0476
6–100.0952
11–150.0476
Table 5. Description of the prevailing ratio.
RangePR ≥ 0.950.95 > PR ≥ 0.890.89 > PR ≥ 0.8PR < 0.8
Level of cancellationVery LowLowMediumHigh
Table 6. Ratio of reduction of normalized harmonic currents between 11 and 126 users.
3579111315
Scenario 211.3%81.8%80.6%15.2%79.6%79.6%18.9%
Scenario 315.2%74.1%73.0%18.0%72.2%72.2%21.1%
Scenario 412.1%76.3%83.1%35.5%81.7%75.4%19.6%
Scenario 515.1%70.7%69.3%17.0%70.0%68.5%23.4%
Table 7. Pearson correlation coefficient between CUF and the magnitude of the neutral harmonic currents.
Harmonic Order
Scenario13579111315
20.952−0.0340.0100.002−0.040−0.026−0.025−0.040
30.964−0.1020.8590.643−0.0890.6130.435−0.074
40.956−0.1160.7160.201−0.0420.2820.321−0.073
50.927−0.0900.6020.494−0.1020.4720.157−0.043
Energies 13 04851 i001

