Abstract
Rain falling from the sky is viewed as a clean energy source with a great potential, owing to the large amount of it and its zero pollution nature, the fact that it has scattered raindrops, and its characteristic rainfall concentration that promotes extensive research on harvesting and utilization. Here, we introduce a new approach to harvest rainwater on rooftops called the Rain-Power Utilization System, which is composed of an initial rainwater disposal system and multistage energy conversion system. Initial rainwater is discharged into a split-flow pipe due to its poor quality and impurities. Additionally, clean rainwater is accumulated in a storage pipe until the water level reaches a specified height, triggering siphonage for energy conversion. The same process is repeated in other storage pipes connected in series. Function relations among physical and dimension parameters have been established for further studies. A kind of simplified optimization algorithm has been proposed considering the maximum instantaneous power under the constraint of a permitted vacuum and maximum energy generation per unit length to find the model with an optimal height combination (hu, hd). The experimental prototype developed in proportion is used to verify theoretical research and conduct error analysis to establish an equation of annual energy generation for a high-rise building. Without building extra tanks, this paper presents an innovative approach to maximizing the use of energy in rain for high-rise buildings based on a siphon.
1. Introduction
Rainwater is an abundant and widespread natural source with kinetic and potential energy and has considerable prospects in energy generation as a renewable energy source causing little contamination. Rain energy has many of the same characteristics as wind energy, such as intermittence and an inhomogeneous density, and is superior to wind energy since water is 900 times denser than air. Furthermore, rain belt regions are common all over the world, e.g., plum rain over the middle and longer reach of the Yangtze River from June to August represents the major summer rainfall in China. However, it is difficult to harvest significant and available rain energy, since rain is strongly scattered with a great initial dropping height. As a result, how to harvest the energy of rain in an efficient and convenient manner is an urgent problem that needs to be solved.
In recent years, some studies have focused on harvesting the energy of raindrops by relying on material whose technologies are generally divided into piezoelectric, triboelectric, and chemical types [1]. Wong [2] introduced a kind of smart piezoelectric beam for harvesting raindrop impact energy based on an electrostatic induction mechanism, which could convert vibrations into electricity, and studied how rain parameters such as the rain rate and drop size distribution influence the output energy. The energy harvester is more applicable in abundant annual rainfall regions due to its unique property. Zheng [3] replaced the regular protection layer on a solar panel with a special transparent polymer material, with the aid of the opposite triboelectric polarities on two surfaces, and could generate a periodic potential difference driven by raindrop kinetic energy to produce an alternating current. Such a hybrid solar cell achieves the simultaneous or individual harvesting of both solar energy and raindrop energy. Duan [4] presented a chemical model to capture rain energy by a polyaniline film via chemical bath deposition, owing to the general principle of graphene. However, these energy harvesters generate a very low energy and unsteady current, have expensive devices, and have high requirements for the rainfall intensity and rain rate. Most of them are limited to laboratory testing, without providing practical insight on implementation.
Indeed, there is an efficient way to convert the mechanical energy of rain into electrical energy. The basic idea is to first accumulate rainwater to a specified volume and release it to drive water turbines for generating energy, and this has been widely studied. Hydropower contributes to approximately 85% of global renewable electricity and plays a strategic essential role that has moved beyond other renewable sources, such as wind, solar, and biomass, due to some significant benefits, including the low cost of installation, proven technology, and high reliability and stability [5,6]. Nowadays, hydroelectricity generation provides serviced community independence from global fossil fuel contamination and fluctuation [7,8]. With the process of urbanization, the capacity and devices of hydropower have moved towards a small scale to adapt to different working conditions. The Micro Hydro Power System (MHPS), as one of the cleanest renewable energy sources and the most cost-effective energy technology, being approximately three times cheaper than small wind electric generators, four times cheaper than diesel and natural gas engines, and eight times cheaper than a photovoltaic system, is becoming more and more popular in modern society. The Pico Hydro Power System (PHPS) has also become a hot topic due to its environmental friendliness and strong practicability [9,10,11,12].
The practices of the Rain Energy Harvesting System, Water Supply System, and other water infrastructure require new management strategies and solutions for energy recovery purposes, which need MHPS or PHPS to be innovative, cost-effective, and environmentally friendly. Installing a water turbine in a gravity pipe takes advantage of the excess and otherwise unutilized available hydraulic energy and converts it into electricity, without interfering in the water supply service and without having significant adverse environmental impacts [13]. After accumulating in a giant storage tank for a whole day, treated sewage is discharged to impact the hydro turbine with a high pressure and velocity [14]. An in-pipe hydro system can produce electricity by exploiting excess pressure of the water supply. It is able to operate across a broad range of head and flow conditions, and can be installed in an urban, industrial water supply grid, as well as waste drainage networks. This system has started being tested in several cities, such as Hong Kong and Portland [15].
The Rooftop Rainwater Harvesting System (RRHS) is quite promising and has been proposed as one of the techniques that can be employed for rainwater utilization, including rain harvesting, energy accumulation, energy generation, and the secondary use of available rainwater. Hydroelectric generation, as the core part of the system, provides a mechanism of converting solar into electrical energy with the aid of water circulation, and is a perpetual energy source combined with green energy technology widely applied in multi-story buildings and high-rise buildings, especially for populated communities [16]. Scholars have contributed to studies of RRHS from different perspectives. Monteiro, based on an estimation of the turbine performance, maximized the energy production by giving the available head and flow rate values over one year for a specific energy recovery technology [17]. Alnaimi demonstrated that the stability of RRHS can be guaranteed by force analysis to help select durable material under pressure. The result of stress-strain on the structure caused by an external force, internal water pressure, and hammering can be obtained by simulation [18,19]. In order to accumulate rainwater, a water storage tank installed on rooftops has been proposed by most scholars. Subsequently, tanks on a ground level have also been proposed to store rainwater and pump rainwater from the ground to roof for producing electricity during high peak demands on non-rainy days [20]. However, the power pump consumption cannot be made up by turbine production. Moreover, the installation of water tanks uses up available space, as well as increases the quantity of construction work and investment, resulting in an application that is significantly difficult. Besides, considering the function of discharging water automatically, a water level sensor and a valve the sensor actuated need to be installed, which leads to more investment and adds complexity [5]. On the whole, the studies on energy potential in rainwater are very few, do not highlight and optimize calculations, and mostly focus on selection of the turbine type and the installation of water tanks, without discussing novel energy harvesters of rain.
The turbine is an important part of the Rooftop Rainwater Harvesting System that most literature has related to harvest rain energy, with a focus on hydropower, and broadly classified into impulse and reaction turbines. Impulse turbines have a high efficiency area at a high head and low flow and generally include the Pelton turbine and Turgo turbine. Reaction turbines perform well on a low head and high flow and have primary types, such as the Francis turbine and Kaplan turbine [21]. Selection of the turbine requires a comprehensive consideration of the head and designed flow. Based on an experimental analysis and theoretical prediction, a simple reaction turbine with a smaller diameter tends to rotate faster, generating more energy [22]. Moreover, a further study confirmed that a simple reaction turbine can operate under a very low hydro-static head to achieve a high conversion efficiency with a very small diameter [23]. Cobb [24] compared two types of impulse water turbine for pico-hydropower—the Turgo turbine and Pelton turbine. The greatest difference is that the Turgo turbine can handle a significantly higher flow rate, allowing for an efficient operation at lower head ranges than the Pelton turbine. For a given low head and variable flow specification, Williamson proposed a new methodology based on quantitative and qualitative analyses to select a pico-hydro turbine, rather than traditional views based on a specific speed of a water turbine [25]. As for the generator, an induction generator is a great choice for a micro-hydropower system due to its low cost, small size, and self-production against overloads and circuits. Bhargav [26] presented a generator that can be replaced by a dynamo, which might allow for a greater efficiency. Research on the performance of turbines and generators is extensive and comprehensive, so this article will not discuss it further.
Siphonage is a kind of force produced by a water level difference, whose essence is caused by atmospheric pressure. A siphon is mostly applied in building drainage, municipal drainage, and water engineering. With the development of interdisciplinary research, siphonage has been well-applied in many fields in recent years. Furushima [27] replaced the traditional auxiliary pumping device with a siphon cooling device as a cooling water system of a photovoltaic model, producing an obvious result in energy conservation. Lu [28] introduced continuous siphonage flow as a renewable fluid driving force to improve the detection reproducibility for trace analytes in quantitative and sensitive assays.
In this study, a novel methodology for capturing energy from rainwater is proposed and the Rain-Power Utilization System is developed. Rain is collected on rooftops, taking advantage of large roof areas without building other rainwater harvesting devices. Secondly, it presents the feasibility of designing several hydro energy conversion units connected vertically in series and installed in an original rainwater down pipe, realizing electricity production simultaneously and repeatedly. In addition, further work focuses on the relationships among physical and dimension parameters, including the instantaneous velocity, volume flow rate, power, and time variation with head in the pipe, which are described in the form of theoretical formulations. Different design conditions are constructed by changing the dimension parameters. A kind of simplified optimization algorithm is proposed to find the optimal height combination (hu, hd), with a consideration of the maximum instantaneous power under the constraint of a permitted vacuum and maximum energy generation per unit length. Finally, a reduced-scale model prototype has been developed and tested. The experimental data obtained are compared with a theoretical calculation to prove the feasibility and rationality of the design and to introduce the reduction coefficient used in the equation of the practical annual power generation of high-rise buildings.
2. Methodology
2.1. System Composition and Structure
The overall framework of the Rain-Power Utilization System is shown in Figure 1, which is composed of two subsystems—an initial rainwater disposal system and a multistage energy conversion system—and further subdivided into six parts, including rainwater harvesting on a rooftop, initial rainwater separation and discharge, energy accumulation, power generation, power utilization, and rainwater reclamation. All six parts are represented in the diagram in the form of a rounded rectangle symbol. Studies and technologies of micro-hydro power and pico-hydro power have been well-established, and different schemes have been proposed to improve the availability of power utilization and rainwater recycling. Accounting for the utilization potential and considerable energy in rainwater, this paper attempts to propose an innovative solution based on high-rise buildings for alleviating the energy crisis and developing new energy.
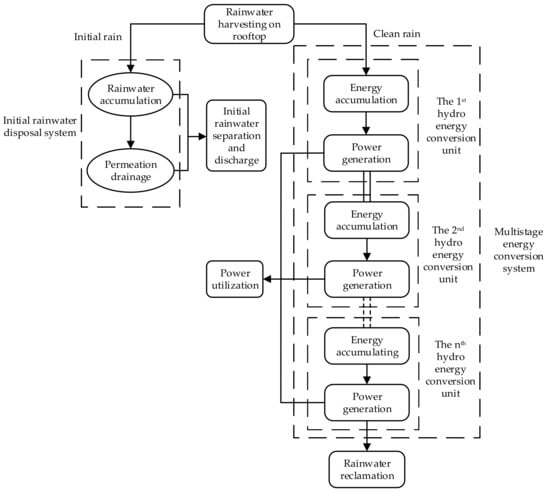
Figure 1.
Overall framework of the Rain-Power Utilization System, including two subsystems and six parts.
Given the advantages of both height and area, the rooftop of a building, as a naturally available rain harvesting platform, can collect scattered rainwater with the aim of energy concentration. It is notable that the initial rainwater collected from rooftop catchments, due to the poor quality affected by the atmosphere and catchment surface, cannot be used to generate power directly and is generally discarded. To begin with, rain flows into the initial rainwater disposal system shown on the right side of Figure 2a via a rainwater hopper. On completion of the separation and discharge of initial rain, comparatively cleaner rainwater, via an inclined pipe, flows to a multistage energy conversion system composed of several identical hydro energy conversion units connected in series. Each unit is composed of a storage pipe, a siphon pipe placed inside the storage pipe, an exhausted pipe, and a hydro turbine, as shown in Figure 2b. Rainwater first accumulates in the storage pipe, until the water level exceeds a specified height, which triggers siphonage and propels the water into the siphon pipe toward the turbine installed below the outlet of the siphon, so that the generator can be driven. The tail water flows down along the rainwater down pipe to the next storage pipe and repeats the same process until the last process is finished and the tail water is discharged. Furthermore, the exhaust pipe connects the outlet of the siphon pipe with the outside atmosphere, allowing for equalizing pressure. Electricity produced by the Rain-Power Utilization System is stored in batteries or directly used in lighting staircase bulbs and charging electric motorcycles after rectification. Captured rainwater is drained into a tank for reclamation and reuse, such as providing water for domestic, commercial, and industrial purposes, as well as groundwater recharge, greenbelt irrigation, and as an emergency supply for firefighting [18].
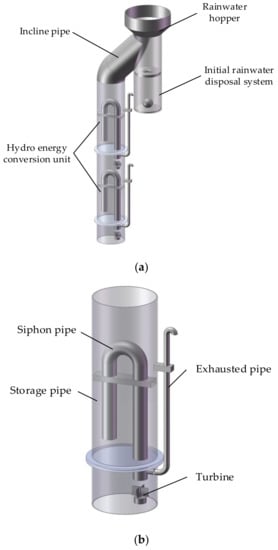
Figure 2.
Geometric model of the overall system: (a) Rain-Power Utilization System; (b) hydro energy conversion unit.
A floating ball is placed inside the split-flow pipe and matches the float valve switch on the pipe, as shown in Figure 3. Initial rainwater is accumulated in the split-flow pipe until the float valve switch closes automatically, marking the end of discharge. Clean rain flows into the storage pipe via the inclined pipe. Given the need for rainwater discharge in the split-flow pipe to make room for the next rain, a section of the circular sidewall made of epoxy resin microporous permeable material has a slow-permeable characteristic whose permeation rate is extremely low, but not equal to zero. The bottom closing proximity to the sidewall of the split-flow pipe is hermetically sealed and forms a dismountable structure to regularly clear silt and other debris.
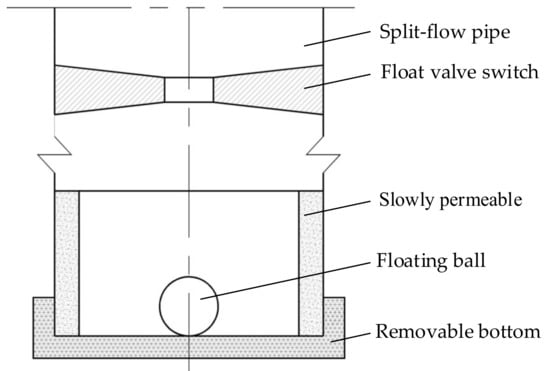
Figure 3.
Main body and local details of the initial rainwater disposal system.
A multistage energy conversion system is composed of several hydro energy conversion units, as shown as Figure 4. A siphon pipe whose longer side penetrates the partition plate in the next unit is fixed in the storage pipe by a bracket. To ensure the occurrence of siphonage and guarantee a smooth water flow, the exhausted pipe connects the outlet of the siphon pipe with the atmosphere. Generating devices, including a hydro turbine and generator, are installed under the siphon outlet. The adjacent storage pipes are separated and sealed by the partition plate and connected by the flang to form room independently of one another and accumulate rainwater in each unit, without interference.
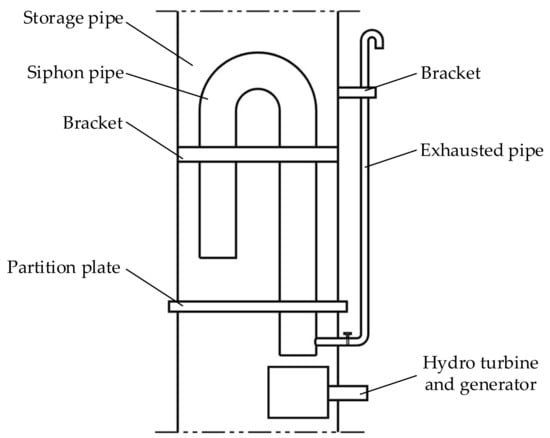
Figure 4.
Main body and local details of the hydro energy conversion unit.
As the core process of the Rainwater-Powered Utilization System, the operation principle of siphoning is as shown in Figure 5. The water level in the storage pipe continuously rises with rainwater accumulation until the water rises to the top of the siphon pipe. Due to siphonage, rainwater flows from the short end of the siphon to the long end at a high speed to strike the hydro turbine vertically. Subsequently, this portion of water is accumulated in the next storage pipe as well, and the same process will be repeated until the last one. There are a couple of orifices on the storage pipe wall higher than the top of the siphon pipe, which play an imperative role in maintaining a normal pressure for producing a smooth flow and mitigation of the rainwater load in the case of excessive rainfall. Remarkably, rather than discharging all of the water completely between siphoning, a section of the permanent water layer on the bottom is reserved parallel to the short end of the siphon pipe, so as to rapidly meet the demands for water accumulation and energy generation efficiently.
Figure 5.
Introduction to the working principle, application to energy accumulation, and conversion of the siphon: (a) The permanent water layer on the bottom is reserved; (b) the water level in the storage pipe continuously rises with rainwater accumulation; (c) siphonage is triggered when the water rises to the top of the siphon pipe; (d) rainwater flows from the short end of the siphon to the long end at a high speed to strike the hydro turbine vertically.
2.2. Geometric Dimensions
In terms of the siphon pipe, as a crucial part of the hydro energy conversion unit, the difference in height between the inlet, outlet, and top has an essential impact on the head loss. The gross head is closely related to the flow velocity, volume flow rate, generation capacity, and efficiency, and is ultimately determined by water level variation in the storage pipe. A vacuum, as the driving force of siphoning, under the limitation of maximum suction, exists throughout the siphon pipe and reaches the maximum value at the top. Consequently, for a rather better running performance, the optimum dimensions of the hydro energy conversion unit are supposed to consider both the generating efficiency and the maximum vacuum in the siphon pipe.
The height dimensions of a simplified siphon pipe are shown in Figure 6. h1 is the height difference between the short end, i.e., the 1-1 cross-section and water surface in the storage pipe, and h2 is from the water surface to the top of the siphon pipe. The difference in height between the 1-1 cross-section and top is denoted by hu, hu = h1 + h2; similarly, between the inlet and outlet of the siphon pipe, corresponding to the 1-1 cross-section and 3-3 cross-section, is denoted by hd. The total height of the siphon pipe is (hu + hd). The lengths of straight pipes on both sides are lt and lg, with lt < lg.
Figure 6.
Height marks and cross-sections marked in a simplified siphon pipe.
Unplasticized polyvinyl chloride (uPVC) pipes have been widely implemented in drainage systems owing to their appreciable advantages of a high strength, corrosion resistance, anti-scaling ability, long-term durability, and low cost [29,30]. uPVC has been selected as the material of both the storage pipe and the siphon pipe, whose geometric dimensions are presented in Figure 7. The dimensions of the original rainwater down pipe are not changed, and the inner diameter, D1, and outer diameter, D2, are equal to 105 mm and 110 mm. For the siphon pipe, the inner diameter, d1, outer diameter, d2, and turning radius, R, are 28 mm, 30 mm, and 35 mm, respectively. Consequently, the distance between the inner wall of the storage pipe and the outer wall of the siphon pipe is 2.50 mm.
Figure 7.
Local geometric dimensions of the siphon pipe and the storage pipe.
2.3. Variable Parameters
As the inner wall of uPVC pipes is extremely smooth, the friction loss coefficient is calculated by an explicit formula belonging to the turbulent smooth region [31,32]. Friction loss always exists throughout the pipes and finally results in head loss. Hence, it is of great significant to take the internal flow solution into account.
where Re is the Reynolds number at the maximum flow velocity and the minimum resistance, whereby Re = 10−4 and λ = 0.00184.
Local head loss exists at the inlet and bend of the siphon pipe, whose local resistance coefficients are ζin = 0.464 and ζ180 = 1.400.
From the beginning of the siphon, the head (h1 + hd) will drop continuously over time, causing changes in the flow velocity, volume flow rate, and power, constantly. Furthermore, all parameter changes arise from h1, and are directly impacted by and varied with variable h1. Both the volume flow rate and flow velocity of the incompressible fluid in the siphon pipe are constant everywhere at the exact same moment, as the diameter of pipes is constant. The average velocity of the 3-3 cross-section, i.e., the siphon outlet, can be obtained by setting up and transforming Bernoulli’s Energy Equation relating to cross-sections 1-1 and 3-3, presented as Equation (2):
where α3 is the kinetic energy correction factor of the 3-3 cross-section.
Based on Equation (3), the other parameters, such as the instantaneous flow, Q, instantaneous power, P, and time, ti, varied with h1, are presented in Equations (3)–(5):
where As is the flow area of the storage pipe and a is the value of h1 at time t (0 ≤ a ≤ hu).
As one of the necessary conditions for realizing siphoning, it is unreasonable and not allowed for the maximum vacuum occurring at the top of the siphon pipe to be over the permitted vacuum. By adopting the absolute pressure, the Bernoulli Equation relating to cross-section 1-1 and cross-section 2-2 is set up. The vacuum Hp of cross-section 2-2 is obtained, with 1-1 cross-section chosen as the reference plane, and simplified as Equation (6):
where α2 is the kinetic energy correction factor of the 2-2 cross-section, Pa is the atmospheric pressure, P2 is the absolute pressure of the 2-2 cross-section, γ is the volume-weight of water, and ζ90 is the local head loss of the 90 degree bend pipe.
Equation (6) confirms that the vacuum in the siphon pipe is also varied with h1, and has function relations with variable h1.
2.4. Optimization Algorithm
By analyzing the above Equations (4) and (6), the maximum instantaneous power, Pmax, is obtained when h1 = hu. Similarly, the minimum instantaneous power, Pmin, occurs at h1 = 0 and the maximum vacuum, Hpm, occurs at h1 = 0.
where α3 is the kinetic energy correction factor of the 3-3 cross-section and α2 is the kinetic energy correction factor of the 2-2 cross-section.
The relationships among the maximum instantaneous power, Pmax, minimum power, Pmin, maximum vacuum, Hpm, and heights hu and hd are shown in Figure 8a,b,d. Nevertheless, the variation trends of instantaneous power Pmax and Pmin are converse when hu is changing. Totally different optimization results are obtained according to Pmax and Pmin, separately, and neither is representative. For a given hu and hd, the integral of instantaneous power in variable h1 from the beginning to end of siphoning is introduced as Pint to assess the system power, which is more accurate and representative than Pmax and Pmin. Pint varies with hu and hd, as shown in Figure 8c.
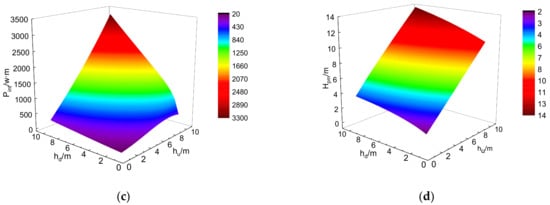
Figure 8.
Relationships among Pmax, Pmin, Pint, and Hpm vs. hd and hu: (a) The maximum instantaneous power, Pmax; (b) the minimum instantaneous power, Pmin; (c) the integral of instantaneous power, Pint; (d) the maximum vacuum, Hpm.
The average power of the system and energy efficiency will increase with a rather higher instantaneous power. The vacuum at the top of the siphon pipe is commonly not allowed more than 8.0–9.0 m head.
In order to obtain an optimum model and simplify algorithm implementation, since the complex relationships between variables are difficult to solve, both hd and hu have values from 1 to 10 in steps of 0.5 to form arithmetic sequences, separately. Pint and Hpm, corresponding to the values in sequences, are obtained by the calculations in Equations (9)–(10). The results are listed in Table 1 and Table 2, only from 3.0 m to 8.0 m, as the entire dataset is too large to present. The optimum values of hd and hu should be selected with the maximum Pint under the limitation of the permitted vacuum.

Table 1.
Integral of instantaneous power, Pint, at different hu and hd.
Table 2.
Maximum vacuum, Hpm, at different hu and hd.
For each given hd, all values of Pint and Hpm are calculated in turn within Equations (9) and (10). Under the constraint of the maximum vacuum Hpm ≤ 8 m, the combination (hu, hd) corresponding to the maximum Pint is selected as the optimal height combination. For instance, when hd = 7.0 m, all values of Pint and Hpm can be calculated as shown in Figure 9, in order to select the maximum Pint meeting the condition of Hpm ≤ 8 m. For hd = 7.0 m, hu = 5.0 m is the best choice and the height combination (7.0, 5.0) is finally screened.
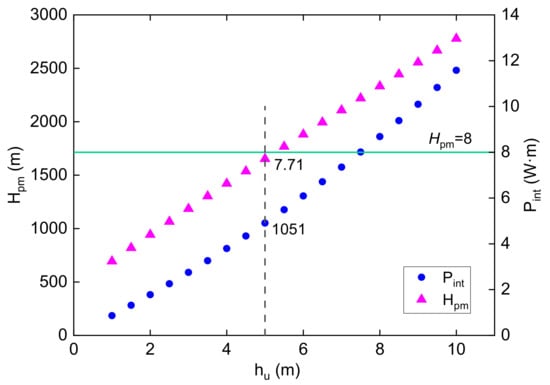
Figure 9.
Simplified algorithm that can be used to select the optimal height combination (hu, hd) when hd = 7 m.
All values of hd in the arithmetic sequence are traversed, and 19 optimal combinations (hu, hd) are screened by the above algorithm. They are the result of preliminary screening and optimization and listed as follows: (1.0, 7.0), (1.5, 7.0), (2.0, 6.5), (2.5, 6.5), (3.0, 6.5), (3.5, 6.0), (4.0, 6.0), (4.5, 6.0), (5.0, 5.5), (5.5, 5.5), (6.0, 5.5), (6.5, 5.0), (7.0, 5.0), (7.5, 5.0), (8.0, 5.0), (8.5, 4.5), (9.0, 4.5), (9.5, 4.5), and (10.0, 4.5).
For the 19 height combinations (hu, hd), the curve of the instantaneous power over time, P(t), is drawn, based on which relations between the instantaneous power and time with variable h1 are calculated. The energy generation of one siphon is obtained by an integral and denoted by Eo.
where tn is the end time of siphoning.
The height combination (4.5, 6.0), for instance, whose P(t) integral interval is 0–21.59, can generate energy Eo = 3195 J. The average energy generation per unit length of siphon pipe Em is calculated as Equation (12):
Similarly, Em for all combinations is calculated and scatter plots are drawn with the results, as illustrated in Figure 10. The height combination (4.5, 6.0) with the maximum Em = 304.34 J/m is selected, whereby hd = 4.5 m and hu = 6.0 m, which is the result of further screening and optimization.
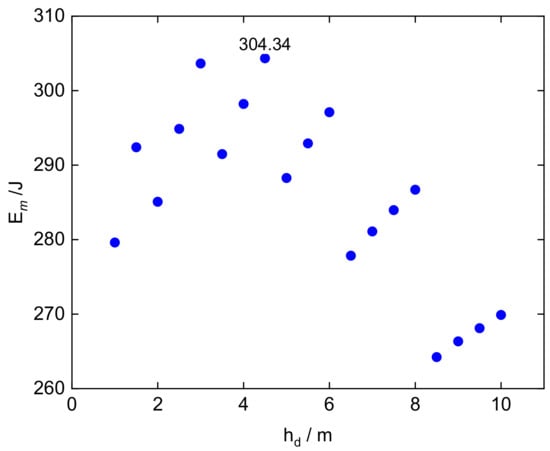
Figure 10.
Average energy generation per unit length Em at different height combinations (hu, hd).
The above process is an overview of the simplified optimization algorithm used to select the optimum model, and presented in the flow chart in Figure 11. Based on the process, considering the maximum energy generation as the ultimate goal, the main dimension parameters of the hydro energy conversion unit are determined and listed in Table 3.
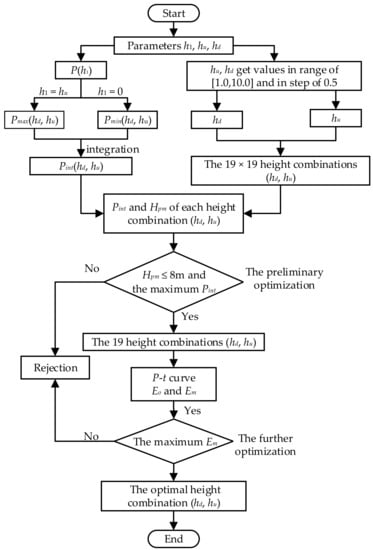
Figure 11.
Flow chart of the simplified optimization algorithm used to select the optimum model and optimal height combination (hd, hu).
Table 3.
Main dimension parameters of the hydro energy conversion unit.
3. Empirical Results
3.1. Experimental Scheme and Design
According to the Rain-Power Utilization System, the experimental prototype developed in proportion is shown in Figure 12.
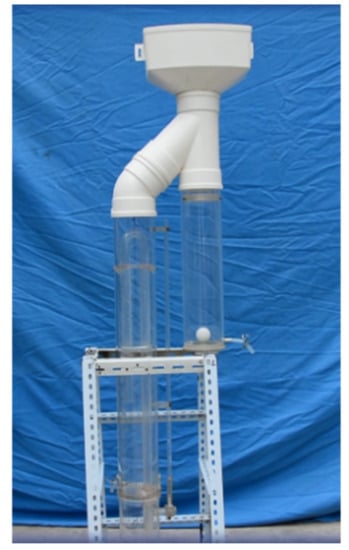
Figure 12.
Experimental prototype of the Rain-Power Utilization System developed in proportion.
In order to observe the process of initial water discharge, energy generation, and siphoning clearly, the split-flow pipe, water storage pipe, and siphon pipe are made of transparent Perspex. The floating ball is replaced by a table tennis ball, and rainwater is simulated by water with an appropriate velocity. The hydro turbine, generator, and LED light were installed below the outlet of the siphon, forming a loop.
After the split-flow pipe is full and the water valve switch is turned off, the water flows into the storage pipe via the incline pipe and rises to the maximum water level, i.e., the top of the siphon, beyond which, siphonage is triggered. It is significant that water flowing out of the short end of the siphon pipe drives the pico-turbine and lights up the LED light to prove the reasonability and verify the feasibility of the device.
3.2. Instantaneous Flow Rate Measurement
This part seeks to experimentally validate the consistency in the instantaneous flow rate for both the theoretical calculation and experimental results. Regarding the ease of operation and accuracy of tests as the basic requirement, while given the simplified method for calculation and the limitations of experimental devices, the calculated volume, Vc, and metrical volume, Ve, are directly compared.
The starting point and end point are the times when the water level in the storage pipe is flush with the top and short end of the siphon pipe, respectively. The vertical height from the start point to end point is evenly divided into nine parts by 10 mark points, and each part is 0.05 m. The time, ti (i = 0, 1, 2... n), is recorded when the water level is as high as each mark point, and t0 is the time to start. By adopting the time-average method to measure the flow velocity, red points are marked at 0.01 m above and below each mark point, separately. For each mark point, the time when the water level drops from the red point to the other is Δti (i = 0, 1, 2, 3... 9). Three groups of experiments were carried out and the experimental data recorded are shown in Figure 13a.
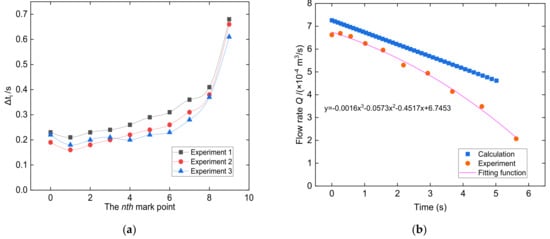
Figure 13.
Experimental result and comparison with calculated results for the flow rate, Q: (a) Three groups of experiments conducted to record the time and calculate Δti; (b) comparison of calculated and experimental results of the flow rate, Q.
The flow rate of each mark point, Qi, was calculated using Equation (13), where Δti is the average value of three groups of experiments. Based on the experiment and optimization algorithm, the scatter diagram (ti, Qi) and Q-t curve were compared, as shown in Figure 13b.
The same trend in the volume flow rate can be seen for both the experiment and algorithm. The water volumes Ve and Vc are equal to 0.0027 m3 and 0.003 m3 respectively, by fitting and integrating the scatter plot and curve, which can be used for error analysis.
3.3. Error Analysis and Correction
The deviation in flow rate between the measurement and calculation directly influences the magnitude of power, determines whether it can accurately evaluate energy generation, and is likely to result from system error and measuring error in the course of experiments, as well as ignoring fluid resistance and the deviation in calculation. Considering the requirement that two kinds of data results need to match each other better to elevate the precision of experiments, the reduction coefficient, ηr, is proposed and is equal to (Vc − Ve)/Vc = 10%. Since the roughness of the prototype device for the Rain-Power Utilization System is smaller than the experimental device, the reduction coefficient is equal to ηr = 92%. Hence, the optimal actual energy generation is Ea = Eo × ηr = 2939.95 J.
4. Discussion
High-rise buildings for residential purposes have an average height of more than 27 m above the surface [30]. The Rain-Power Utilization System is composed of several hydro energy conversion units connected in series. The total annual energy output of each rainwater down pipe is used to multiply the energy output of the hydro energy conversion unit by the number of units connected in series, and the number of units is employed to divide the height of the building by the height of the unit. The Pico Pelton wheel turbine is considered as a generating device of the system. The electricity production equation is modified by efficiency coefficients.
where Vy is the annual total volume of rain, Vo is the maximum volume of the storage pipe, A is the roof area of the harvested rainwater, h is the annual rainfall depth, the mean runoff coefficient is denoted by ψ, equal to 0.9, α is the seasonal reduction coefficient, equal to 0.7, β is the initial runoff coefficient, equal to 0.94, ηr is the reduction coefficient, equal to 0.92, ηe is the generator efficiency, equal to 0.8, and ηt is the turbine efficiency, equal to 75%, considering that the low head and water head cannot be fully used [33].
The annual total electricity production of the Rain-Power Utilization System is
where H is the height of the building, no is the number of units, and hsto is the height of the storage pipe.
5. Conclusions
Based on the rainwater down pipe of high-rise buildings, the Rain-Power Utilization System was designed and is composed of an initial rainwater disposal system and energy conversion system. According to theoretical analysis and experimental research, the main conclusions that can be drawn are as follows:
- (1)
- Rain harvesting on rooftops has great potential energy, without taking up extra space. A hydro energy conversion unit connected in series is suitable for high-rise buildings, achieving power generation with rainwater.
- (2)
- The function relations among the flow velocity, flow rate, and power with the dimensions of the siphon pipe have been deduced, according to the theory of fluid mechanics. Considering the maximum Pint (integral of instantaneous power) under the limitation of the maximum vacuum, Hpm, and maximum Em (average energy generation per unit length of the siphon pipe), a kind of optimization algorithm has been proposed to find the model with the optimal height combination (6, 4.5).
- (3)
- After all of the physical and dimension parameters of a hydro energy conversion unit are determined, in theory, the total energy generation of one siphoning process is 3195.6 J. A small error exists between the calculation and experiment with the analysis of experimental data results. As a result, the reduction coefficient, ηr, is introduced to make the results accurate. Therefore, the actual energy generation of one siphoning process is 2959.95 J. It is of guiding significance for the practical application of the Rain-Power Utilization System to verify the feasibility of theoretical research and perform error analysis.
- (4)
- For high-rise buildings, the annual energy generation equation of the hydro energy conversion unit modified by the efficiency coefficient can be calculated. Additionally, for the Rain-Power Utilization System, the annual total electricity production can be obtained accordingly.
Author Contributions
Conceptualization, J.W.; methodology, J.W.; software, J.Y.; validation, J.Y.; formal analysis, J.W.; resources, J.W.; writing—original draft preparation, J.Y.; writing—review and editing, J.Y. and J.W.; visualization, J.Y.; project administration, J.W. All authors have read and agreed to the published version of the manuscript.
Funding
This research was funded by the National Key Research and Development Program of China, grant numbers 2018YFB0606101 and 2017YFC0211505.
Acknowledgments
We gratefully acknowledge the helpful suggestion by Yanyan Ding, Wei Wang and Boyan Jiang from School of Energy and Power Engineering, Huazhong University of Science and Technology. We would also like to thank College of Water Resources and Architectural, North West Agriculture and Forestry University.
Conflicts of Interest
The authors declare no conflict of interest.
References
- Helseth, L.E.; Wen, H.Z. Evaluation of the energy generation potential of rain cells. Energy 2017, 119, 472–482. [Google Scholar]
- Wong, V.K.; Ho, J.H.; Chai, A.B. Performance of a piezoelectric energy harvester in actual rain. Energy 2017, 124, 364–371. [Google Scholar]
- Zheng, L.; Lin, Z.H.; Cheng, G.; Wu, W.Z.; Wen, X.N.; Lee, S.M.; Wang, Z.L. Silicon-based hybrid cell for harvesting solar energy and raindrop electrostatic energy. Nano Energy 2014, 9, 291–300. [Google Scholar]
- Duan, J.L.; Duan, Y.Y.; Zhao, Y.Y.; Wang, Y.L.; Tang, Q.W.; He, B.L. Bifunctional polyaniline electrode tailored hybridized solar cells for energy harvesting from sun and rain. J. Energy Chem. 2018, 27, 742–747. [Google Scholar]
- Sarkar, P.; Sharma, B.; Malik, U. Energy generation from grey water in high raised buildings: The case of India. Renew. Energy 2014, 69, 284–289. [Google Scholar]
- Archetti, R. Micro Hydroelectric Power: Feasibility of a Domestic Plant. Procedia Eng. 2011, 21, 8–15. [Google Scholar]
- Alexander, K.V.; Giddens, E.P. Microhydro: Cost-effective, modular systems for low heads. Renew. Energy 2008, 33, 1379–1391. [Google Scholar]
- Maher, P.; Smith, N.P.A.; Williams, A.A. Assessment of pico hydro as an option for off-grid electrification in Kenya. Renew. Energy 2003, 28, 1357–1369. [Google Scholar]
- Saket, D.R.K.; Varshney, L. Self Excited Induction Generator and Municipal Waste Water Based Micro Hydro Power Generation System. Int. J. Eng. Technol. 2012, 4, 282–287. [Google Scholar]
- Nouni, M.R.; Mullick, S.C.; Kandpal, T.C. Providing electricity access to remote areas in India: Niche areas for decentralized electricity supply. Renew. Energy 2009, 34, 430–434. [Google Scholar] [CrossRef]
- Chuan, T.; Jobli, M.; Saleh, A.; Malong, R.; Zaini, M.; Abdullah, M.; Jaffar, M.; Ali, M. Renewable energy potential from micro hydro for techno-economic uplift–a brief review. Int. J. Res. Rev. Appl. Sci. 2011, 7, 368–372. [Google Scholar]
- Bashir, A.; Lehtonen, M. Optimal Coordination of Aggregated Hydro-Storage with Residential Demand Response in Highly Renewable Generation Power System: The Case Study of Finland. Energies 2019, 12, 1037. [Google Scholar] [CrossRef]
- Ramos, H.M.; Kenov, K.N.; Vieira, F. Environmentally friendly hybrid solutions to improve the energy and hydraulic efficiency in water supply systems. Energy Sustain. Dev. 2011, 15, 436–442. [Google Scholar] [CrossRef]
- Ibrahimi, N.; Gebremedhin, A.; Sahiti, A. Achieving a Flexible and Sustainable Energy System: The Case of Kosovo. Energies 2019, 12, 22. [Google Scholar]
- Casini, M. Harvesting energy from in-pipe hydro systems at urban and building scale. Int. J. Smart Grid Clean Energy 2015, 4, 316–327. [Google Scholar] [CrossRef]
- Shaleen, M.; Shrivastava, K.K. Feasibility of Rainwater Harvesting in High rise Building for Power Generation. IJETT 2013, 4, 522–527. [Google Scholar]
- Monteiro, L.; Delgado, J.; Covas, D.I.C. Improved Assessment of Energy Recovery Potential in Water Supply Systems with High Demand Variation. Water 2018, 10, 773. [Google Scholar]
- Alnaimi, F.; Ziet, F. Design and development of mini hydropower system integrated for commercial building. AIP Conf. Proc. 2018, 2035, 070006. [Google Scholar]
- Dehghani, M.; Riahi-Madvar, H.; Hooshyaripor, F.; Mosavi, A.; Shamshirband, S.; Zavadskas, E.K.; Chau, K.W. Prediction of Hydropower Generation Using Grey Wolf Optimization Adaptive Neuro-Fuzzy Inference System. Energies 2019, 12, 289. [Google Scholar] [CrossRef]
- Hu, B.W.; Sun, J.T.; Ding, L.J.; Liu, X.Y.; Wang, X.R. Dynamic Equivalent Modeling for Small and Medium Hydropower Generator Group Based on Measurements. Energies 2016, 9, 14. [Google Scholar]
- Zainuddin, H.; Yahaya, M.S.; Mat Lazi, J.; Basar, M.; Ibrahim, Z. Design and development of pico-hydro generation system for energy storage using consuming water distributed to houses. World Acad. Sci. Eng. Technol. 2009, 59, 154–159. [Google Scholar]
- Date, A.; Date, A.; Akbarzadeh, A. Performance Investigation of a Simple Reaction Water Turbine for Power Generation from Low Head Micro Hydro Resources. Smart Grid Renew. Energy 2012, 3, 239–245. [Google Scholar] [CrossRef]
- Date, A.; Date, A.; Akbarzadeh, A. Investigating the potential for using a simple water reaction turbine for power production from low head hydro resources. Energy Convers. Manag. 2013, 66, 257–270. [Google Scholar] [CrossRef]
- Cobb, B.R.; Sharp, K.V. Impulse (Turgo and Pelton) turbine performance characteristics and their impact on pico-hydro installations. Renew. Energy 2013, 50, 959–964. [Google Scholar] [CrossRef]
- Williamson, S.J.; Stark, B.H.; Booker, J.D. Low head pico hydro turbine selection using a multi-criteria analysis. Renew. Energy 2014, 61, 43–50. [Google Scholar] [CrossRef]
- Bhargav, M.M.S.R.S.; Kishore, R.V.; Anbuudayasankar, S.P.; Balaji, K. Power generation by high head water in a building using micro hydro turbine-a greener approach. Environ. Sci. Pollut. Res. 2016, 23, 9381–9390. [Google Scholar]
- Furushima, K.; Nawata, Y. Performance evaluation of photovoltaic power-generation system equipped with a cooling device utilizing siphonage. J. Sol. Energy Eng. Trans. Asme 2006, 128, 146–151. [Google Scholar] [CrossRef]
- Lu, F.; Mao, Q.; Wu, R.; Zhang, S.; Du, J.; Lv, J. A siphonage flow and thread-based low-cost platform enables quantitative and sensitive assays. Lab Chip 2015, 15, 495–503. [Google Scholar] [CrossRef]
- Zhang, Y.; Lin, Y.-P. Leaching of lead from new unplasticized polyvinyl chloride (uPVC) pipes into drinking water. Environ. Sci. Pollut. Res. 2015, 22, 8405–8411. [Google Scholar] [CrossRef]
- Marszal, A.J.; Heiselberg, P.; Bourrelle, J.S.; Musall, E.; Voss, K.; Sartori, I.; Napolitano, A. Zero Energy Building–A review of definitions and calculation methodologies. Energy Build. 2011, 43, 971–979. [Google Scholar] [CrossRef]
- Xiong, X.; Gui, T. The calculation of water head loss in siphon roof drainage system is discussed. Water Wastewater Eng. 2010, 46, 164–171. [Google Scholar]
- Fang, Q. Calculation of the Friction Factor for the Turbulent Flow in Straight and Circular. Pipes Pipeline Tech. Equip. 2005, 3, 32–33. [Google Scholar]
- Xu, G.; Zhang, L.; Li, K.B. Hydroelectric Power Station, 2nd ed.; China Water & Power Press: Beijing, China, 2008; pp. 120–123. (In Chinese) [Google Scholar]


© 2020 by the authors. Licensee MDPI, Basel, Switzerland. This article is an open access article distributed under the terms and conditions of the Creative Commons Attribution (CC BY) license (http://creativecommons.org/licenses/by/4.0/).