Abstract
In order to study the axial compression performance of the T-shaped multi-cavity concrete-filled steel tube shear wall, first, three specimens were designed to perform the axial compression test. Then three-dimensional finite element analysis by the ABAQUS software was used to obtain the axial bearing capacity of the shear wall with different parameters. According to the results of the finite element model, the computational diagram in the limit state was obtained. The diagram was simplified into the core concrete in the non-enhanced area that was not constrained by the steel tube and the core concrete in the enhanced area that was uniformly constrained by the steel tube. Finally, a new practical equation for calculating the axial bearing capacity of a multi-cavity concrete-filled steel tubular shear wall was deduced and proposed based on the theory of ultimate equilibrium. The calculation results of the proposed equation were in good agreement with the finite element results, and the proposed equation can be used in practical engineering design.
1. Introduction
In the development of high-rise buildings and super high-rise buildings, structures with better performance are needed to improve the bearing capacity of buildings [1]. The concrete-filled steel tube composite structure has emerged as a relatively new structure in the construction industry and has been widely used worldwide.
Many studies have been conducted on the circular and rectangular concrete-filled steel tube column. Han [2] and Ding [3] carried out an experimental study on the axial compression performance of circular concrete-filled steel tube short columns. Portoles [4] and Liu [5] conducted an experimental study on the bending performance of circular concrete-filled steel tube short columns. Serras [6] and Zhou [7] undertook experimental research on the seismic performance of circular concrete-filled steel tube short column. Ding [8] and Ozbakkaloglu [9] completed an experimental study on the axial compression performance of rectangular concrete-filled steel tube. Qu [10] and Wang [11] carried out an experimental study on the bending performance of a rectangular concrete-filled steel tube. Chen [12] and Xu [13] performed experimental research on the seismic performance of rectangular concrete-filled steel tube short columns. Zhang [14] investigated the hysteretic behavior of concrete-filled thin-walled steel tubular (CFTST) columns under seismic load. The experimental results indicate that the CFTST columns under an axial load level below 0.5 exhibited plum hysteretic loops with a slight pinching effect, better ductility, and energy dissipation capacity. For the shear wall, it has two important sources of dissipation that affect greatly its dynamic behavior, one is the interaction between the steel and concrete, while the other is the natural dissipative phenomena occurring inside the concrete itself due to the micro-cracks in it [15,16].
With the development of concrete-filled steel tube columns, a special-shaped concrete-filled steel tube column has been increasingly favored by many researchers and designers due to the advantages of avoiding column protrusions from walls and increasing room space [17,18,19,20]. However, the steel tube in a special-shaped concrete-filled concrete column has a weak constraint on the core concrete, and there is a negative angle in the cross-section. When the load is applied, the negative-angle portion may undergo large deformation and damage, which in turn leads to a decrease in the bearing capacity of the special-shaped steel tube concrete column. In particular, for a T-shaped column, the separation of the steel tube and concrete at the inner corner may prevent the two materials from fully functioning and the large width-to-thickness ratio of the steel plate may cause local premature buckling.
In recent years, great efforts have been made on a special-shaped concrete-filled concrete column. Huang [21] conducted an experimental study on the axial compression performance of five different ribbed and two unribbed T-shaped concrete-filled steel tube short column specimens and investigated the effect of the ribbed form on the mechanical properties of the T-shaped concrete filled-steel tube short column. The test results show that the installation of stiffeners improves the axial compression stiffness and axial compression bearing capacity of the T-shaped concrete-filled steel tube. Based on the elastic buckling theory of steel plate, Fu [22] proposed a technical measure and design method of setting a T-shaped stiffener in a rectangular concrete-filled steel tube column with large plate width and thickness, and a T-shaped stiffener was arranged along the steel tube wall lengthwise. Since the flange of the T-shaped stiffener is partly enclosed in the concrete, the joint working performance of the stiffener and the concrete can be fully utilized, and the local buckling performance of the steel tube wall can be greatly improved. In order to delay the local buckling of steel tubes and improve the restraint performance of steel tubes on concrete, Liu [23] welded tensile reinforcing bars on the inner surface of steel tubes. A modified fiber-based numerical modeling method was developed to study the specimens’ cyclic behavior, incorporating the effect of stiffeners on postponing the steel tube’s local buckling and the confinement for concrete. Yang [24] conducted an experimental study on the surface of the tube welded with bars to improve the axial compression performance of the T-shaped CFST (concrete-filled-steel tube) column. However, it is costly to stiffen the steel bar to the steel plate and fold the steel plate into a hollow tube with a special-shaped cross section.
To overcome the shortcomings of the traditional special-shaped concrete-filled concrete column, this paper proposes a new type of combined square steel tube concrete composite shaped shear wall and T-shaped concrete-filled steel tube shear wall (CFSTSW) to improve the bearing capacity and meet the requirements of fast construction speed.
Based on the renovation project of Hongxinyuan urban shantytown in Hongguang Town, the authors used the methods of experimental research and numerical simulation to study the axial compression performance of T-shaped multi-cavity CFSTSW and propose the axial compression bearing capacity equation. The results calculated by the proposed equation are in good agreement with those calculated by the finite element method and can be used in the actual engineering design.
2. Experimental Program
2.1. Specimen Design
Three T-shaped multi-cavity CFSTSW test specimens were designed and manufactured according to 1/5 of the original size, based on the reconstruction project of Hongxinyuan urban shantytown in Hongguang Town [25,26]. The project’s self-compacting concrete has achieved a clean use of energy [27].
First, two 10 mm-height steel plates, which were used as the top and bottom plates of the shear wall specimen, were processed. Then, the steel tube was produced and one end was welded with the bottom plate. Third, the concrete was poured and naturally cured inside the steel tube. Three days after the pouring of concrete, the other end of the steel tube was welded with the top plate. Finally, the concrete was naturally cured inside the steel tube for another 25 days.
The specific cross-sectional dimensions are shown in Figure 1, and the main design parameters of each specimen are shown in Table 1.
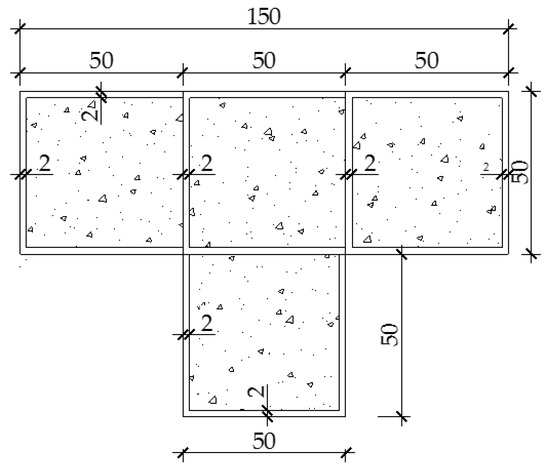
Figure 1.
Cross-sectional dimension of T-shaped four-cavity T-shaped concrete-filled steel tube shear wall (CFSTSW) (unit: mm).

Table 1.
Main design parameters of the test specimen.
2.2. Material Selection and Material Test
In this paper, self-compacting concrete with the strength grade C40 was used. The mechanical properties of the self-compacting concrete are shown in Table 2.
Table 2.
Concrete mechanical properties.
The nominal thickness of Q235 steel was 2 mm, and the unidirectional tensile test of the standard tensile specimen was carried out. The measured values of steel material are shown in Table 3.
Table 3.
Measured values of the steel material.
2.3. Loading System
The monotonic axial compression test with the loading mode of hinged at both ends was adopted, and preloading was first carried out to calibrate the instrument to ensure that the specimen was in the proper alignment of the testing machine.
The formal test as conducted according to the provisions of the standard for concrete structure test methods (GB/T 50152-2012). In the elastic stage, 1/10 of the estimated load is added to each stage. Then, 1/20 of the expected bearing capacity is taken for each load stage and the load is held for 1 min when the steel plate in the compression zone reaches the yield strain. When the test load reaches the peak load, it is changed to slow and continuous loading. When the load drops below 75% of the peak load, the load is stopped and the shear wall is considered to be broken.
3. Numbering Rules and Measuring Points for Specimens
In order to facilitate the description of the failure of shear wall specimens, this paper considered TA4-600 as an example to explain the numbering rules of specimens in detail. As shown in Figure 2, the shear wall was divided into four main surfaces in a clockwise direction. For example, “3” in the plane “3–2” represents the third principal surface, and “2” represents the second secondary surface of the third principal surface. All other shear wall specimens in the paper were numbered according to this rule.
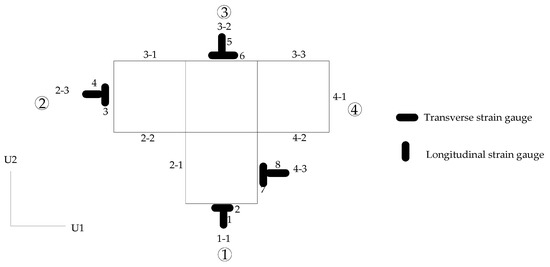
Figure 2.
Numbering rules and measuring points for specimens.
The test specimen had a total of eight measuring points, which were arranged in the steel tube surface at the middle height of specimen: “1–1” surface, “2–3” surface, “3–2” surface, and “4–3” surface, as shown in Figure 2.
4. Experimental Phenomena
4.1. TA4-600 Shear Wall Test Phenomenon
Before the beginning of the test, the measured specimen had an initial defect of an out-of-plane inclination 0.74°.
Before loading to 420.05 kN, there was no obvious bulge change in the test specimen TA4-600, but the angle of the out-of-plane tilt of the test specimen TA4-600 gradually increased. After loading to 420.05 kN, buckling phenomena appeared on the “2–3” surface of the test specimen (Figure 3a) and the “4–1” surface (Figure 3b). When the load reached 625.77 kN (peak load), buckling waves appeared on the “1–1” surface of the specimen (Figure 3c), “2–1” surface, “2–2” surface, “4–2” surface, and “4–3” surface. When the load dropped to 550.15 kN (Figure 3d), buckling waves appeared on the third surface of the specimen. With the continuation of the test, the multi-wave buckling phenomenon was more obvious, and the load decreased faster. When the load dropped to about 75% of the peak load, the downward trend of the test load slowed down.
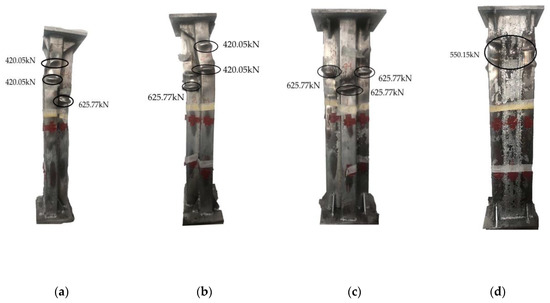
Figure 3.
Deformation pattern of (a) the second surface; (b) the fourth surface; (c) the first surface; (d) Table 4 test specimen.
Observing the final failure state of test specimen TA4-600, it can be seen that the bulging phenomenon of the steel tube appeared on all surfaces of the test specimen when the test was over. A buckling wave appeared on the “1–1” surface, “2–1” surface, and “4–3” surface, and the remaining two surfaces were all two buckling waves, and the buckling waves appearing on the “1–1”, “2–1”, and “4–3” surfaces were lower than those on the other surfaces. The reason may be twofold: one may be that the stiffeners were not welded on the “1–1”, “2–1”, and “4–3” surface, and the other may be caused by the initial defect. The welding seam between the chambers of the test specimen TA4-600 was good, and there was no phenomenon of welding seam cracking.
4.2. TA5-600 Shear Wall Test Phenomenon
Before the start of the test, there was an initially measured defect of the out-of-plane tilt of 0.96°. During the increase of the test load, the bulging phenomenon of the steel plates on each surface of the test specimen TA5-600 gradually changed. When the load reached 360.96 kN (48% of the peak load), there was no obvious change on all surfaces of the test specimen. When the load was applied to 360.96 kN, a buckling wave appeared about 50 mm from the top of the “1–1” surface, as shown in Figure 4a. This is because the inner partition is not welded to the end plate during the processing of the test specimen, the steel tube bears a large load in the initial stage, and the steel tube shows stress concentration at the part where the stiffener is not welded. As the load increases, the buckling phenomenon also appears on the remaining surfaces. When the load reached 476.16 kN (62% of the peak load), a buckling wave appeared on the “4–2” surface. When the load reached 599.81 kN (78% of peak load), buckling waves appeared on the “2–4” surface, as shown in Figure 4b. When the load reached 637.44 kN (83% of peak load) (Figure 4c), multi-wave buckling occurred in the middle of the web on the “4–1” plane (Figure 4d), and presented a step-like distribution from the lower left to upper right (Figure 4c). When the load reached 768.98 kN (peak load), the buckling phenomenon on all surfaces was more significant. When the load decreased, the buckling phenomenon on all surfaces further increased. When the load dropped to 653.63 kN (85% of peak load), the curve degree of the third surface, “4–3” surface, and “4–4” surface had a deeper curve degree, and there was a “Zi Zi” sound. At this time, the “silver powder” outside the steel tube continued to fall off, and the concrete was crushed. The final failure form of the specimen was observed, and the overall shape of the specimen was in a state of out-of-plane inclination. This is because the specimen TA5-600 had initial defects, and out-of-plane instability occurred during the loading of the specimen.
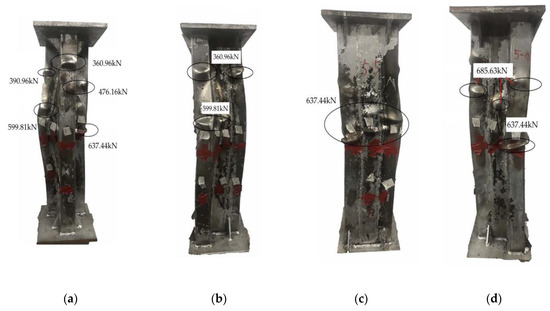
Figure 4.
Deformation pattern of (a) the first surface; (b) the second surface; (c) the third surface; (d) the fourth surface of TA5-600 test specimen.
4.3. TA6-600 Shear Wall Test Phenomenon
During the stage of load increase, the bulging phenomenon of the steel plates on the various surfaces of the test specimen TA6-600 gradually changed. The main reason is that when the load reached 429.39 kN (47% of peak load), there was no obvious change on all sides of the test specimen. When the load reached 429.39 kN, the top part of the test specimen TA6-600 appeared as steel plate buckling, and a slight bulging phenomenon began to occur at 30 mm from the top of the third surface, as shown in Figure 5a. When the load reached 475.07 kN, a buckling wave appeared on the first surface of the specimen, as shown in Figure 5b. When the load reached 439.52 kN (70% of the peak load), multi-wave buckling appeared from the lower left to the upper right of the surface of the specimen, as shown in Figure 5c. When the test load was loaded to 813.10 kN (peak load), a second buckling wave appeared in the middle of the steel plate web of the test specimen’s first surface and a continuous buckling wave appeared on the test specimen’s fourth surface, as shown in Figure 5d.
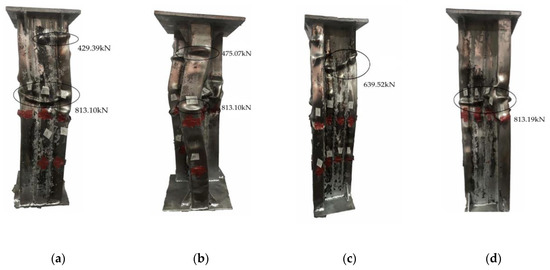
Figure 5.
Deformation pattern of (a) the third surface; (b) the first surface; (c) the second surface; (d) the fourth surface of the TA6-600 test specimen.
There was no welding seam tearing in the steel plate. It was observed from the final failure shape of the test specimen that the overall shape of the test specimen was tilted out of plane. This is because the test specimen TA6-600 had initial defects, and out of the plane instability occurred during the loading of the test specimen.
5. Axial Load–Strain Relationship Curve and Ductility Coefficient
The load-longitudinal strain curve of a multi-cavity concrete-filled steel tube can intuitively reflect the mechanical behavior of a concrete-filled steel tube. Figure 6 shows the load–strain curve of a T-shaped multi-cavity CFSTSW.
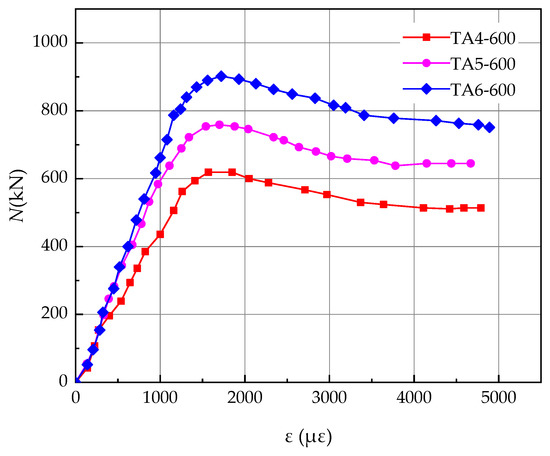
Figure 6.
Axial load–strain relationship curve.
The bearing capacities of the T-shaped multi-cavity CFSTSW for the test specimens TA4-600, TA5-600, and TA6-600 were 625.67 kN, 768.98 kN, and 913.60 kN, respectively.
Based on the test load–longitudinal strain curve, the peak load (the highest point of the curve) of the multi-cavity CFSTSW can be obtained, and the ductility coefficient u can be obtained by the drawing method.
Taking TA4-600 as an example, the method of calculating the ductility coefficient is described in detail, as shown in Figure 7.
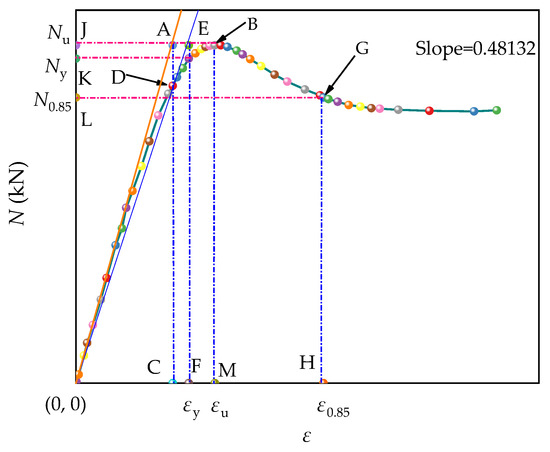
Figure 7.
Graphic illustration of geometric drawing.
First, we used the Origin software to make the load–longitudinal strain relationship curve of TA4-600, then used the plugin Tangent in Apps to make the load–longitudinal strain relationship curve through the origin tangent, and the line intersection tangent line parallel to the abscissa axis through point B with point A, extending AB to cross the ordinate axis at point J. The ordinate of point J is , and 85% of the peak load was taken. The parallel curve of AB is the cross section of the LG load–longitudinal strain curve at point G. The vertical line through point G crosses the axis of the abscissa at point H, the abscissa of point H is , the vertical axis through point A intersects the axis of abscissa at point C, the cross-load–longitudinal strain relationship curve at point D connects OD, extends OD on line AB, and crosses point E. The vertical axis through point E intersects the abscissa axis at point F, and the abscissa of point F is . is the peak strain. The expression of the ductility coefficient is expressed as:
Finally, the ductility coefficient of each test specimen is given in Table 4.
Table 4.
Ductility coefficient.
Table 4.
Ductility coefficient.
| No. | Specimen Number | Ny (kN) | Nu (kN) | Ny/Nu | Ductility Coefficient |
|---|---|---|---|---|---|
| 1 | TA4-600 | 594.39 | 625.67 | 0.95 | 2.27 |
| 2 | TA5-600 | 738.22 | 768.98 | 0.96 | 2.15 |
| 3 | TA6-600 | 886.19 | 913.60 | 0.97 | 1.79 |
It can be seen from Table 4 that the ductility coefficient of the multi-cavity CFSTSW specimen decreases with the increase in the number of cavities.
6. Load–Stress Relationship Curve
The partial strain data of the steel tube measured by the test were converted into corresponding transverse stress , longitudinal stress , and converted stress to obtain the axial load–stress relationship curve of the specimen, and the development law of the steel tube stress during the entire loading process was analyzed to clarify the interaction mechanism between the steel tubes and concrete. The conversion equations are shown in Equations (2)–(4).
In the elastic stage, the stress-strain relationship of steel conforms to Hooke’s law, namely:
In the equation, and are the transverse stress and strain of the steel, respectively.
In the elastoplastic phase, the elastoplastic incremental theory is used.
is the tangent modulus of the steel in the elastoplastic stage.
is the Poisson’s ratio at the elastoplastic stage of the steel.
In the plastic strengthening stage, the steel tube complies with the von Mises yield criterion.
is the transverse stress deviation of the steel.
is the lateral stress deviation of the steel.
is the mean stress of the steel.
p is a calculation parameter.
H is a calculation parameter.
is the mean stress of the steel.
Q is calculation parameters.
The test specimen TA4-600 was used as an example to illustrate the load–stress curve, as shown in Figure 8.
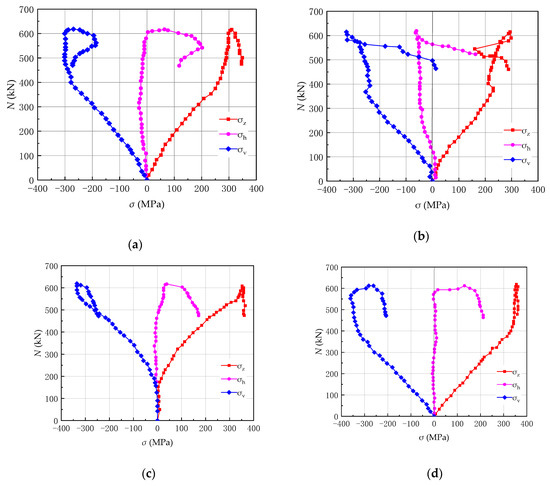
Figure 8.
Load–stress curve of (a) measuring point on “1–1” surface; (b) measuring point on “2–3” surface; (c) measuring point on “3–2” surface; (d) measuring point on “4–3” surface.
As shown from Figure 8a, in the initial loading, the lateral stress of the steel tube was almost zero, and the longitudinal stress was large and increased linearly with the increase in load. The Poisson’s ratio of concrete was smaller than that of steel, and the lateral expansion of concrete in the elastic stage was smaller than that of steel tubes, so the interaction between the steel tubes and concrete was small. After entering the elastoplastic stage, the lateral deflection of the test specimen increased, the concrete expanded, the steel tube began to be tensioned, the lateral stress gradually increased in the positive direction, and the restraining effect gradually manifested. After the test bearing capacity, the lateral deflection of the test specimen increased rapidly. As the load continued to increase, the transverse stress of the steel tube also increased rapidly, and the steel tube had a strong restraining effect on the concrete. As the load decreased, the longitudinal stress decreased somewhat. The stress development law of the remaining several measuring points was basically the same as that of the measuring point of the “1–1” surface. However, for the measuring points on the “2–3” surface, before the test bearing capacity, due to the buckling of steel tube near the measuring point, the steel tube at the location of the measuring point is compressed. The concrete expanded rapidly, and the steel tube began to be pulled. When the converted stress reached the yield strength, the steel tube yielded.
7. Establishment and Analysis of the Finite Element (FE) Model
7.1. Establishment of Finite Element (FE) Model
The finite element software ABAQUS was used to perform a finite element analysis of the axially compressed concrete filled steel tubular column.
For concrete, Contrafatto [28] studied the displacement–axial stress model of concrete under uniaxial load, but the constitutive model in the literature [29] can better simulate the stress state of concrete under the constraint of steel tubes.
In the equation:
where fcu is the compressive strength of concrete cube (MPa); fck is the standard value of concrete axial compressive strength (MPa); ξ is the height of the concrete limit relative to the compression zone; ε0 is the concrete hoop strain; fy is the steel yield strength (MPa); As is the area of the reinforcement (mm2); and Ac is the cross-sectional area of the concrete (mm2).
The expression for the stress–strain relationship of steel is described as follows:
In this equation:
The finite element model of the multi-cavity CFSTSW is shown in Figure 9.
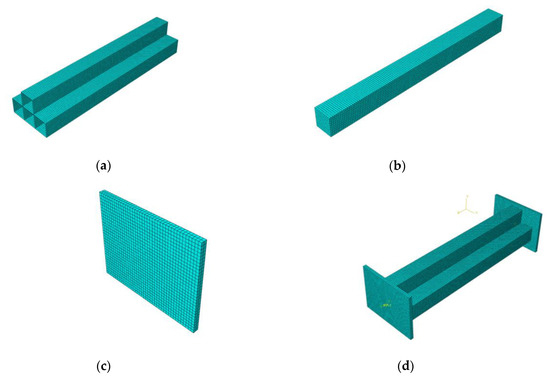
Figure 9.
Finite element (FE) model: (a) Multi-cavity steel tube component; (b) Concrete component; (c) End plate component; (d) Entire FE model.
The multi-cavity CFSTSW adopts a three-dimensional model, in which the steel tube adopts the S4R shell element and the concrete adopts the C3D8R solid element. Multi-cavity steel tube and concrete adopt surface-to-surface contact, normal contact adopts hard contact, tangential adopts the Coulomb friction model, the bottom end of the shear wall is fixed, and the loading end is free. During the processing and transportation of the multi-cavity steel tube, the surface of the steel tube may have initial defects such as local buckling, which may cause local buckling of the steel plate during axial compression, thereby reducing the load-bearing capacity of the specimen. For a perfectly ideal steel plate loaded only in the plane, theoretically, no local buckling will occur. However, in actual production, the production, processing, transportation, installation, and other processes of the steel plate will cause the initial geometric defects on the surface of the steel plate and cannot maintain the ideal state. To consider this defect in ABAQUS, the local buckling of the steel plate usually adds the initial defects to the finite element model, that is, performs eigenvalue buckling analysis of the specimen before the model calculation to obtain the first-order buckling mode of the specimen, and then applies the initial defect to the related node according to a certain proportion of the buckling mode of the model. In this paper, this ratio was taken as 1/1000 of the overall height of the test specimen.
7.2. Finite Element Results and Analysis
7.2.1. Axial Load–Strain Relationship Curve
Through the above modeling method, the finite element simulation of the shear wall specimen was carried out. It can be seen from Figure 10 that the simulation result obtained by the ABAQUS finite element model was close to the load–strain relationship curve obtained by the test, which shows that it is feasible to simulate the axial compression behavior of a multi-cavity concrete filled steel tube shear wall using the ABAQUS modeling method.
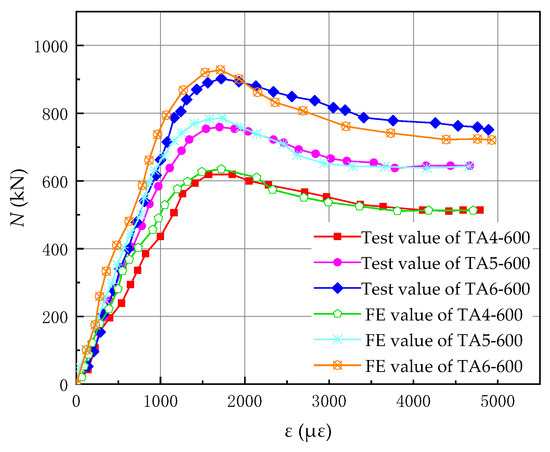
Figure 10.
Comparison of the load–strain curves between FE modeling and the test result.
7.2.2. Final Deformation of the Specimen
It can be seen from Figure 11 that the deformation the test specimen was concentrated in the middle of the test specimen, which is basically consistent with the deformation of the experimental specimen in Figure 3, Figure 4 and Figure 5. The deformation in Figure 3 was more concentrated in the middle and upper part, which may be caused by uneven concrete pouring and bias.
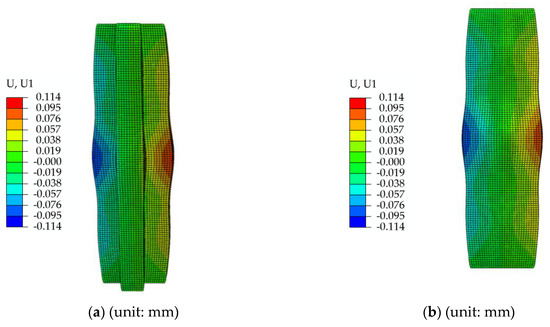

Figure 11.
Deformation diagram of the finite element model. (a) Front view in the transverse direction, (b) back view in the transverse direction, (c) front view in the longitudinal direction, and (d) back view in the longitudinal direction.
7.2.3. Steel Tube and Concrete Interaction
Figure 12 shows the longitudinal stress distribution cloud diagram of T-shaped concrete under different loads.
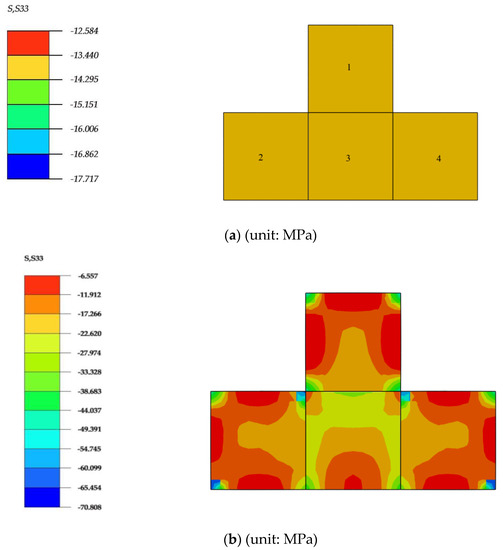
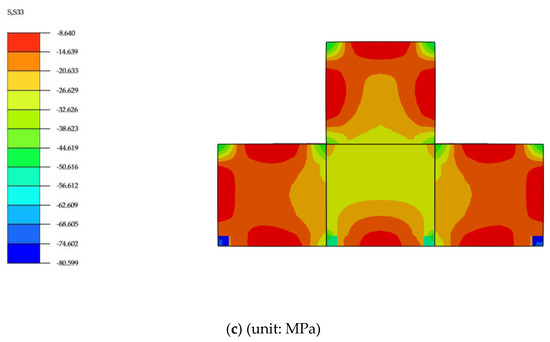
Figure 12.
Stress cloud diagram when the load reaches (a) 50% Nu; (b) Nu; (c) 80% Nu.
It can be seen from Figure 12a–c that the T-shaped concrete exhibited different longitudinal stress states under different axial loads.
From Figure 12a, we can see that when the axial load reached 50% of the bearing capacity, the longitudinal stress distribution of the T-shaped concrete was almost the same, and the stress at each point of the concrete was about 14 MPa. This is because the shear wall is in the elastic working stage at the beginning of loading, and the multi-cavity steel tube and concrete can be considered to be in a “bonded” state.
It can be seen from Figure 12b, when the axial load reaches the bearing capacity Nu, the longitudinal stress of concrete was largest in the area near the corner of the cavity, followed by each cavity at the center of the body, and the stress at the midpoint of each cavity web was the smallest. This is because the multi-cavity steel tube has an uneven constraint on the concrete: as the load continues to increase, the lateral deformation increases, and the concrete near the corner of the cavity enters the elastoplastic phase first. It can also be seen from Figure 12b that the longitudinal stress distribution cloud of the No. 1, No. 2, and No. 4 cavities of the T-shaped multi-cavity CFSTSW was similar, while there were different from No. 3 cavities. The reason is that the confinement area is mainly distributed at the corners of the cavity, and the No. 3 cavity occupies a larger enhanced area and a smaller non-enhanced area than the other cavity.
It can be seen from Figure 12c that when the axial load dropped to 80% of the bearing capacity, the longitudinal stress distribution of concrete was similar to that of Figure 12b, but there was some difference between them. The main difference is that the longitudinal stress distribution of concrete in the No. 3 cavity of the CFSTSW in Figure 12c was larger than that in Figure 12b. The reason is that the adjacent cavity concrete had been in a three-dimensional confining state during the extrusion process, and the confinement area of the No. 3 cavity of the CFSTSW in Figure 12c was relatively larger. The T-shaped multi-cavity CFSTSW still had a large bearing capacity and good ductility even when the shear wall was at the later loading stage and was largely deformed.
8. Bearing Capacity Equation Deduction
Using the finite element modeling method above, the bearing capacities of the multi-cavity CFSTSW with different concrete strength, steel yield strength, and steel content were obtained under the action of axial compression load. The calculated results are plotted in Figure 13.
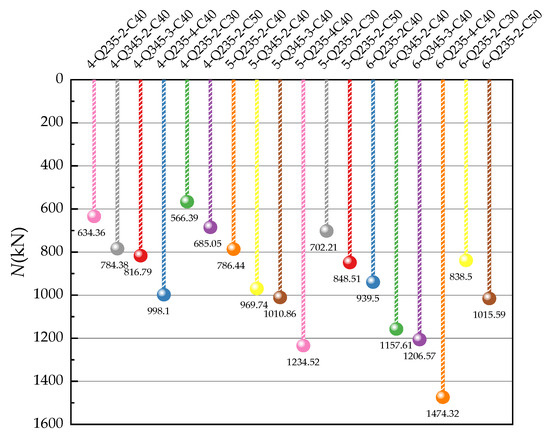
Figure 13.
Axial load capacity under different parameters.
The tick label in the x-axis of Figure 13 has its naming rule, taking “4-Q235-2-C40” as an example, 4 represents a four-cavity test specimen with the steel yield strength of 235 MPa, a thickness of 2 mm, and standard compressive strength of concrete of 40 MPa.
According to the literature [30], the average value of the ratio of the longitudinal compression stress of the steel tube to the yield strength of the steel tube is expressed as:
Among them, is the longitudinal compression stress of the steel tube, and is the yield strength of the steel tube.
According to the von Mises yield criterion, can be expressed as:
Among them, is the average value of the transverse stress of the steel tube under tension.
The multi-cavity steel tube mainly restrains the four corners and the center of the concrete. The reinforced area and the non-reinforced area can be derived according to the multi-cavity CFSTSW cloud map of the ABAQUS finite element analysis results. The calculation diagram is shown in Figure 14 where the semicircle of b is the length of a single cavity of a multi-cavity steel tube.
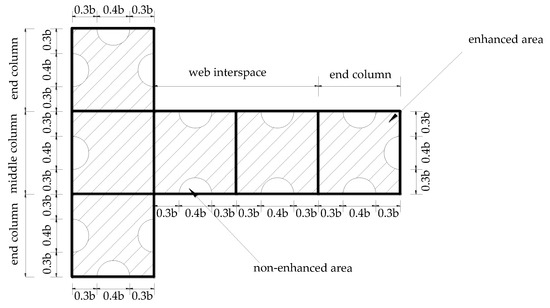
Figure 14.
Calculation diagram.
The concrete area of the non-enhanced area is expressed as:
The concrete area of the enhanced area is expressed as:
Among them, is the concrete area of the non-enhanced area; is the concrete area of the enhanced area, and is the concrete area.
Assuming that the lateral stress of the concrete in the non-enhanced area is not considered, it can be known from the limit equilibrium theory that the lateral restraint force received by the reinforced zone concrete and the lateral force received by the multi-cavity steel tube are in equilibrium. The relationship of the transverse stress of the concrete in the reinforced area can be expressed as:
where is the lateral restraint force of concrete in the non-enhanced area.
In the non-enhanced area, the axial compressive strength of concrete is approximately equal to the axial compressive strength fc of plain concrete. The axial compression strength of core concrete in constrained area is:
where is the axial compressive strength of the filled concrete in the enhanced area; k is the lateral compression coefficient, and the coefficient is 3.4 according to reference [31].
The T-shaped multi-cavity CFSTSW is divided into three parts: end column , middle column and web interspace . can be expressed as:
where is the axial compression bearing capacity of the end column. is the axial compression bearing capacity of the middle column. is the axial compression bearing capacity of the web interspace.
The axial bearing capacity of the end column is composed of three parts and can be expressed as:
The first part is the axial bearing capacity of the concrete in the non-enhanced area. The second part is the axial bearing capacity of the enhanced concrete. The third part is the axial bearing capacity of the multi-cavity steel tube.
Here, is the area of the non-enhanced area of the end column; is the axial compressive strength of the concrete of the end column; is the axial compressive strength of the concrete in the enhanced area of the end column; is the area of the enhanced area of the end column; is the longitudinal compression stress of the steel tube of the end column; and is the section area of the steel tube of the end column.
Substituting Equations (7)–(12) into Equation (14), can be simplified as:
The axial bearing capacity of the web interspace is composed of three parts and can be expressed as:
The first part is the axial compression concrete bearing capacity of the non-enhanced area. The second part is the axial bearing capacity of the enhanced concrete. The third part is the axial compression bearing capacity of the multi-cavity steel tube. Here, is the area of the non-enhanced area of the web interspace. is the axial compressive strength of the concrete of the web interspace. is the axial compressive strength of the concrete in the enhanced area of the web interspace. is the area of the enhanced area of the web interspace. is the longitudinal compression stress of the steel tube of the web interspace. is the section area of the steel tube of the web interspace.
Substituting Equations (7)–(12) into Equation (16), can be simplified as:
The axial bearing capacity of the middle column is composed of three parts and can be expressed as:
The first part is the axial compression bearing capacity of the non-enhanced area concrete. The second part is the axial bearing capacity of the reinforced concrete. The third part is the axial compression bearing capacity of the multi-cavity steel tube.
Here, is the area of the non-enhanced area of the middle column; is the axial compressive strength of the concrete of the middle column; is the axial compressive strength of the concrete in the enhanced area of the middle column; is the area of the enhanced area of the middle column; is the longitudinal compression stress of the steel tube of the middle column; and is the section area of the steel tube of the middle column.
Substituting Equations (7)–(12) into Equation (18), can be simplified as:
Substituting Equations (15), (17) and (19) into Equation (13), can be expressed as:
The calculated value by Equation (20) was about 18% larger than the test value. The main reason is that, first of all, the initial defects of the multi-cavity steel tube were not considered in the calculation. In the process of processing and transportation, the tube will be irregularly deformed due to manual cutting errors, welding, and collisions, and there are certain initial defects. As a result, the bearing capacity of the shear wall specimen is reduced. Second, the weld effect of the steel tube was not considered. Third, due to the limitation of the size and the complex shape of the specimen, the concrete pouring compactness could be affected to some extent, so the correction coefficient of 0.82 was introduced.
Considering the correction coefficient, finally, can be expressed as:
The calculated bearing capacity results by Equation (21) and the finite element simulation under different parameters are shown in Appendix A. The calculated results by the equation were in good agreement with the finite element results, the error between them was less than 4% and can therefore meet the requirements of actual engineering. Thus, the equation can provide references for the design of such components in actual engineering.
For the calculation equation of the axial compression bearing capacity of the concrete-filled steel tube column, the widely used design codes mainly include the American code (ANSI/AISC 341-10) [32] and the European standard EC4 (2004) [33]. These design codes consider the bearing capacity of the CFST column as the simple sum of the bearing capacities of the concrete and the steel tube, without considering the interaction between the steel tube and the concrete as well as the uneven constraint of the steel tube on the concrete. The equation established in this article considers the interaction between the steel tube and concrete and the uneven constraint of the steel tube on the concrete as well as the number of cavities of the multi-cavity steel tube, so it is more complicated and accurate to calculate the axial compression bearing capacity of a T-shaped multi-cavity CFSTSW when compared with the American code and the European standard. However, only three T-shaped multi-cavity CFSTSW test specimens were designed and were manufactured according to 1/5 of the original size in this paper, so the deduced equation and reduction coefficient in the proposed equation may be improved later through full-scale experiments and more test specimens.
9. Conclusions
In this study, a series of axial load tests and ABAQUS finite element simulation were carried out on the T-shaped multi-cavity CFSTSW, and the conclusions can be drawn as follows:
- It can be drawn from the test phenomenon that there is no obvious rule for the location of local buckling of steel tubes and local crushing of concrete. The failure mode of the T-shaped multi-cavity CFSTSW as mainly multi-wave buckling failure. All parts of the test specimen worked well together with good ductility.
- As the number of cavities increased, the axial compression bearing capacity of the T-shaped multi-cavity CFSTSW increased, but the ductility performance decreased accordingly.
- The three-dimensional finite element analysis results were in good agreement with the experimental results, indicating that the ABAQUS finite element model used in the article can simulate the axial compression performance of the multi-cavity CFSTSW well.
- A practical calculation equation for the bearing capacity of the T-shaped multi-cavity CFSTSW axial load column is proposed, which can provide a reference for the design of axial compression members of T-shaped multi-cavity CFSTSWs.
Author Contributions
H.S. and Q.X. incepted the original idea and designed the experiment. P.Y. analyzed the date. J.Y. wrote the paper. P.L. revised the paper. All authors have read and agreed to the published version of the manuscript.
Funding
This research was supported by the National Natural Science Foundation of China (No. 51978673) and the Natural Science Foundation of Hunan Province (No. 2018JJ2528).
Conflicts of Interest
The authors declare no conflicts of interest.
Appendix A
Table A1.
Finite element simulation values under different parameters.
Table A1.
Finite element simulation values under different parameters.
| No. | fc (MPa) | fs (MPa) | n | T (mm) | Nc (kN) | Ns (kN) | Difference Value (%) |
|---|---|---|---|---|---|---|---|
| TA4-600-1 | 38.17 | 235 | 4 | 2 | 644.34 | 634.37 | 1.548 |
| TA4-600-2 | 38.17 | 345 | 4 | 2 | 799.44 | 784.38 | 1.884 |
| TA4-600-3 | 38.17 | 235 | 4 | 3 | 810.02 | 816.79 | 0.836 |
| TA4-600-4 | 38.17 | 235 | 4 | 4 | 975.69 | 998.10 | 2.296 |
| TA4-600-5 | 30.80 | 235 | 4 | 2 | 583.91 | 566.39 | 3.000 |
| TA4-600-6 | 44.00 | 235 | 4 | 2 | 692.15 | 685.05 | 1.026 |
| TA5-600-1 | 38.17 | 235 | 5 | 2 | 802.49 | 786.44 | 2.000 |
| TA5-600-2 | 38.17 | 345 | 5 | 2 | 994.99 | 969.74 | 2.538 |
| TA5-600-3 | 38.17 | 235 | 5 | 3 | 1008.12 | 1010.86 | 0.272 |
| TA5-600-4 | 38.17 | 235 | 5 | 4 | 1213.74 | 1234.52 | 1.712 |
| TA5-600-5 | 30.80 | 235 | 5 | 2 | 726.95 | 702.21 | 3.403 |
| TA5-600-6 | 44.00 | 235 | 5 | 2 | 862.25 | 848.51 | 1.594 |
| TA5-600-1 | 38.17 | 235 | 6 | 2 | 960.64 | 939.50 | 2.201 |
| TA5-600-2 | 38.17 | 345 | 6 | 2 | 1190.54 | 1157.61 | 2.766 |
| TA5-600-3 | 38.17 | 235 | 6 | 3 | 1206.22 | 1206.57 | 0.029 |
| TA5-600-4 | 38.17 | 235 | 6 | 4 | 1451.79 | 1474.32 | 1.552 |
| TA5-600-5 | 30.80 | 235 | 6 | 2 | 869.99 | 838.50 | 3.620 |
| TA5-600-6 | 44.00 | 235 | 6 | 2 | 1032.35 | 1015.59 | 1.623 |
References
- Chiaia, B.; Kumpyak, O.; Placidi, L.; Maksimov, V. Experimental analysis and modeling of two-way reinforced concrete slabs over different kinds of yielding supports under short-term dynamic loading. Eng. Struct. 2015, 96, 88–99. [Google Scholar] [CrossRef]
- Han, L.-H.; An, Y.-F. Performance of concrete-encased CFST stub columns under axial compression. J. Constr. Steel Res. 2014, 93, 62–76. [Google Scholar] [CrossRef]
- Ding, F.-X.; Zhu, J.; Cheng, S. Comparative study of stirrup-confined circular concrete-filled steel tubular stub columns under axial loading. Thin-Walled Struct. 2018, 123, 294–304. [Google Scholar] [CrossRef]
- Portolés, J.M.; Romero, M.L.; Bonet, J.L. Experimental study of high strength concrete-filled circular tubular columns under eccentric loading. J. Constr. Steel Res. 2011, 67, 623–633. [Google Scholar] [CrossRef]
- Liu, D.; Zuo, J.; Wang, J.; Zhang, D.; Guo, S. Bending failure mechanism and strengthening of concrete-filled steel tubular support. Eng. Struct. 2019, 198. [Google Scholar] [CrossRef]
- Serras, D.N.; Skalomenos, K.A.; Hatzigeorgiou, G.D. Modeling of circular concrete-filled steel tubes subjected to cyclic lateral loading. Structures 2016, 8, 75–93. [Google Scholar] [CrossRef]
- Zhou, J.; Li, P.; Guo, N. Seismic performance assessment of a precast concrete-encased CFST composite wall with twin steel tube connections. Eng. Struct. 2020, 207. [Google Scholar] [CrossRef]
- Ding, F.-X.; Wang, W.-J.; Lu, D.-R. Study on the behavior of concrete-filled square double-skin steel tubular stub columns under axial loading. Structures 2020, 23, 665–676. [Google Scholar] [CrossRef]
- Ozbakkaloglu, T. Behavior of square and rectangular ultra high-strength concrete-filled FRP tubes under axial compression. Compos. Part B Eng. 2013, 54, 97–111. [Google Scholar] [CrossRef]
- Qu, Q.-S.; Liu, Q.; Liao, W.-Z. Analysis on compression-bending behavior of concrete-filled rectangular steel column. J. Guangxi Univ. 2018, 43, 1149–1160. [Google Scholar]
- Wang, Y.-J.; Fan, Z.; Hou, C. Mechanical behavior of rectangular CFST columns under biaxial compression-bending-shearing loading condition. J. Build. Struct. 2019, 40, 257–263. [Google Scholar]
- Chen, Z.; Jing, C.; Xu, J. Seismic performance of recycled concrete-filled square steel tube columns. Earthq. Eng. Eng. Vib. 2017, 16, 119–130. [Google Scholar] [CrossRef]
- Xu, J.-J.; Chen, Z.-P.; Xue, J.-Y. Simulation of seismic behavior of square recycled aggregate concrete—Filled steel tubular columns. Constr. Build. Mater. 2017, 149, 553–566. [Google Scholar] [CrossRef]
- Zhang, Y.; Xu, C.; Lu, X. Experimental study of hysteretic behaviour for concrete-filled square thin-walled steel tubular columns. J. Constr. Steel Res. 2007, 63, 317–325. [Google Scholar] [CrossRef]
- Scerrato, D.; Giorgio, I.; Madeo, A.; Limam, A.; Darve, F. A simple non-linear model for internal friction in modified concrete. Int. J. Eng. Sci. 2014, 80, 136–152. [Google Scholar] [CrossRef][Green Version]
- Giorgio, I.; Scerrato, D. Multi-scale concrete model with rate-dependent internal friction. Eur. J. Environ. Civ. Eng. 2016, 21, 821–839. [Google Scholar] [CrossRef]
- Du, G.; Zhang, J.; Li, Y. Experimental study on hysteretic model for L-shaped concrete-filled steel tubular column subjected to cyclic loading. Thin-Walled Struct. 2019, 144. [Google Scholar] [CrossRef]
- Zuo, Z.-L.; Cai, J.; Yang, C. Axial load behavior of L-shaped CFT stub columns with binding bars. Eng. Struct. 2012, 37, 88–98. [Google Scholar] [CrossRef]
- Zuo, Z.-L.; Cai, J.; Chen, Q.-J. Performance of T-shaped CFST stub columns with binding bars under axial compression. Thin-Walled Struct. 2018, 129, 183–196. [Google Scholar] [CrossRef]
- Liu, X.; Liu, J.; Yang, Y. Resistance of special-shaped concrete-filled steel tube columns under compression and bending. J. Constr. Steel Res. 2020, 169. [Google Scholar] [CrossRef]
- Huang, H.; Cha, B.-J.; Yang, C. Mechanical behavior of T-shaped concrete-filled steel ribbed tubular short columns. J. Build. Struct. 2018, 39, 132–137. (In Chinese) [Google Scholar]
- Fu, X.-Y.; Wu, B.; Di, B. Research on T-shaped stiffener design for concrete-filled rectangular steel tube column. J. Build. Struct. 2017, 38, 49–54. [Google Scholar]
- Liu, J.; Yang, Y.; Song, H.; Wang, Y. Numerical analysis on seismic behaviors of T-shaped concrete-filled steel tubular columns with reinforcement stiffeners. Adv. Struct. Eng. 2017, 21, 1273–1287. [Google Scholar] [CrossRef]
- Yang, Y.; Wang, Y.; Fu, F.; Liu, J. Static behavior of T-shaped concrete-filled steel tubular columns subjected to concentric and eccentric compressive loads. Thin-Walled Struct. 2015, 95, 374–388. [Google Scholar] [CrossRef]
- Li, H.; Sun, H.; Tian, J.; Yang, Q.; Wan, Q. Mechanical and Ultrasonic Testing of Self-Compacting Concrete. Energies 2019, 12, 2187. [Google Scholar] [CrossRef]
- Li, H.; Sun, H.; Zhang, W.; Gou, H.; Yang, Q. Study on Mechanical Properties of Self-Compacting Concrete and Its Filled in-Line Multi-Cavity Steel Tube Bundle Shear Wall. Energies 2019, 12, 3466. [Google Scholar] [CrossRef]
- Golewski, G.L. Energy Savings Associated with the Use of Fly Ash and Nanoadditives in the Cement Composition. Energies 2020, 13, 2184. [Google Scholar] [CrossRef]
- Contrafatto, L.; Cuomo, M.; Greco, L. Meso-scale simulation of concrete multiaxial behaviour. Eur. J. Environ. Civ. Eng. 2016, 21, 896–911. [Google Scholar] [CrossRef]
- Zhong, S. The Concrete-Filled Steel Tubular Structures, 3rd ed.; Tsinghua University Press: Beijing, China, 2003; pp. 40–51. (In Chinese) [Google Scholar]
- Ding, F.-X.; Fu, L.; Gong, Y.-Z. Behavior of concrete-filled square steel tubular stub columns under axially compressive loading. J. Shenzhen Univ. 2014, 31, 583–592. (In Chinese) [Google Scholar] [CrossRef]
- Ding, F.-X.; Yu, Z.-W.; Yu, B. Elasto-plastic analysis of circular concrete-filled steel tube stub columns. J. Constr. Steel Res. 2011, 67, 1567–1577. [Google Scholar] [CrossRef]
- American Institute of Steel Construction ANSI/AISC 341-10. Seismic Provisions for Structural Steel Buildings; American Institute of Steel Construction: Chicago, IL, USA, 2010. [Google Scholar]
- Eurocode 4: Design of Composite Steel and Concrete Structures-Part 1-1: General Rules and Rules for Buildings; European Committee for Standardization: Brussels, Belgium, 2004.


© 2020 by the authors. Licensee MDPI, Basel, Switzerland. This article is an open access article distributed under the terms and conditions of the Creative Commons Attribution (CC BY) license (http://creativecommons.org/licenses/by/4.0/).