Phototransistor Behavior in CIGS Solar Cells and the Effect of the Back Contact Barrier

 ,
, 
Abstract

1. Introduction
2. Materials and Methods
3. Results
3.1. Experimental Results
3.2. Simulation Results
4. Discussion
5. Conclusions
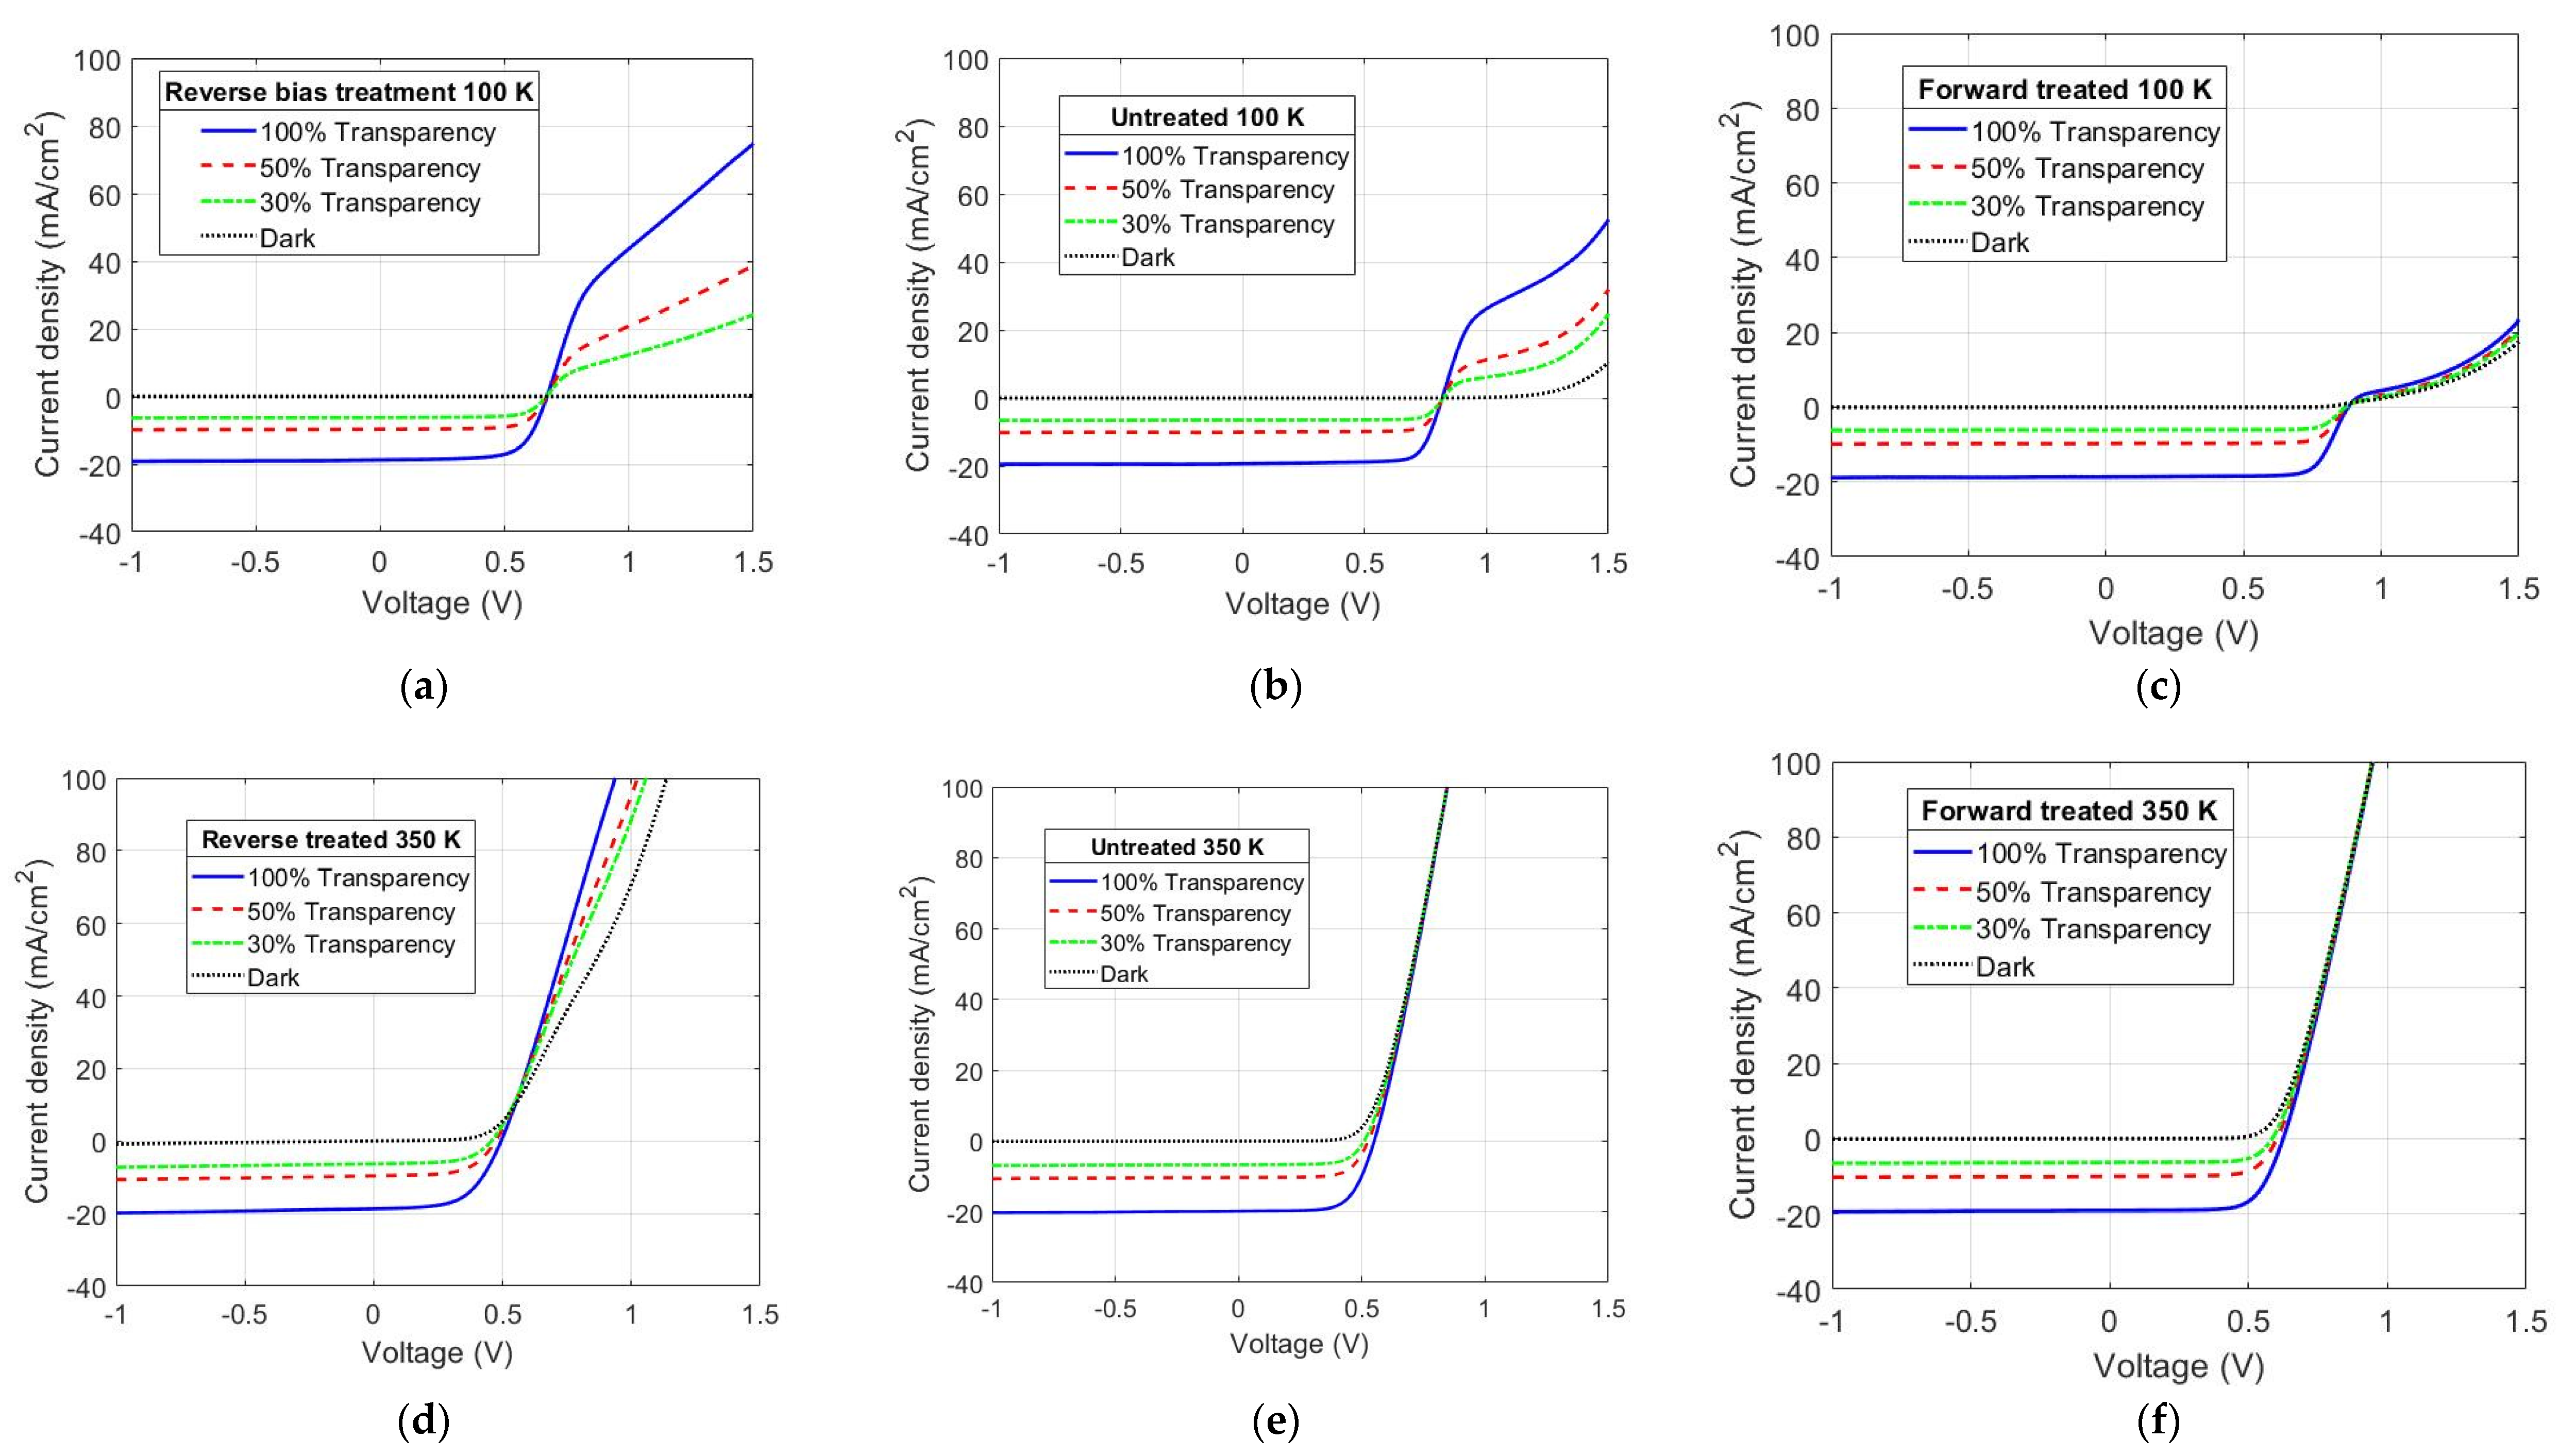
- The gain factor of the phototransistor model, as seen in the I–V curves, is affected differently depending on the applied treatment. A forward-bias and high-temperature treatment (+0.4 V and 100 °C) reduces the gain while a reverse-bias treatment (−0.4 V and 100 °C) increases it.
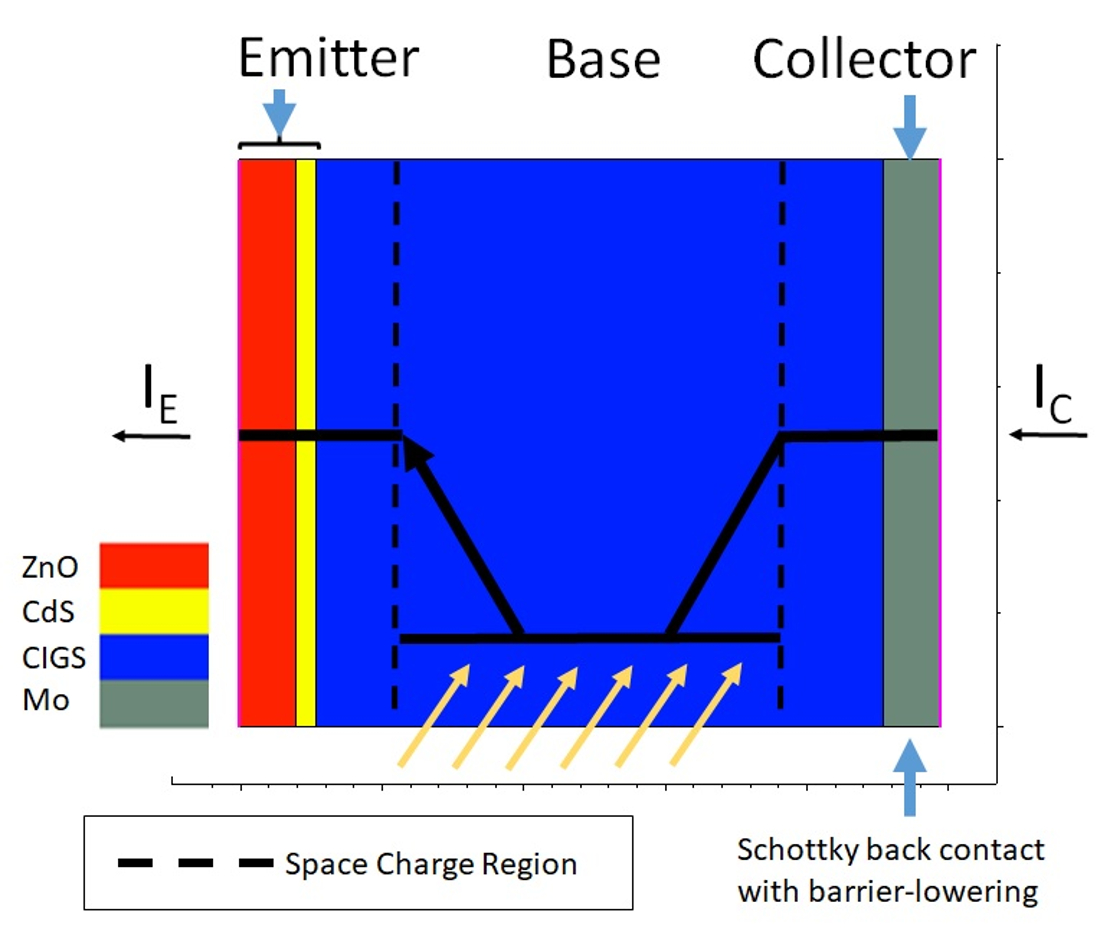
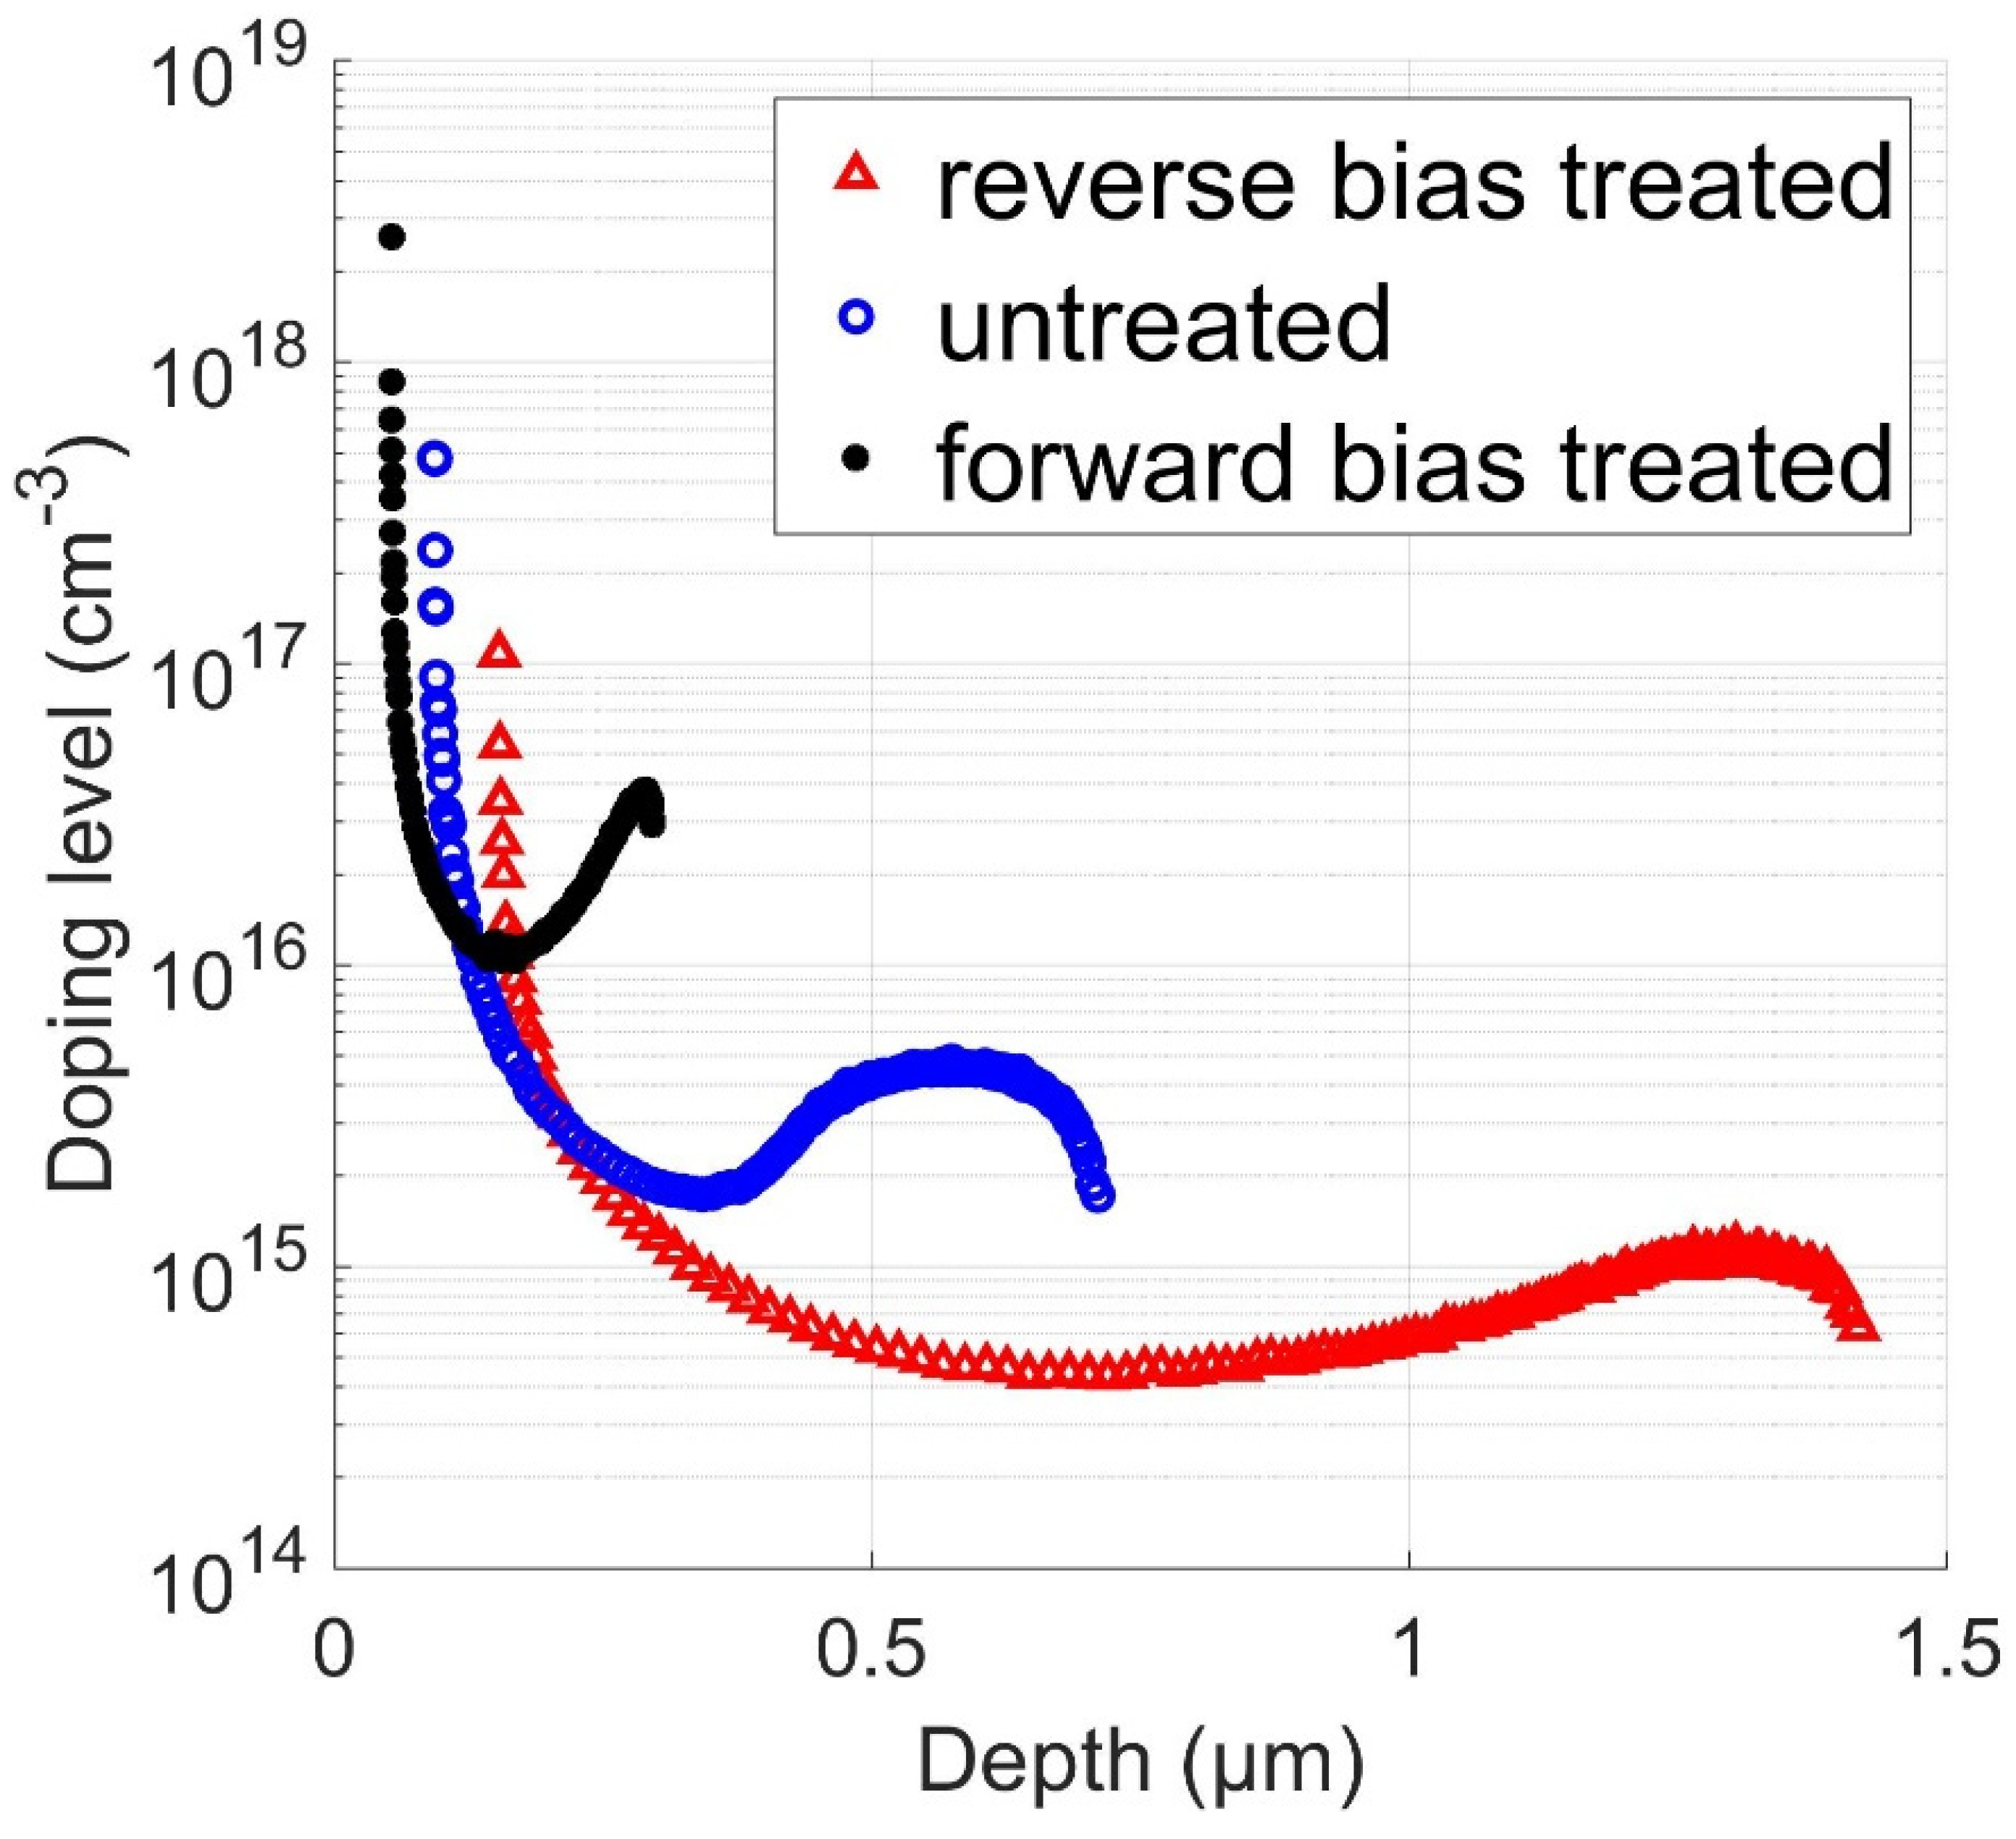
- The change in the gain of the phototransistor is directly related to a metastable redistribution of charges in the absorber and the apparent height of the back-contact barrier. In particular, the forward-bias treatment increases the apparent doping level of CIGS and decreases the barrier height, while the reverse-bias treatment does the opposite.
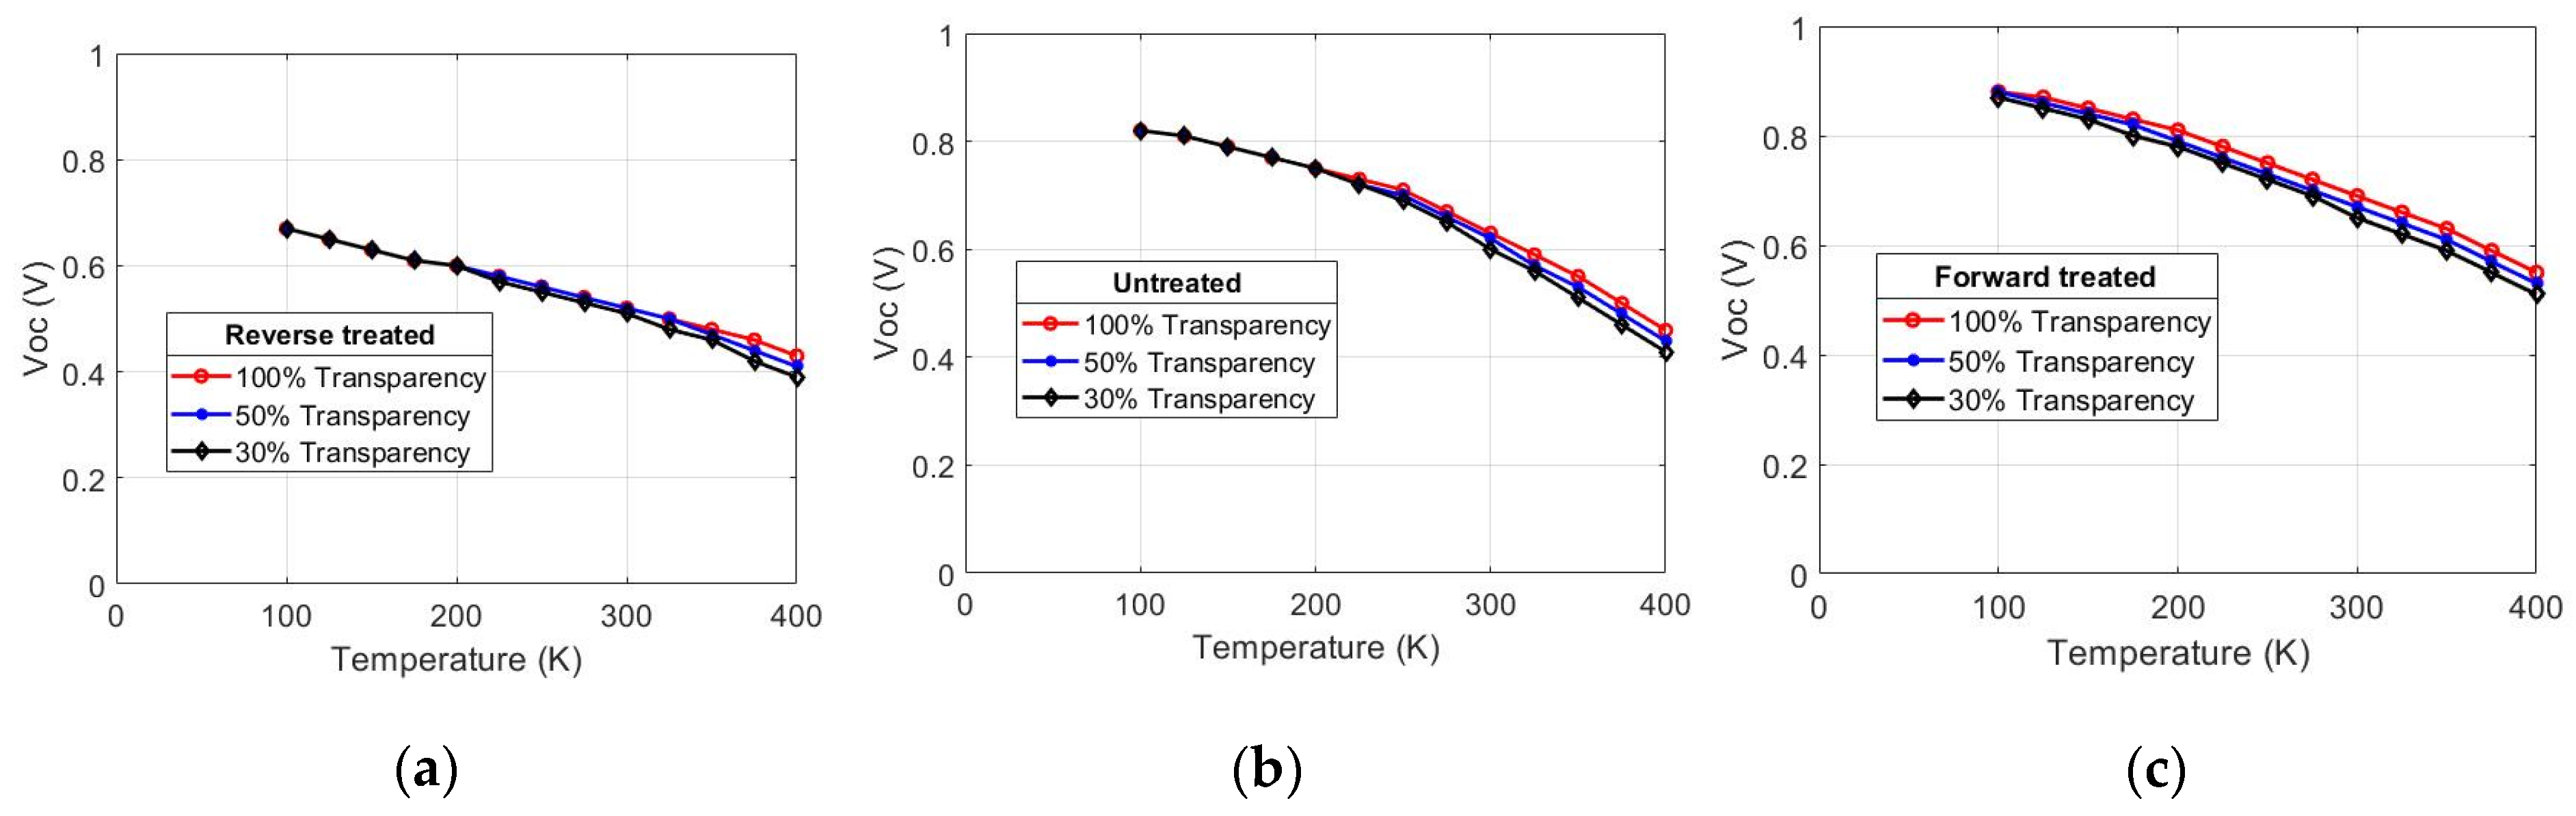
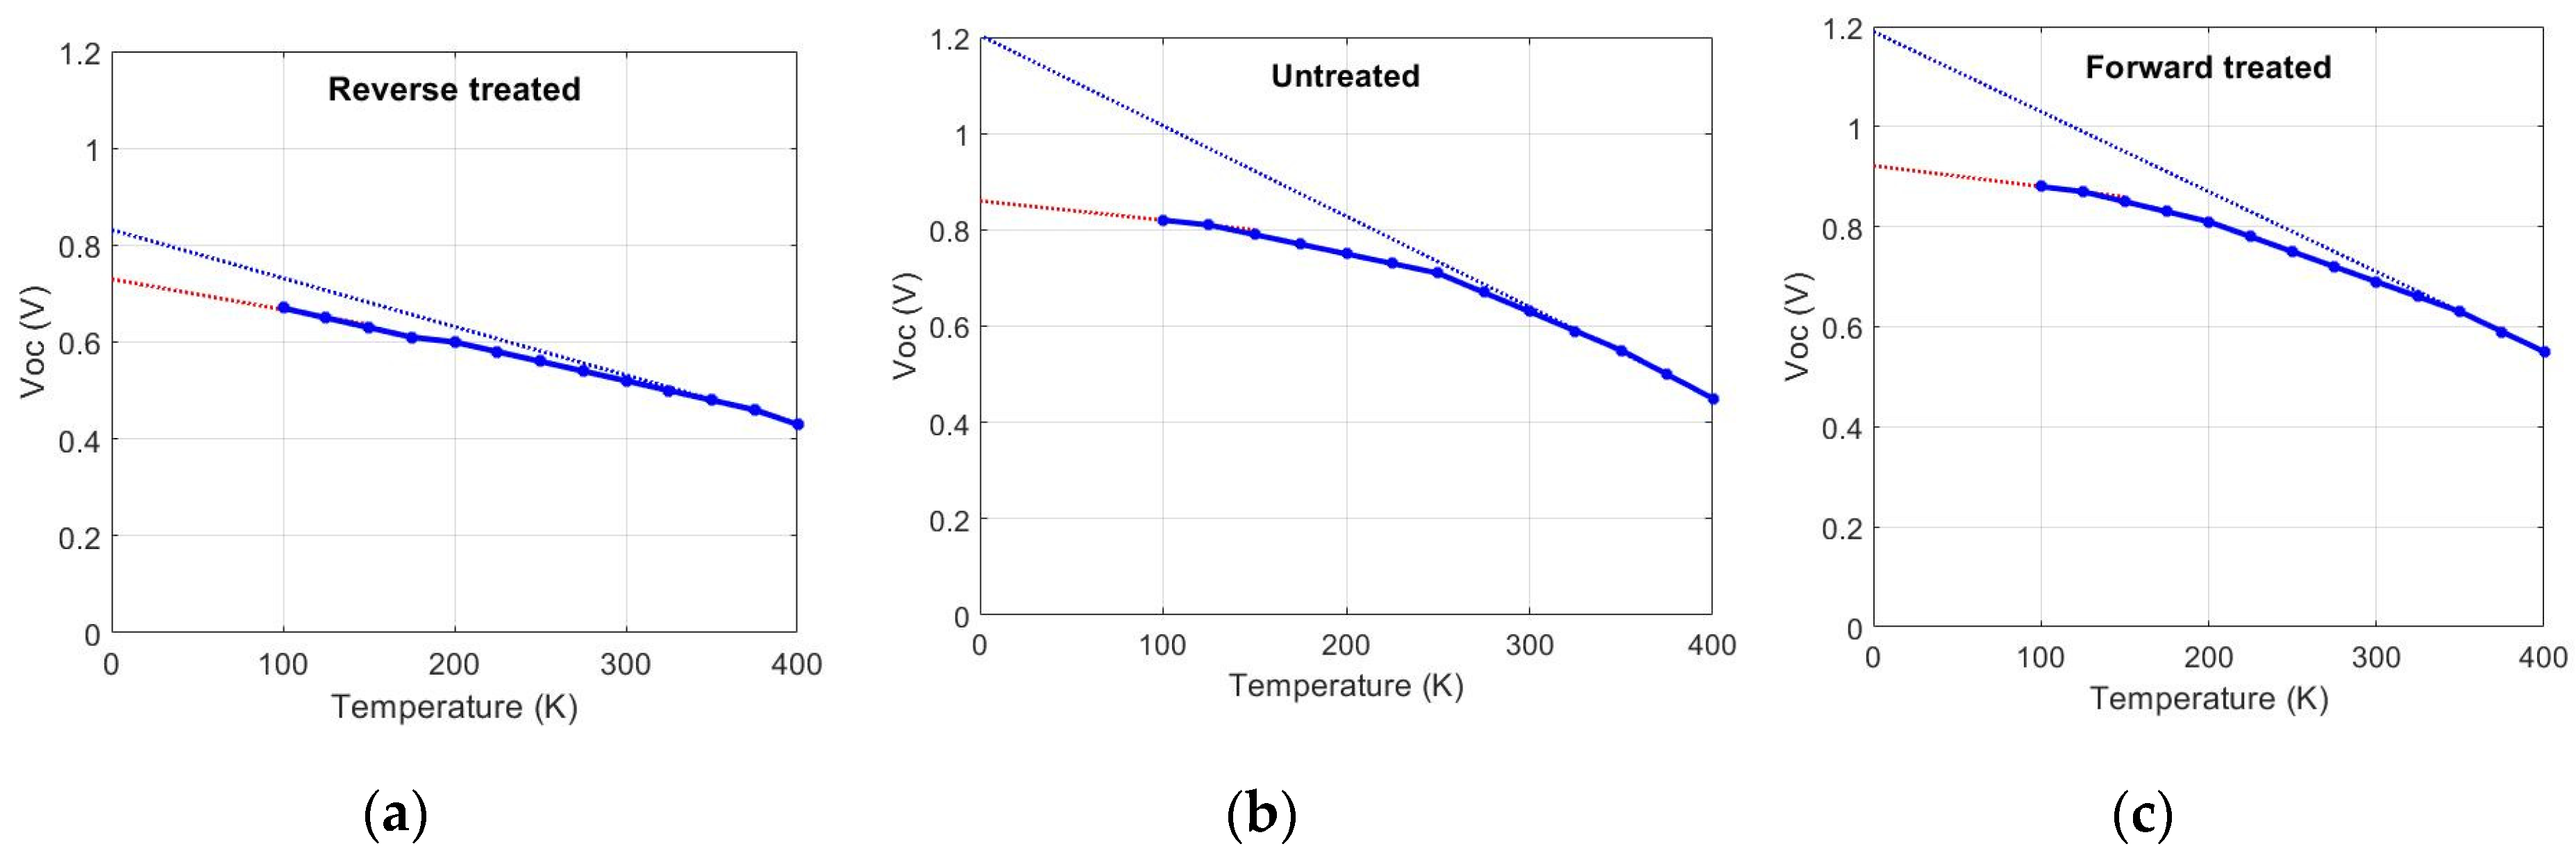
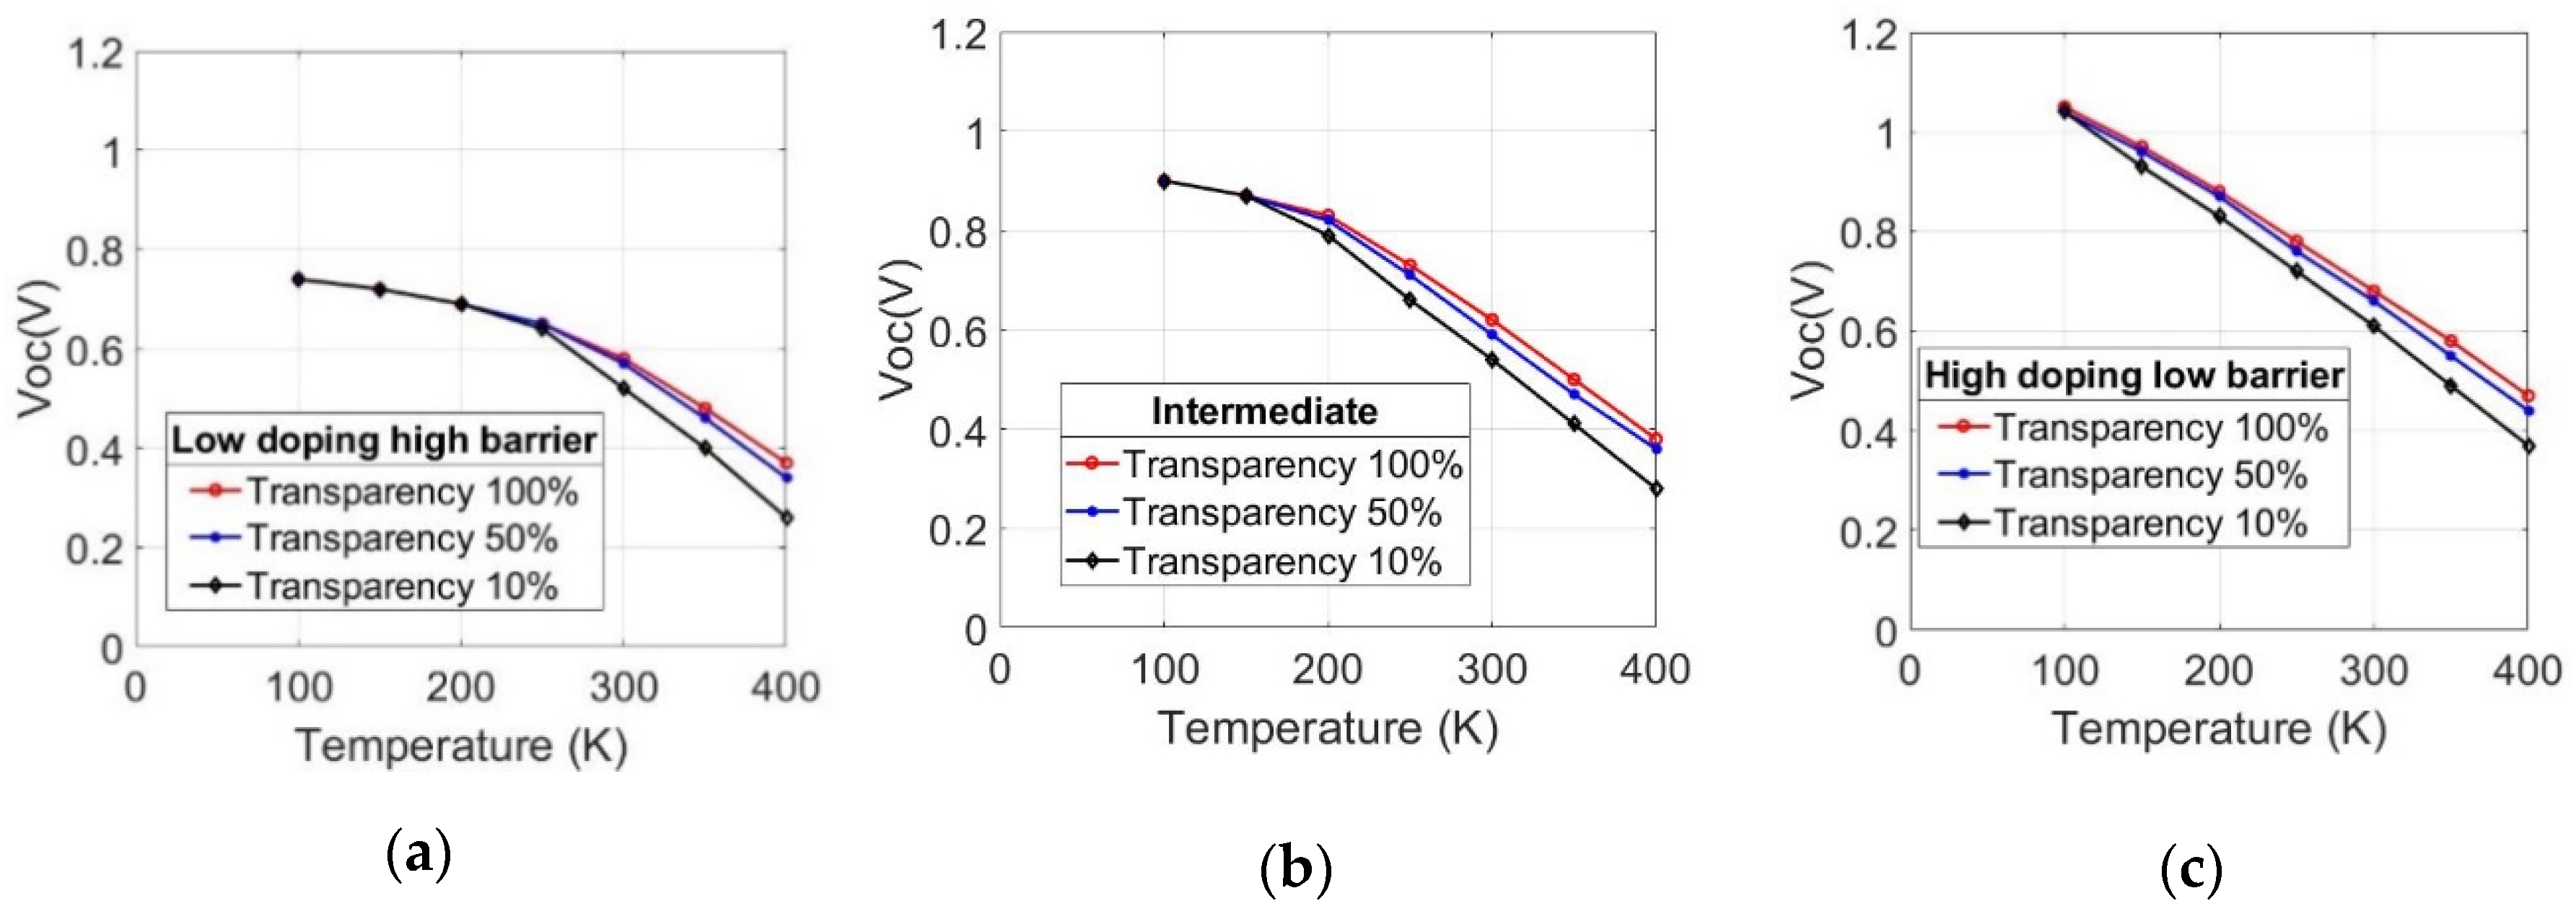
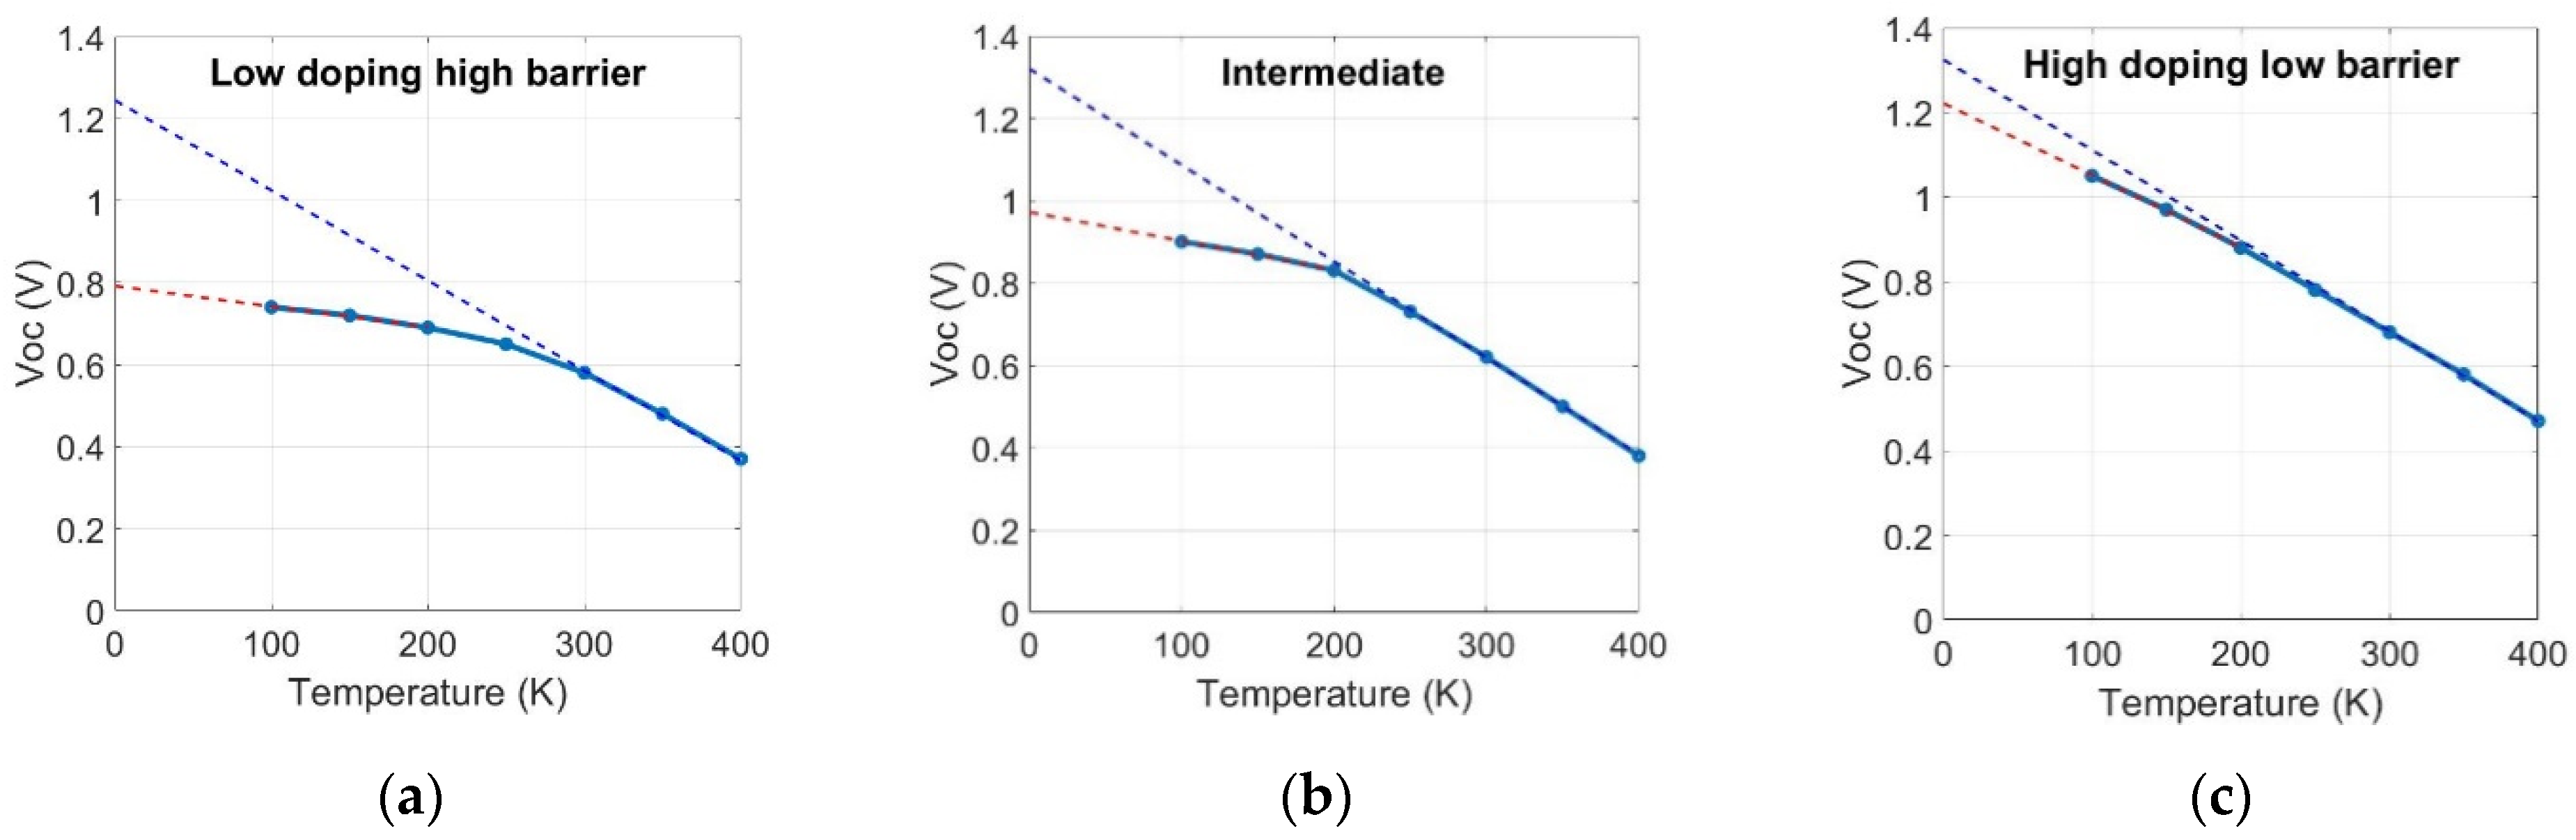
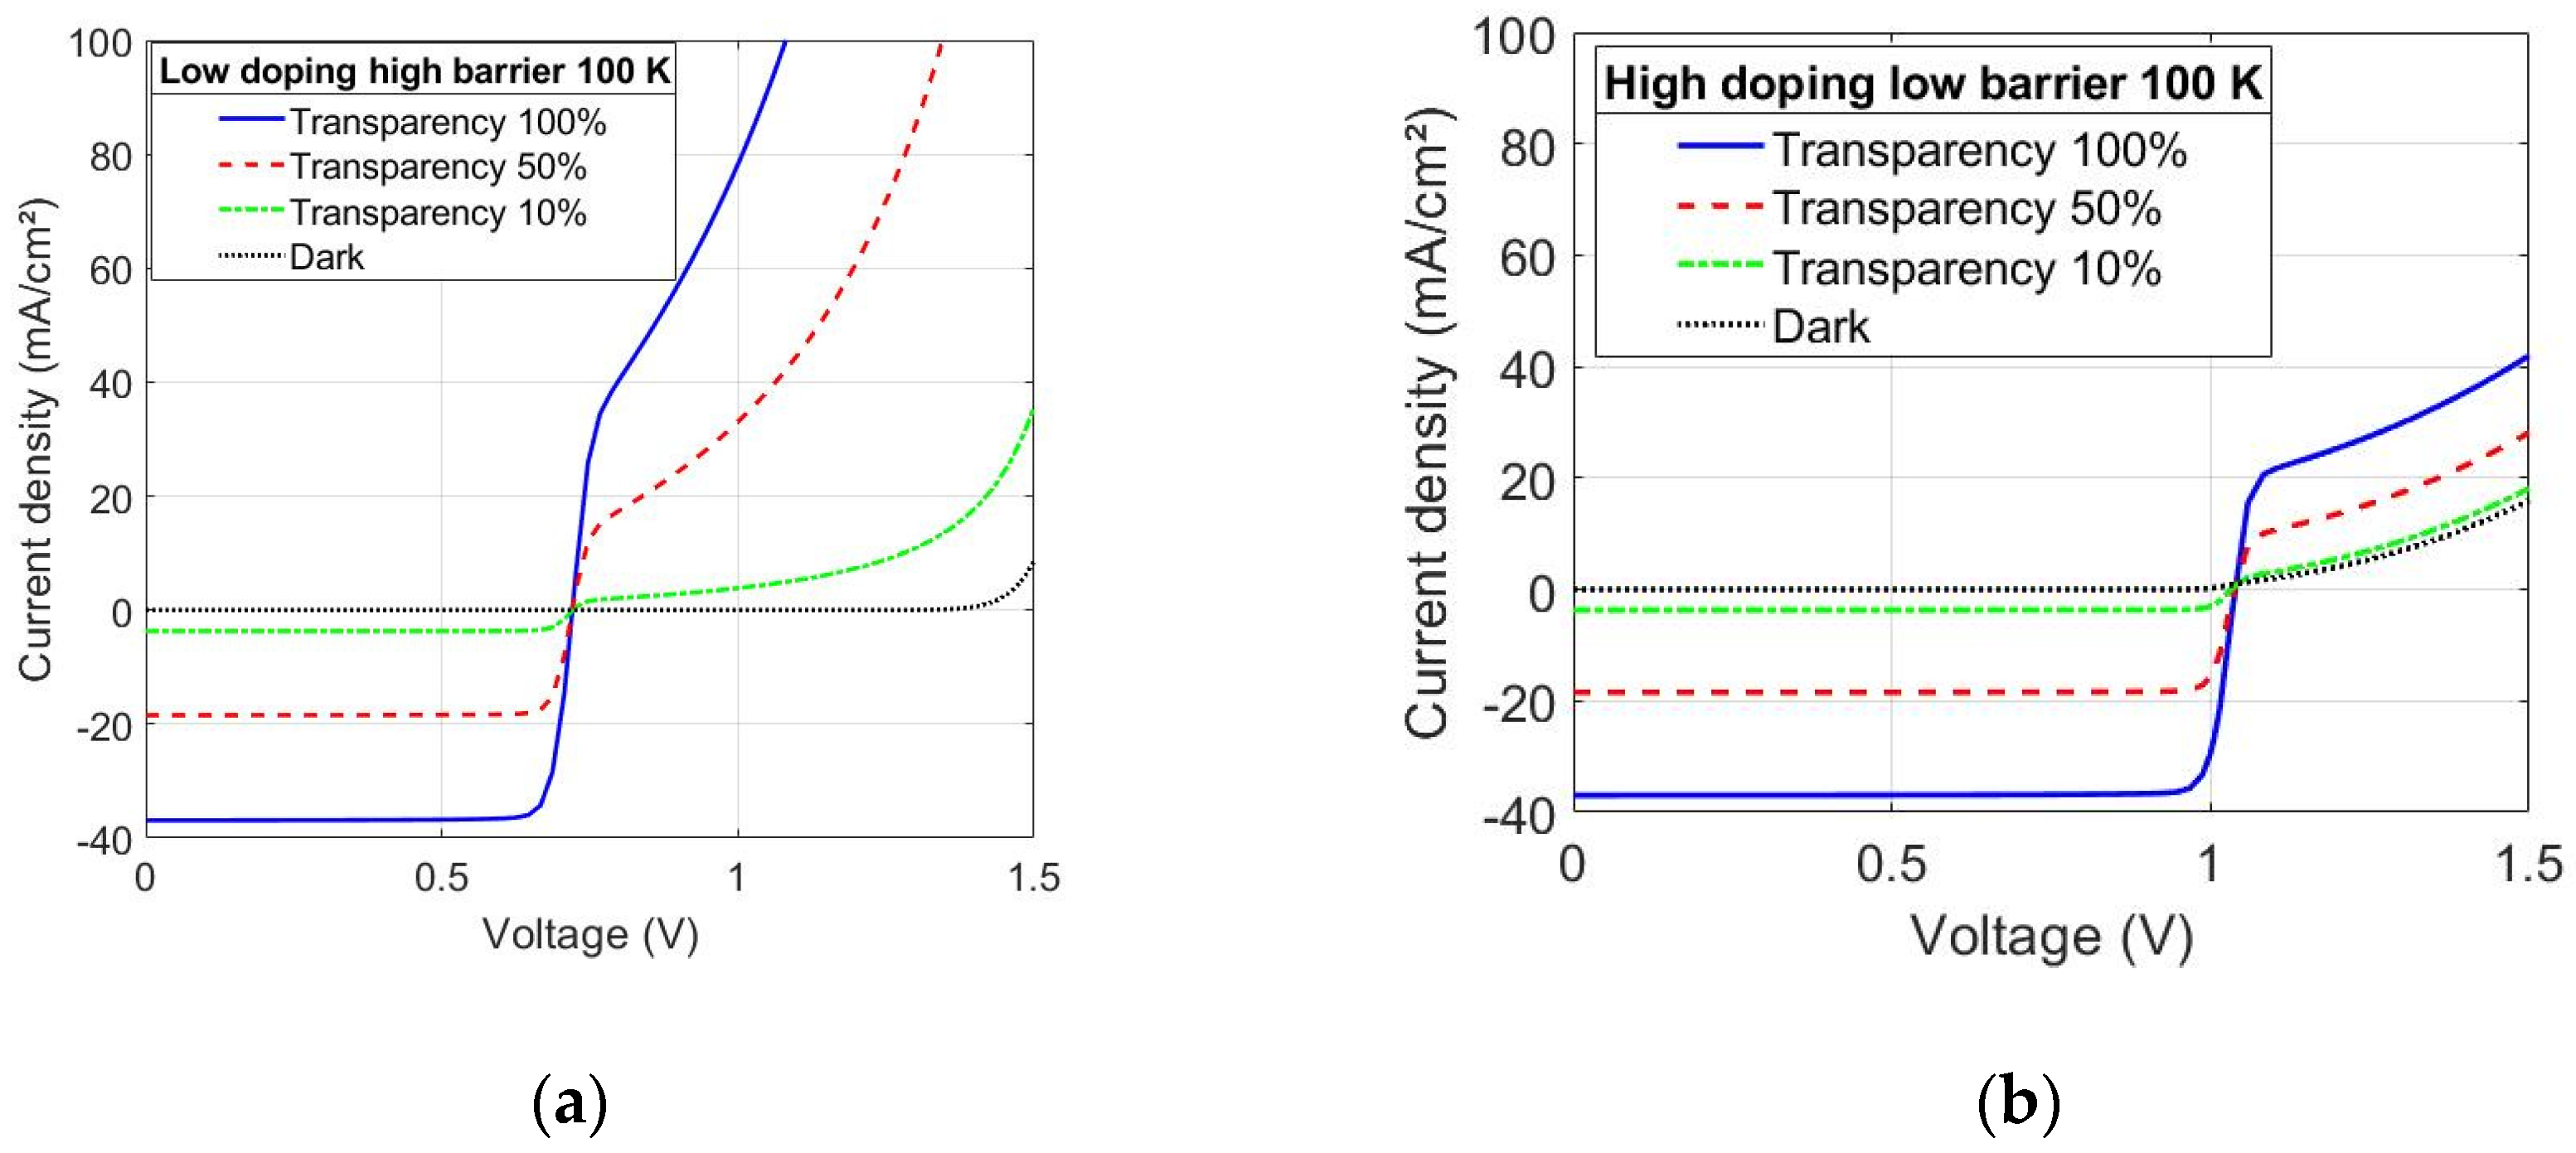
- It could be shown in this paper how metastabilities induced by different treatments affect other aspects of the phototransistor model. Two of the affected aspects are as follows: (i) how the value of Voc saturates, instead of linearly increasing, when the temperature decreases, and (ii) how Voc does not depend on the illumination level. The reverse-bias treatment extends this temperature range even up to 400 K. The forward-bias treatment, on the other hand, reduces this temperature range.
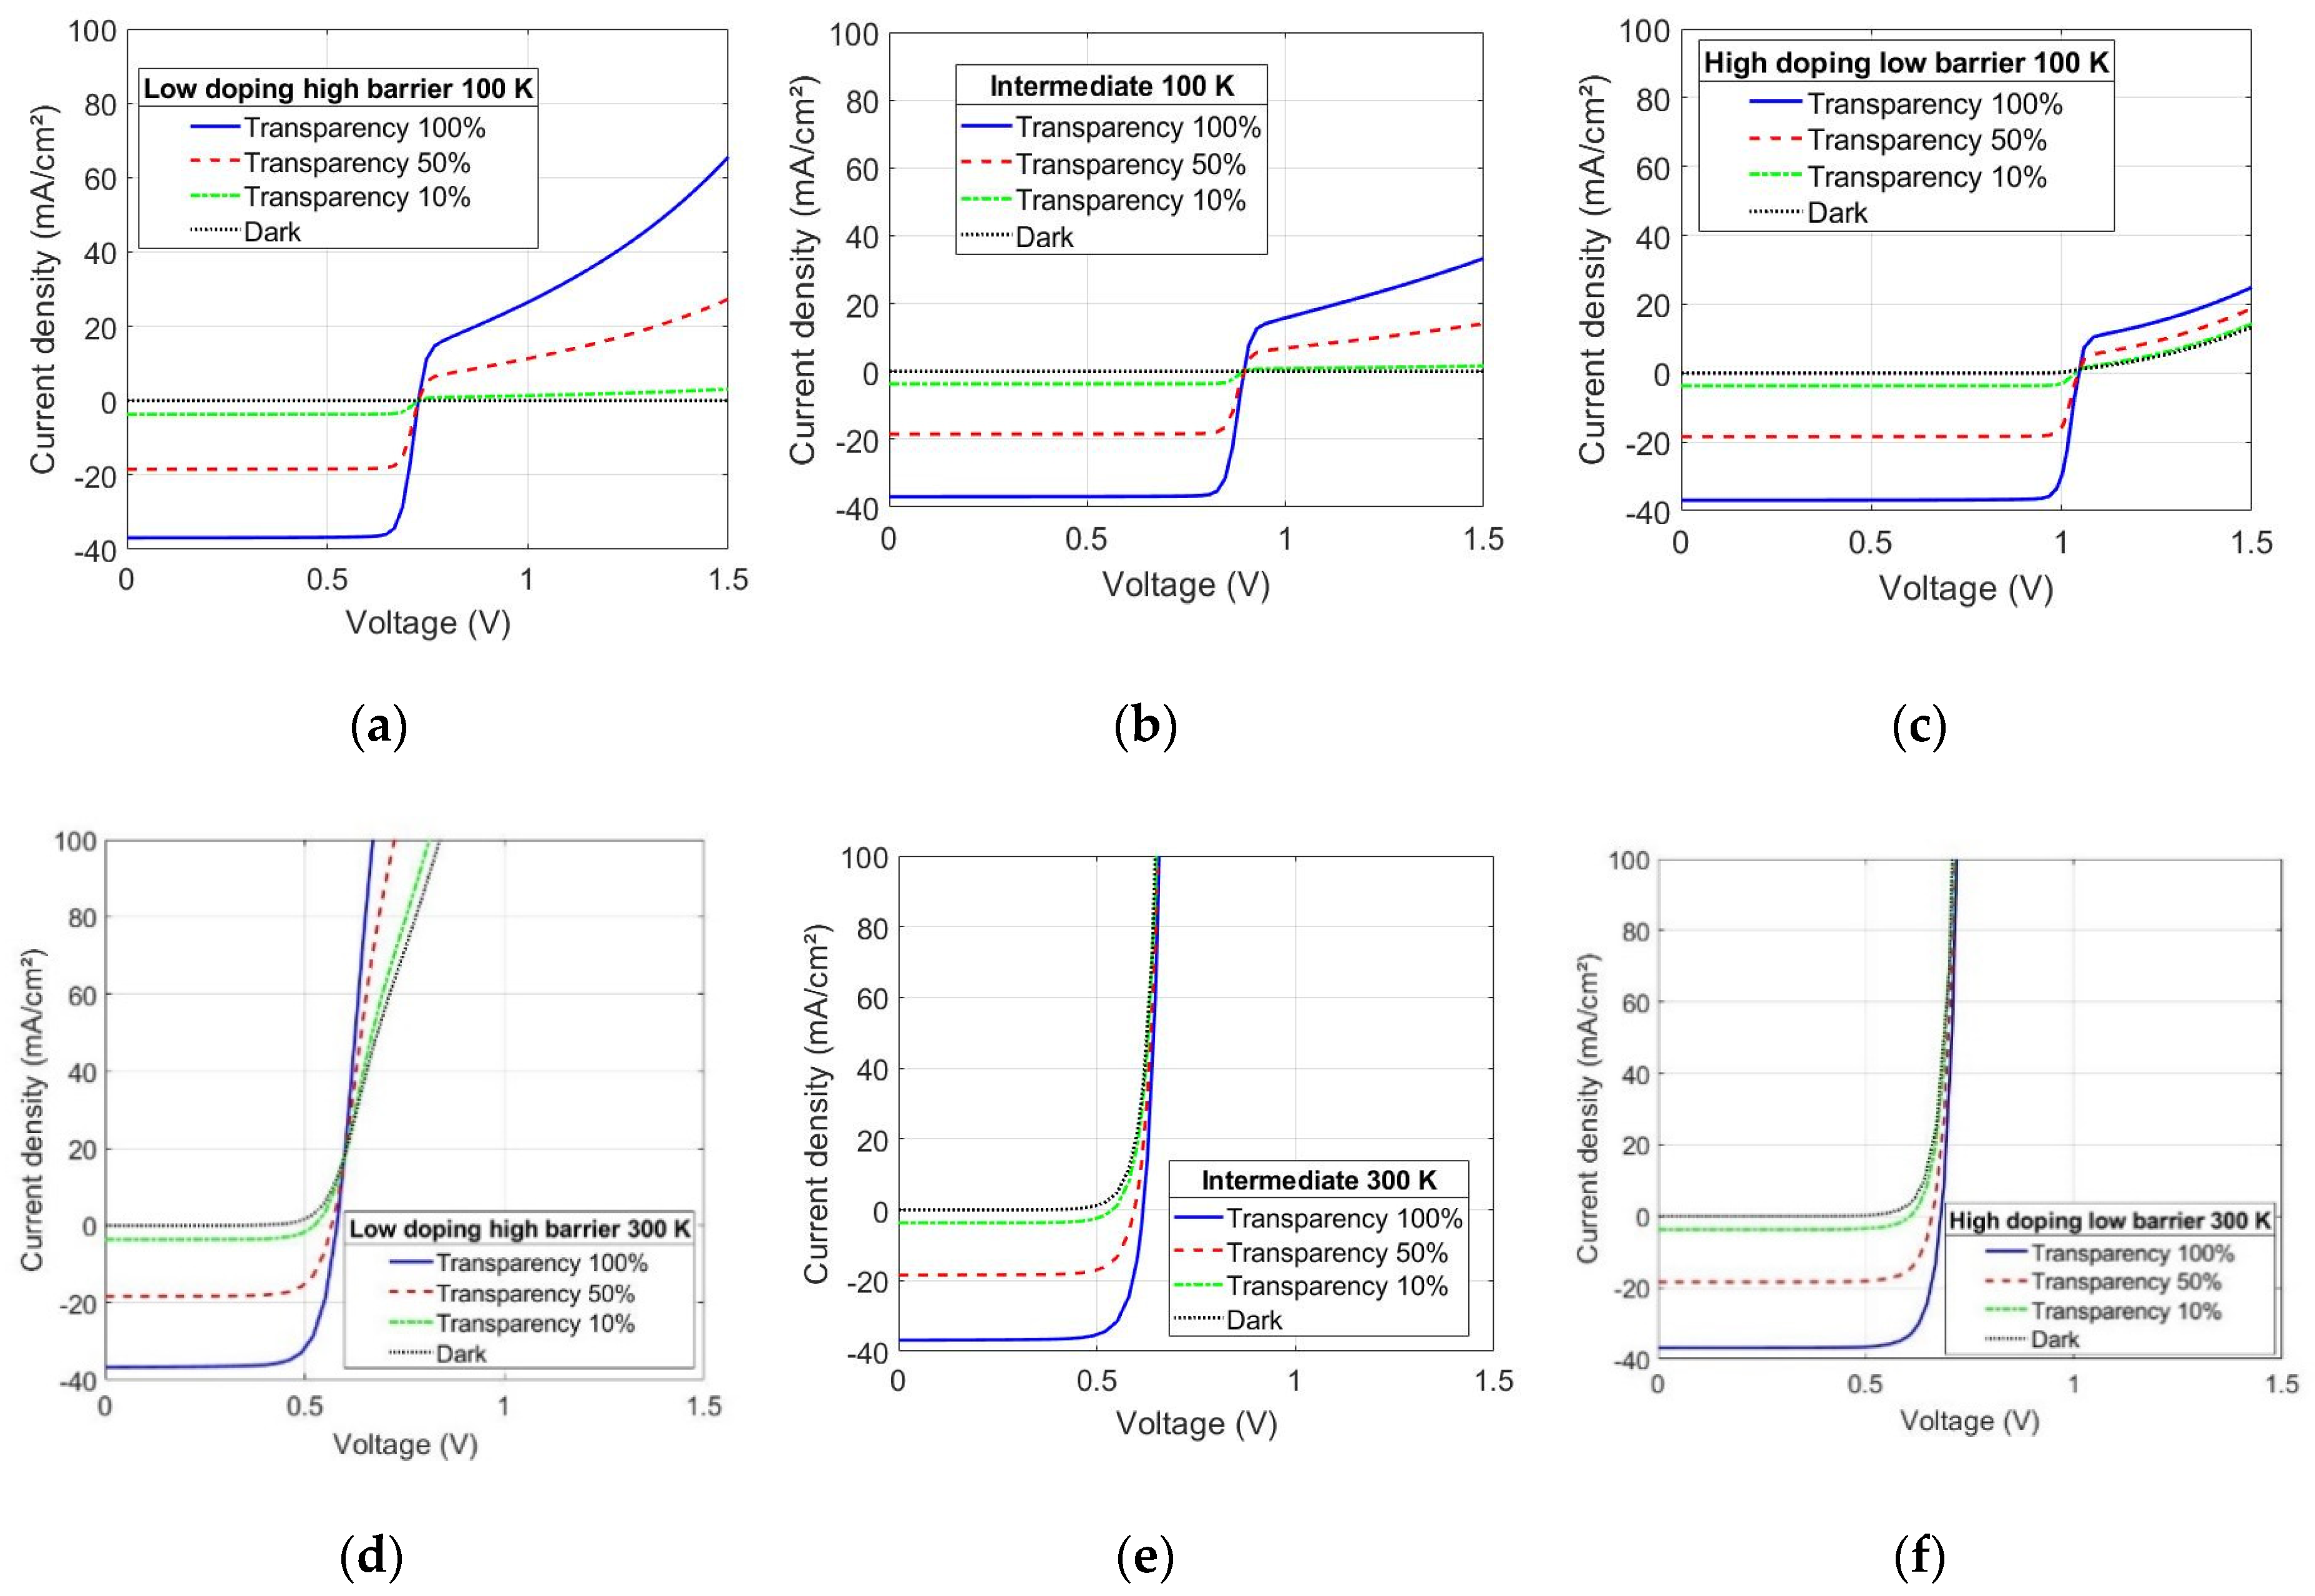
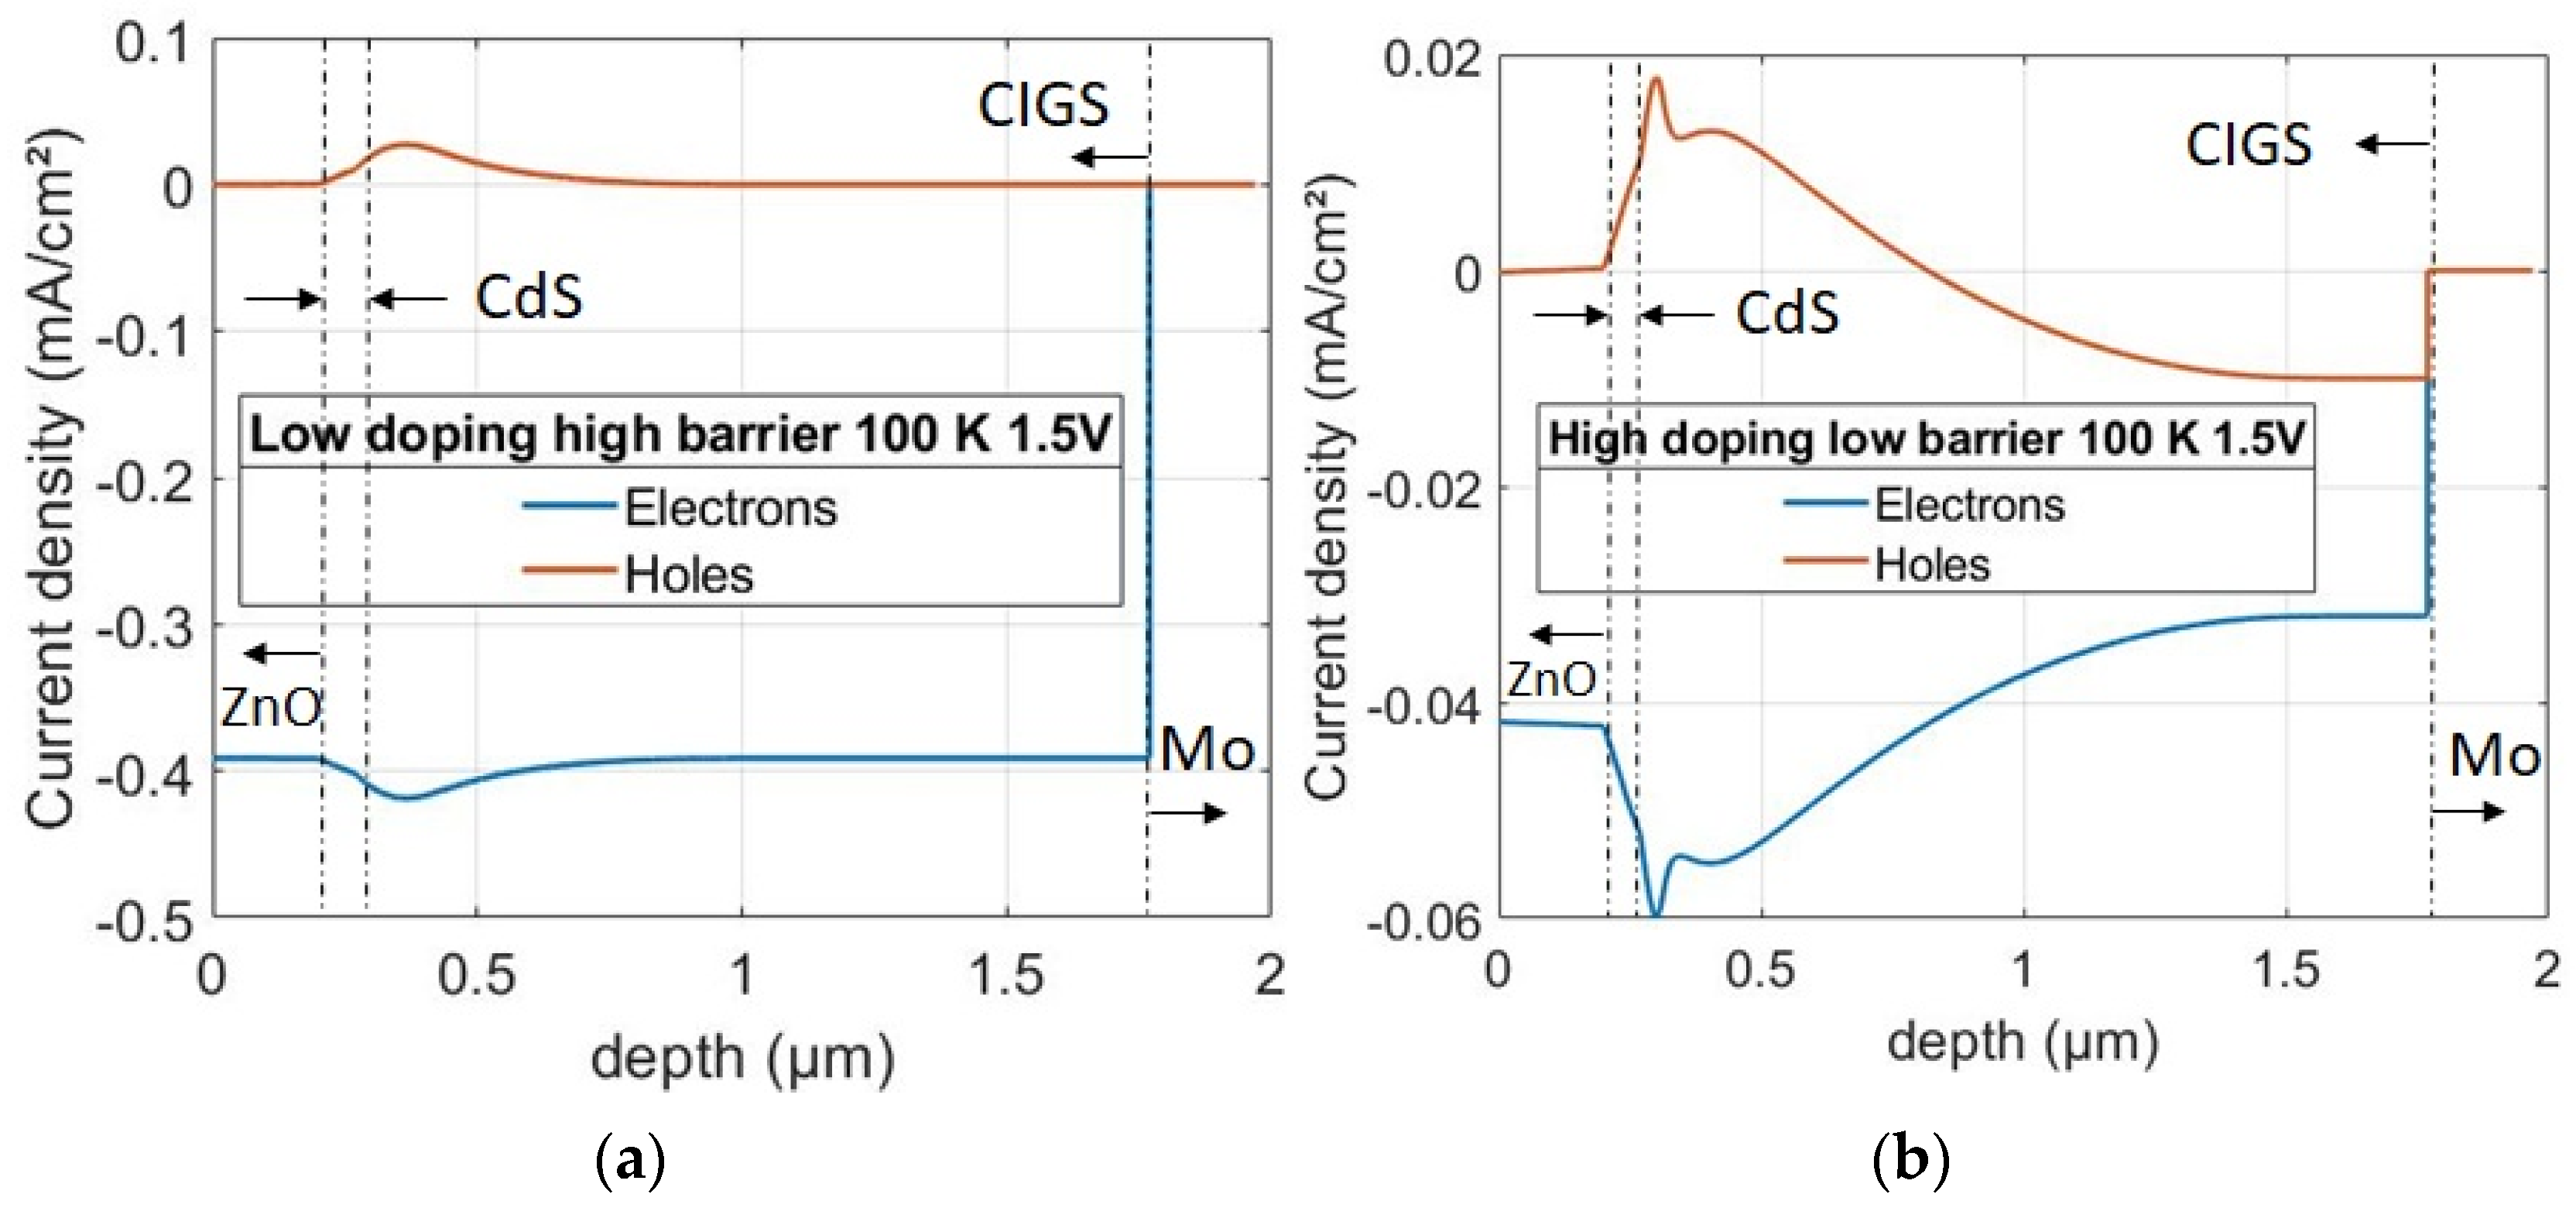
- Numerical simulations of a thin-film CIGS device model are in good agreement with the experimental results; a lower doping level in CIGS in combination with a higher back contact barrier increases the gain factor of the phototransistor, while a high doping level with a lower barrier decreases it.
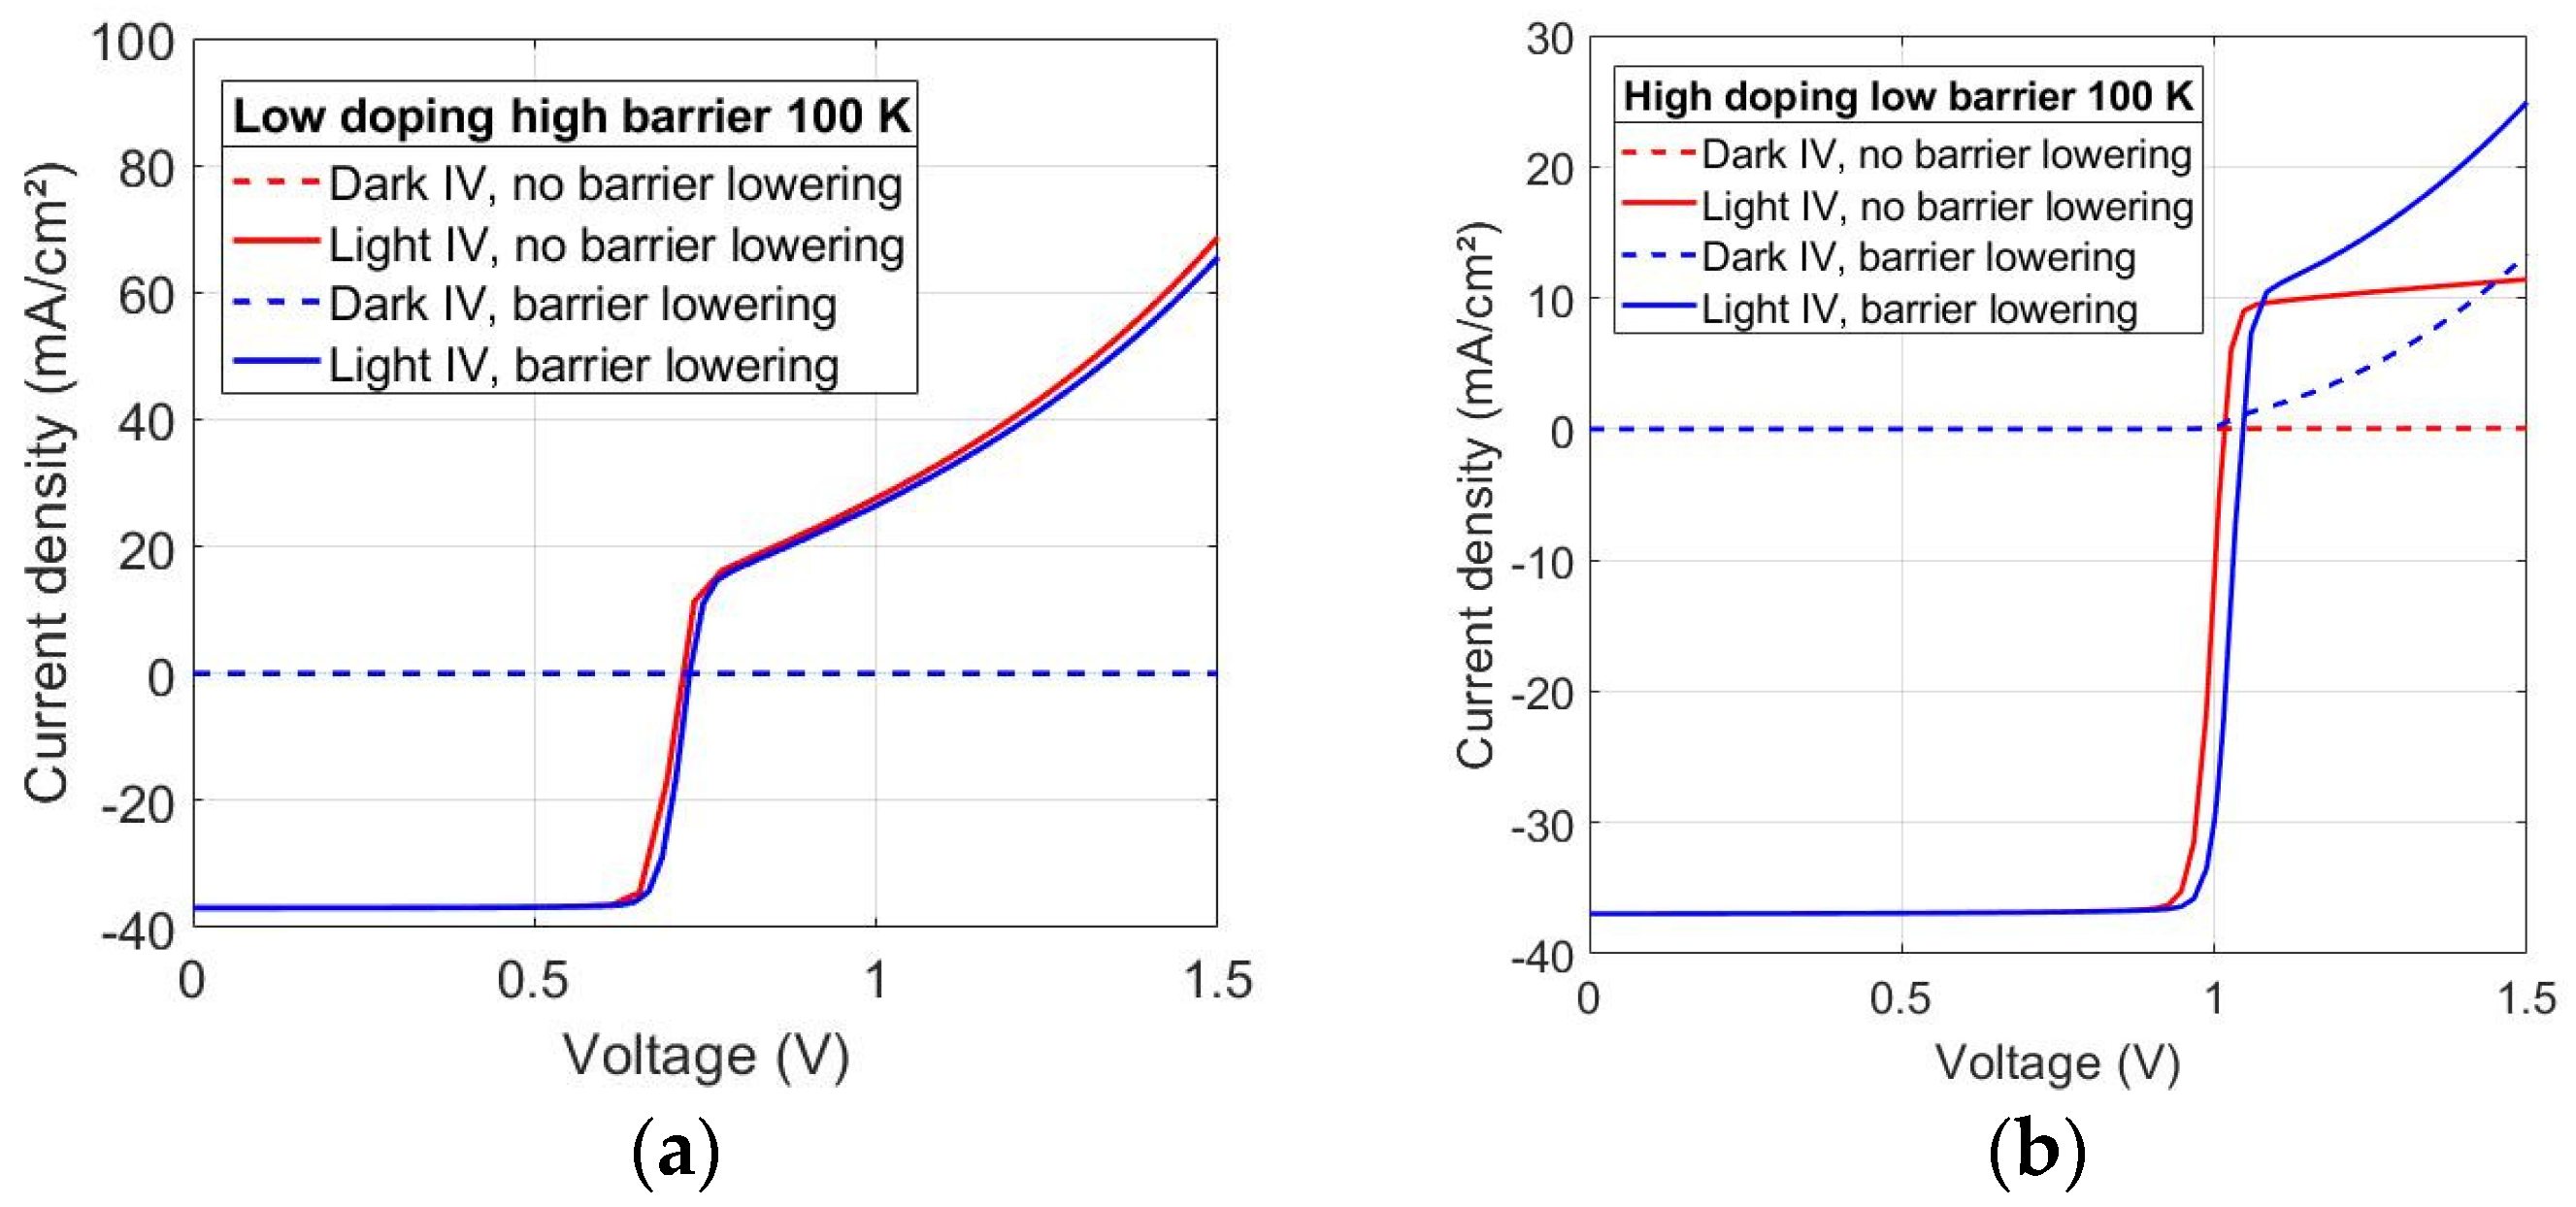
- The barrier-lowering effect is necessary in order to explain the slight exponential increase in the saturated current density under forward bias that is found in low-temperature I–V measurements for the forward-treated sample. Without the barrier-lowering behavior, a linear Early effect is predicted by the simulation of the corresponding case (high-doping, low-barrier).
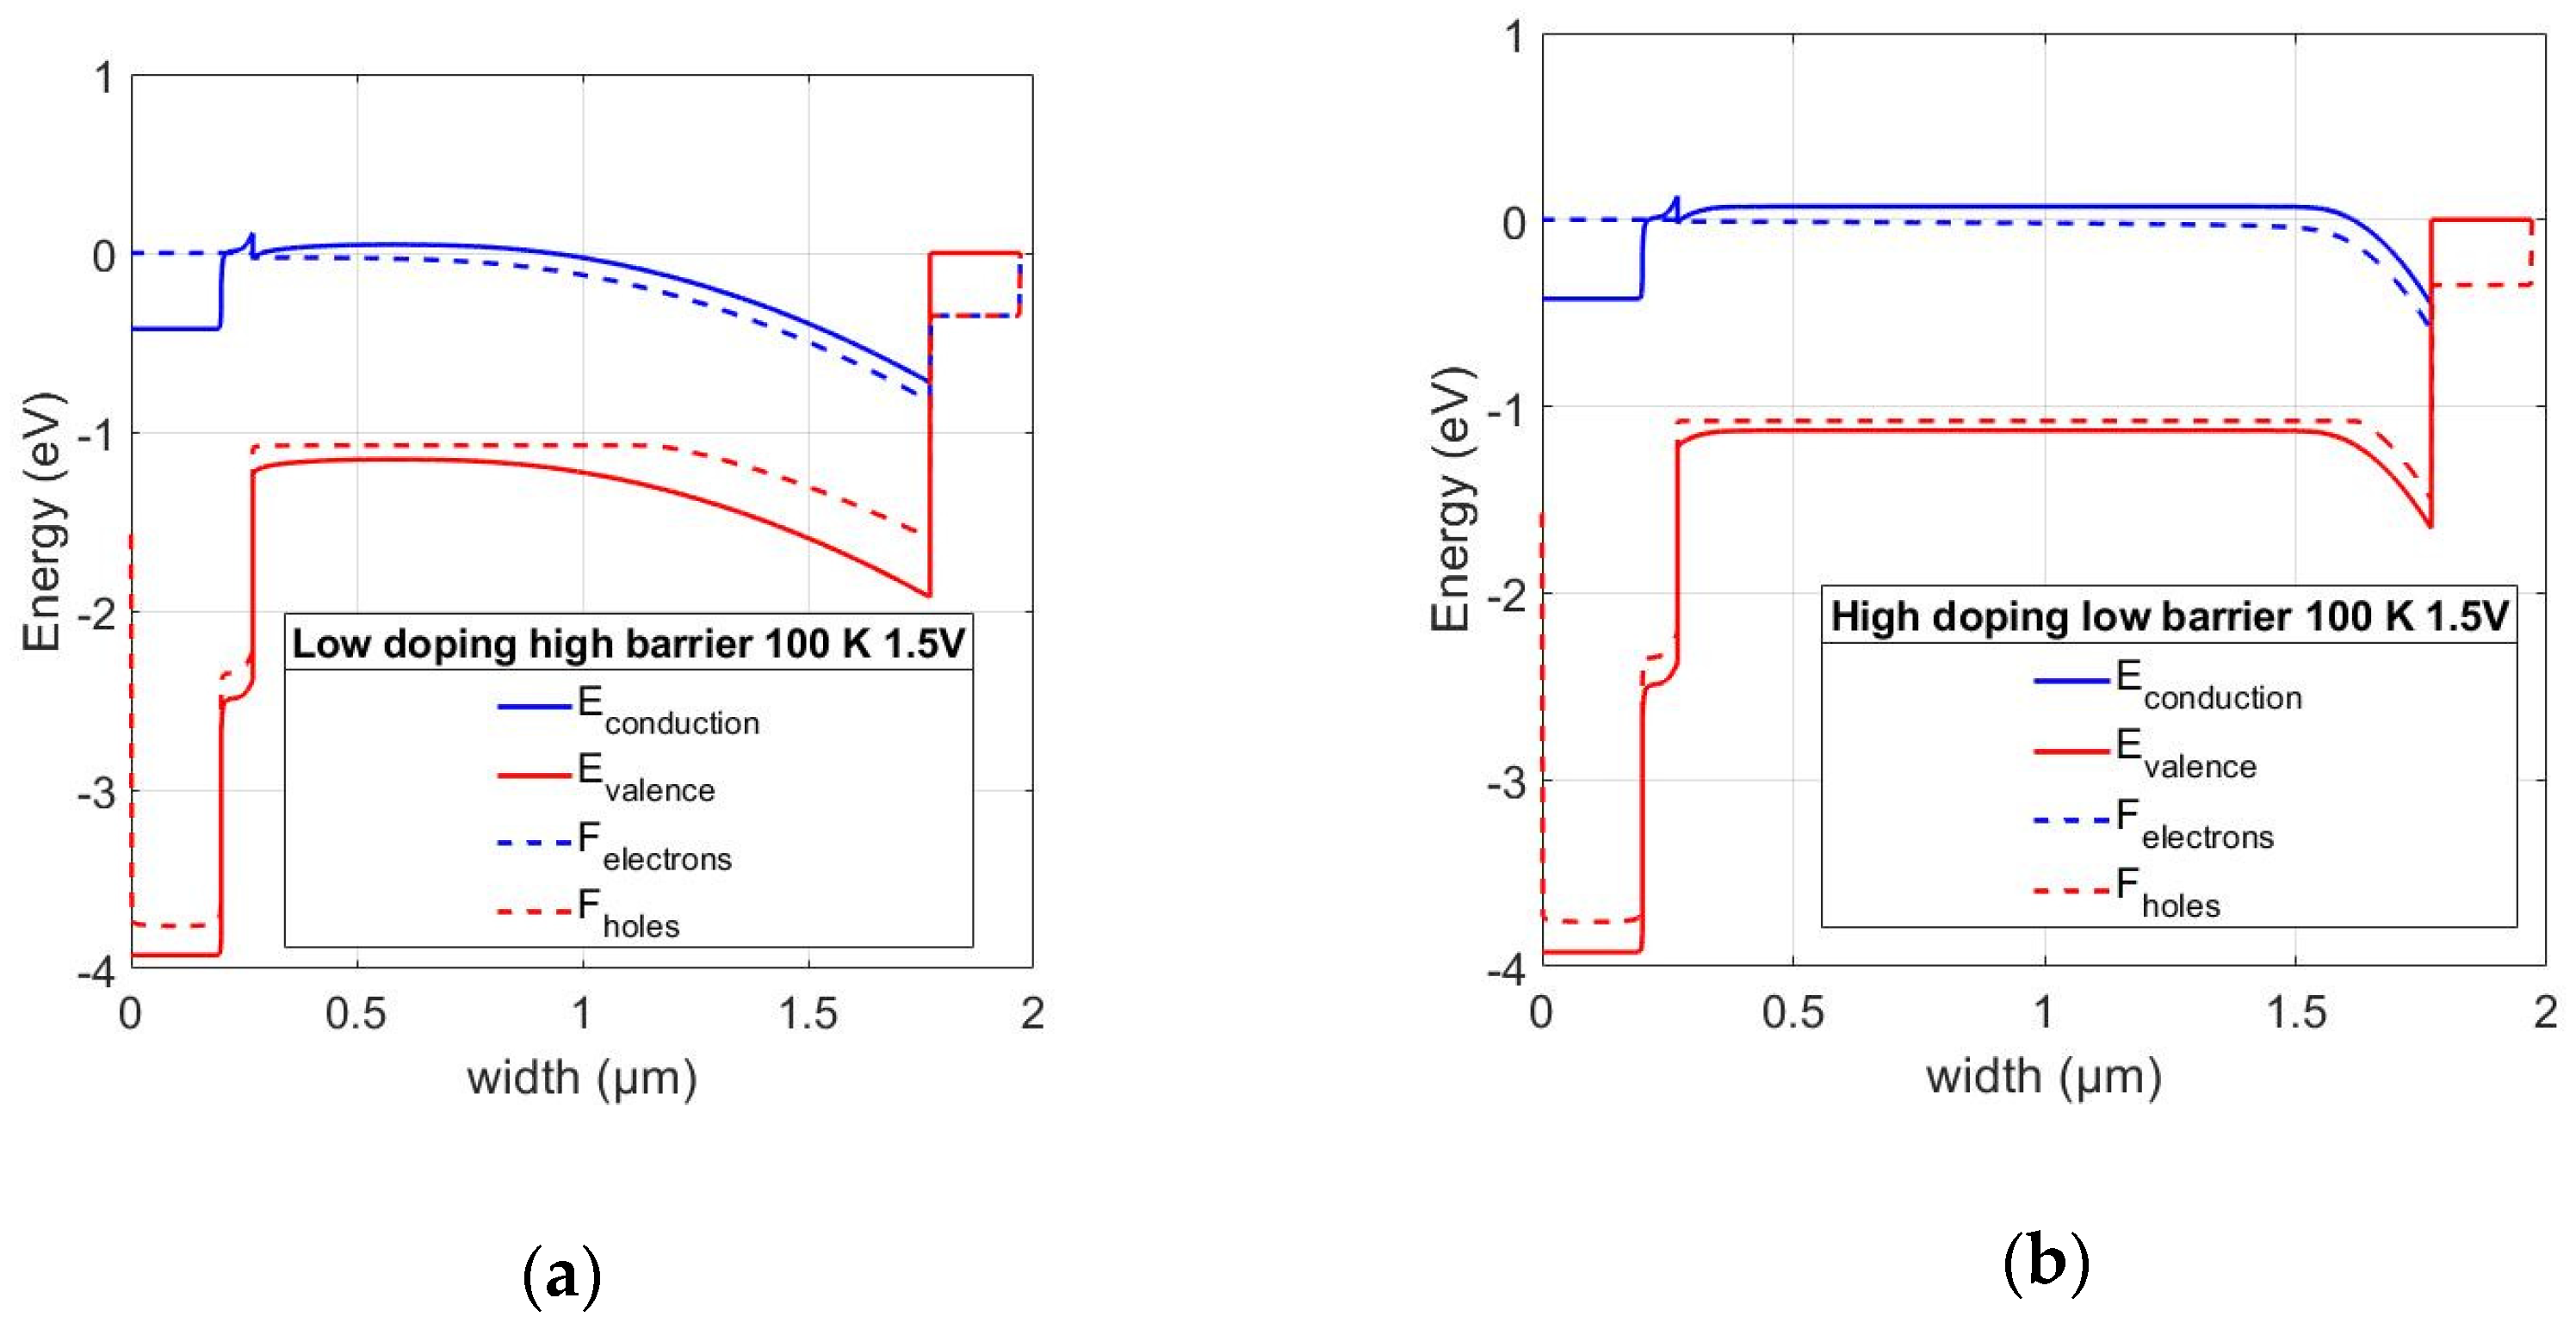
- The punch-through effect was found to affect devices with thin and low-doping absorbers, as both SCRs overlap. The consequence is a rapid increase in the electron current, affecting Voc in turn.
Author Contributions
Funding
Acknowledgments
Conflicts of Interest
References
- Nakamura, M.; Yamaguchi, K.; Kimoto, Y.; Yasaki, Y.; Kato, T.; Sugimoto, H. Cd-Free Cu(In,Ga)(Se,S)2 Thin-Film Solar Cell With Record Efficiency of 23.35%. IEEE J. Photovolt. 2019, 9, 1863–1867. [Google Scholar] [CrossRef]
- Stoelzel, M.; Algasinger, M.; Zelenina, A.; Weber, A.; Sode, M.; Schubbert, C.; Eraerds, P.; Lechner, R.; Dalibor, T.; Palm, J. Absorber Optimization in CIGSSe Modules with a Sputtered ZnOS Buffer Layer at 19% Efficiency. In Proceedings of the 36th European Photovoltaic Solar Energy Conference and Exhibition, Marseille, France, 9 September 2019. [Google Scholar] [CrossRef]
- Zhu, H.; Niu, X.; Wan, M.; Mai, Y. A study of ZnO:Al thin films reactively sputtered under the control of target voltage for application in Cu(In,Ga)Se2 thin film solar cells. Vacuum 2019, 161, 297–305. [Google Scholar] [CrossRef]
- Zhang, W.; Demirkan, K.; Zapalac, G.; Spaulding, D.; Titus, J.; Mackie, N. Optimizing CdS Buffer Layer For CIGS Based Thin Film Solar Cell. In Proceedings of the 44th Photovoltaic Specialist Conference (PVSC), Washington, DC, USA, 25–30 June 2017. [Google Scholar] [CrossRef]
- Garris, R.L.; Mannsfield, L.M.; Egaas, B.; Ramanathan, K. Low-Cd CIGS Solar Cells Made With a Hybrid CdS/Zn(O,S) Buffer Layer. IEEE J. Photovolt. 2017, 7, 281–285. [Google Scholar] [CrossRef]
- Kim, S.; Mina, M.S.; Kim, K.; Gwak, J.; Kim, J. Application of a Sn4+ doped In2S3 thin film in a CIGS solar cell as a buffer layer. Sustain. Energy Fuels 2020, 4, 362–368. [Google Scholar] [CrossRef]
- Peterson, J.; Torndahl, T.; Platzer-Bjorkman, C.; Hultqvist, A.; Edoff, M. The Influence of Absorber Thickness on Cu(In,Ga)Se2 Solar Cells With Different Buffer Layers. IEEE J. Photovolt. 2013, 3, 1376–1382. [Google Scholar] [CrossRef]
- Edoff, M.; Chen, W.C.; Gordon, I.; Vermang, B.; Bolt, P.J.; Deelen, J.; Simor, M.; Flandre, D.; Lontchi, J.; Kovacic, M.; et al. Ultrathin CIGS Solar Cells with Passivated and Highly Reflective Back Contacts—Results from the ARCIGS-M Consortium. In Proceedings of the 36th European Photovoltaic Solar Energy Conference and Exhibition, Marseille, France, 9 September 2019. [Google Scholar] [CrossRef]
- Kamikawa-Shimizu, Y.; Shimada, S.; Watanabe, M.; Yamada, A.; Sakurai, K.; Ishizuka, S.; Komaki, H.; Matsubara, K.; Shibata, H.; Tampo, H.; et al. Effects of Mo back contact thickness on the properties of CIGS solar cells. Phys. Status Solidi 2009, 206, 1063–1066. [Google Scholar] [CrossRef]
- Nakada, T.; Iga, D.; Ohbo, H.; Kunioka, A. Effects of sodium on Cu(In,Ga)Se2-based thin films and solar cells. Jpn. J. Appl. Phys. 1997, 36, 732–737. [Google Scholar] [CrossRef]
- Hariskos, D.; Hempel, W.; Menner, R.; Witte, W. Influence of Substrate Temperature during InxSy Sputtering on Cu(In,Ga)Se2/Buffer Interface Properties and Solar Cell Performance. Appl. Sci. 2020, 10, 1052. [Google Scholar] [CrossRef]
- Theelen, M.; Barreau, N.; Hans, V.; Steijvers, H.; Vroon, Z.; Zeman, M. Degradation of CIGS solar cells due to the migration of alkali-elements. In Proceedings of the 42nd Photovoltaic Specialist Conference (PVSC), New Orleans, LA, USA, 14–19 June 2015. [Google Scholar] [CrossRef]
- Salomon, O.; Hempel, W.; Kiowski, O.; Lotter, E.; Witte, W.; Ferati, A.; Schneikart, A.; Kaune, G.; Schäffler, R.; Becker, M.; et al. Influence of Molybdenum Back Contact on the PID Effect for Cu(In,Ga)Se2 Solar Cells. Coatings 2019, 9, 794. [Google Scholar] [CrossRef]
- Muzzillo, C.P.; Glynn, S.; Hacke, P.; Moutinho, H.R.; Young, M.R.; Teeter, G.; Repins, I.L.; Mansfield, L.M. Potential-Induced Degradation of Cu(In,Ga)Se2 Solar Cells: Alkali Metal Drift and Diffusion Effects. IEEE J. Photovolt. 2018, 8, 1337–1342. [Google Scholar] [CrossRef]
- Siebentritt, S. What Limits the Efficiency of Chalcopyrite Solar Cells? Sol. Energy Mater. Sol. Cells 2011, 95, 1471–1476. [Google Scholar] [CrossRef]
- Kato, T.; Kitani, K.; Tai, K.F.; Kamada, R.; Hiroi, H.; Sugimoto, H. Characterization of the Back Contact of CIGS Solar Cell as the Origin of “Rollover” Effect. In Proceedings of the 32nd European Photovoltaic Solar Energy Conference and Exhibition, Munich, Germany, 21–24 June 2016. [Google Scholar] [CrossRef]
- Hsiao, K.-J.; Liu, J.-D.; Hsieh, H.-H.; Jiang, T.-S. Electrical Impact of MoSe2 on CIGS Thin-Film Solar Cells. Phys. Chem. Chem. Phys. 2013, 15, 18174. [Google Scholar] [CrossRef] [PubMed]
- Eisenbarth, T.; Unold, T.; Caballero, R.; Kaufmann, C.A.; Schock, H.-W. Interpretation of Admittance, Capacitance-Voltage, and Current-Voltage Signatures in Cu(In,Ga)Se2 Thin Film Solar Cells. J. Appl. Phys. 2010, 107, 34509. [Google Scholar] [CrossRef]
- Rockett, A.; van Duren, J.K.J.; Pudov, A.; Shafarman, W.N. First Quadrant Phototransistor Behavior in CuInSe2 Photovoltaics. Sol. Energy Mater. Sol. Cells 2013, 118, 141–148. [Google Scholar] [CrossRef]
- Theys, B.; Klinkert, T.; Mollica, F.; Leite, E.; Donsanti, F.; Jubault, M.; Lincot, D. Revisiting Schottky Barriers for CIGS Solar Cells: Electrical Characterization of the Al/Cu(InGa)Se2 Contact. Phys. Status Solidi 2016, 213, 2425–2430. [Google Scholar] [CrossRef]
- Sites, J.R. Quantification of Losses in Thin-Film Polycrystalline Solar Cells. Sol. Energy Mater. Sol. Cells 2003, 75, 243–251. [Google Scholar] [CrossRef]
- Roland, P.J.; Bhandari, K.P.; Ellingson, R.J. Electronic Circuit Model for Evaluating S-Kink Distorted Current-Voltage Curves. In Proceedings of the 43rd Photovoltaic Specialists Conference (PVSC), Portland, OR, USA, 5–10 June 2016. [Google Scholar] [CrossRef]
- Muecke, D.; Lavrenko, T.; Lorbada, R.V.; Walter, T. On the Determination of the Back Contact Barrier Height of Cu(In,Ga)(S,Se)2 Thin Film Solar Cells. In Proceedings of the 7th World Conference on Photovoltaic Energy Conversion (WCPEC) (A Joint Conference of 45th IEEE PVSC, 28th PVSEC & 34th EU PVSEC), Waikoloa Village, HI, USA, 10–15 June 2018. [Google Scholar] [CrossRef]
- Macielak, K.; Igalson, M.; Spiering, S. Comparison of Metastabilities in CIGS Solar Cells with In2S3 and CdS Buffer Layers. In Proceedings of the 37th IEEE Photovoltaic Specialists Conference, Seattle, WA, USA, 19–24 June 2011. [Google Scholar] [CrossRef]
- Igalson, M.; Bodegård, M.; Stolt, L.; Jasenek, A. The “defected Layer” and the Mechanism of the Interface-Related Metastable Behavior in the ZnO/CdS/Cu(In,Ga)Se2 Devices. Thin Solid Films 2003, 431–432, 153–157. [Google Scholar] [CrossRef]
- Igalson, M.; Zabierowski, P.; Prządo, D.; Urbaniak, A.; Edoff, M.; Shafarman, W.N. Understanding Defect-Related Issues Limiting Efficiency of CIGS Solar Cells. Sol. Energy Mater. Sol. Cells 2009, 93, 1290–1295. [Google Scholar] [CrossRef]
- Igalson, M.; Cwil, M.; Edoff, M. Metastabilities in the Electrical Characteristics of CIGS Devices: Experimental Results vs Theoretical Predictions. Thin Solid Films 2007, 515, 6142–6146. [Google Scholar] [CrossRef]
- Scheer, R.; Schock, H.-W. Chalcogenide Photovoltaics; Wiley-VCH Verlag GmbH & Co. KGaA: Weinheim, Germany, 2013. [Google Scholar] [CrossRef]
- Lany, S.; Zunger, A. Light- and Bias-Induced Metastabilities in Cu(In,Ga)Se2 Based Solar Cells Caused by the (VSe-VCu) Vacancy Complex. J. Appl. Phys. 2006, 100, 113725. [Google Scholar] [CrossRef]
- Ott, T.; Walter, T.; Hariskos, D.; Kiowski, O.; Schaffler, R. Accelerated Aging and Contact Degradation of CIGS Solar Cells. In Proceedings of the IEEE 38th Photovoltaic Specialists Conference (PVSC), Austin, TX, USA, 3–8 June 2012. [Google Scholar] [CrossRef]
- Nakada, T.; Kunioka, A. Sequential Sputtering/Selenization Technique for the Growth of CuInSe2 Thin Films. Jpn. J. Appl. Phys. 1998, 37, L1065–L1067. [Google Scholar] [CrossRef]
- Bronzoni, M.; Colace, L.; De Iacovo, A.; Laudani, A.; Lozito, G.; Lucaferri, V.; Radicioni, M.; Rampino, S. Equivalent Circuit Model for Cu(In,Ga)Se2 Solar Cells Operating at Different Temperatures and Irradiance. Electronics 2018, 7, 324. [Google Scholar] [CrossRef]
- Demtsu, S.H.; Sites, J.R. Effect of Back-Contact Barrier on Thin-Film CdTe Solar Cells. Thin Solid Films 2006, 510, 320–324. [Google Scholar] [CrossRef]
- Ott, T.; Walter, T.; Unold, T. Phototransistor Effects in Cu(In,Ga)Se2 Solar Cells. Thin Solid Films 2013, 535, 275–278. [Google Scholar] [CrossRef]
- Ott, T.; Schönberger, F.; Walter, T.; Hariskos, D.; Kiowski, O.; Salomon, O.; Schäffler, R. Verification of Phototransistor Model for Cu(In,Ga)Se2 Solar Cells. Thin Solid Films 2015, 582, 392–396. [Google Scholar] [CrossRef]
- Sze, S.M.; Ng, K.K. Physics of Semiconductor Devices, 3rd ed.; John Wiley & Sons, Inc.: Hoboken, NJ, USA, 2006. [Google Scholar] [CrossRef]
- Ott, T.; Walter, T.; Schäffler, R.; Fecht, H.-J. Punch-Through Effect in CIGS Thin Film Solar Cells. In Proceedings of the 32nd European Photovoltaic Solar Energy Conference and Exhibition, Munich, Germany, 21–24 June 2016. [Google Scholar] [CrossRef]
- Roussillon, Y.; Karpov, V.G.; Shvydka, D.; Drayton, J.; Compaan, A.D. Back Contact and Reach-through Diode Effects in Thin-Film Photovoltaics. J. Appl. Phys. 2004, 96, 7283–7288. [Google Scholar] [CrossRef]
- Mack, P.; Ott, T.; Walter, T.; Hariskos, D.; Schäffler, R. Optimization of Reliability and Metastability of CIGS Solar Cell Parameters. In Proceedings of the 25th European Photovoltaic Solar Energy Conference and Exhibition/5th World Conference on Photovoltaic Energy Conversion, Valencia, Spain, 6–10 September 2010. [Google Scholar] [CrossRef]
- Walter, T. Admittance Spectroscopy. In Capacitance Spectroscopy of Semiconductors; Li, J.V., Ferrari, G., Eds.; Jenny Stanford Publishing: Singapore, 2018; pp. 154–196. [Google Scholar] [CrossRef]
- Labotec. Available online: http://www.labotec.co.za/wp-content/uploads/2016/07/WTL-WKL-Compact-Chambers-Brochure.pdf (accessed on 5 August 2020).
- Tektronix. Available online: https://www.tek.com/document/brochure/model-4200-scs-semiconductor-characterization-system (accessed on 5 August 2020).
- Oxford Instruments Nanoscience. Available online: https://nanoscience.oxinst.com/products/cryostats-for-spectroscopy/optistatdn-v (accessed on 5 August 2020).
- Keysight. Available online: https://www.keysight.com/en/pd-153734-pn-4155C/semiconductor-parameter-analyzer (accessed on 5 August 2020).
- Keysight. Available online: https://www.keysight.com/de/pd-330690-pn-4192A/lf-impedance-analyzer-5-hz-to-13-mhz (accessed on 5 August 2020).
- Synopsys. Available online: https://www.synopsys.com/silicon/tcad.html (accessed on 5 August 2020).
- Levcenco, S.; Doka, S.; Tezlevan, D.; Marrón, D.F.; Kulyuk, L.; Schedel-Niedrig, T.; Lux-Steiner, M.C.; Arushanov, E. Temperature dependence of the exciton gap in monocrystalline CuGaS2. Physica B 2010, 405, 3547–3550. [Google Scholar] [CrossRef]
- Elanzeery, H.; Babbe, F.; Melchiorre, M.; Werner, F.; Siebentritt, S. High-Performance Low Bandgap Thin Film Solar Cells for Tandem Applications. Prog. Photovolt. Res. Appl. 2018, 26, 437–442. [Google Scholar] [CrossRef]


| Layer | Doping Level (cm−3) | Bandgap (eV) | Electron Affinity (eV) | Mobility e/h (cm2/Vs) | Thickness (µm) |
|---|---|---|---|---|---|
| Mo | - | - | 5.6–5.3 1 | - | 0.2 |
| CIGS | 7 × 10¹⁴–1 × 10¹⁶ | 1.2 | 4.6 | 100/25 | 1.5–2.0 |
| CdS | 1 × 10¹⁷ | 2.5 | 4.5 | 100/25 | 0.05 |
| ZnO | 1 × 10²⁰ | 3.4 | 4.6 | 100/25 | 0.2 |
© 2020 by the authors. Licensee MDPI, Basel, Switzerland. This article is an open access article distributed under the terms and conditions of the Creative Commons Attribution (CC BY) license (http://creativecommons.org/licenses/by/4.0/).
Share and Cite
Vidal Lorbada, R.; Walter, T.; Fuertes Marrón, D.; Muecke, D.; Lavrenko, T.; Salomon, O.; Schaeffler, R. Phototransistor Behavior in CIGS Solar Cells and the Effect of the Back Contact Barrier. Energies 2020, 13, 4753. https://doi.org/10.3390/en13184753
Vidal Lorbada R, Walter T, Fuertes Marrón D, Muecke D, Lavrenko T, Salomon O, Schaeffler R. Phototransistor Behavior in CIGS Solar Cells and the Effect of the Back Contact Barrier. Energies. 2020; 13(18):4753. https://doi.org/10.3390/en13184753
Chicago/Turabian StyleVidal Lorbada, Ricardo, Thomas Walter, David Fuertes Marrón, Dennis Muecke, Tetiana Lavrenko, Oliver Salomon, and Raymund Schaeffler. 2020. "Phototransistor Behavior in CIGS Solar Cells and the Effect of the Back Contact Barrier" Energies 13, no. 18: 4753. https://doi.org/10.3390/en13184753
APA StyleVidal Lorbada, R., Walter, T., Fuertes Marrón, D., Muecke, D., Lavrenko, T., Salomon, O., & Schaeffler, R. (2020). Phototransistor Behavior in CIGS Solar Cells and the Effect of the Back Contact Barrier. Energies, 13(18), 4753. https://doi.org/10.3390/en13184753