Article

Dynamic Modelling and Techno-Economic Assessment of a Compressed Heat Energy Storage System: Application in a 26-MW Wind Farm in Spain

by
Violeta Sánchez-Canales
1,
Jorge Payá
1,*,
José M. Corberán
1 and
Abdelrahman H. Hassan
1,2
1
Instituto Universitario de Investigación en Ingeniería Energética, Universitat Politècnica de València, 46022 Valencia, Spain
2
Mechanical Power Engineering Department, Faculty of Engineering, Zagazig University, Zagazig 44519, Egypt
*
Author to whom correspondence should be addressed.
Energies 2020, 13(18), 4739; https://doi.org/10.3390/en13184739
Submission received: 19 June 2020 / Revised: 3 September 2020 / Accepted: 10 September 2020 / Published: 11 September 2020
(This article belongs to the Section D: Energy Storage and Application)

Abstract

:
One of the main challenges for a further integration of renewable energy sources in the electricity grid is the development of large-scale energy storage systems to overcome their intermittency. This paper presents the concept named CHEST (Compressed Heat Energy STorage), in which the excess electricity is employed to increase the temperature of a heat source by means of a high-temperature heat pump. This heat is stored in a combination of latent and sensible heat storage systems. Later, the stored heat is used to drive an organic Rankine cycle, and hereby to produce electricity when needed. A novel application of this storage system is presented by exploring its potential integration in the Spanish technical constraints electricity market. A detailed dynamic model of the proposed CHEST system was developed and applied to a case study of a 26-MW wind power plant in Spain. Different capacities of the storage system were assessed for the case under study. The results show that roundtrip efficiencies above 90% can be achieved in all the simulated scenarios and that the CHEST system can provide from 1% to 20% of the total energy contribution of the power plant, depending on its size. The CHEST concept could be economically feasible if its capital expenditure (CAPEX) ranges between 200 and 650 k€/MW.

1. Introduction

One on the main challenges in the current energy context is a further penetration of renewable energy sources (RESs) into the electricity grid. Unlike fossil fuels, RESs are influenced by meteorological conditions that affect their predictability and reliability, hereby adding uncertainty to the electrical grid. In this context, energy storage is a key point to promote better integration of RESs and to overcome their volatility. Energy storage can help to recover the excess energy coming from RESs in order to use it later in moments of high energy demand [1,2].
Currently, the most developed large-scale energy storage techniques are pumped hydro storage (PHS) and compressed air energy storage (CAES). Both of them have good efficiencies (65–85% for PHS and up to 80% for CAES), large lifetimes of 30–60 years, and high reliability, which is expected to increase due to the improvement of the maintenance and operation techniques, especially for the case of PHS [3]. However, the previous systems also present drawbacks related to location constraints and to their negative environmental impact [4].
Recently, another technology is being developed, based on thermal energy storage (TES). This concept is known as pumped thermal energy storage (PTES). In the PTES concept, the excess electricity is used to increase the temperature of a heat source (e.g., industrial waste heat, seasonal pit thermal storage, etc.), storing the energy in a TES system and converting it again into electricity by means of a heat engine cycle. PTES systems offer more flexibility than PHS or CAES, as they can provide heat and/or electricity depending on the needs [5].
Steinmann [6] compared different electricity storage alternatives, such as CAES, power-to-heat-to-power and PTES, in terms of efficiencies and costs. He explained the possibility of using not only the electric energy but also the thermal one, enabling a better adaptation to the customer needs. The conclusions showed the benefits of PTES systems, as they do not have geological restrictions; do not use fossil fuels to drive their components (unlike CAES systems); have low environmental impact, especially if the working fluids chosen have ultra-low global warming potential (GWP) values; and have higher efficiencies.
Several studies can be found in the literature regarding PTES technologies. Some authors have compared different configurations of PTES systems [7,8,9] or have carried out steady-state thermodynamic analysis of PTES using different refrigerants [10,11]. Other thermodynamic studies have been performed varying the maximum temperature of the cycle and the material of the storage system [12] or designing a PTES system with reused components of a thermal power plant [13]. The integration of a PTES system in the energy grid has also been assessed by Maximov et al. [14]. However, the transient behavior of the technology still has not been addressed.
This paper focuses on a particular PTES configuration, named CHEST (Compressed Heat Energy STorage), which was initially presented by Steinmann [15]. The CHEST system comprises a high-temperature heat pump (HTHP), where low-temperature heat can be recovered (e.g., heat from industrial waste) and used as a heat source [16,17]. The HTHP is driven by the excess electricity from RESs, to charge a high-temperature TES system (charging cycle), and an organic Rankine cycle (ORC) is used to discharge the TES system and produce the required electricity. In their work, the authors performed a deep analysis of the CHEST concept, highlighting its advantages in comparison with other PTES systems based on Brayton or transcritical CO2 cycles.
Jockenhöfer et al. [5] studied a CHEST system coupled with a low-temperature heat source. Their model refers to a system with an input power of 1 MW working in steady-state conditions. Firstly, different kinds of refrigerants were analyzed, finding that isentropic fluids, with an almost vertical saturation line, achieved the best performance as they minimize the subcooling or superheating needed. Finally, butene was selected as refrigerant for both HTHP and ORC.
Hassan et al. [18] presented a thermodynamic steady-state model of a 1-MWe CHEST system (EES-CHEST model). Their model was validated with the one presented by Jockenhöfer et al. [5] and a parametric study was performed, assessing different refrigerants and cycle configurations for an extensive range of source and sink temperatures. In this work, the possibility of having different working fluids for the HTHP and the ORC was also studied. The results showed that, for a high-temperature TES system at 133 °C, R1233zd(E) and R-1234ze(Z) were the best options in the instance of having the same refrigerant in both the HTHP and the ORC. In the case of using different refrigerants, the best combination found was R-1233zd(E) for the HTHP and butene for the ORC.
Finally, in Steinmann et al. [19], several applications of a CHEST system for the management and dispatch of electricity and heat were presented. The proposed CHEST system uses butene as the working fluid and KNO3-LiNO3 as the phase change material (PCM) to store the latent heat. The system considered the integration with a smart district heating (SDH) network, which permits control of the sink and source temperatures. Six different working modes, or the combination of source and sink temperatures, were proposed.
So far, studies regarding PTES or CHEST technologies have mainly focused on thermodynamic analysis in steady-state conditions. The current work aimed to go a step further, introducing the following novelties:
  • Development of a transient thermal model of a CHEST system, using the TRNSYS simulation program [20], which includes the thermodynamic interactions of the HTHP and ORC, their partial load behavior, and the power profile of the available energy to charge the system.
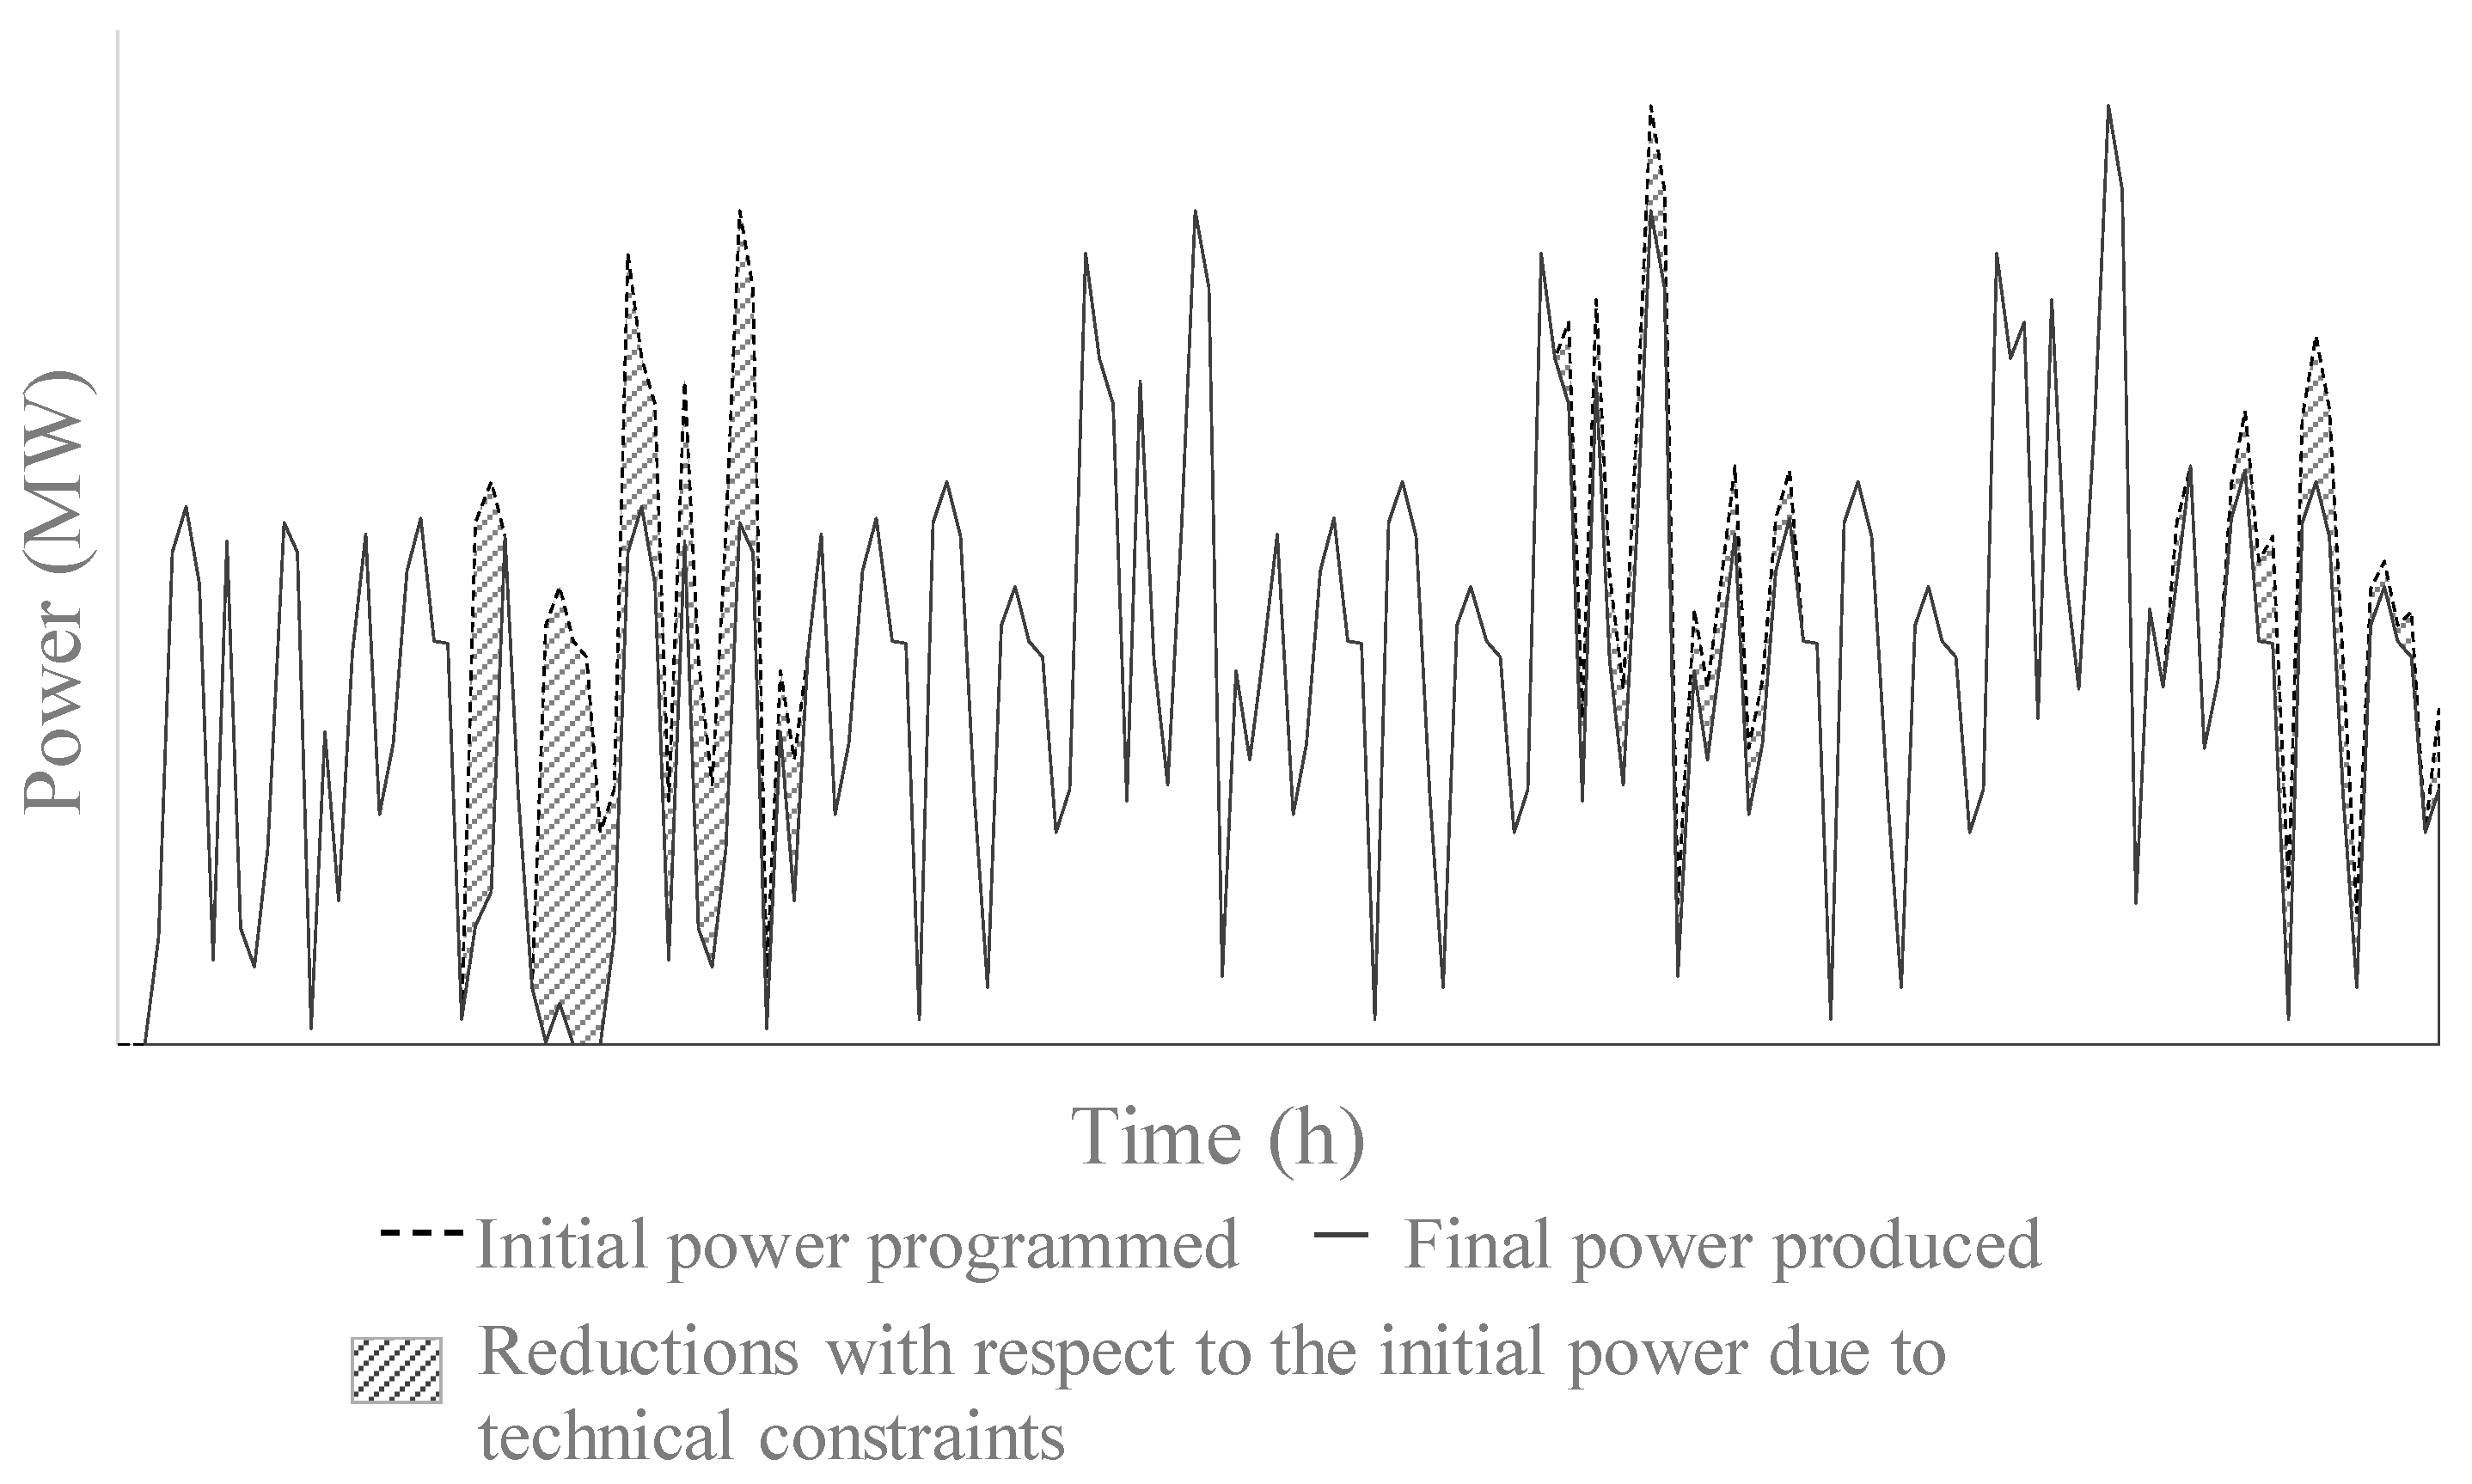
  • Techno-economic assessment of the CHEST system when introduced to the Spanish technical constraints market, using real data of a 26-MW wind power plant for the year 2018. Different capacities and charging conditions for the CHEST system were studied in order to find a suitable solution for the power plant under study.
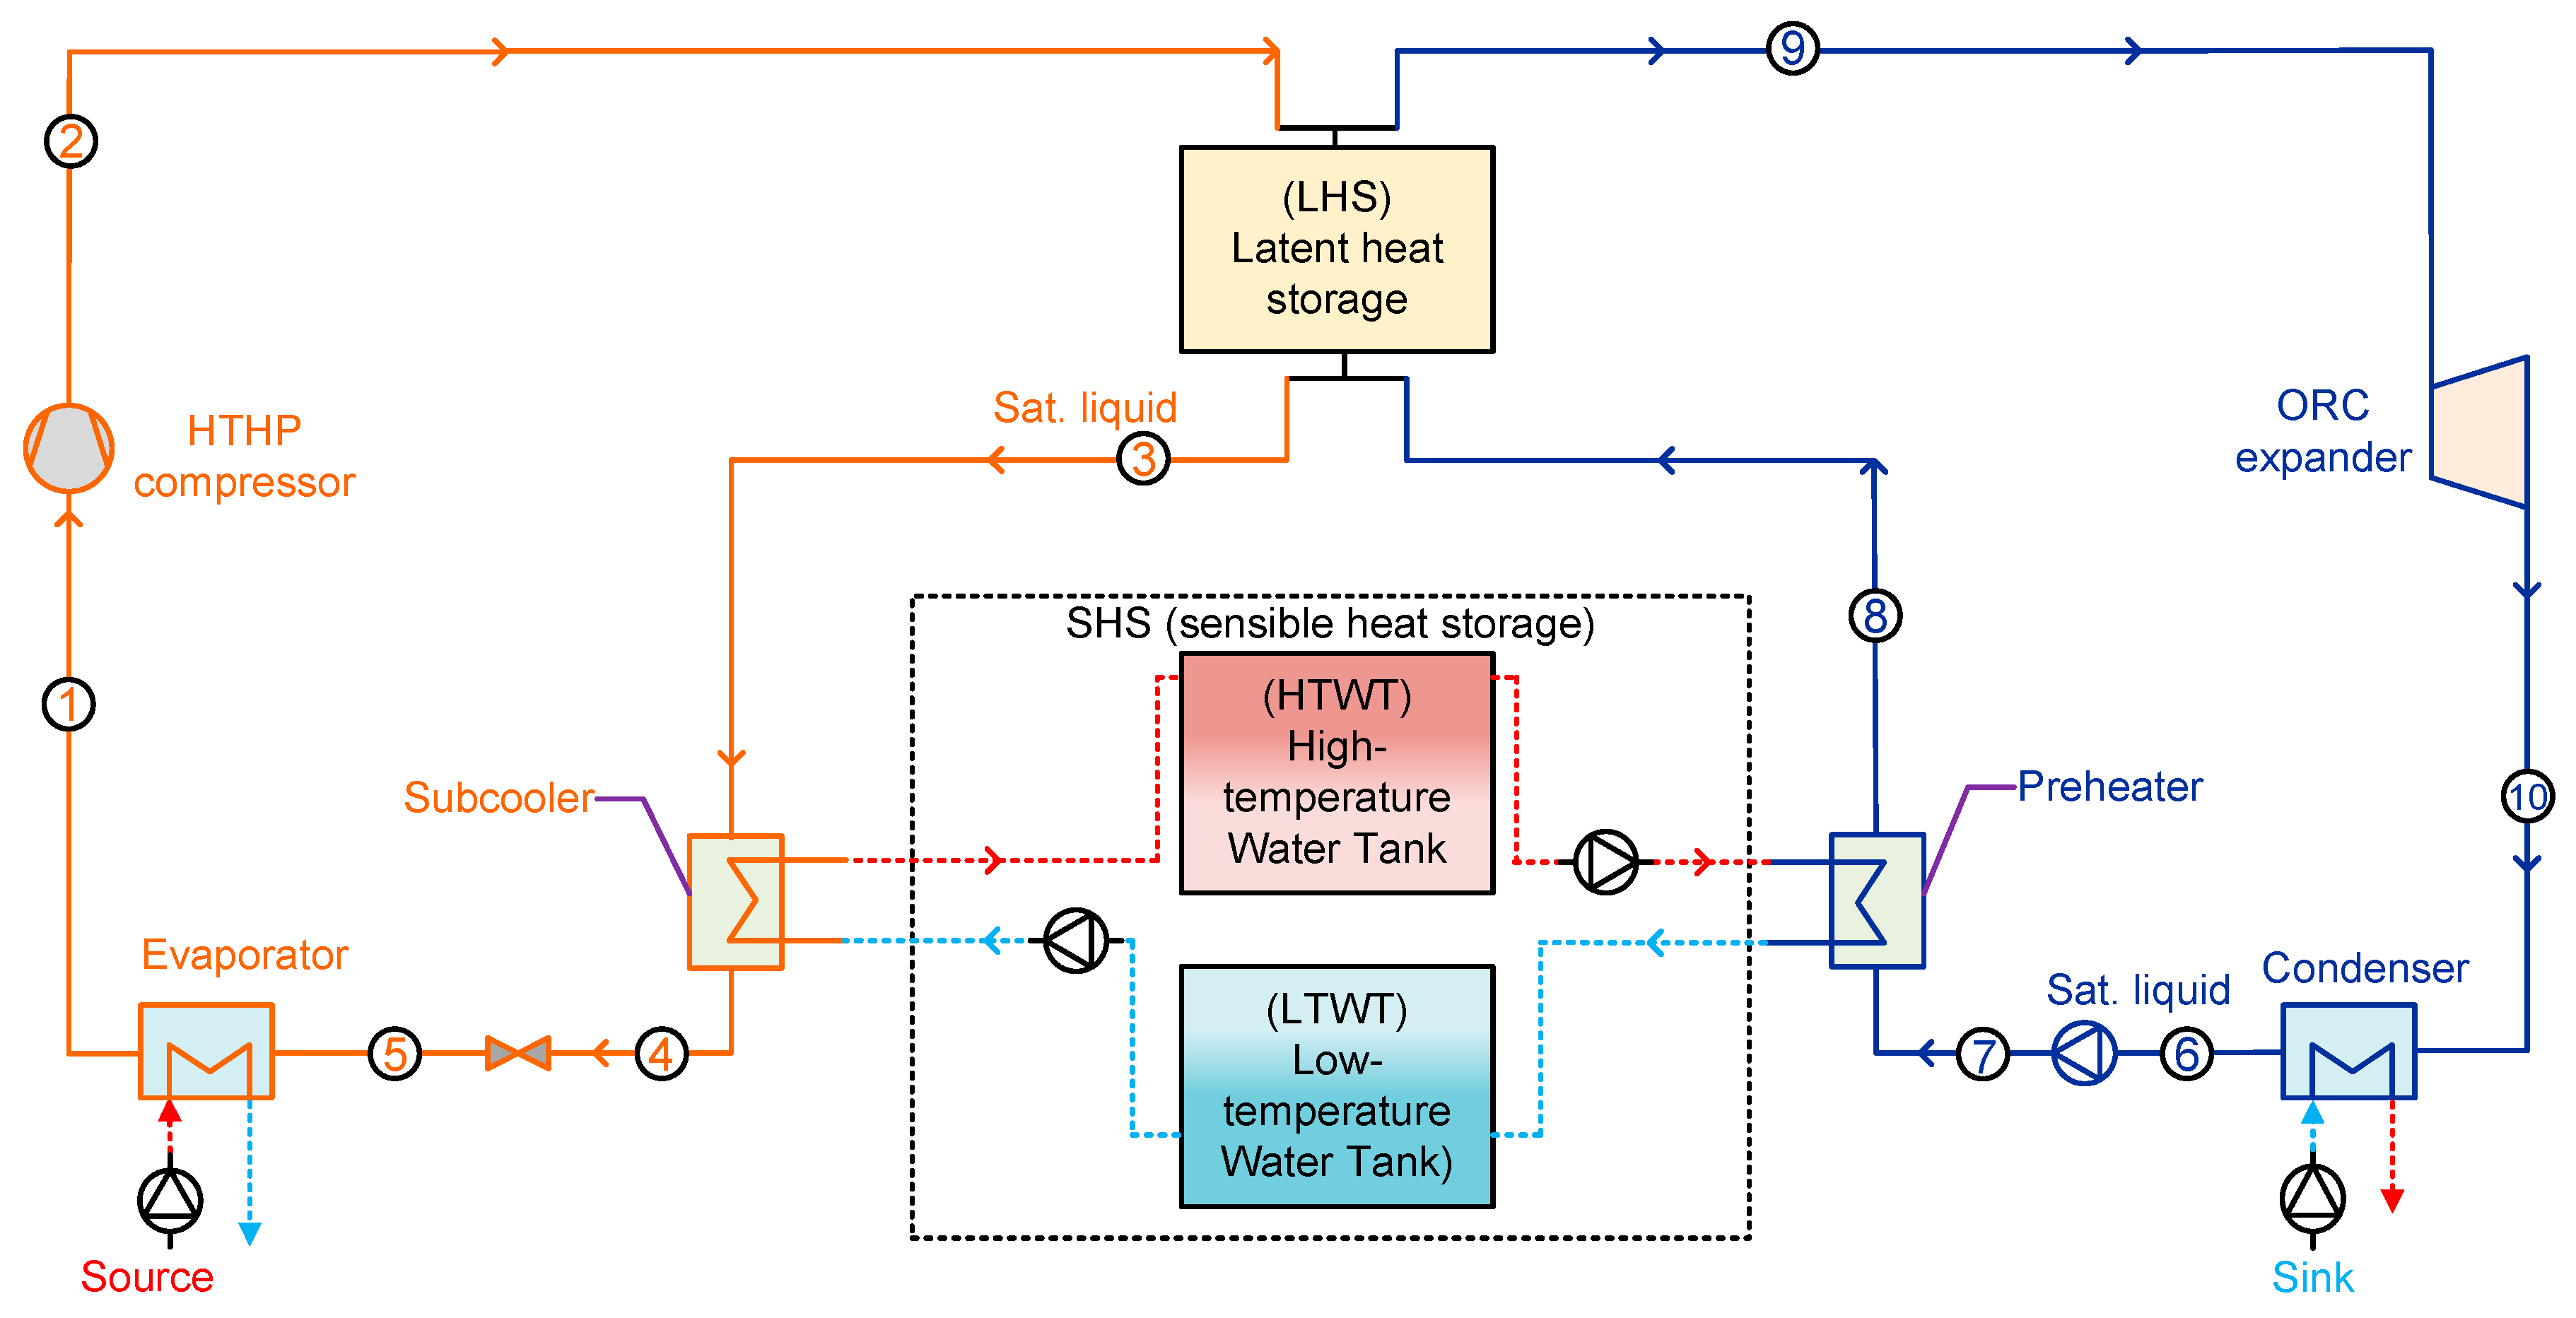
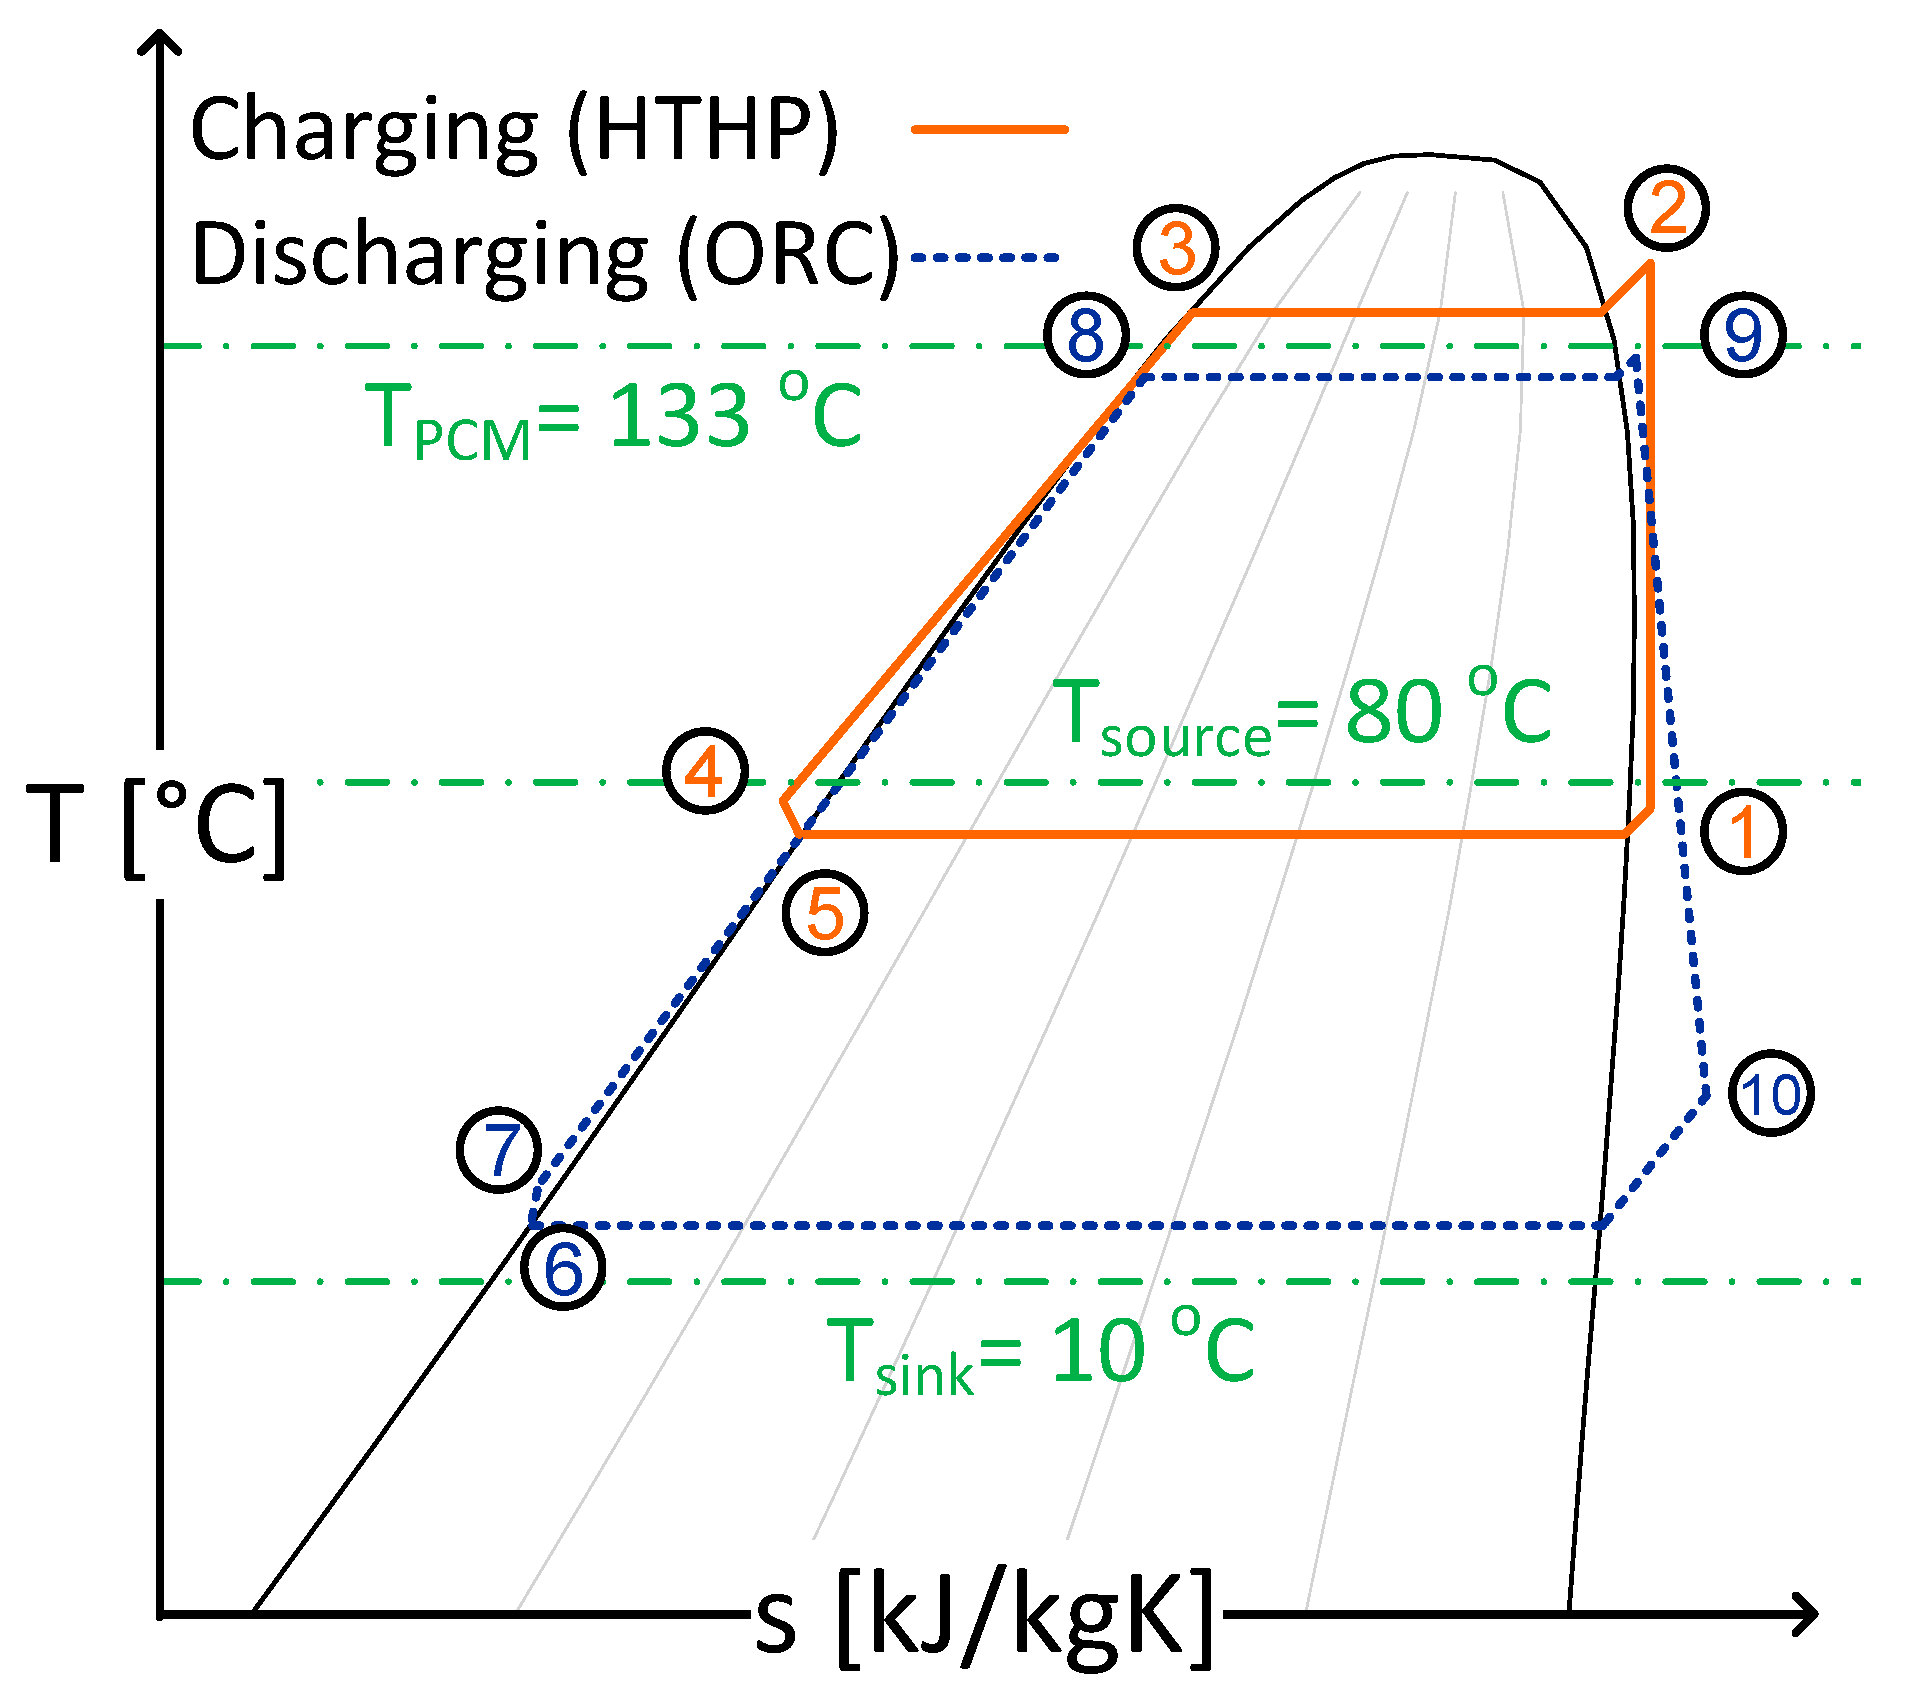
2. CHEST Concept

The CHEST system components and the thermodynamic cycle on a T-s diagram are summarized in Figure 1 and Figure 2, respectively.
During the charging cycle (orange lines in Figure 1 and Figure 2), the surplus electricity from RESs is used to drive the compressor of the HTHP (1–2). Then, the refrigerant is condensed in the latent heat storage (LHS) unit (2–3), subcooled by means of the sensible heat storage (SHS) system (3–4), expanded (4–5), and finally evaporated using an external heat source (5–1). The simulated cycle is assumed to be ideal, with no pressure drop in the heat exchangers.
In the discharging cycle (blue lines in Figure 1 and Figure 2), the work realized by the expander can be used to produce electricity, for instance, when there are peak demands of electricity. The refrigerant of the ORC cycle is pumped (6–7) and preheated using the energy previously stored in the SHS (7–8). Then, it is evaporated by exchanging heat with the LHS (8–9), expanded (9–10), and finally condensed (10–6).
The TES system is depicted in Figure 1 and contains a combination of both latent and sensible heat storage sub-systems to improve the temperature profiles in the heat exchangers and to minimize the entropy generation during the heat transfer process [15]. The LHS system consists of a tank filled with PCM. During the charging process, the heat rejected during the condensation of the refrigerant melts the PCM and stores energy in the form of latent heat. In the discharging process, this stored heat is employed to evaporate the refrigerant of the ORC cycle and, in turn, the PCM turns into solid state again.
The SHS is composed of two tanks filled with water at different temperature levels. In the charging process, water from the low-temperature water tank (LTWT) goes through the subcooler of the HTHP, where it is heated up, and, later, it is stored in the high-temperature water tank (HTWT). During the discharging process, the hot water from HTWT is directed to the ORC’s preheater and then circulated back to the LTWT.

3. Dynamic Modelling of the CHEST System

3.1. General Structure of the TRNSYS-CHEST Model

Preliminary stationary models [5,15,18,21,22,23] have helped to make a screening of the potential refrigerants that could be used. For instance, in this study, butene was selected for both the HTHP and ORC cycle, since it is an isentropic refrigerant with suitable working temperatures and pressures for the studied application. Once running, the CHEST system performance is fully dynamic, since the charging or discharging processes might take several hours in a potential application. Thus, a dynamic model is necessary to understand the operating conditions, limitations, and potentials of the proposed CHEST system. TRNSYS [20] allows such analysis to be performed, since it is specially orientated for the transient simulation of energy systems. TRNSYS includes, among other, a set of basic components (types) connected with each other. The types are seen as black boxes by the user but, internally, they consist of a system of differential equations, which reproduce the dynamic behavior of each component.
A first version of the TRNSYS-CHEST model was presented by Sánchez-Canales et al. [24]. Figure 3 shows the general layout of the model with the employed TRNSYS types and their interconnections. The main types used for this model are Type 9c, necessary to read external data (e.g., energy prices and power profiles); Type 42a and 42c, employed to interpolate data between 3 and 2 independent variables, respectively; and Type 39, which is a model of a variable volume water tank [20].
In agreement with Figure 1 and Figure 2, the orange lines of Figure 3 refer to the charging cycle (HTHP) and the blue lines refer to the discharging cycle (ORC). Additionally, the red lines refer to hot water streams, the light blue lines represent cold water streams, and the green lines stand for economic parameters. The inputs of the model are indicated in brackets in Figure 3. These parameters are necessary to size the system and to define the operation strategies for any specific application. These input parameters are:
  • Size of the equipment: nominal input power to the HTHP in MW (P_el_in_nom_HP) and net output power from the ORC in MW (P_el_net_nom_ORC).
  • Dimensions of the TES systems: volume of SHS’s water tanks in m3 (V_w_max_SHS) and energy capacity of the LHS system in MWh (E_q_max_LHS).
  • Inlet water temperatures and temperature differences of the source (Twi_evap, and dT_w_evap) and sink (Twi_cond, and dT_w_cond).

3.2. Modelling of the HTHP and ORC

Both the HTHP and ORC are introduced in the TRNSYS-CHEST model by means of performance maps (TRNSYS type 42) previously generated using EES-CHEST models [18]. Such maps were created employing butene as the working fluid for both HTHP and ORC for a nominal power of 1 MWe as input to the HTHP’s compressor, and also as the net output of the ORC. The PCM material selected for the LHS was KNO3-LiNO3, an eutectic salt with a melting temperature of 133 °C [25]. The pinch point during the refrigerant condensation in the HTHP and the evaporation in the ORC was fixed at 5 K with respect to the melting point of the PCM.
Although the performance maps were generated for 1 MWe, if a different size is required for a given application, they are linearly scaled in the TRNSYS-CHEST model.
Furthermore, the possibility of working at partial load was also considered. Several studies of HTHPs found in the literature [26,27,28,29,30] have shown that variable speed compressors present an increase in the coefficient of performance (COP) (defined as the ratio between the sum of latent and sensible power heat produced and the electrical energy needed at the HTHP’s compressor) when working at a partial load (especially between 30% and 50%). This is due to the fact that the mass flow rate also decreases, leading to a lower temperature lift between the evaporator and condenser, which reduces the pressure ratio [26]. This behavior, illustrated in Figure 4, was modelled by calculating the COP at partial load as a function of the COP of the HTHP at 100% of the load (COP100) and the partial load ratio (PLR), which is the ratio between the actual compressor input power and the nominal one, following the correlation given in Equation (1):
C O P C O P 100 = 3.9861 P L R 3 7.7392 P L R 2 + 3.4466 P L R + 1.3089 .
The ORC’s performance at partial load conditions was programmed linearly as a function of the load factor, although in the present case studies, the ORC always worked at full load.
In the TRNSYS-CHEST model, the scale and partial load behavior of the equipment is modelled by means of the equation blocks “HTHP SCALE” and “ORC SCALE” (Figure 3). The latter have as inputs the nominal heat capacities obtained from the performance maps (as if they were working at 1 MWe), the size of equipment in MW (P_el_in_nom_HP, and P_el_net_nom_ORC), and the estimated actual power (P_el_in_est_HP, and P_el_net_est_ORC) in MW.
P_el_in_est_HP is calculated in “POWER CONTROL” as a function of the available energy surplus (Tech_Const_pwr) in MW and the price of the energy (En_price_hour) in € per MWh, (Equation (2)):
P _ e l _ i n _ e s t _ H P = { T e c h _ C o n s t _ p w r + P u r c h a s e d _ p w r , if P _ i n _ n o m _ H P > T e c h _ C o n s t _ p w r P _ i n _ n o m _ H P , if P _ i n _ n o m _ H P < T e c h _ C o n s t _ p w r .
The criterion that was adopted is that every time there is electric energy available to charge the system, the HTHP starts charging the CHEST system. Additionally, the model also considers the possibility of purchasing energy at low prices in the daily market in case there is no available energy surplus or in case their value is below the nominal power of the HTHP. This is achieved by means of the variable Purchased_pwr. When there is no excess energy and the energy price is above the average price of that month of the year (En_prince_month), P_el_net_est_ORC is calculated (Equation (3)). The ORC is considered to work always at full load:
P _ e l _ n e t _ e s t _ O R C = { 0 , if T e c h _ C o n s t _ p w r > 0 P _ e l _ n e t _ n o m _ O R C , if T e c h _ C o n s t _ p w r = 0   a n d   E n _ p r i c e _ h o u r > E n _ p r i c e _ m o n t h .
The outputs obtained in the “SCALE” equation blocks are the estimated sensible and latent heat capacities of the equipment in MW (Equations (4)–(7)). These parameters are calculated by multiplying the nominal value (obtained as output from the performance map) by a size factor (in case the nominal power differs from 1 MWe) and by a scale factor to assess the partial load behavior:
P _ q _ l a t _ e s t _ H P = P _ e l _ i n _ n o m _ H P 1   M W C O P P _ e l _ i n _ e s t _ H P C O P 100 P _ e l _ i n _ n o m _ H P P _ q _ l a t _ n o m _ H P ,
P _ q _ s e n _ e s t _ H P = P _ e l _ i n _ n o m _ H P 1   M W C O P P _ e l _ i n _ e s t _ H P C O P 100 P _ e l _ i n _ n o m _ H P P _ q _ s e n _ n o m _ H P ,
P _ q _ s e n _ e s t _ O R C = P _ e l _ n e t _ n o m _ O R C 1   M W P _ e l _ n e t _ e s t _ O R C P _ e l _ n e t _ n o m _ O R C P _ q _ s e n _ n o m _ O R C .
All the previous parameters are referred to as estimated values since the state of charge of the TES systems is considered in a further stage. In other words, the parameters refer to the power or heat that is supposed to be needed or produced during the functioning of the CHEST system, provided that the TES systems are not completely full or empty and still have capacity to be charged or discharged. This aspect is discussed further on in the results and discussion.

3.3. Control Strategies

Once the estimated heat capacities are calculated as a function of the “POWER CONTROL” and the criteria and size of the HTHP or the ORC, the level of charge of the TES systems is assessed in the equation block “TES CONTROL” (Figure 3). For the LHS, the amount of energy stored in the system (E_q_LHS) is compared against its maximum value (E_q_max_LHS) to check when the LHS system is full or empty. If, during a charging process, the LHS is not completely full, it keeps storing energy and the variable P_q_lat would equal the variable P_q_lat_est_HP. When the LHS is full, P_q_lat is equal to zero, as there is no more storage capacity available in the system. The discharge process is analogous; in this case, P_q_lat would be equal to -P_q_lat_est_ORC, and, when the LHS completely empties, it will also be equal to zero. This issue is summarized in Equation (8):
P _ q _ l a t = { P _ q _ l a t _ e s t _ H P , if H P = O N   a n d   0 < E _ q _ L H S < E _ q _ m a x 0 , if H P = O N   a n d   E _ q _ L H S = E _ q _ max P _ q _ l a t _ e s t _ O R C , if O R C = O N   a n d   0 < E _ q _ L H S < E _ q _ m a x 0 , if O R C = O N   a n d   E _ q _ L H S = 0 .
In the case of the SHS, a similar trend is followed as for the LHS but with two separated controls in the “TES CONTROL” equation block (Figure 3). For the charging process, the volume of water available in the LTWT (V_w_LTWT) is compared against the maximum capacity of the tank (V_w_max_SHS) and, in the case it is not empty, the variable P_q_sen_HP equals P_q_sen_est_HP (Equation (9)). Then, the water from the LTWT goes to the subcooler and heats by means of the sensible heat, up to the optimum temperature of the HTHP, T_w_out_subc (in this case, 133 °C):
P _ q _ s e n _ H P = { P _ q _ s e n _ e s t _ H P , if 0 < V _ w _ L T W T < V _ w _ m a x _ S H S 0 , if V _ w _ L T W T = 0 .
The necessary estimated water mass flow rate (m_w_est_subc) is calculated in the “SUBCOOLER” equation block (Equation (10)) and is connected to the input of Type 39 named in TRNSYS as “flow rate to load”. The actual flow rate (m_w_subc), calculated internally by the TRNSYS type 39, is obtained as output from this same type. Once the LTWT is empty, P_q_sen_HP is equal to zero and the process stops:
m _ w _ e s t _ s u b c = P _ q _ s e n _ H P C p w ( T _ w _ o u t _ s u b c T _ L T W T ) .
In this work, a value of 4.2 kJ/kgK was employed for the specific heat of water, C p w .
The discharging process is relatively similar, as indicated by Equation (11). The volume of water available in the HTWT (V_w_HTWT) is compared against its maximum capacity (V_w_max_SHS) to assess if the value of P_q_sen_ORC is equal to P_q_sen_est_ORC or zero. Water from the HTWT goes to the preheater and cools down (Equation (12)) to the optimum value T_w_out_preh, in °C (obtained as an output from the ORC’s performance map):
P _ q _ s e n _ O R C = { P _ q _ s e n _ e s t _ O R C , if 0 < V _ w _ H T W T < V _ w _ m a x _ S H S 0 , if V _ w _ H T W T = 0 , ,
m _ w _ e s t _ p r e h = P _ q _ s e n _ O R C C p w ( T _ H T W T T _ w _ o u t _ p r e h ) .
Once the storage capacities of the TES systems have been assessed, the actual values for the HTHP’s compressor power input and the ORC’s net power output can be calculated. In the case of the HTHP (Equation (13)), the charging process will last until both the LHS and SHS systems are full. In case one system fills before the other, the excess heat is assumed to be evacuated. However, this paper does not focus on the detail of how this excess heat is evacuated. For the discharging process, the ORC will work as long as either of the TES systems is empty (Equation (14)):
P _ e l _ i n _ H P = { P _ e l _ i n _ e s t _ H P , if 0 < V _ w _ L T W T < V _ w _ m a x _ S H S   o r   0 < E _ q _ L H S < E _ q _ m a x 0 , if V _ w _ L T W T = 0   a n d   E _ q _ L H S = E _ q _ m a x   ,
P e l n e t O R C = { P _ e l _ n e t _ e s t _ O R C , if 0 < V _ w _ H T W T < V _ w _ m a x _ S H S   a n d   0 < E _ q _ L H S < E _ q _ m a x 0 , if V w H T W T = 0   a n d   E q L H S = 0 .

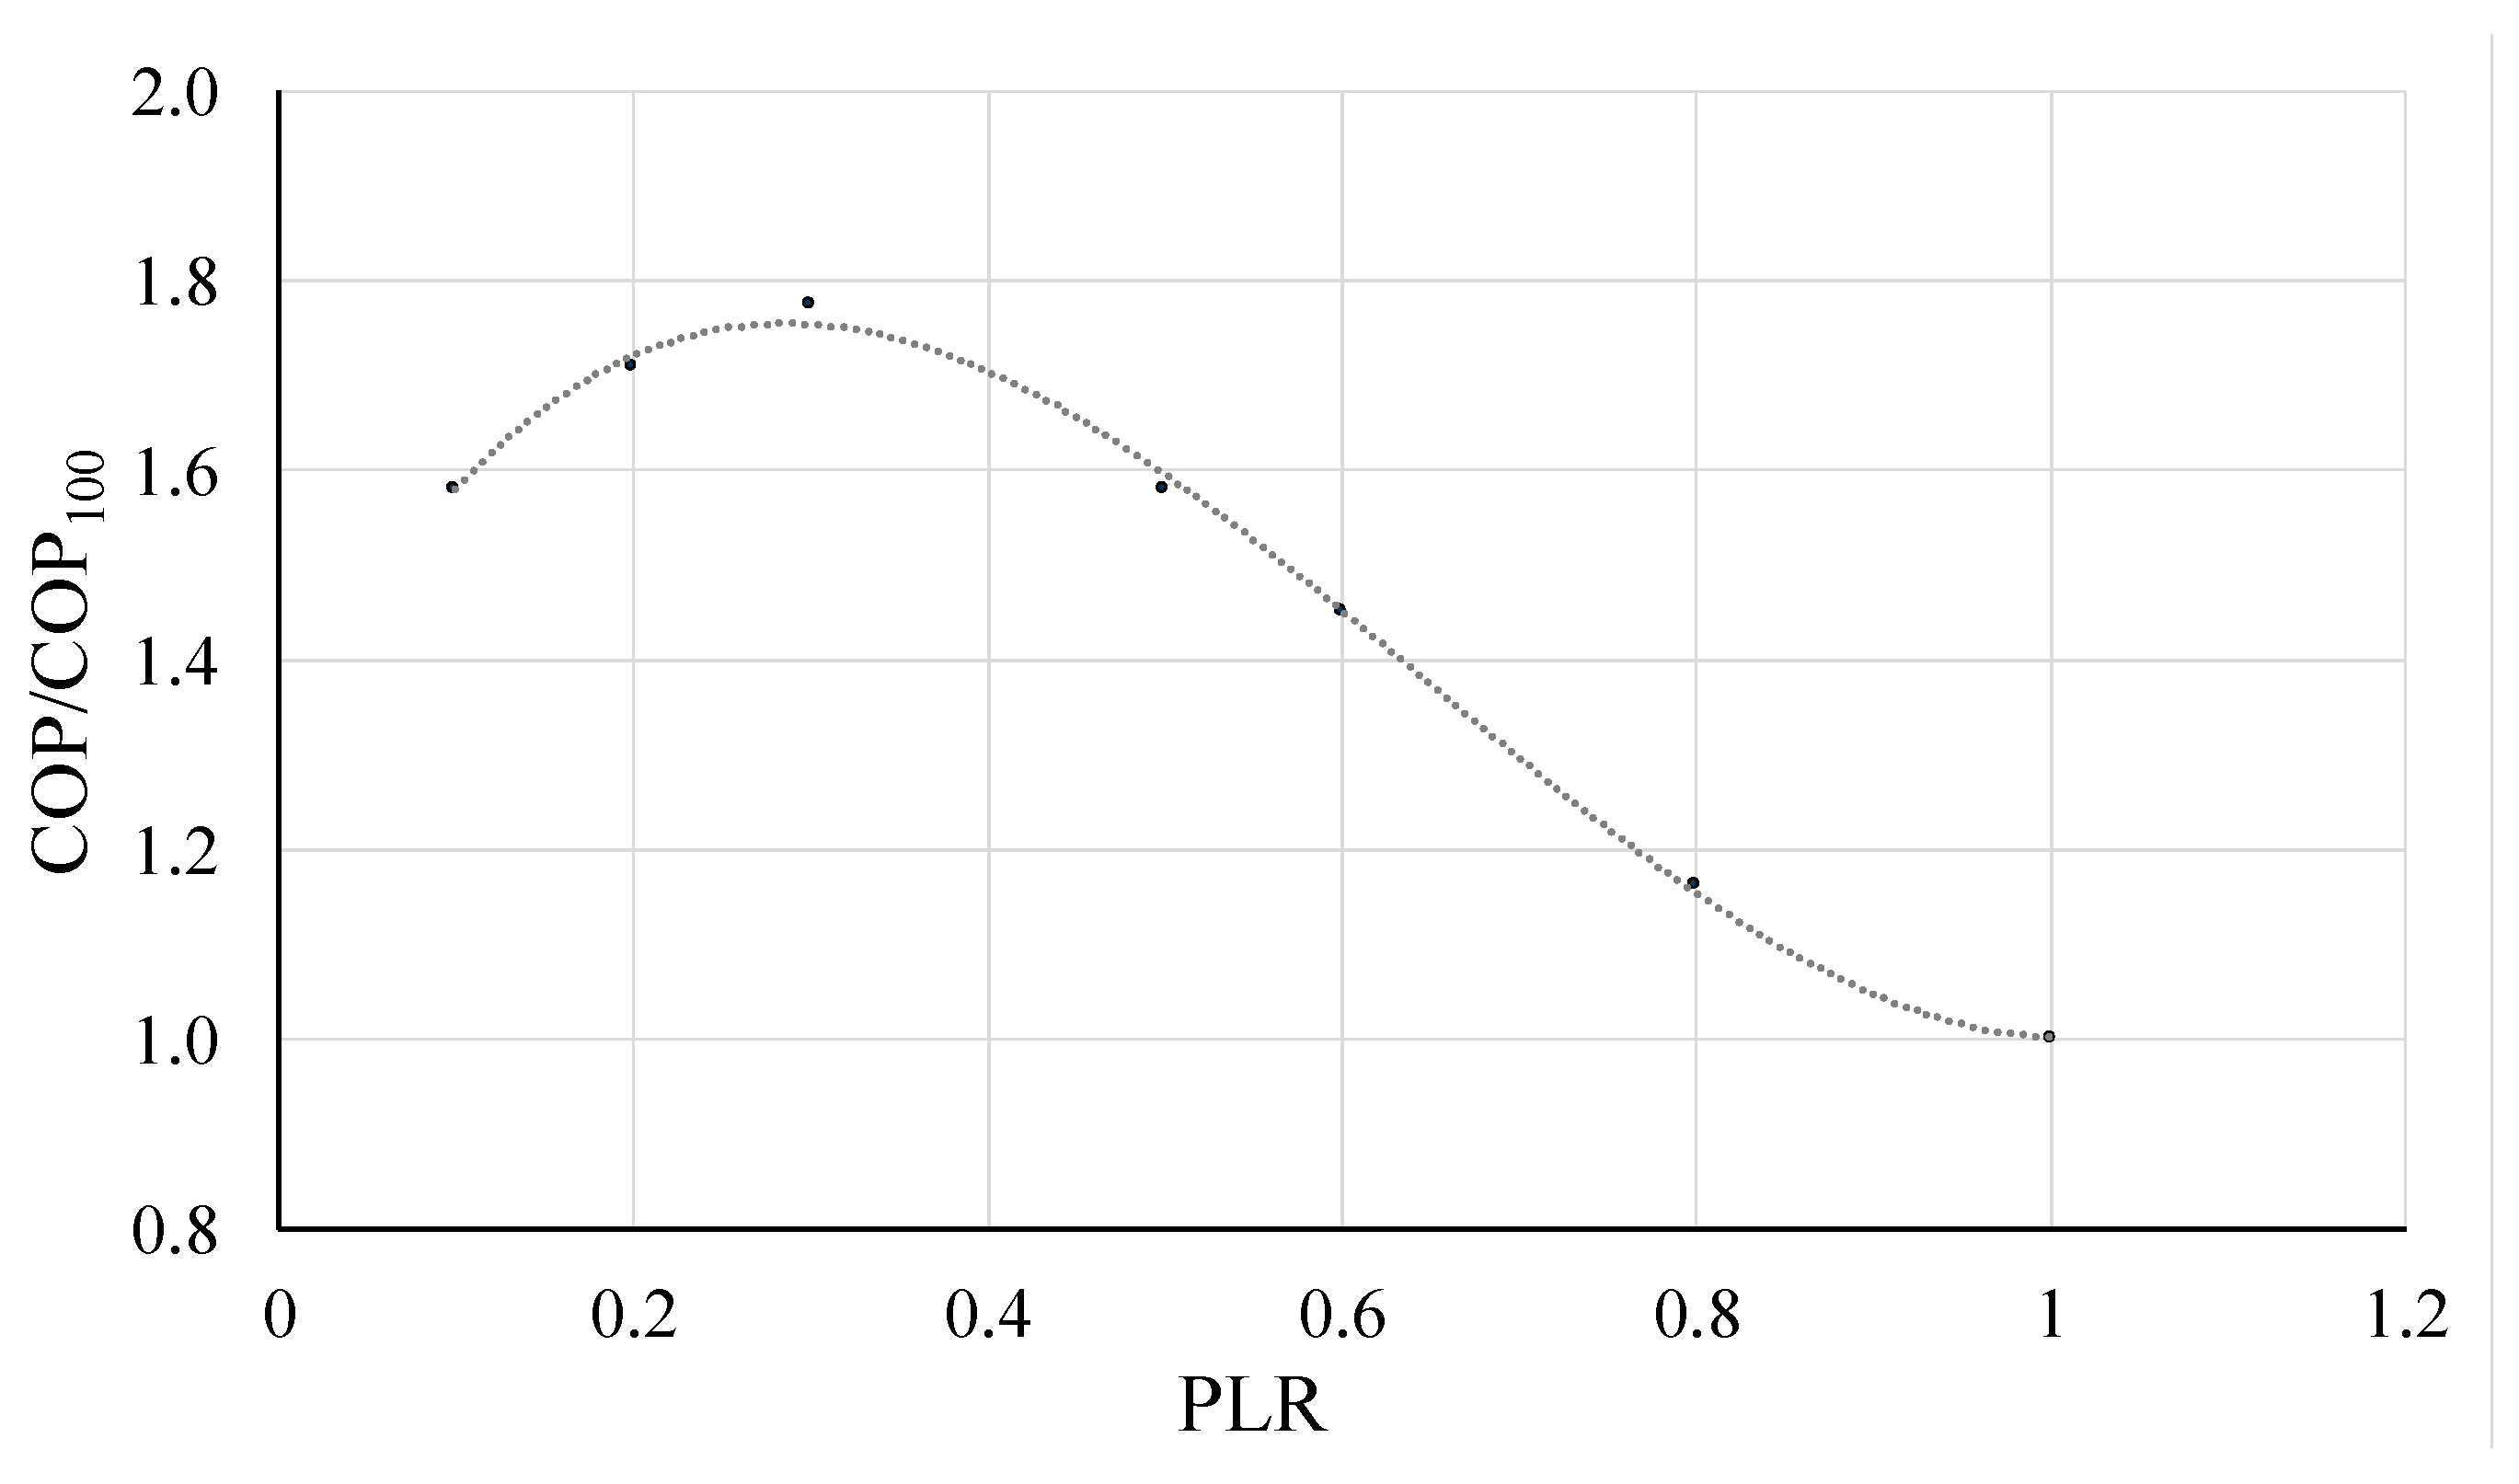
3.4. Performance of the System

The main parameter that characterizes the behavior of a CHEST system is the roundtrip efficiency (Equation (15)), which is defined as the ratio between the net electrical energy produced in the system discharging and the total electrical energy consumed during the charging process [5]:
η r o u n d t r i p = P _ e l _ n e t _ O R C P _ e l _ i n _ H P .

3.5. Economic Assessment

Finally, for the economic assessment of system, the net profit generated (Equation (16)) is calculated as a function of the power sold to the grid (P_el_net_ORC, MW), the power bought from the grid (Purchased_pwr) in case that the energy is purchased so the HTHP works at full load, and the hourly energy price (En_price_hour). Additionally, the unitary benefit (in € per MWh) is calculated as indicated in Equation (17):
N e t   p r o f i t = E n _ p r i c e _ h o u r ( P _ e l _ n e t _ O R C P u r c h a s e d _ p w r ) ,
U n i t a r y   b e n e f i t = N e t   p r o f i t P _ e l _ n e t _ O R C .

4. Spanish Energy Market and CHEST System Integration

Finding a possible application of the CHEST system in the current energy market is not simple due to the fact that the RESs installed power in Spain is not large enough to cover the energy demand of the country. As an example, in 2018, there were 4.5 GW of installed capacity for solar photovoltaic and 23.1 GW for wind energy, with maximum values of energy demand of up to 40 GW [31]. Consequently, the renewable electricity, when produced, is directly discharged in the electrical grid to cover as much part of the demand as possible and there is no electricity surplus available to be used to charge energy storage systems, such as CHEST. However, by analyzing the Spanish electricity system, a possible application was found regarding the current operation of some wind power plants of the country.
By means of the daily market, the Spanish pole of the Iberian market operator (OMIE) obtains the most economical solution for the based daily operating schedule, which is the energy dispatch for the following day. However, the previous pole does not verify whether this result is technically feasible or not. The system operator (SO) is the entity responsible for checking that the based daily operating schedule obtained by OMIE is also physically possible; otherwise, the SO has some adjustment facilities in order to solve the technical problems that may appear and ensure the actual match between energy production and consumption at a national level. Among them, the technical constraints market is of special interest for a possible integration of the CHEST system [32,33,34].
A technical constraint is defined as any circumstance, resulting from the state of the production and transport energy system, which is likely to affect the security, quality, or reliability of the energy supply, hereby requiring a modification of the scheduled production. To solve these technical constraints, the different programming units of the Spanish electrical grid make economic offers either to increase their production up to their maximum installed power or to decrease it with respect to the production programmed in the based daily operating schedule [34,35].
Among the programming units that participate in this market, several wind power plants can be found, which, mostly, make offers to decrease their scheduled production. These wind power plants generate less electricity than the initially programmed amount; even though they are capable of generating more power, the grid cannot absorb it due to technical issues. Regarding other renewable technologies, such as solar thermal or photovoltaic energy, no significant record of them participating in the technical constraints market was found for the year 2018.
The studied potential application of the CHEST system is by integrating it in a wind farm working in the technical constraints market. Instead of stopping some of the wind turbines of the plant during the technical constraints, they could keep working as initially planned, but the power generated would not be injected directly into the electricity grid. Instead, this energy, which is currently limited due to the technical constraints, can be employed as input to the HTHP of the CHEST system. Figure 5 illustrates this working principle. The shaded areas show the difference between the programmed and the final energy injected into the grid, due to technical constraints, and they consequently correspond to the potential energy available to charge the CHEST system.
Regarding the discharge of the CHEST system, this can be done at times of high price of the energy in the daily market. Another option that was considered in the analysis is the possibility of purchasing energy at low prices in the daily market in case there is no technical constraints or their value is below the nominal power of the HTHP.
The power plant that was chosen in this study has a total installed capacity of 26 MW [36]. This plant participated in the technical constraints market in 2018 and hereby, the hourly date of its programmed energy and the final energy production is available and can be obtained from the SO website (www.ree.es). This data was used as an input in the model (Tech_Const_pwr in Figure 3). In addition, energy prices in the SPOT market for the year 2018 were also procured from the SO website and introduced as inputs (variables En_price_hour and En_price_month in Figure 3). The profiles for the available power during the year 2018 and the medium energy prices per month are depicted in Figure 6.
The source (Twi_evap) and sink (Twi_cond) temperatures selected were 80 and 10 °C, respectively, with a typical temperature difference, ΔT, of 4 K for both cases. These temperatures correspond to the working mode 2 proposed by Steinmann et al. [19]. The assessment of the external heat source needed for this mode is out of the scope of this work. For example, solar thermal collectors can be used to heat up water up to 80 °C. Industrial waste heat is also a potential heat source for the CHEST system. In fact, one of the case studies assess within the European CHESTER project is an installation located in Aalborg (Denmark), including a pit storage of 1,000,000 m3 to store waste heat coming from nearby industries, hereby allowing the interaction of the CHEST system with the DH network. The stored water can reach temperatures of 80 °C. Thus, a similar system can also be a solution for the required heat source [37].
A parametric study was performed to assess the optimal size of the equipment (nominal input power for the HTHP and net output power for the ORC), from a technical and economic point of view. The TES systems were sized to reach a maximum discharge time of 6 h, as this value is in the range of the discharge periods employed in TES systems of concentrated solar power plants, which also include thermal storage techniques [38]. For this work, no heat losses were assessed in the TES systems. As mentioned above, the HTHP is modelled so it can work at partial load, while the ORC always works at full load in this analysis. However, for each study, another considered possibility is buying energy at low prices when a technical constraint takes place in order to make the HTHP work at full load. Table 1 shows all the combinations that were studied.

5. Results and Discussion

The present section includes an analysis of the 10 case studies defined in Table 1. The results are a consequence of the transient behavior of the system, as the model includes the variable COP of the HTHP due to partial load conditions, the state of charge of the TES system, and the availability of power due to technical restrictions. As an example, Figure 7 represents the power and energy price profiles, as well as the level of charge of the storage tanks for a one charging-discharging cycle of case 1.A. Figure 7A shows how the charging process starts, once there is power available coming from the technical constraints market. The HTHP continues working as long as there is available power. Later, when the hourly energy price is greater than the average energy price of that month (in this example, November 2018), the ORC starts working and the CHEST system is discharged. Figure 7B depicts the evolution of the level of charge of the storage tanks (latent energy storage tank, and the two water tanks of the sensible energy storage, HTWT and LTWT). During the charging phase, the HTWT is progressively filled with water coming from the LTWT and their levels of charge change accordingly. During the discharging process, the LTWT is progressively filled with water coming from the HTWT.
Hereafter, the global results are discussed. In Figure 8, the roundtrip efficiency (Equation (15)) is represented along with the percentage of energy produced by the CHEST system with respect to the total energy generated by the combined power plant (wind farm + CHEST system). Both the efficiency and the percentage of energy production increase with the nominal power of the CHEST system.
For the same nominal power, if energy is purchased (*.B cases), the roundtrip efficiency decreases with respect to the cases when no energy is bought (*.A cases). This drop is more pronounced for high values of nominal power, as it goes from 17% in case 1 to 33% in case 5. However, the lowest roundtrip efficiency reached is 0.90 (case 3.B), so the values are acceptable even for the worst case, as they are still higher than the ones obtained in other large-scale storage technologies, such as PHS (0.65–0.85) or CAES (around 0.8) [4]. The high values of roundtrip efficiency obtained in the “*.A” cases are a consequence of the HTHP working at partial load. When this happens, the COP raises, as the HTHP’s compressor is modelled including an inverter, so the TES systems are charged in a more efficient manner than if the HTHP works at full load. Consequently, less electrical energy is necessary for the charging process and a better roundtrip efficiency is achieved.
When energy is purchased from the grid, the share of energy produced by the CHEST system increases considerably (e.g., 2.2 times higher in case 5.B than in case 5.A). This is due to the fact that by buying energy in the market, the CHEST system charges faster, because the HTHP always works at full nominal power, so more charging-discharging cycles take place during the year, and hereby, more energy is produced.
Thus, from a technical point of view, purchasing energy seems to be more interesting, as the number of cycles per year is higher and the roundtrip efficiency achieved is still reasonable, so a bigger advantage is taken from the CHEST system.
Focusing in the economical point of view, in Figure 9, the net profit (Equation (16)) and the benefit obtained per MWh produced (Equation (17)) are represented for the different cases. For the cases without purchasing of energy, the net profit obtained is higher, as the energy cost is equal to zero. The cases with higher benefit are also the ones with less annual energy production (Figure 8), which means that the benefit obtained per MWh produced is higher when no energy is purchased. Additionally, Figure 9 indicates that the unitary benefit is lower as the size of the system increases. This is due to the fact that, in this particular case, the months with lower input form the technical constraints market are the ones with higher energy prices (Figure 6). Bigger systems need more time to recharge and cannot benefit from moments of peak prices as well as the smaller ones.
These results indicate that the energy purchase is not so interesting from an economical point of view, as the cost of energy production increases; and, also, that small-capacity systems seem to react better to the fluctuations of the market, as they can be charged quicker and are usually ready for discharge when the energy price rises. Finally, it is also worth mentioning that, when the nominal power of the system increases, the net profit also raises (especially when energy is bought). Thus, a compromise solution between high production and attractive prices should be found.
So far, it may be that the bigger the system, the better the benefit, as this implies more energy production. However, there are other economic aspects that should be considered, such as the capital expenditure (CAPEX) or the payback period (PB) of the CHEST system. Up to date, there are no experimental installations of a CHEST system yet. However, considering the net profit obtained for each case for the year 2018 as a representative value for an average annual benefit, an estimation can be made of the maximum CAPEX this technology should have to be competitive in the energy storage market. A maximum PB of 10 years was assumed, and the CAPEX calculated accordingly to this PB and to the annual net benefits obtained per case (CAPEX = Net benefit × PB).
Figure 10 shows the maximum admissible values of CAPEX (considering annual benefits) to obtain a PB period of 10 years. In Figure 10, the total CAPEX is represented, according to the size of the system, as well as the unitary CAPEX per installed MW. The unitary CAPEX decreases with the increase of the size of the system. Thus, it seems that installing more capacity is more profitable. Finally, this study indicates that a CAPEX within the range of 200–650 k€ per installed MW (or 200–650 €/kW) would be an admissible cost for a CHEST system in the current Spanish electrical grid. In the literature, some references of cost per installed power were found for other configurations of PTES systems consisting of a reversible heat pump–heat engine cycle and two storage vessels: Gallo et al. in [39] reported a value of 550€/kW; Smallbone et al. [40] stated a cost between 350 and 750 €/kW; and 460 €/kW was indicated by Proctor [41]. Thus, the estimation made in this paper is within the order of magnitude found in other studies, hereby indicating that the CHEST concept can be feasible.
Finally, as a conclusion, for the case under study, the cases *.A are more desirable compared with cases B, taking into account the decrease in the net profit when energy is purchased. Regarding the unitary benefit, small capacities (cases 1, 2, and 3) seem to be more attractive as they present a higher profit per MWh produced. However, as explained before, installing more capacity reduces the unitary CAPEX of the system. For these reasons, case 3.A, with 5 MW of installed power and a 5% energy contribution to the total production (Figure 8), appears to be a good intermediate solution between benefits and costs.
However, the mentioned price estimations are only based on the net profit from the CHEST system under the current electric market circumstances, and they do not consider the individual and detailed cost of the CHEST components. A cost estimation of the components is complex to perform because, even though the technologies exist independently, commercial sizes of them are in the range of kWs instead of MWs. Although the CAPEX estimation is within the ranges of other PTES systems found in the literature, higher capital costs can be expected, and it is very likely that such a complex system may not be economically feasible in the short term until the technology is further developed and the costs are driven down. For this reason, it is important to consider the CHEST concept for the following situations, which could improve the system’s profitability:
  • Economic grants for the implementation of large-scale energy storage technologies to guarantee the stability of the electrical grid.
  • A bigger differentiation between the minimum and maximum energy prices along the day. In this situation, more profit could be obtained from the operation of the system in purchase-sale operational mode, hereby reducing the payback of the system.
  • Economies of scale and improvements in the technologies that compose the CHEST system may reduce the unitary fabrication cost of the equipment, facilitating its implementation.
  • A future increase in the share of renewable energy production leading to moments of energy surplus on the electrical grid that can boost the necessity of energy storage techniques and increase the annual benefits.

6. Conclusions and Future Work

This work presented a dynamic model of a PTES system based on a compressed heat energy storage (CHEST) concept. The proposed CHEST system was integrated in a real case scenario of a wind farm located in Spain, employing real data of 2018. In this study, the possibility of integrating such a system in the electricity grid was explored. A parametric study varying the sizes of the system was performed and the option of buying energy at low prices to charge the system was also considered. The main conclusions are:
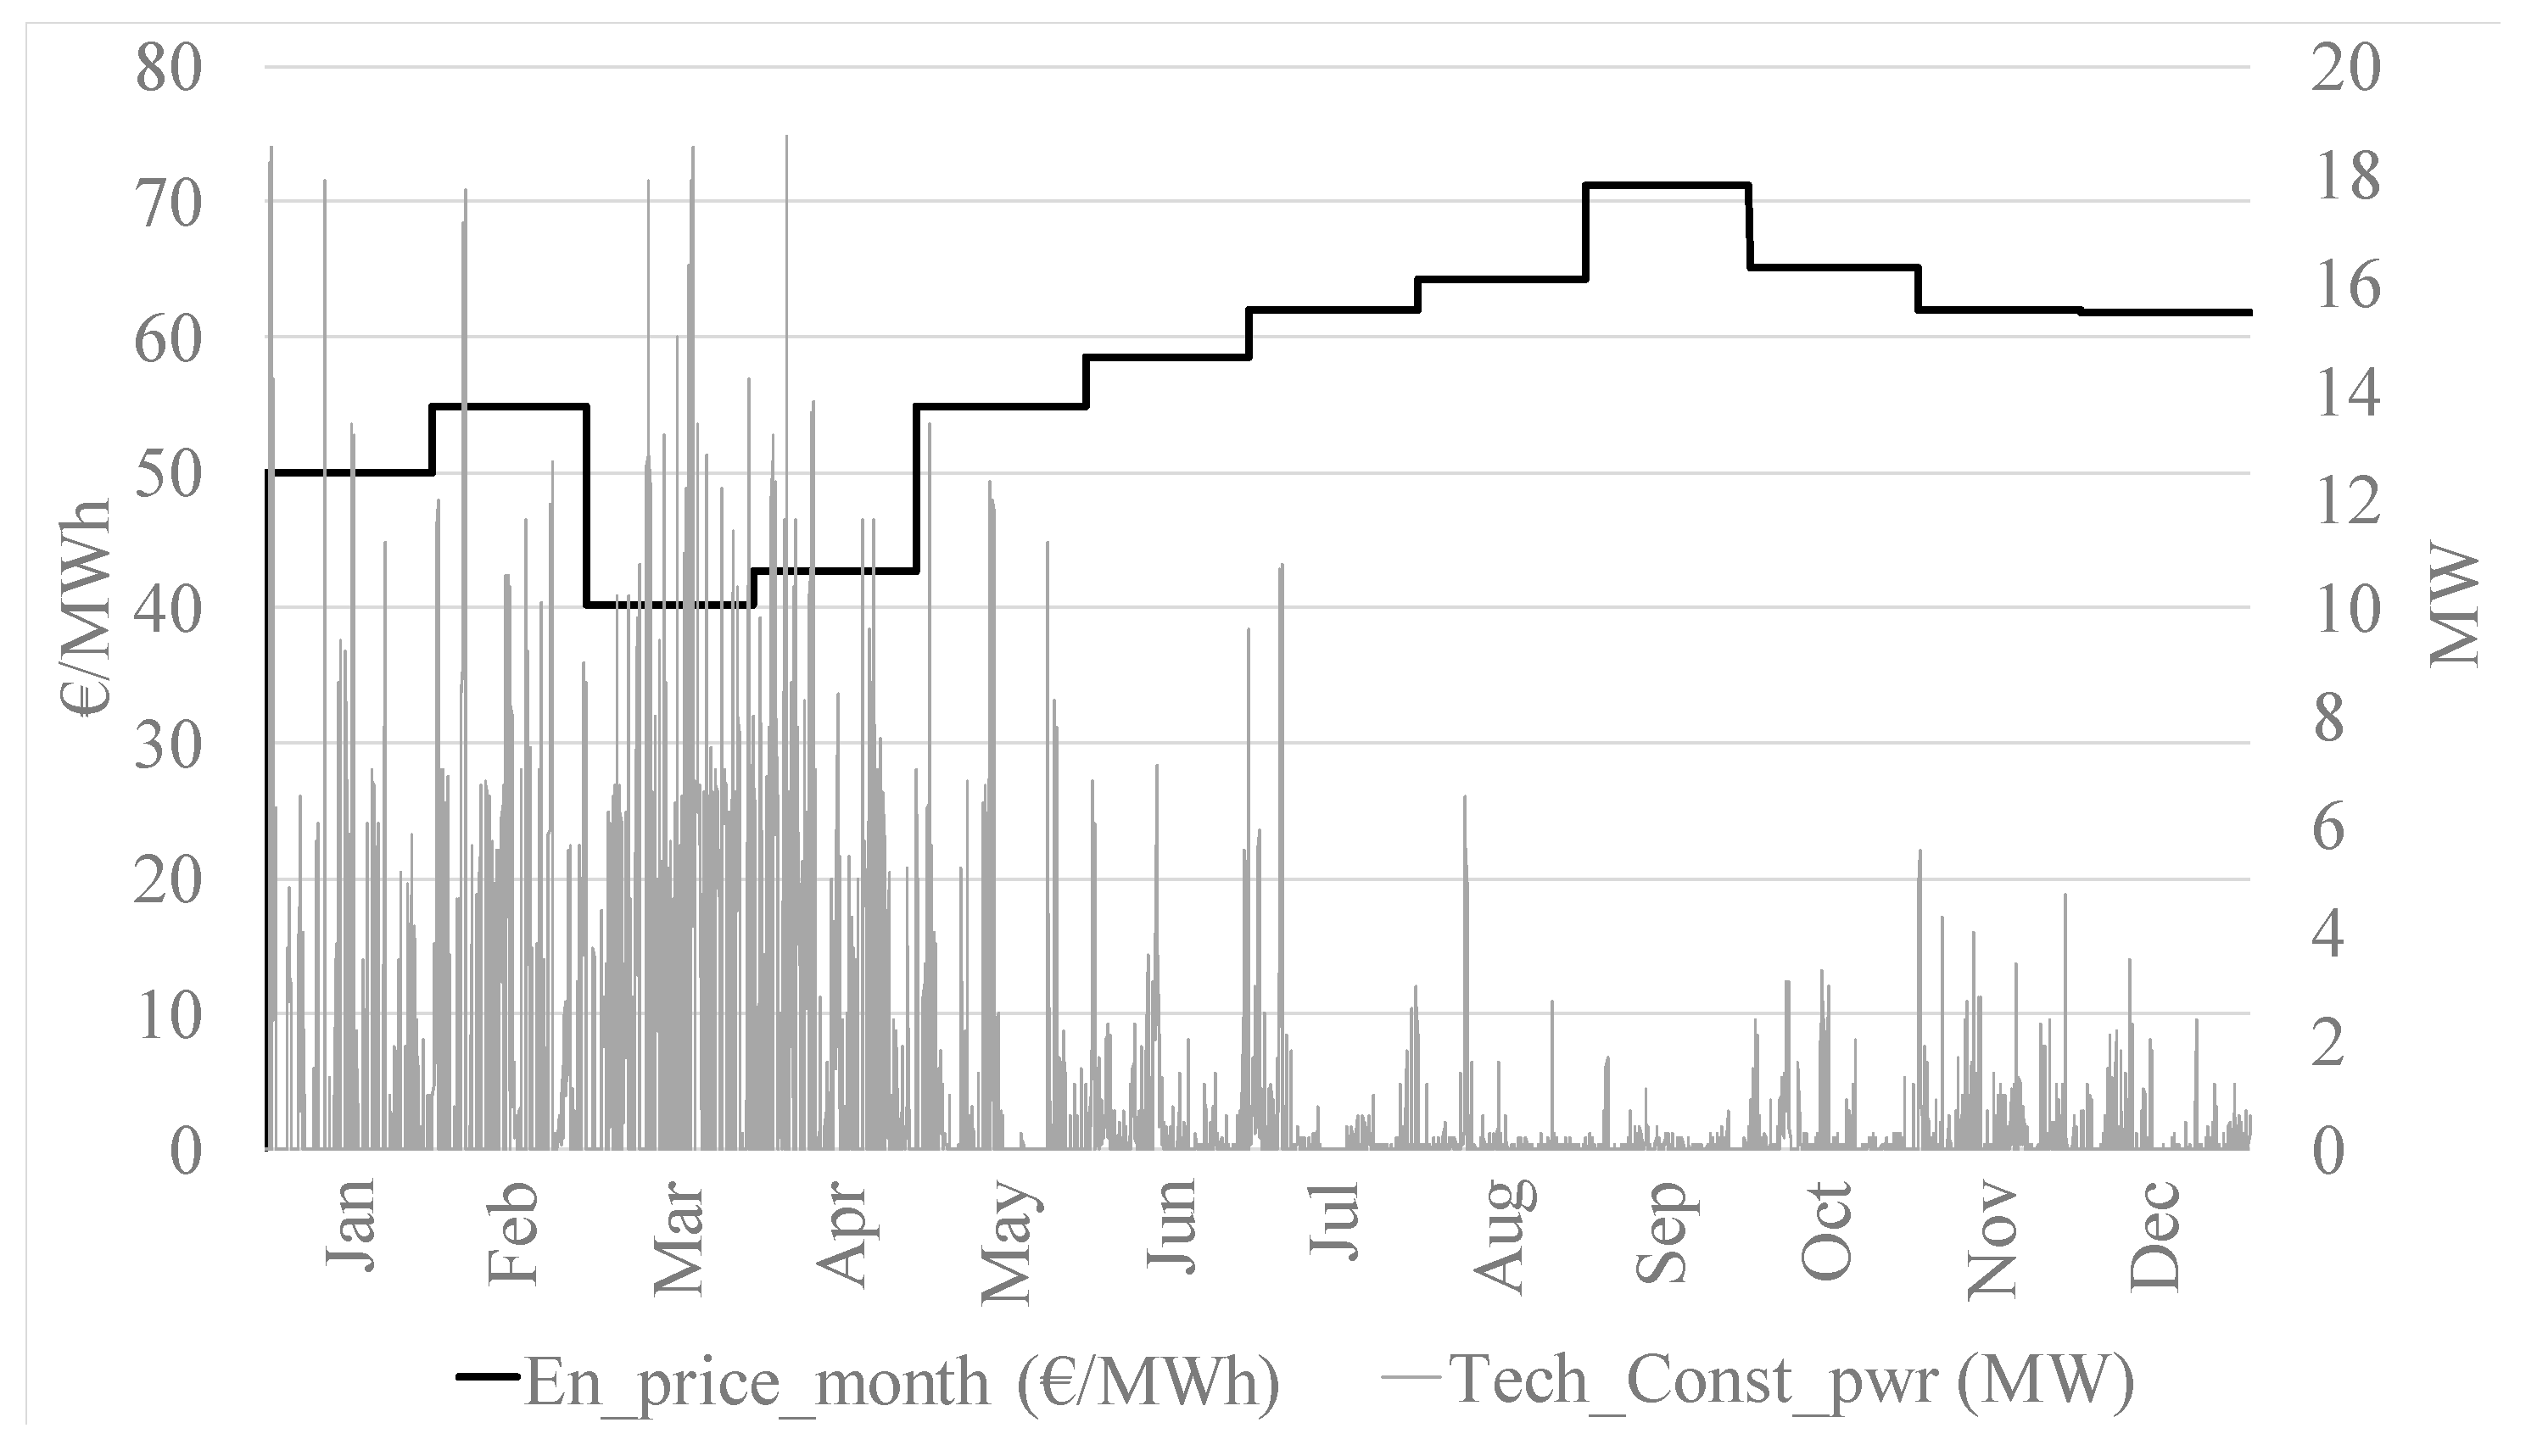
  • The Spanish electricity grid was analyzed to find a possible integration scenario of the CHEST system. A novel application was proposed in the technical constraints market, where electrical energy is available for the charging process, taking advantage of the energy reduction with respect to the based daily operating scheduled. The discharged energy is then sold in the market at peak hours.
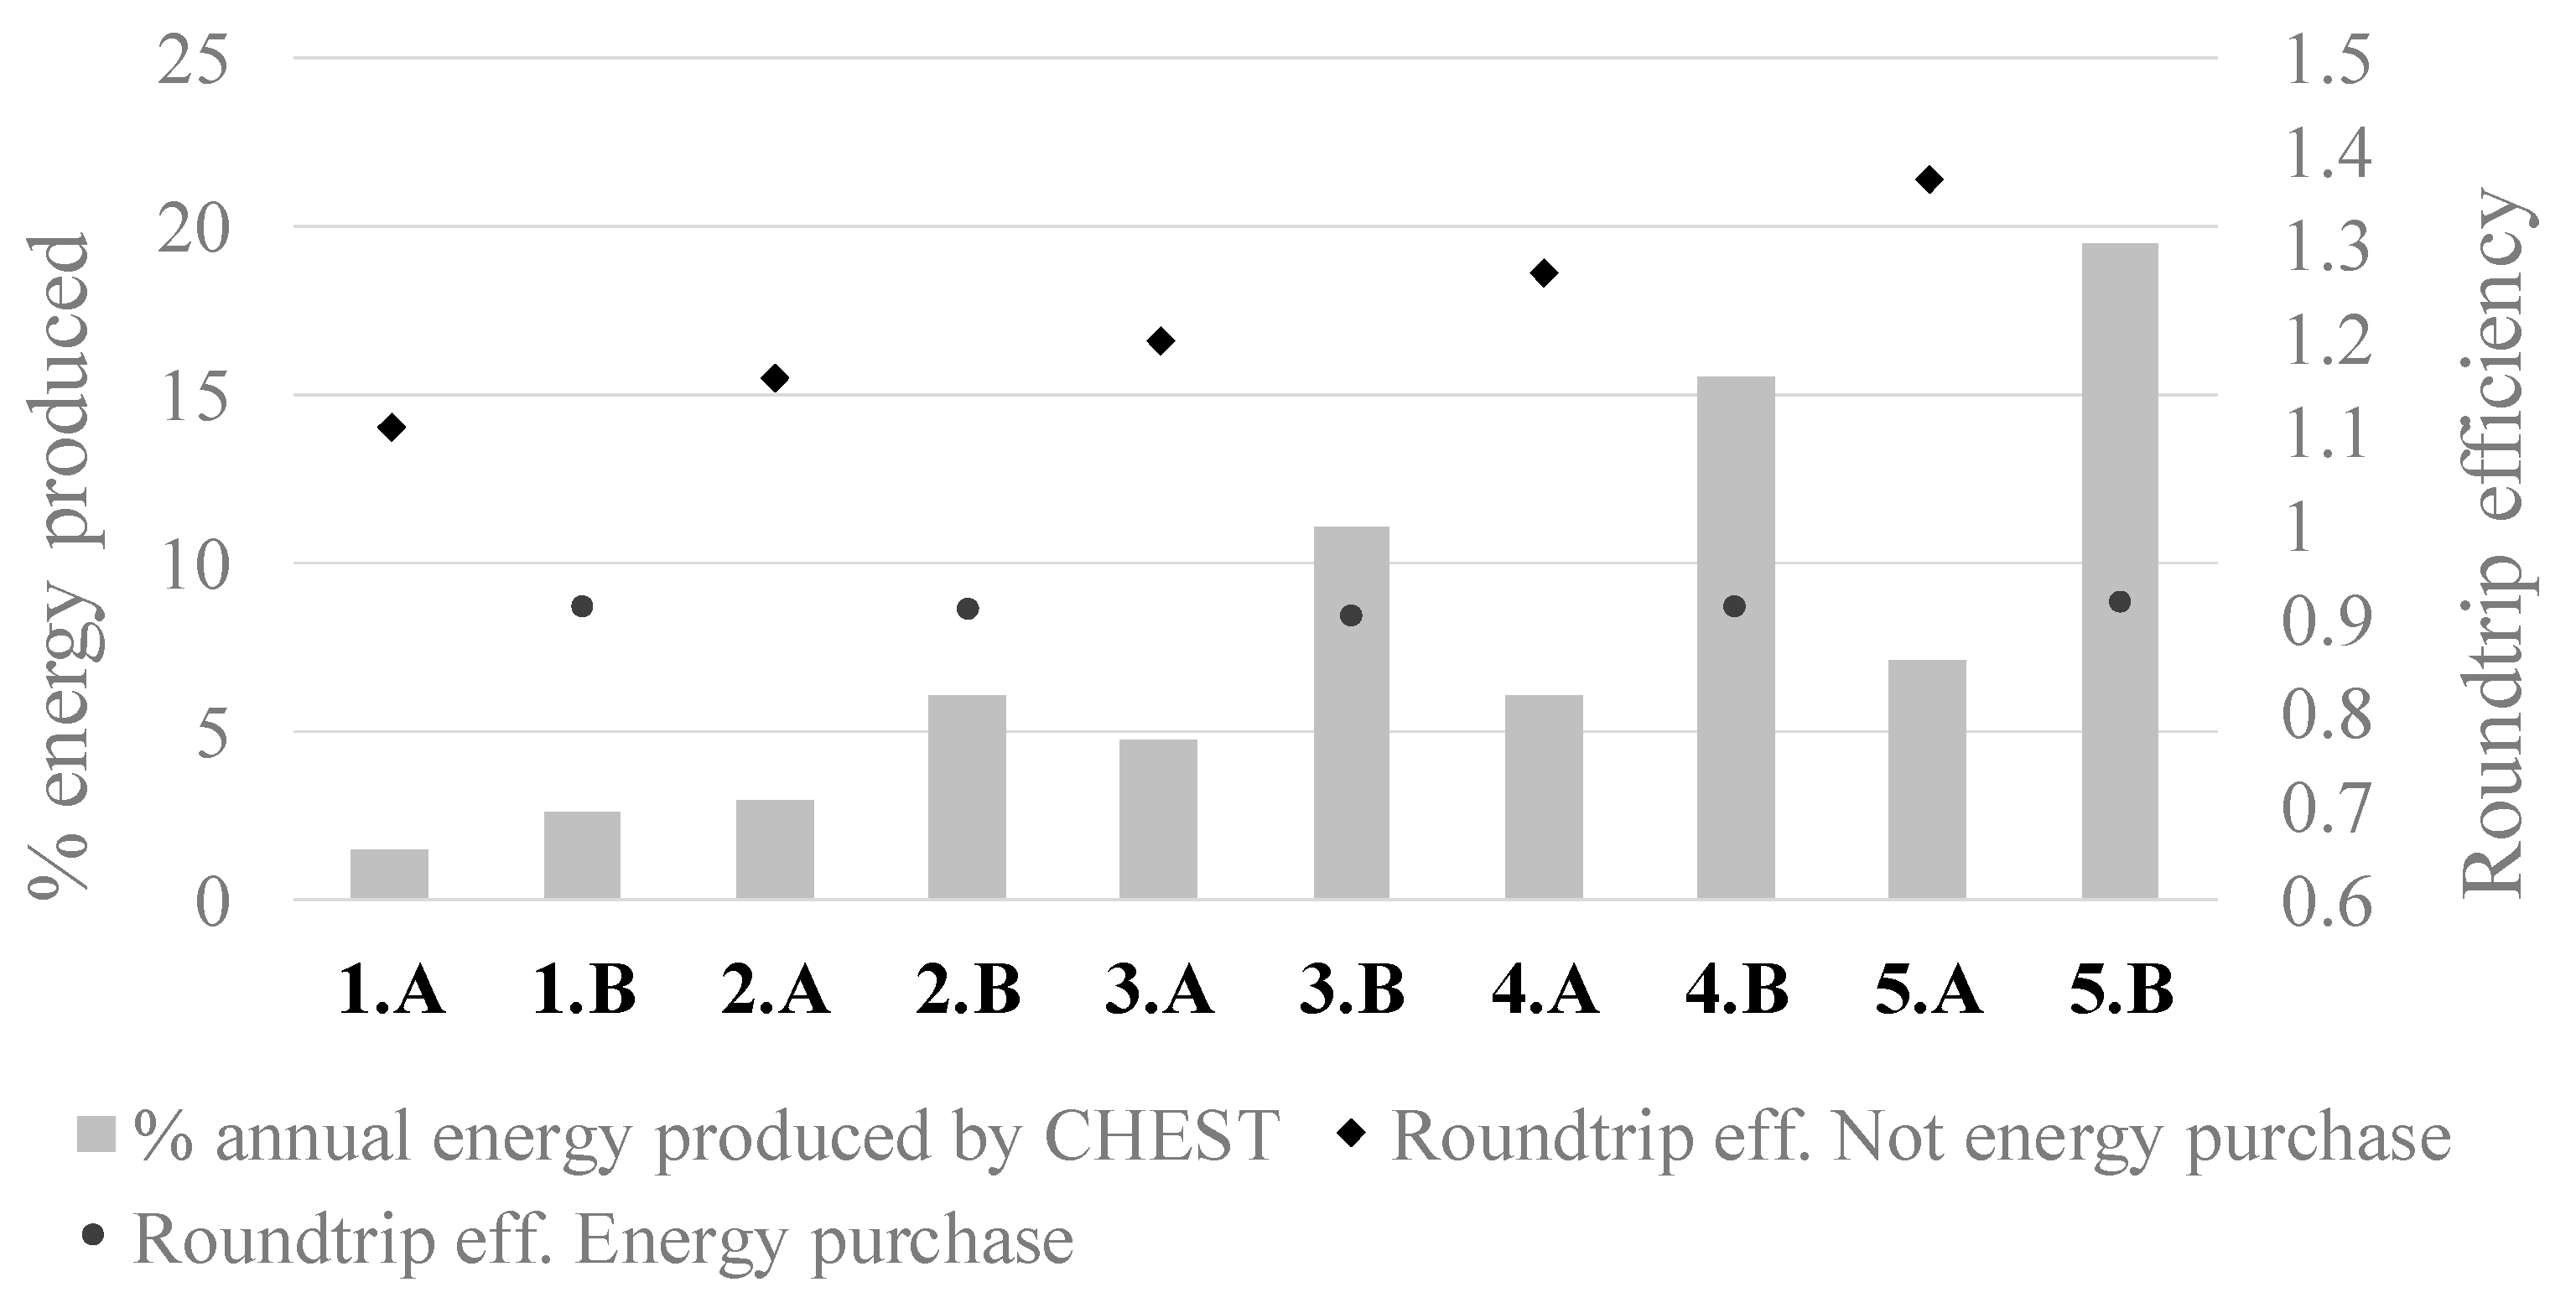
  • High values of roundtrip efficiency were achieved (above 90%) for all the studied cases using the working temperatures specified for working mode 2 (Twi_evap = 80 °C and Twi_cond = 10 °C).
  • The results show that by purchasing energy, the contribution of the CHEST system to the power plant increases, but its efficiency is reduced, and the cost of each MWh produced increases. Small capacities have demonstrated a better response to market fluctuations. Case 3.A, with 5 MW of installed power and providing 5% of the energy produced, appears to be a good solution for the power plant under study.
  • If the CHEST system is built with a capital cost in the range 200–650 k€ per installed MW, the system could be potentially feasible. This value is in the range of previous literature, although this issue should be treated with caution, since to date, there is still no experimental installation of such a system.
A first-of-its-kind CHEST prototype is currently being built and will be presumably tested between 2020 and 2021 (www.chester-project.eu). As future work, the dynamic model will be further improved and compared with experimental measurements. A wider variety of potential market opportunities will also be studied, including the previously listed scenarios, in which the CHEST system could be potentially more suitable.

Author Contributions

Conceptualization, J.P., J.M.C. and A.H.H.; methodology, J.P.; software, V.S.-C.; validation, V.S.-C.; formal analysis V.S.-C.; investigation, V.S.-C., J.P., A.H.H.; resources, V.S.-C.; writing—original draft preparation, V.S.-C.; writing—review and editing, J.P. and A.H.H.; visualization, V.S.-C.; supervision, J.P., J.M.C. and A.H.H.; project administration, J.M.C.; funding acquisition, J.M.C. All authors have read and agreed to the published version of the manuscript.

Funding

This work has been partially funded by the grant agreement No. 764042 (CHESTER project) of the European Union’s Horizon 2020 research and innovation program.

Acknowledgments

The authors gratefully acknowledge the European Commission for partially funding the work under the grant agreement No. 764042 (CHESTER project).

Conflicts of Interest

The authors declare no conflict of interest.

Abbreviations

CAESCompressed air energy storage
CAPEXCapital expenditure
CHESTCompressed heat energy storage
COPCoefficient of Performance
GWPGlobal warming potential
HTHPHigh temperature heat pump
HTWTHigh temperature water tank
LHSLatent heat storage
LTWTLow temperature water tank
ORCOrganic Rankine cycle
PBPayback
PCMPhase change material
PHSPumped hydro storage
PLRPartial load ratio
PTESPumped thermal energy storage
RESsRenewable energy sources
SHSSensible heat storage
SOSystem operator
TESThermal energy storage

Nomenclature

VariableUnitDescription
COP100-Nominal COP of the HTHP when working at full load.
CpwkJ/kg.KSpecific heat of water.
dT_w_evapKWater temperature difference in HTHP’s evaporator.
dT_w_condKWater temperature difference in ORC’s condenser.
E_q_LHSMWhAmount of energy stored in the LHS unit.
E_q_max_LHSMWhMaximum heat that can be stored in the LHS unit.
En_price_hour€/MWhHourly energy price in the SPOT market for the year 2018 in Spain.
En_price_month€/MWhAverage price of the energy per month in the SPOT market for the year 2018 in Spain.
m_w_prehkg/hWater mass flow rate in ORC’s preheater.
m_w_subckg/hWater mass flow rate in HTHP’s subcooler.
m_w_est_prehkg/hEstimated water mass flow rate in ORC’s preheater.
m_w_est_subckg/hEstimated water mass flow rate in HTHP’s subcooler.
Net_profitK€Net profit of the CHEST system for the year 2018.
P_el_in_HPMWNet electrical power employed in HTHP’s compressor.
P_el_in_est_HPMWEstimated electrical power used in HTHP’s compressor. Without considering TES sizing restrictions.
P_el_in_nom_HPMWNominal electrical power of the HTHP’s compressor when HTHP works at full load.
P_el_net_ORCMWNet electrical power produced by the ORC’s expander.
P_el_net_est_ORCMWEstimated net electrical power produced by the ORC’s expander. Without considering TES sizing restrictions.
P_el_net_nom_ORCMWNominal net electrical power produced by the ORC’s expander when ORC works at full load.
P_q_latMWActual latent heat stored (positive) or withdrawn (negative) from the LHS unit. Considering TES restrictions.
P_q_lat_est_HPMWEstimated latent heat stored in the LHS unit. Without considering TES sizing restrictions.
P_q_lat_est_ORCMWEstimated latent heat withdrawn from the LHS unit. Without considering TES sizing restrictions.
P_q_lat_nom_HPMWNominal latent heat of the HTHP’s condenser, when HTHP works at full load.
P_q_lat_nom_ORCMWNominal latent heat of the ORC’s evaporator, when ORC works at full load.
P_q_sen_HPMWActual sensible heat stored in SHS unit. Considering TES restrictions.
P_q_sen_ORCMWActual sensible heat withdrawn from SHS unit. Considering TES restrictions.
P_q_sen_est_HPMWEstimated sensible heat stored in the SHS unit. Without considering TES sizing restrictions.
P_q_sen_est_ORCMWEstimated sensible heat withdrawn from the SHS unit. Without considering TES sizing restrictions.
P_q_sen_nom_HPMWNominal sensible heat of the HTHP’s subcooler, when HTHP works at full load.
P_q_sen_nom_ORCMWNominal sensible heat of the ORC’s preheater, when HTHP works at full load.
Purchased_powerMWPower purchased in the SPOT market to charge the CHEST system.
T_HTWT°CTemperature of the water contained in the HTWT.
T_LTWT°CTemperature of the water contained in the LTWT.
T_w_out_preh°CWater temperature at preheater’s outlet.
T_w_out_subc°CWater temperature at subcooler’s outlet.
Tech_Const_pwrMWPower available from technical constraints to charge the CHEST system.
Twi_cond°CInlet water temperature of ORC’s condenser.
Twi_evap°CInlet water temperature of HTHP’s evaporator.
V_w_HTWTm3Volume of water contained in the HTWT.
V_w_LTWTm3Volume of water contained in the LTWT.
V_w_max_SHSm3Maximum volume of water that can be stored in the SHS tanks.

References

  1. Amanpour, S.; Huck, D.; Kuprat, M.; Schwarz, H. Integrated energy in Germany—A critical look at the development and state of integrated energies in Germany. Front. Energy 2018, 12, 493–500. [Google Scholar] [CrossRef]
  2. Nikolaou, T.; Stavrakakis, G.S.; Tsamoudalis, K. Modeling and optimal dimensioning of a pumped hydro energy storage system for the exploitation of the rejected wind energy in the non-interconnected electrical power system of the Crete Island, Greece. Energies 2020, 13, 2705. [Google Scholar] [CrossRef]
  3. Shi, J.; Yang, Y.; Deng, Z. A reliability growth model for 300 MW pumped-storage power units. Front. Energy Power Eng. China 2009, 3, 337–340. [Google Scholar] [CrossRef]
  4. Argyrou, M.C.; Christodoulides, P.; Kalogirou, S.A. Energy storage for electricity generation and related processes: Technologies appraisal and grid scale applications. Renew. Sustain. Energy Rev. 2018, 94, 804–821. [Google Scholar] [CrossRef]
  5. Jockenhöfer, H.; Steinmann, W.D.; Bauer, D. Detailed numerical investigation of a pumped thermal energy storage with low temperature heat integration. Energy 2018, 145, 665–676. [Google Scholar] [CrossRef]
  6. Steinmann, W.D. Thermo-mechanical concepts for bulk energy storage. Renew. Sustain. Energy. Rev. 2017, 75, 205–219. [Google Scholar] [CrossRef]
  7. Thess, A. Thermodynamic efficiency of pumped heat electricity storage. Phys. Rev. Lett. 2013, 111, 1106102. [Google Scholar] [CrossRef] [Green Version]
  8. Guo, J.; Cai, L.; Chen, J.; Zhou, Y. Performance optimization and comparison of pumped thermal and pumped cryogenic electricity storage systems. Energy 2016, 106, 260–269. [Google Scholar] [CrossRef]
  9. Attonaty, K.; Stouffs, P.; Pouvreau, J.; Oriol, J.; Deydier, A. Thermodynamic analysis of a 200 MWh electricity storage system based on high temperature thermal energy storage. Energy 2019, 172, 1132–1143. [Google Scholar] [CrossRef]
  10. Frate, G.F.; Antonelli, M.; Desideri, U. A novel Pumped Thermal Electricity Storage (PTES) system with thermal integration. Appl. Therm. Eng. 2017, 121, 1051–1058. [Google Scholar] [CrossRef]
  11. Mateu-Royo, C.; Mota-Babiloni, A.; Navarro-Esbrí, J.; Peris, B.; Moles, F.; Amat-Albuixech, M. Multi-objective optimization of a novel reversible High-Temperature Heat Pump-Organic Rankine Cycle (HTHP-ORC) for industrial low-grade waste heat recovery. Energy Convers. Manag. 2019, 197, 111908. [Google Scholar] [CrossRef]
  12. Benato, A. Performance and cost evaluation of an innovative Pumped Thermal Electricity Storage power system. Energy 2017, 138, 419–436. [Google Scholar] [CrossRef]
  13. Benato, A.; Stoppato, A. Integrated Thermal Electricity Storage System: Energetic and cost performance. Energy Convers. Manag. 2019, 197, 111833. [Google Scholar] [CrossRef]
  14. Maximov, S.A.; Harrison, G.P.; Friedrich, D. Long term impact of grid level energy storage on renewable energy penetration and emissions in the chilean electric system. Energies 2019, 12, 1070. [Google Scholar] [CrossRef] [Green Version]
  15. Steinmann, W.D. The CHEST (Compressed Heat Energy STorage) concept for facility scale thermo mechanical energy storage. Energy 2014, 69, 543–552. [Google Scholar] [CrossRef]
  16. Hu, B.; Wu, D.; Wang, L.W.; Wang, R.Z. Exergy analysis of R1234ze(Z) as high temperature heat pump working fluid with multi-stage compression. Front. Energy 2017, 11, 493–502. [Google Scholar] [CrossRef]
  17. He, Y.L.; Wang, R.; Roskilly, A.P.; Li, P. Efficient use of waste heat and solar energy: Technologies of cooling, heating, power generation and heat transfer. Front. Energy 2017, 11, 411–413. [Google Scholar] [CrossRef] [Green Version]
  18. Hassan, A.H.; O’Donoghue, L.; Sánchez-Canales, V.; Corberán, J.M.; Payá, J.; Jockenhöfer, H. Thermodynamic analysis of high-temperature pumped thermal energy storage systems: Refrigerant selection, performance and limitations. Energy Rep. 2020, in press. [Google Scholar] [CrossRef]
  19. Steinmann, W.D.; Bauer, D.; Jockenhöfer, H.; Johnson, M. Pumped thermal energy storage (PTES) as smart sector-coupling technology for heat and electricity. Energy 2019, 183, 185–190. [Google Scholar] [CrossRef]
  20. Klein, S.A.; Beckman, W.A.; Mitchell, J.W.; Duffie, J.A.; Duffie, N.A.; Freeman, T.L. TRNSYS 18—A Transient System Simulation Program; Solar Energy Laboratory, University of Wisconsin: Madison, WI, USA, 2018. [Google Scholar]
  21. Lindeman, L.; Sánchez-Canales, V.; O’Donoghue, L.; Hassan, A.H.; Corberan, J.M.; Payá, J. Thermodynamic analysis of a high temperature heat pump coupled with an organic Rankine cycle for energy storage. In Proceedings of the XI National and II International Engineering Thermodynamics Congress, Albacete, Spain, 12–14 June 2019; pp. 1–12. [Google Scholar]
  22. Hassan, A.H.; Corberán, J.M.; Payá, J.; Stefanou, M.R.; Trebilcock, F. Performance analysis of a high temperature heat pump for compressed heat energy storage system using R-1233zd (E) as working fluid. In Proceedings of the 2nd Conference on High Temperature Heat Pumps, Copenhagen, Denmark, 9 September 2019. [Google Scholar]
  23. Corberán, J.M.; Hassan, A.H.; Payá, J. Thermodynamic analysis and selection of refrigerants for high- temperature heat pumps. In Proceedings of the 25th IIR International Congress of Refrigeration, Montréal, QC, Canada, 24–30 August 2019; pp. 4705–4712. [Google Scholar] [CrossRef]
  24. Sánchez-Canales, V.; Hassan, A.H.; Corberán, J.M.; Payá, J.; O´donoghue, L.; Stefanou, M.R. Excess electricity storage via thermal energy storage. In Proceedings of the Eurotherm Seminar #112 (Advances in Thermal Energy Storage), lleida, Spain, 15–17 May 2019; pp. 1–10. [Google Scholar]
  25. da Cunha, J.P.; Eames, P. Thermal energy storage for low and medium temperature applications using phase change materials—A review. Appl. Energy 2016, 177, 227–238. [Google Scholar] [CrossRef] [Green Version]
  26. Cecchinato, L. Part load efficiency of packaged air-cooled water chillers with inverter driven scroll compressors. Energy Convers. Manag. 2010, 51, 1500–1509. [Google Scholar] [CrossRef]
  27. CETIAT. Part-Load Performance Behavior of On-Off and Variable Capacity Heat Pumps; Groundmed: Madrid, Spain, 2010. [Google Scholar]
  28. Danfoss. The Turbocor Family of Compressors Model TT300, Danfoss TURBOCOR. Datasheet. Available online: www.turbocor.com,USA (accessed on 20 April 2019).
  29. Fahlén, P. Capacity control of heat pumps. REHVA 2012, 49, 28–31. [Google Scholar]
  30. Palkowski, C.; Zottl, A.; Malenkovic, I.; Simo, A. Fixing efficiency values by unfixing compressor speed: Dynamic test method for heat pumps. Energies 2019, 12, 1045. [Google Scholar] [CrossRef] [Green Version]
  31. Estadísticas del Sistema Eléctrico | Red Eléctrica de España. Available online: https://www.ree.es/es/estadisticas-del-sistema-electrico/3015/3001 (accessed on 24 April 2019).
  32. NÚMERO 115. Boletín Oficial del Estado; Ministerio de Energía, Turismo y Agenda Digital: Madrid, Spain, 2018; p. 49415.
  33. OMIP Operador del Mercado Ibérico de Energía—Polo Portugués. Available online: https://www.omip.pt/ (accessed on 7 May 2019).
  34. NÚMERO 301. Boletín Oficial Del Estado; Ministerio de Industria, Energía y Turismo: Madrid, Spain, 2015; p. 303.
  35. El Mercado de Restricciones Técnicas. Available online: http://mifacturadeluz.com/mercado-de-restricciones-tecnicas/ (accessed on 25 April 2019).
  36. Puerto Escandón (España)—Parques eólicos—Acceso en línea—The Wind Power. Available online: https://www.thewindpower.net/windfarm_es_2253_puerto-escandon.php (accessed on 30 April 2019).
  37. Federico Bava DS D2.1 Case studies: User Requirements and Boundary Conditions Definition. CHESTER. Available online: https://www.chester-project.eu/wp-content/uploads/2018/11/CHESTER_D2.1_Case-Studies_v5.0.pdf (accessed on 15 May 2020).
  38. Estado actual de la energía termosolar (CSP)—HELIONOTICIAS. Available online: http://helionoticias.es/estado-actual-de-la-energia-termosolar-csp/ (accessed on 20 May 2019).
  39. Gallo, A.B.; Simões-Moreira, J.R.; Costa, H.K.M.; Santons, M.M.; dos Santons, E.M. Energy storage in the energy transition context: A technology review. Renew. Sustain. Energy Rev. 2016, 65, 800–822. [Google Scholar] [CrossRef]
  40. Smallbone, A.; Jülch, V.; Wardle, R.; Roskilly, A.P. Levelised Cost of Storage for Pumped Heat Energy Storage in comparison with other energy storage technologies. Energy Convers. Manag. 2017, 152, 221–228. [Google Scholar] [CrossRef]
  41. Proctor, P. Energy storage: A potential game changer and enabler for meeting our future energy needs? In Proceedings of the All Energy Conference, Aberdeen, UK, 22 May 2014. [Google Scholar]
Figure 1. CHEST system layout.
Energies 13 04739 g001
Figure 2. Temperature-entropy (T-s) diagram of the charging and discharging cycles with the CHEST system.
Energies 13 04739 g002
Figure 3. General layout of the TRNSYS-CHEST model.
Energies 13 04739 g003
Figure 4. Ratio between the actual and nominal COP at different PLR values.
Energies 13 04739 g004
Figure 5. Initial power programmed for a wind farm and actual power produced.
Energies 13 04739 g005
Figure 6. Power profile of technical constraints for the power plant under study for the year 2018 and average monthly energy prices.
Energies 13 04739 g006
Figure 7. TRNSYS plot charts of the power and energy prices profiles (A) and level of charge of the thermal energy storage tanks (B) for the first week of simulation in case 1.A.
Energies 13 04739 g007
Figure 8. Technical performance of the proposed CHEST system for different case scenarios.
Energies 13 04739 g008
Figure 9. Economic performance of the proposed CHEST system for different case scenarios.
Energies 13 04739 g009
Figure 10. Maximum total CAPEX (for total installed power of each case) and maximum unitary CAPEX per MW installed.
Energies 13 04739 g010
Table 1. Parametric studies for the proposed CHEST system integrated in the wind power plant under study.
CASENominal HTHP and ORC Power (MW)Purchase Energy?
1.A1NO
1.B1YES
2.A2.5NO
2.B2.5YES
3.A5NO
3.B5YES
4.A7.5NO
4.B7.5YES
5.A10NO
5.B10YES

