Article

Heterogeneity of Electricity Consumption Patterns in Vulnerable Households

by
Gianluca Trotta
*,
Kirsten Gram-Hanssen
and
Pernille Lykke Jørgensen
Department of the Built Environment, The Faculty of Engineering and Science, Aalborg University Copenhagen, A.C. Meyers Vænge 15, 2450 Copenhagen, Denmark
*
Author to whom correspondence should be addressed.
Energies 2020, 13(18), 4713; https://doi.org/10.3390/en13184713
Submission received: 6 July 2020 / Revised: 12 August 2020 / Accepted: 7 September 2020 / Published: 10 September 2020

Abstract

:
A key aspect of the design of specific tariff structures is to identify and characterize homogeneous electricity consumption profiles. Recent research in residential electricity demand has explored load profile segmentation via cluster analysis combined with descriptive data from the dwelling and occupants, which has partly explained electricity load patterns and their underlying drivers but has failed to investigate any consumption heterogeneity among similar households. Thus, the aim of this paper is to reverse this approach and investigate the extent that households with similar characteristics have different electricity consumption patterns. This study combines population-based register data with hourly electricity consumption data for a sample of 67 Danish households. First, a homogenous household group is selected based on several indicators that signal vulnerability. The specific group under investigation is single-person, older, low-income households in detached housing. Second, K-means clustering is used to identify similarities and differences in consumption patterns. The results indicate four distinct vulnerable household profiles characterized by different start and end times of peak and off-peak times, peak intensities, and overall consumption, which vary across seasons. These profiles are discussed concerning the performance of everyday practices and the design of demand-side management strategies targeted at vulnerable households.

1. Introduction

The traditional electricity customer classification based on a few macro-categories (e.g., residential, industrial, and commercial) is poorly correlated with the actual electrical consumption behavior of different types of customer and the evolution of the electricity markets [1]. Recently, the increase in high-temporal resolution smart meter data availability at the household level has enabled fine-grained information about the way domestic consumers use electricity that can facilitate a more refined customer electricity classification. In competitive electricity markets, the identification of homogeneous customer groups (or clusters) sharing a similar magnitude and timing of electricity usage represents a worthwhile asset for utilities and policymakers in the design of tailored demand-side management (DSM) strategies for load shifting and domestic electricity demand reduction [2,3,4].
In the context of customer segmentation and targeted DSM strategies, clusters must be explained not only by consumption patterns but also by the associated descriptive data from the dwelling and occupants [5]. Detailed knowledge of the underlying drivers shaping the electricity demand of customers can better support utilities and policymakers in segment-specific time-varying rate designs, in which the tariff rates are in line with effective electricity use by various customer types [6], targeted marketing campaigns and consumption feedback, domestic electricity load forecasting, and tailored energy efficiency strategies to reduce electricity demand [7,8,9].
Given the long-established relationship in the literature between household characteristics and electricity demand [10,11], some studies have attempted to infer specific sociodemographic and dwelling characteristics of households from the electricity load data collected via smart metering [12,13]. Other studies go even further in the customer segmentation analysis by combining smart meter data with data containing information about household characteristics. First, clustering techniques are typically used to identify different groups of electricity load patterns, and subsequently, binary or multinomial logistic or probit regressions are employed to infer household characteristics belonging to a particular profile class [8,9,14,15]. While providing valuable information about the probability that a household with specific characteristics belongs to a specific electricity load profile (in terms of magnitude and time of use), these studies fail to account for the heterogeneity of electricity consumption patterns among households with similar characteristics.
Thus, the purpose of this paper is to reverse the approach of previous studies and investigate whether and to what extent households with similar sociodemographic and dwelling characteristics have different electricity consumption patterns. When household characteristics are disentangled from predetermined factors influencing electricity use, the contribution of different practices and their order in time combined with appliance ownership can be revealed in explaining the variation in timing and magnitude of electricity demand. This narrower perspective more fully addresses the complexity of the challenges involved in customer grouping based on consumption patterns and household characteristics, and it allows the consideration of different (potential) distributional effects of demand response strategies targeted to a particular socioeconomic group of consumers.
Several UK studies [16,17,18,19,20], highlighted the strong relationship between some household activities (and the associated use of appliances) and electricity consumption at different times of day, controlling for sociodemographic and dwelling characteristics [21]. More recently, Satre-Meloy [5] presented the first attempt to combine load profile segmentation via cluster analysis with time-use activity data to predict load profile cluster membership for a sample of 269 UK households. Household activities, such as food preparation, especially cooking with energy-intensive appliances and eating hot meals, screen time, laundry, and socializing were shown to be important predictors of electricity load shapes. However, by aiming at being representative, most of these studies do not investigate heterogeneous consumption patterns within the same household group.
Energy consumption should be understood as following the course of performing social practices [22,23], rather than as a meaningful activity in itself. More generally, consumption has been argued to best be understood as moments in practices that are guided by other meanings and ends [24]. Thus, energy consumption follows from everyday practices, such as cooking, laundering, and watching television. Furthermore, the time of consumption follows from the timing of these practices in everyday life, including rhythms, sequences, and the order of practices related to each other and the institutional and material arrangements [25,26,27]. Differences in peaks and valleys of time of consumption in households relate to the variation in timing and the duration of the performance of practices.
This article uses population-based register data for a sample of Danish households combined with hourly electricity consumption data for the year 2017. First, administrative register data were used to select a subset of the Danish population containing households with characteristics that signal vulnerability, including income, age, working status, and dwelling characteristics. Second, K-means clustering was employed to segment the selected vulnerable households concerning their electricity consumption patterns.
The selected socioeconomic group deserves attention as a potential increase in the electricity expenditure driven by a change in tariff can lead to disproportionately large welfare losses. The current legislation in Denmark neither provides a specific definition of vulnerable households nor recognizes the energy or fuel poverty issues. Generally, in Denmark, vulnerable consumers are considered to be the recipients of social security benefits [28]. In this paper, drawing upon energy vulnerability studies (e.g., [29,30,31]), vulnerable households were identified based on several sociodemographic and dwelling characteristics (for a further discussion on this point, see the “Materials and Methods” section). Unlike most of the energy or fuel poverty studies, the focus is not on households who do not have access to energy services [32,33], or those who are unable to heat their home adequately [34,35], but on households who might be more exposed to additional electricity price increases and might be more adversely affected by DSM strategies for peak reduction [31,36]. Energy vulnerability, therefore, serves to highlight the underlying risk factors that might lead to energy poverty as a consequence of transitioning to a low-carbon economy [30,37,38,39].
Denmark is a compelling case to analyze because the electricity prices for households are among the highest in the European Union and increased by 12.7% from 2010 to 2017 [40]. In 2017, the average total electricity price for household customers was 30.21 cEUR/kWh; the final electricity price household customers paid was made up by 14.5% in energy component payments, 18.1% in grid payments (transmission and distribution), while taxes, value-added tax (VAT), and PSO (public service obligation) were the largest price elements accounting for 67.4% of the total price [41].
With the increasing use of intermittent renewables in the supply mix and the national roll-out of smart meters that is expected to be completed by the end of 2020, the debate about tariff design is gaining momentum in Denmark. A major challenge facing decision-makers in the utility industry is to incorporate not only economical but also fairness, equity, and distributional justice principles in the design of time-varying rates to ensure that no one is left behind [42]. Simultaneously, policymakers are required to take the necessary measures to protect vulnerable households against the costs of financing the low-carbon transition, employing social or energy policy, such as bill protection, information provision, and subsidies for energy-efficiency interventions [43]. Threats to vulnerable consumers due to electricity market transformation, increased electricity prices, and the recent untoward economic circumstances caused by the COVID-19 crisis, which has forced people to rely more on electricity while confined to their homes, have amplified the importance of social justice as a key principle in policymaking. The contribution of this article to the literature is three-fold. First, this is the first study that uses population-based register data combined with hourly electricity consumption data to segment a sample of vulnerable Danish households. Second, unlike previous studies that analyzed electricity consumption patterns among different household types, this study investigates electricity consumption patterns within the same household type. Third, practical considerations for the design of DSM strategies targeted at vulnerable households are provided for decision-makers in the utility industry and for policy, which include this new insight on the variation in consumption profiles among a homogeneous group.
The paper is structured as follows. Section 2 describes the data and methods used in the Danish case study. The results are presented in Section 3. Section 4 discusses the results and provides concluding remarks.

2. Materials and Methods
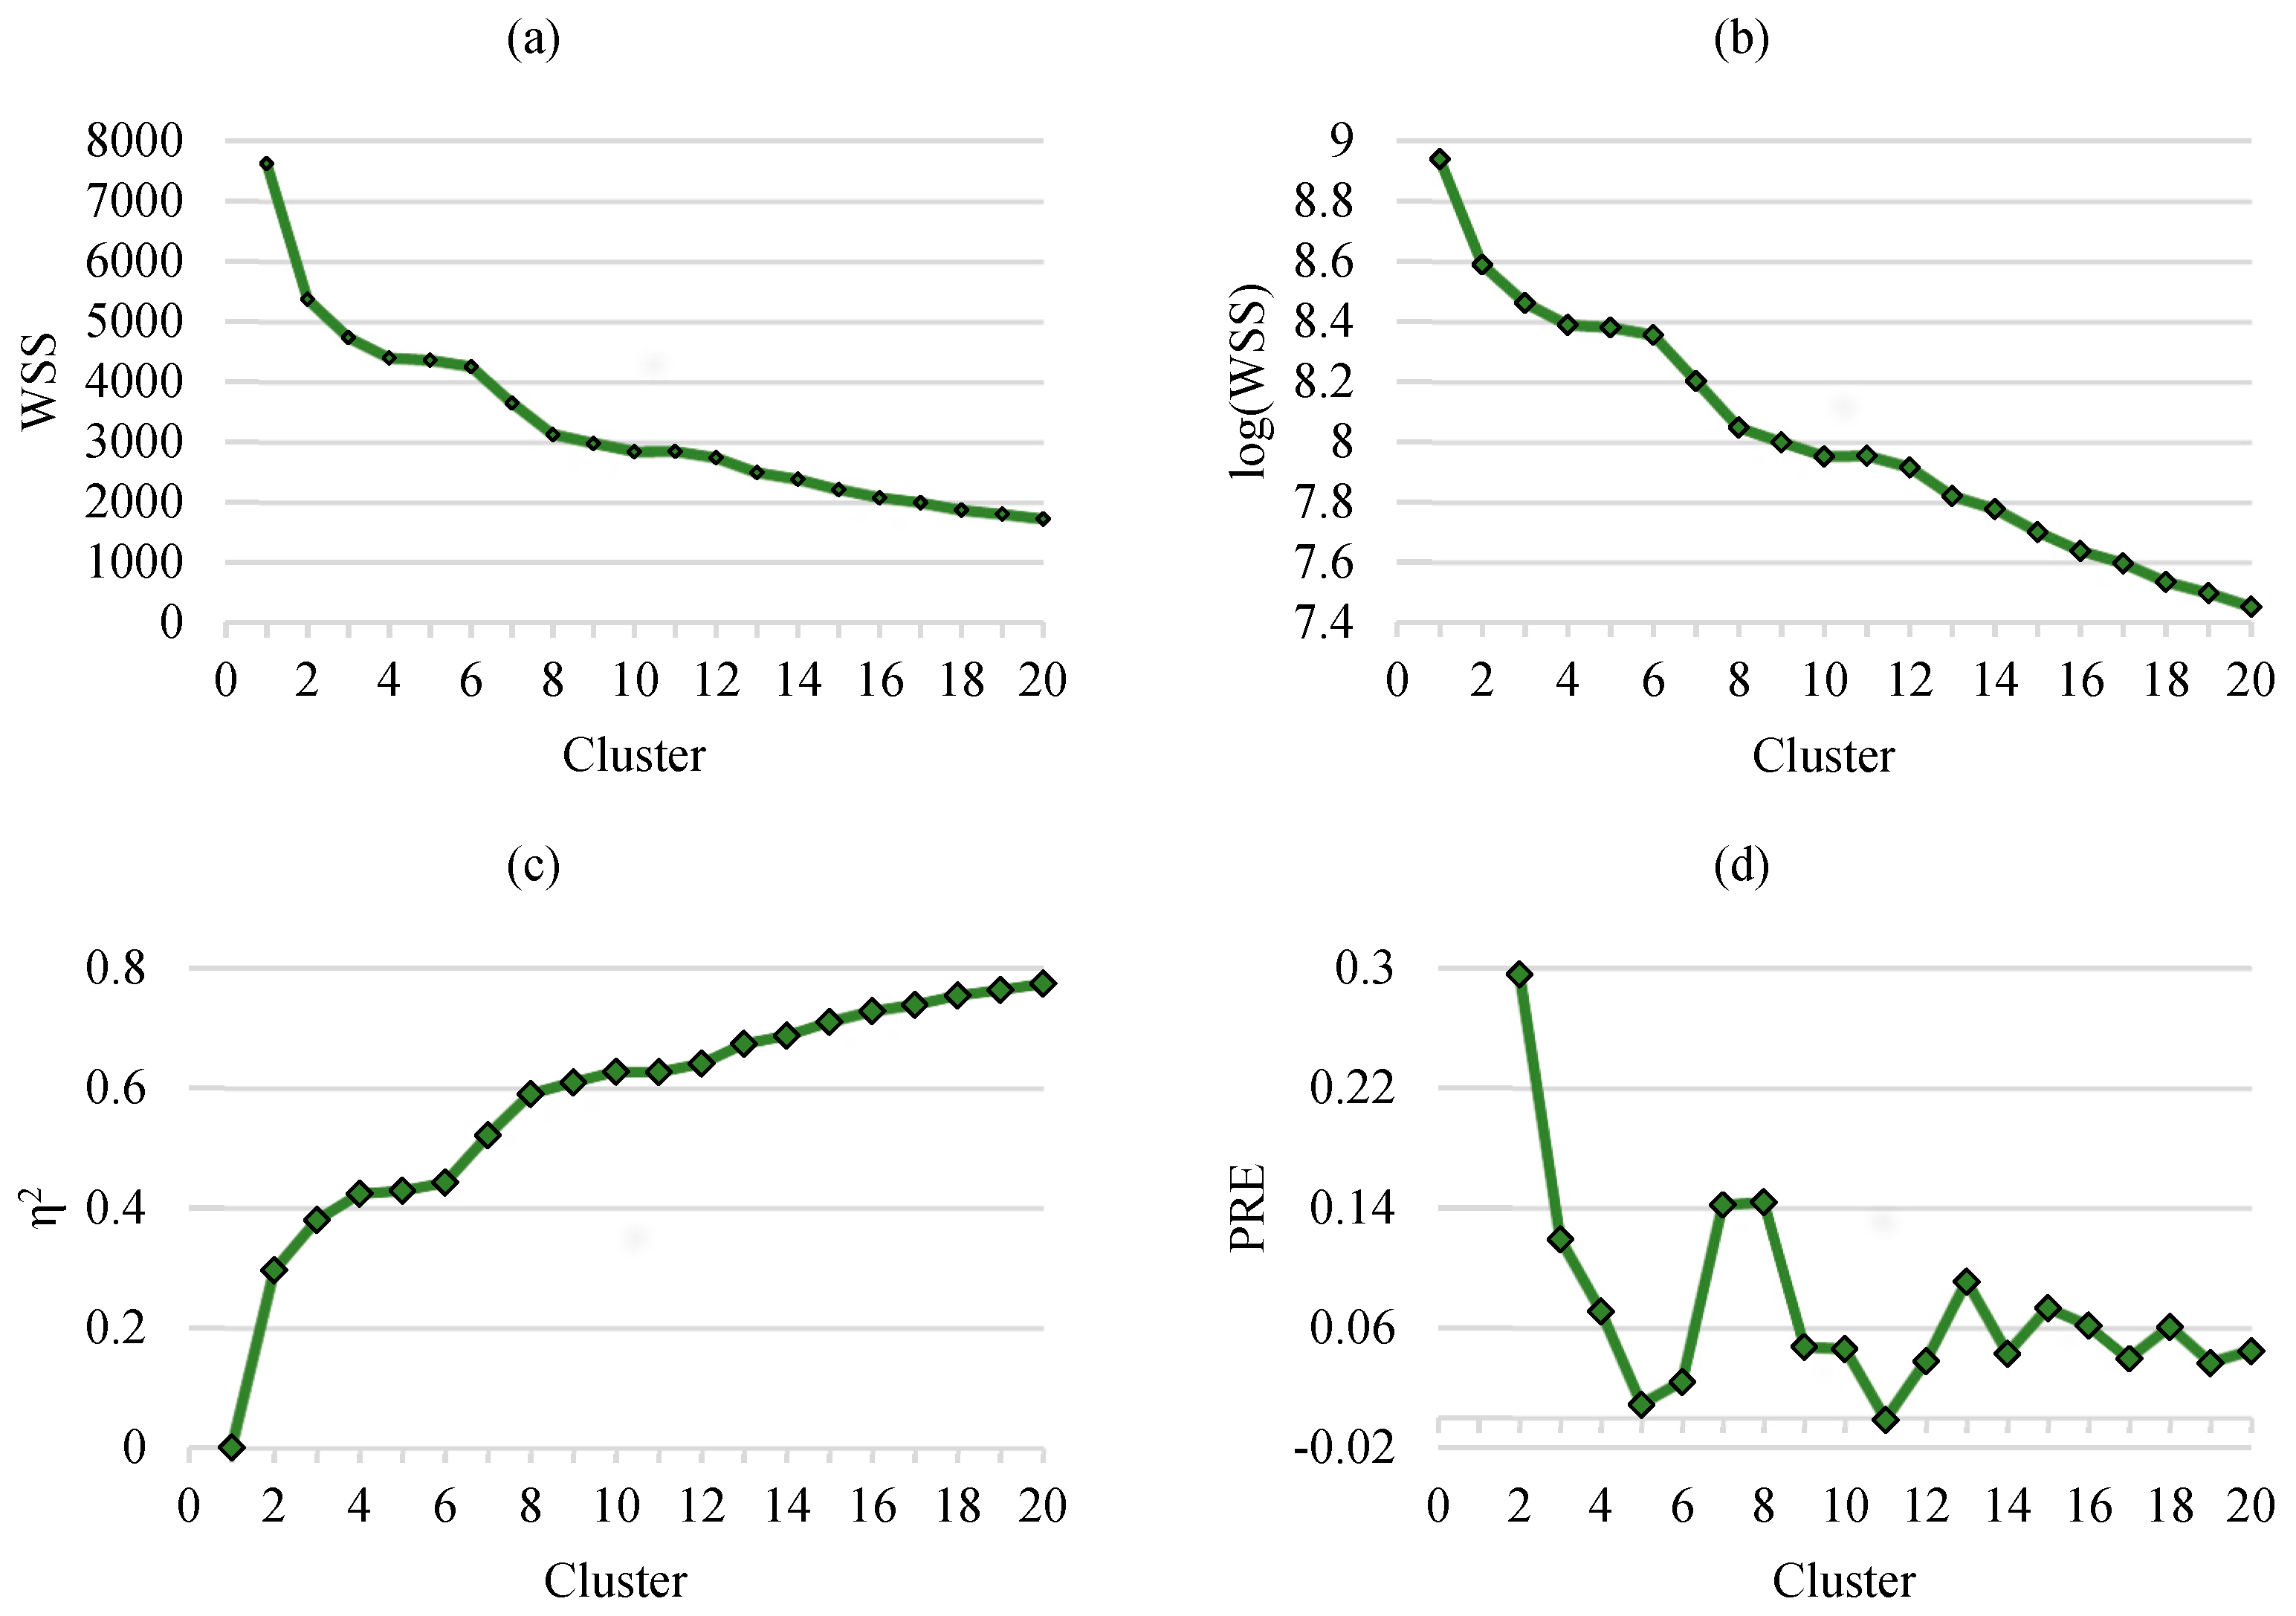
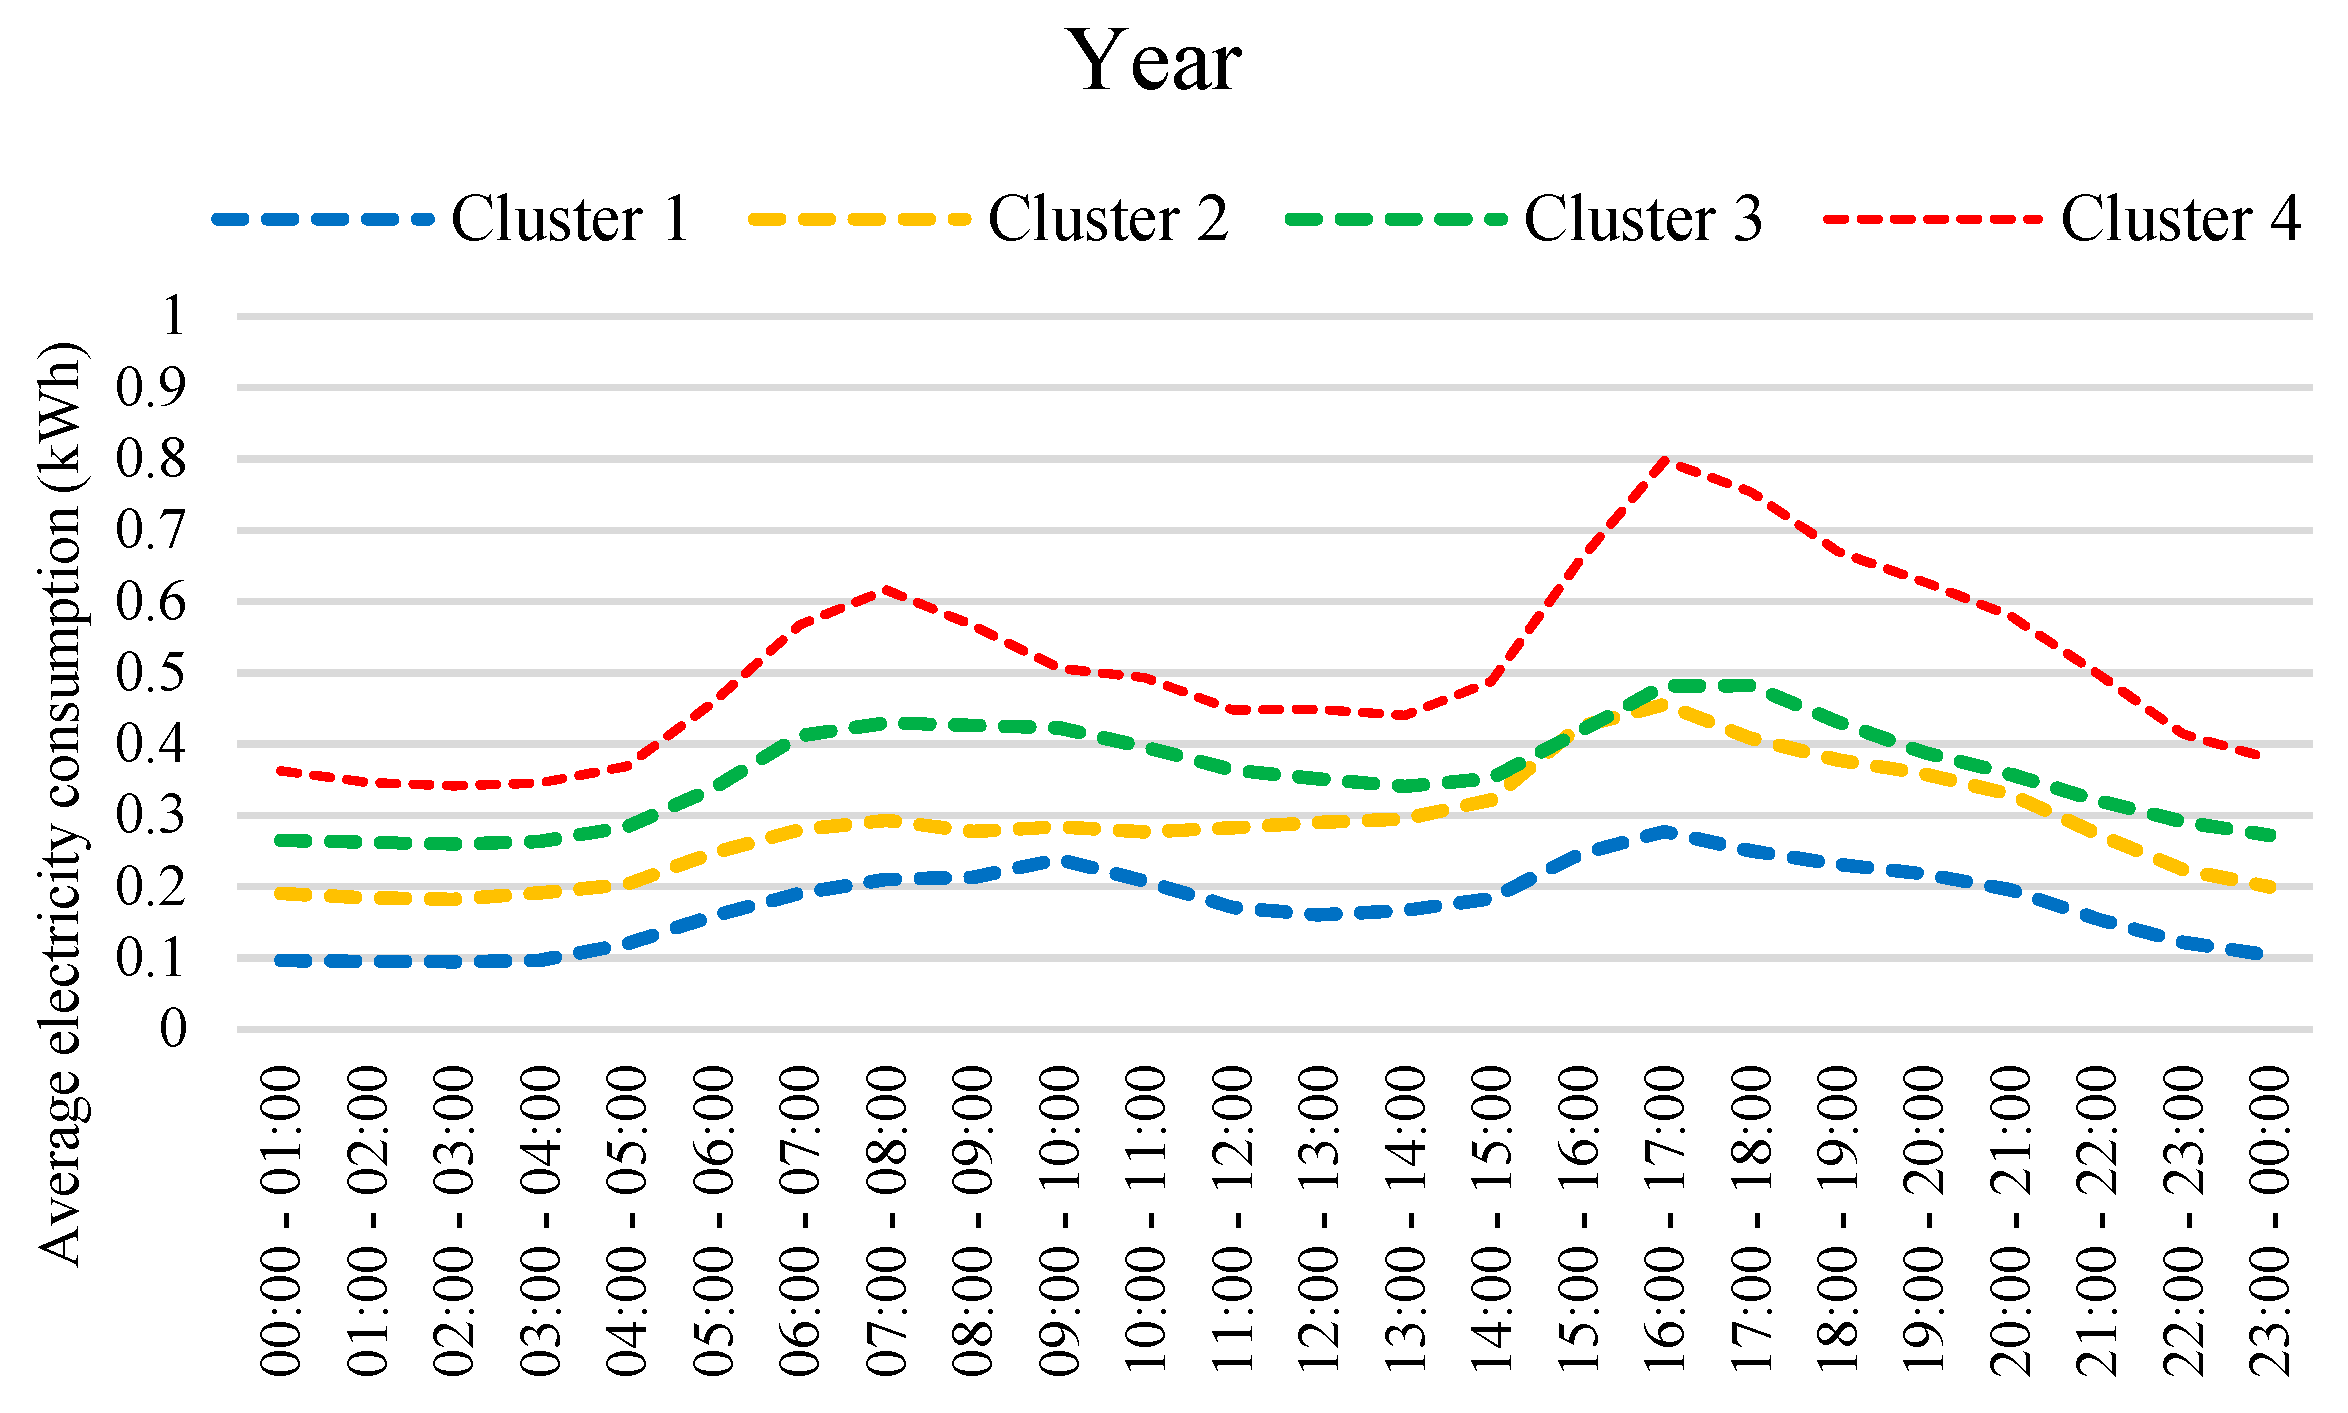
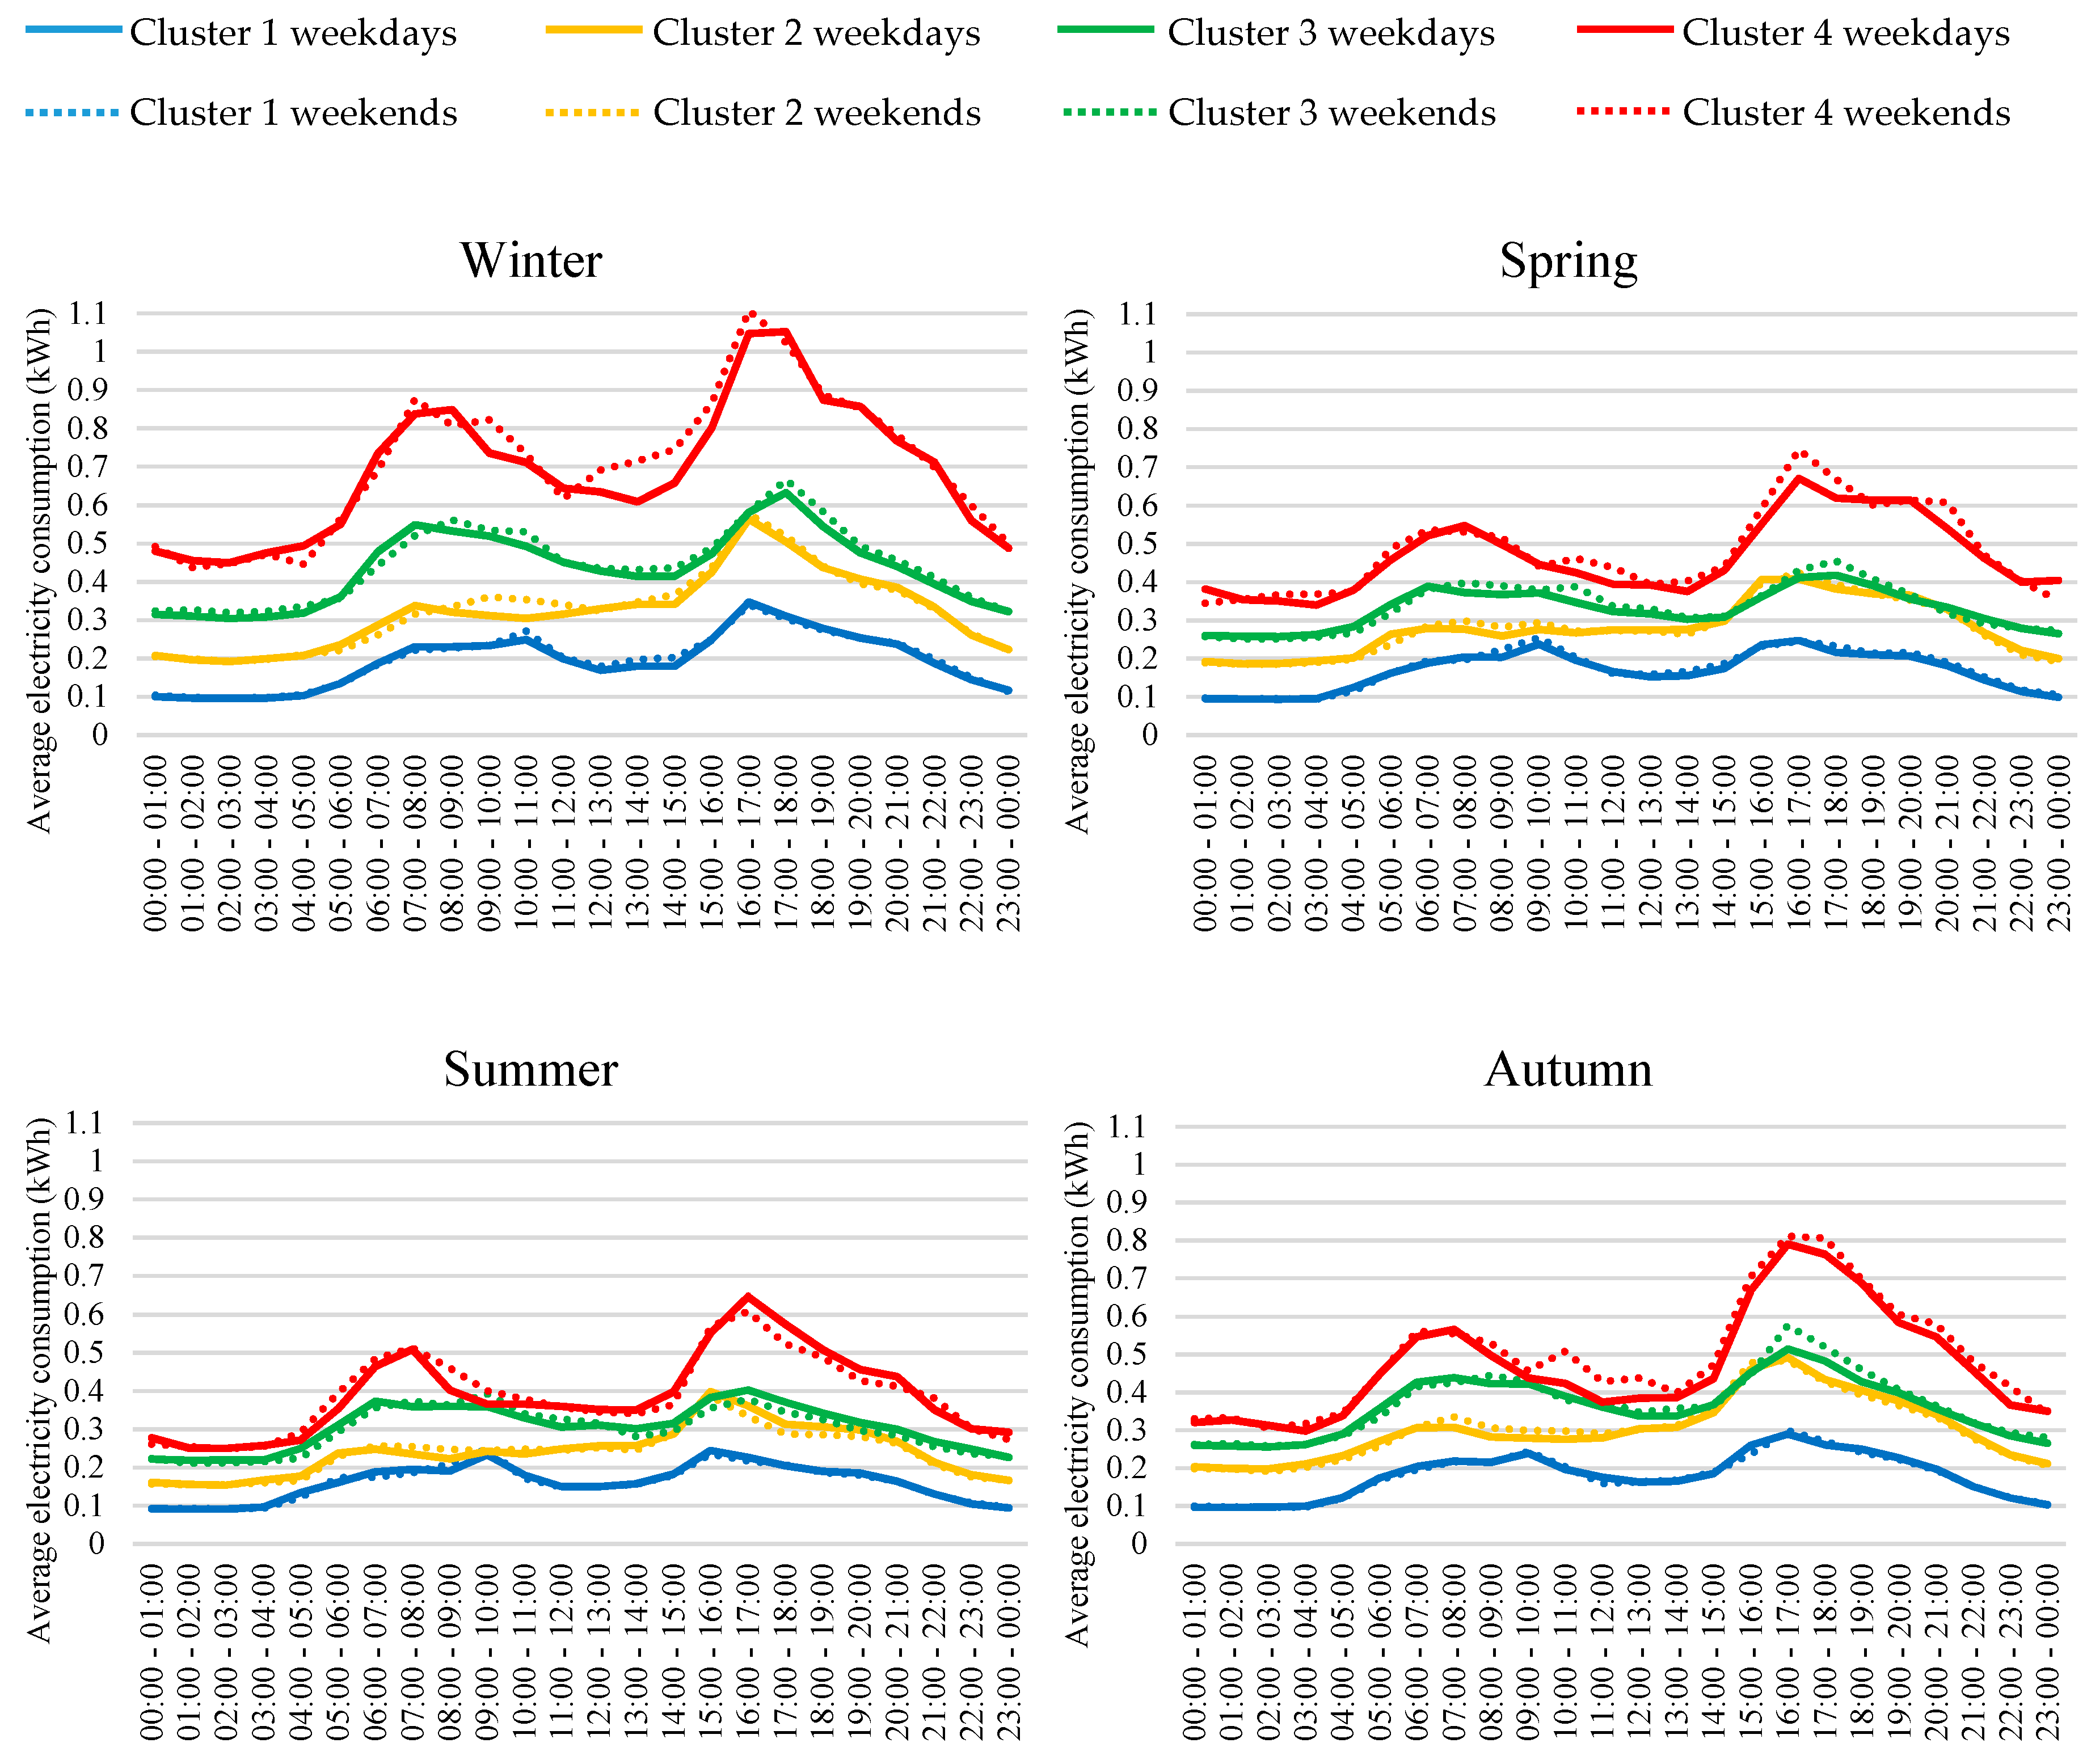
The dataset used in the analysis was taken from a sample of 19,734 Danish households where the combination of smart meter data and administrative register data were available. The link between the different datasets was possible because each person living in Denmark has a personal registration number (“Det Centrale Person Register” or CPR), which is used by public authorities to store personal information. Access to de-identified microdata is given through secure remote access to servers at Statistics Denmark and can be granted to researchers and analysts from Danish research environments [44,45].
Energy vulnerability is a multidimensional issue, and its degree is determined by a multiplicity of factors. By drawing upon studies on indicators of energy vulnerability [28,29,30,31,46], many characteristics including income, age, working status, household composition, dwelling type, dwelling age, and floor area were considered to identify households with a higher risk of vulnerability. In particular, the selected group under investigation contains individuals who are single-person households, over 65 years old, on the lowest income quintile, outside the workforce, living in a single-family detached house built before 1972 (first building regulation) with a floor area between 100 and 200 m2. Households headed by elderly individuals who are outside the workforce are associated with long hours spent at home, and thus, high energy needs. Living alone and low levels of income account for a relatively larger proportion of the total budget on electricity bills. Moreover, living in a large and potentially inefficient dwelling is associated with a larger number of old appliances that do not run efficiently and require higher energy needs [28,29,30,31,46].
To increase comparability between households, the sample contains only households that own the dwelling and that have a heating system powered by sources other than electricity. This is because it is not possible to know the extent to which rental expenses and having a heating system powered by electricity can affect housing spending and electricity demand, respectively. In addition, to control for geographical and climatic differences, while acknowledging the embedded geography of the energy vulnerability issues, the selected households are located in the same region (the Region of Southern Denmark).
Vulnerable households are not a homogenous group and can have different characteristics and needs (e.g., low-income households with disabilities or with many members as opposed to low-income single-person households); however, the target group was selected to consider not only vulnerability indicators but also degrees of comparability within the group to ascribe the (potential) consumption pattern differences to unobservable factors (e.g., practices and appliances).
A final sample of 67 households was used in the analysis. The hourly electricity consumption data cover the period from 1 January 2017 to 31 December 2017. The final number of observations is 583,161 accounting for data-entry errors and missing information. Table 1 shows the breakdown of the sample on the basis of the selected indicators of vulnerability.
The method of K-means clustering was used to group vulnerable households by their electricity consumption profile. The K-means method is one of the most-used clustering techniques due to its stability, efficiency, and empirical success [47,48], and because it typically presents better results compared to other algorithms [49]. Unlike (agglomerative) hierarchical clustering algorithms (e.g., single linkage, complete linkage, and Ward linkage), which work in a bottom-up manner and start with clusters including a single element and proceed to merge pairs of clusters until there is only one, K-means clustering is a partitional algorithm that simultaneously finds all the clusters as a partition of the data and does not impose a hierarchical structure [47,49,50,51].
The objective of K-means clustering is to partition consumption profiles into several homogeneous k clusters by minimizing the sum of all distances to the respective cluster centers. The K-means clustering algorithm can be expressed as follows:
J = k = 1 K x i   c k || x i μ k || 2
where μ k is the mean of cluster c k and | | x i μ k | | 2 is the standard Euclidian distance function between the data point x i and its closest centroid μ k . A smaller J results in within-group data that are more similar. Prior to K-means clustering, minimum-maximum normalization is scaled to fit in the range of (0,1) to eliminate redundant data and ensure good quality clusters [15,52,53]. The K-means clustering was calculated using the average hourly electricity consumption of the days of the week for each month (135,072 observations).
Despite its efficiency and robustness, some disadvantages, such as the convergence to a local minimum, and the selection of the correct number of clusters are associated with the K-means clustering algorithm. To overcome the local minimum limitation, the K-means algorithm was performed 50 times with different random starting points for 20 cluster solutions, and the one with the smallest squared error was selected. To select the correct number of clusters, the method proposed by Makles [54] was followed. In addition to the widely used scree plot of the curve of the within sum of squares (WSS) and its logarithm form (log WSS) according to the number of clusters k, also known as the “elbow method,” the η 2 coefficient and proportional reduction of error (PRE) coefficient were employed to detect the optimal number of clusters:
η k 2 = 1 W S S K W S S 1 = 1 W S S K T S S   k K
P R E k = W S S k 1 W S S k W S S k 1   k 2
where WSS(K) [WSS (k − 1)] is the WSS for cluster solution k (k − 1), and WSS(1) is the WSS for cluster solution k = 1 (for the non-clustered data), η k 2 measures the proportional reduction in the WSS for cluster solution k compared to the total sum of squares, and P R E k measures the previous solution with k − 1 clusters [54]. The analyses were performed using STATA MP 16.1.

3. Results

The results indicate that clustering with k = 4 is the optimal solution. At k = 4, a kink or ‘knee of the curve’, which is the cutoff point where the difference in the within-cluster dissimilarity is not substantial, exists in both the WSS and log (WSS) figures (Figure 1). Compared to the k = 3 solution, η 4 2 points to a 42% reduction in the WSS, and P R E 4 points to a reduction of about 7%; however, the reduction in WSS for k > 4 is negligible. The optimal solution with k = 4 occurs 34 times (68%), whereas 16 results (32%) point to k = 3 to be the optimal number of clusters.
Figure 2 illustrates the annual average electricity consumption patterns of the four clusters.
Households belonging to Cluster 1 represent 40.3% of the sample (n = 27), followed by Cluster 2 (31.3%; n = 21), Cluster 3 (16.4%; n = 11), and Cluster 4 (11.9%; n = 8).
Table 2 shows the variation in the annual average base consumption (kWh), average consumption (kWh), and average peak consumption (kW) among the four identified clusters.
The daily average electricity consumption of households belonging to Cluster 1 (4.2 kWh) is almost two-thirds of the consumption of Cluster 2 (6.8 kWh), less than half of the consumption of Cluster 3 (8.6 kWh), and almost one-third of the consumption of Cluster 4 (12.2 kWh).
Because the average annual figure provides aggregate-level information about the domestic electric use, the electricity consumption profiles of the identified clusters are broken down into seasons, weekdays, and weekends. Figure 3 illustrates the seasonal average electricity consumption by the hours of the weekdays and weekends for the four clusters.
The results indicate substantial consumption heterogeneity across similar households that cannot be captured by their sociodemographic and dwelling characteristics (Additional heterogeneous consumption patterns could potentially be found if broader indicators of vulnerability were considered). The findings indicate the extent to which variation in the performance of practices, their order in time, and appliance ownership have an influence—without accounting for their relative contribution—on the variation in the timing and magnitude of electricity use. The performance of practices can vary among different social groups [24,25]; however, the cluster analysis presented here documents that we should also expect variation within homogeneous groups. Qualitative studies based on practice theoretical approaches have been interested in understanding such variation and have pointed at how the specific socio-material settings during childhood and previous living and the specific material arrangement can help understand such variations [55,56]. Thus, social groups with shared experiences based on class and upbringing may exhibit similarities in patterns of consumption [57,58]. This, however, does not imply that we cannot also find huge variations within homogeneous groups.
The four clusters are associated with distinct start and end times of peak and off-peak times, peak intensities, and overall consumption, which vary across seasons. Common to the four clusters is the seasonal variation in electricity demand. In colder seasons, households spend more time inside the home, and the use/need for lights and appliances increases. However, the variation of the electricity consumption within seasons differs within clusters; from summer to winter, households belonging to Cluster 1 increased on average their electricity consumption by 21.1%, followed by Cluster 2 (34.4%), Cluster 3 (46%), and Cluster 4 (78.6%). Table 3 shows the variation in the daily average electricity consumption (kWh) by season, weekdays, and weekends among the four clusters.
Except for Cluster 3, households exhibit two distinct peaks: morning and evening peaks. However, a higher consumption within the seasons, days of the week, and clusters results in a larger magnitude gap between the evening and morning peaks.
For most of the year, Cluster 1 is characterized by average morning peak hours between 9 a.m. and 10 a.m. and average evening peak hours between 4 p.m. and 5 p.m.; however, during summer, average evening peak hours occur earlier, whereas the average morning peak hours are later during winter. Cluster 2 follows similar average evening peak hour patterns but is characterized by a high dispersion of consumption during the morning and no clear peak hours. Clusters 3 and 4 are characterized by relatively stable average evening peak hours between 4 p.m. and 6 p.m. and volatile average morning peak hours that vary with the season and day of the week.
Unlike other studies showing a substantial difference between electricity consumption curves for weekdays and weekends [8,59,60], the results indicate that the electricity consumption shapes of the four clusters do not significantly vary on weekends compared to weekdays. This is due to the likely high active occupancy [61] of the household type under investigation (elderly and outside the workforce).

4. Discussion and Conclusions

The results emphasize that customer segmentation based on smart meter data and household characteristics is not a sufficient condition for supporting utilities in the design of tailored time-varying rates, which include considering the different needs and resources of consumers and the energy system perspectives (integration of high shares of intermittent renewable generation into grids). Other factors related to variations in socio-material settings [55,62], that result in variations in the specific performance of everyday mundane practices are crucial in shaping electricity consumption profiles and should inform strategies aimed at reducing the peak and overall demand [5,15,19,21]. Thus, when designing a tariff structure, one should be aware of how specific (vulnerable) groups have certain common patterns of consumption, while recognizing that huge variations may also exist within these groups.
However, collecting data that can reveal this variation, which is typically done with reported time-use activity surveys, and incorporating them into customer segmentation is very complex, especially in a large-scale process. Given the heterogeneity of electricity consumption patterns in vulnerable households, utilities should consider them separately when offering options to shift peak demand.
Because of the stochastic nature of the electricity demand and consumption heterogeneity of households, no rate design can create a win-win solution that works for everyone. Hypothetically, under the same time-variable electricity rate, in the absence of any change in behavior, there could be “winners” and “losers” even within the same household group. In practice, some households (with similar characteristics) may see immediate savings on their monthly electric bills, while others’ bills increase. Yet, for households at risk of vulnerability that are already struggling with energy bills, are unable to replace appliances with more efficient ones, and may not be able to take advantage of smart control and timing of appliances, this could exacerbate distributional injustices or create new ones [31,36,37,42]. The extent of financial gains or losses depends on the ability of households to adjust demand under the specific design of the tariff, including the number of time and price zones, the price level in each period, and the start and end times of each time zone. As suggested by Powells and Fell [63], the ability to be flexible in terms of energy use is determined by the complex interaction of a wide variety of factors that form a ‘flexibility capital’, which varies across (and within) societies, and might be limited for individuals more exposed to injustices and that have fewer financial resources (‘flexibility injustice’).
Mixed results on how vulnerable consumers respond to time-varying rates have emerged from the literature. Besides context-dependency, the reasons for this discrepancy include different tariff designs and vulnerability indicators, different responses to price signals, and heterogeneous consumption patterns. Some studies have focused on the time-of-use (TOU) tariffs with different variants [31,64,65], some have examined TOU tariffs in combination with other tariff types, such as critical peak pricing (CPP) and peak time rebates (PTR) [65,66], and others have investigated CPP or PTR in isolation [66,67]. Vulnerability indicators that have been considered include the count of low-income customers by various definitions [31,64,65,66,67] elderly customers [31,64,67], disabled customers [31,64], families with children [31,64,68], chronically ill customers [67], and ethnic minorities [31].
Studies focusing on low-income consumers generally seem to conclude that they are responsive to time-varying rates; however, while the results of some pilot programs indicate that low-income consumers are as responsive as the average consumer [67], others suggest that they might only be half as responsive [69].
The results can also be susceptible to the specific definition of low-income customers [65]. In the absence of any change in behavior, some authors have argued that low-income customers would benefit from (revenue-neutral) time-varying rates because they tend to have flatter load shapes than the average consumers [69,70], whereas other authors have suggested that time-varying rates would harm low-income customers because they tend to have higher average peak usage than the average consumers [14]. In the case of elderly customers, there is also evidence of a response discrepancy concerning its magnitude. The results from one study suggest that their response is comparable to that of the average consumer [67], but the results from two other studies indicate that they respond less [31,64]. These pilot programs, despite being very valuable, might suffer from selection bias, where consumers that have a better ability to respond to a program tend to enroll. Participants in these types of program are also less risk-averse and have a higher expectation of monetary savings from participation than the general population [71].
To ensure that vulnerable households do not bear the risk of financial loss resulting from a change in the tariff, utilities might offer different time-varying rate options and the opportunity to enroll in a tariff voluntarily. If vulnerable households decide to opt-in, they could be provided temporary bill protection that prevents financial loss had they opted for other time-varying rates or stayed on the flat-rate plan [72]. Additionally, whether households decide to opt-in or not for a tariff, to increase transparency and help them to make informed decisions, electricity bills should include information about what they would have paid under different time-varying rates and what would be the increase or decrease in the electricity bill if a part of the consumption were moved from on-peak to off-peak times. This could potentially minimize misperceptions about actual financial savings/losses compared to the perceived financial savings/losses and could facilitate optimal (rather than heuristic) decision-making [73]. In addition, by enhancing consumer learning and attention, information provision and awareness about electricity consumption, bills, and tariffs have been shown to increase the price elasticity of demand and to reduce electricity demand [74,75,76,77]. However, a UK study found that [78], even when presented with complete information, many consumers (especially those in the lower socio-economic grades) were affected by bounded ‘rationality’ and were unable to optimize over their electricity tariff. Based on results presented in this paper, it is important to be aware that the variation in the consumption pattern among this vulnerable group indicates that advice regarding what is most economically feasible for them varies, given their heterogeneous consumption profiles, and that information provision might not necessarily lead to ‘optimal choices’.
To help activate flexible demand and reduce cross-subsidies among and within customer classes and peak pressure on the grid, the “right” price signals must be provided to customers. On the one hand, if the peak-to-off-peak price ratio is too small, households would not invest the time and effort to shift their electricity demand [72,74]. On the other hand, if the differential is too large, households could experience a rate shock and decide to opt-out. Generally, economists have argued that consumption shifting increases as the strength of the price signal increases, but at a decreasing rate [79,80,81]. From a sociological perspective, prices may influence practices in ways other than just based on an economically rational understanding [82,83,84,85,86]. Prices give meaning to perform certain practices in other ways or at other times. Moreover, price signals carry the meaning of the environmentally or socially most responsible methods of consumption [84,87]. Furthermore, materiality, including housing layout and appliances, together with competences influence the effect of price signals and thus how they should be interpreted [58,85].
In Denmark, any consideration regarding the size of the ratio between the off-peak and on-peak rates should consider that the electricity price paid by domestic customers is largely dominated by fixed per-unit elements [88]. Indeed, the debate about the introduction of a dynamic electricity tax (and an overall reduction in the electricity taxes) as an instrument to boost flexible demand has recently entered the agenda of the Danish Ministry of Climate, Energy and Utilities [89]. Several projects have been initiated during the last decade to understand how flexibility in household consumption can be achieved, most including either variable pricing, feedback on consumption to households, or automatic control by an aggregator—often in combination [83,90].
Regardless of its design, when a time-varying rate is coupled with enabling technologies, such as smart appliances or in-home-display, the demand response often increases [74,91,92]. However, research has also raised concern about the opposite: that automation does not always lead to lower consumption but can lead to increased consumption [93]. Even in cases in which the replacement of old appliances with high-efficiency appliances could reduce the pressure on households to shift consumption from on-peak to off-peak times, in the case of vulnerable households such investments are often prevented by the lack of access to capital. This is an area where political action is needed because these issues have been largely absent from the energy and social policy debates in Denmark over the last few years. Unlike some European Union (EU) countries, other than information campaigns and the transposition of the Ecodesign Directive 2009/125/EC and the Energy Labelling Directive 2010/30/EU into national law, no financial incentive has been provided to vulnerable households in Denmark for the replacement of inefficient appliances [94,95,96]. In particular, if the future brings complex tariff structures, including higher prices, to encourage efficiency and flexible consumption, special consideration must be given to these vulnerable groups, including the understanding that, even within the group of vulnerable households, there may be quite a huge variation in the time and magnitude of consumption.
To lower the up-front costs of efficient and smart appliances and spur their penetration, subsidies specifically targeted to vulnerable households could be offered. Instead of a one-size-fits-all approach, targeted interventions for vulnerable households may also contribute to lower free-rider effects and may improve the cost-effectiveness evaluation of incentive programs [97,98]. The underlying assumption guiding these policies is that controllable and high-efficiency appliances can reduce consumption during higher-priced peak hours and/or overall electricity demand, which reduces the exposure of vulnerable households to high electricity bills. Some vulnerable households might prefer to save the money resulting from the reduction of the electricity bill, whereas others may offset part of the efficiency gains. Potential negative rebound effects on electricity consumption driven by the desire of vulnerable households to catch up with middle-class living standards could be counterbalanced by positive health and social benefits [99,100]. Recent studies have found that the psychological stress caused by the inability to pay energy bills and the fear of debt, which triggers feelings of anxiety and depression, can be a consequence of energy vulnerability [101] and can contribute to and shape it [102].

4.1. Summary

This study investigates electricity consumption patterns in vulnerable households in Denmark. The specific focus of the analysis allows the consideration of consumption heterogeneity among similar households, which has been neglected in previous studies. The homogenous group of vulnerable households was selected based on several indicators that signal vulnerability (e.g., income, age, working status, and dwelling characteristics), by using the population-based register data. K-means clustering was employed to group vulnerable households by their electricity consumption profile, using hourly electricity consumption data for the year 2017.
The results indicate four distinct vulnerable household groups characterized by different electricity consumption patterns. Vulnerable households show heterogeneous consumption patterns that are determined by the performance of practices, their order in time, and appliance ownership. In the absence of any change in behavior, the same time-varying rates can potentially disadvantage some vulnerable households and exacerbate distributional injustices.
There are two main takeaways. First, in the context of customer segmentation and the design of targeted DSR strategies, clusters should be explained by not only fine-grained electricity consumption data and descriptive data (from the dwelling and occupants) but also by everyday practices and appliance ownership data as they have a strong influence in shaping electricity consumption patterns. Cluster analysis customer segmentation based on smart meter data and household characteristics alone is not sufficiently discriminatory to cover different consumption patterns and does not adequately mirror the heterogeneity in electricity consumption patterns. Second, given the heterogeneity of electricity consumption patterns and the role of social protection in mitigating energy vulnerability, utilities and policymakers should provide vulnerable households more opportunities to gain greater control over their electricity expenditure and cut their electricity bills. This includes different time-varying rate options to choose from, the opportunity to enroll in a tariff voluntarily, a temporary bill protection, more transparent and informative electricity bills, and subsidies for the replacement of old appliances with new and more efficient ones.

4.2. Limitation and Future Research

This study is associated with some limitations, which must be acknowledged and overcome in future research. Due to the specificities of the type of analysis, which investigates the electricity consumption patterns of households with very similar sociodemographic and dwelling characteristics, the sample size is small. Moreover, the chosen sociodemographic and dwelling-related explanatory variables represent only a limited subset of the factors that are likely to influence energy vulnerability. While providing evidence of consumption heterogeneity among similar households at risk of vulnerability, the results do not account for the broad spectrum of the underlying drivers shaping vulnerability and electricity demand. Thus, as part of the eCAPE “New Energy Consumer Roles and Smart Technologies—Actors, Practices and Equality” project, we aim to collect time-use activity and appliance ownership data to investigate the specific contribution of different practices and appliances in explaining the variation in the timing and magnitude of electricity use. Informed by hourly electricity consumption data combined with both descriptive and survey data, the resulting electricity consumption patterns could better support the design of demand response strategies targeted at vulnerable households. The Danish case could also serve as a “natural experiment” exploiting the implementation of different TOU tariffs offered by some utilities from the beginning of 2018 to evaluate the change, if any, in the electricity usage of vulnerable households and the resulting financial gains or losses due to the change in the tariff.

Author Contributions

Conceptualization, G.T., K.G.-H., P.J.L.; methodology, G.T.; software, G.T.; validation, G.T.; formal analysis, G.T.; investigation, G.T.; data curation, G.T.; writing—original draft preparation, G.T., K.G.-H., P.J.L.; writing—review and editing, G.T., K.G.-H., P.J.L.; visualization, G.T.; supervision, G.T., K.G.-H.; project administration, G.T., K.G.-H.; funding acquisition, K.G.-H. All authors have read and agreed to the published version of the manuscript.

Funding

This work was financed by the European Research Council (ERC) under project grant Gram-Hanssen/786643, eCAPE “New Energy Consumer Roles and Smart Technologies—Actors, Practices and Equality.”

Conflicts of Interest

The authors declare no conflict of interest. The funder had no role in the design of the study; in the collection, analyses, or interpretation of data; in the writing of the manuscript; or in the decision to publish the results.

References

  1. Chicco, G.; Ionel, O.M.; Porumb, R. Formation of load pattern clusters exploiting ant colony clustering principles. IEEE EuroCon 2013, 1460–1467. [Google Scholar] [CrossRef]
  2. Pina, A.; Silva, C.; Ferrão, P. The impact of demand side management strategies in the penetration of renewable electricity. Energy 2012, 41, 128–137. [Google Scholar] [CrossRef]
  3. Hsiao, Y.H. Household electricity demand forecast based on context information and user daily schedule analysis from meter data. IEEE Trans. Ind. Inform. 2015, 11, 33–43. [Google Scholar] [CrossRef]
  4. Haben, S.; Singleton, C.; Grindrod, P. Analysis and clustering of residential customers energy behavioral demand using smart meter data. IEEE Trans. Smart Grid 2016, 7, 136–144. [Google Scholar] [CrossRef]
  5. Satre-Meloy, A.; Diakonova, M.; Grünewald, P. Cluster analysis and prediction of residential peak demand profiles using occupant activity data. Appl. Energy 2020, 260, 114246. [Google Scholar] [CrossRef]
  6. Chicco, G.; Napoli, R.; Piglione, F. Comparisons among clustering techniques for Electricity Customer Classification. IEEE Trans. Power Syst. 2006, 21, 933–940. [Google Scholar] [CrossRef]
  7. Kwac, J.; Member, S.; Flora, J.; Rajagopal, R. Household energy consumption segmentation using hourly data. IEEE Trans. Smart Grid 2014, 5, 420–430. [Google Scholar] [CrossRef]
  8. McLoughlin, F.; Duffy, A.; Conlon, M. A clustering approach to domestic electricity load profile characterisation using smart metering data. Appl. Energy 2015, 141, 190–199. [Google Scholar] [CrossRef] [Green Version]
  9. Viegas, J.L.; Vieira, S.M.; Melício, R.; Mendes, V.M.F.; Sousa, J.M.C. Classification of new electricity customers based on surveys and smart metering data. Energy 2016, 107, 804–817. [Google Scholar] [CrossRef]
  10. Hayn, M.; Bertsch, V.; Fichtner, W. Electricity load profiles in Europe: The importance of household segmentation. Energy Res. Soc. Sci. 2014, 3, 30–45. [Google Scholar] [CrossRef]
  11. Jones, R.V.; Fuertes, A.; Lomas, K.J. The socio-economic, dwelling and appliance related factors affecting electricity consumption in domestic buildings. Renew. Sustain. Energy Rev. 2015, 43, 901–917. [Google Scholar] [CrossRef] [Green Version]
  12. Anderson, B.; Lin, S.; Newing, A.; Bahaj, A.B.; James, P. Electricity consumption and household characteristics: Implications for census-taking in a smart metered future. Comput. Environ. Urban Syst. 2017, 63, 58–67. [Google Scholar] [CrossRef] [Green Version]
  13. Zethmayr, J.; Makhija, R.S. Six unique load shapes: A segmentation analysis of Illinois residential electricity consumers. Electr. J. 2019, 32, 106643. [Google Scholar] [CrossRef]
  14. Rhodes, J.D.; Cole, W.J.; Upshaw, C.R.; Edgar, T.F.; Webber, M.E. Clustering analysis of residential electricity demand profiles. Appl. Energy 2014, 135, 461–471. [Google Scholar] [CrossRef] [Green Version]
  15. Trotta, G. An empirical analysis of domestic electricity load profiles: Who consumes how much and when? Appl. Energy 2020, 275, 115399. [Google Scholar] [CrossRef]
  16. Torriti, J.; Hanna, R.; Anderson, B.; Yeboah, G.; Druckman, A. Peak residential electricity demand and social practices: Deriving flexibility and greenhouse gas intensities from time use and locational data. Indoor Built Environ. 2015, 24, 891–912. [Google Scholar] [CrossRef]
  17. Stankovic, L.; Stankovic, V.; Liao, J.; Wilson, C. Measuring the energy intensity of domestic activities from smart meter data. Appl. Energy 2016, 183, 1565–1580. [Google Scholar] [CrossRef] [Green Version]
  18. Anderson, B.; Torriti, J. Explaining shifts in UK electricity demand using time use data from 1974 to 2014. Energy Policy 2018, 123, 544–557. [Google Scholar] [CrossRef]
  19. Grunewald, P.; Diakonova, M. The electricity footprint of household activities–implications for demand models. Energy Build. 2018, 174, 635–641. [Google Scholar] [CrossRef]
  20. McKenna, E.; Higginson, S.; Hargreaves, T.; Chilvers, J.; Thomson, M. When activities connect: Sequencing, network analysis, and energy demand modelling in the United Kingdom. Energy Res. Soc. Sci. 2020, 69, 101572. [Google Scholar] [CrossRef]
  21. Satre-Meloy, A.; Diakonova, M.; Grünewald, P. Daily life and demand: An analysis of intra-day variations in residential electricity consumption with time-use data. Energy Effic. 2020, 13, 433–458. [Google Scholar] [CrossRef] [Green Version]
  22. Gram-Hanssen, K. New needs for better understanding of household’s energy consumption–behaviour, lifestyle or practices? Archit. Eng. Des. Manag. 2014, 10, 91–107. [Google Scholar] [CrossRef]
  23. Shove, E.; Walker, G. What is energy for? Social practice and energy demand. Theory Cult. Soc. 2014, 31, 41–58. [Google Scholar] [CrossRef] [Green Version]
  24. Warde, A. Consumption and theories of practice. J. Consum. Cult. 2005, 5, 131–153. [Google Scholar] [CrossRef]
  25. Southerton, D. Habits, routines and temporalities of consumption: From individual behaviours to the reproduction of everyday practices. Time Soc. 2013, 22, 335–355. [Google Scholar] [CrossRef]
  26. Friis, F.; Haunstrup Christensen, T. The challenge of time shifting energy demand practices: Insights from Denmark. Energy Res. Soc. Sci. 2016, 19, 124–133. [Google Scholar] [CrossRef]
  27. Gram-Hanssen, K. Understanding change and continuity in residential energy consumption. J. Consum. Cult. 2011, 11, 61–78. [Google Scholar] [CrossRef]
  28. Report, P. INSIGHT_E_Energy Poverty-Main Report. Available online: https://www.insightenergy.org (accessed on 15 April 2020).
  29. Legendre, B.; Ricci, O. Measuring fuel poverty in France: Which households are the most fuel vulnerable? Energy Econ. 2014, 49, 620–628. [Google Scholar] [CrossRef] [Green Version]
  30. Llera-Sastresa, E.; Scarpellini, S.; Rivera-Torres, P.; Aranda, J.; Zabalza-Bribián, I.; Aranda-Usón, A. Energy vulnerability composite index in social housing, from a household energy poverty perspective. Sustainability 2017, 9, 691. [Google Scholar] [CrossRef] [Green Version]
  31. White, L.V.; Sintov, N.D. Health and financial impacts of demand-side response measures differ across sociodemographic groups. Nat. Energy 2020, 5, 50–60. [Google Scholar] [CrossRef]
  32. Bouzarovski, S.; Petrova, S. A global perspective on domestic energy deprivation: Overcoming the energy poverty-fuel poverty binary. Energy Res. Soc. Sci. 2015, 10, 31–40. [Google Scholar] [CrossRef]
  33. González-Eguino, M. Energy poverty: An overview. Renew. Sustain. Energy Rev. 2015, 47, 377–385. [Google Scholar] [CrossRef]
  34. Petrova, S.; Gentile, M.; Bouzarovski, S.; Mäkinen, I.H. Perceptions of thermal comfort and housing quality:Exploring the microgeographies of energy poverty in Stakhanov, Ukraine. Environ. Plan. A 2013, 45, 1240–1257. [Google Scholar] [CrossRef]
  35. Barrella, R.; Priego, I.; Linares, J.I.; Arenas, E.; Romero, J.C.; Centeno, E. Feasibility study of a centralised electrically driven air source heat pump water heater to face energy poverty in block dwellings in Madrid. Energies 2020, 13, 2723. [Google Scholar] [CrossRef]
  36. Fell, M.J. Just flexibility? Nat. Energy 2020, 5, 6–7. [Google Scholar] [CrossRef]
  37. Bouzarovski, S.; Herrero, S.T.; Petrova, S.; Frankowski, J.; Matoušek, R.; Maltby, T. Multiple transformations: Theorizing energy vulnerability as a socio-spatial phenomenon. Geogr. Ann. Ser. B Hum. Geogr. 2017, 99, 20–41. [Google Scholar] [CrossRef] [Green Version]
  38. Bartiaux, F.; Maretti, M.; Cartone, A.; Biermann, P.; Krasteva, V. Sustainable energy transitions and social inequalities in energy access: A relational comparison of capabilities in three European countries. Glob. Transit. 2019, 1, 226–240. [Google Scholar] [CrossRef]
  39. Longo, D.; Olivieri, G.; Roversi, R.; Turci, G.; Turillazzi, B. Energy poverty and protection of vulnerable consumers overview of the EU funding programs FP7 and H2020 and future trends in horizon Europe. Energies 2020, 13, 1030. [Google Scholar] [CrossRef] [Green Version]
  40. Eurostat. Available online: https://ec.europa.eu/eurostat/statistics-explained/index.php/Electricity_price_statistics (accessed on 7 January 2020).
  41. Danish Utility Regulator National Report Denmark Status for 2017. Available online: https://forsyningstilsynet.dk/media/1217/h-2017-national-report.pdf (accessed on 25 January 2020).
  42. Burger, S.; Schneider, I.; Botterud, A.; Pérez-Arriaga, I. Fair, Equitable, and Efficient Tariffs in the Presence of Distributed Energy Resources; Academic Press: Cambridge, MA, USA, 2019; pp. 155–188. [Google Scholar] [CrossRef]
  43. European Parliament; Council of the EU. Directive (EU) 2019/944 on Common Rules for the Internal Market for Electricity and Amending Directive 2012/27/EU. Available online: https://eur-lex.europa.eu/eli/dir/2019/944/oj (accessed on 23 January 2020).
  44. Denmark, S.; Number, P.I.; Census, H.; Henle, T.; Matthews, G.J.; Harel, O. The danish system for access to micro data. Health Serv. Res. 2012, 1–15. [Google Scholar] [CrossRef]
  45. Henle, T.; Matthews, G.J.; Harel, O. Data confidentiality. In Methods in Health Services Research; Springer: Berlin/Heidelberg, Germany, 2018; pp. 1–15. [Google Scholar] [CrossRef]
  46. Mashhoodi, B.; Stead, D.; Van Timmeren, A. Spatial homogeneity and heterogeneity of energy poverty: A neglected dimension. Ann. GIS 2019, 25, 19–31. [Google Scholar] [CrossRef] [Green Version]
  47. Jain, A.K. Data clustering: 50 years beyond K-means. Pattern Recognit. Lett. 2010, 31, 651–666. [Google Scholar] [CrossRef]
  48. Lee, E.; Kim, J.; Jang, D. Load profile segmentation for effective residential demand response program: Method and evidence from Korean pilot study. Energies 2020, 16, 1348. [Google Scholar] [CrossRef] [Green Version]
  49. Cembranel, S.S.; Lezama, F.; Soares, J.; Ramos, S.; Gomes, A.; Vale, Z. A short review on data mining techniques for electricity customers characterization. In Proceedings of the 2019 IEEE PES GTD Grand International Conference and Exposition Asia (GTD Asia) 2019, Bangkok, Thailand, 20–23 March 2019; pp. 194–199. [Google Scholar] [CrossRef]
  50. Everitt, B.S.; Landau, S.; Leese, M.; Stahl, D. Cluster Analysis; John Wiley & Sons: Hoboken, NJ, USA, 2011. [Google Scholar]
  51. Xu, G.; Zong, Y.; Yang, Z. Applied Data Mining; CRC Press: Boca Raton, FL, USA, 2013. [Google Scholar]
  52. Piao, M.; Shon, H.S.; Lee, J.Y.; Ryu, K.H. Subspace projection method based clustering analysis in load profiling. IEEE Trans. Power Syst. 2014, 29, 1–8. [Google Scholar] [CrossRef]
  53. Tureczek, A.M.; Nielsen, P.S.; Madsen, H.; Brun, A. Clustering district heat exchange stations using smart meter consumption data. Energy Build. 2019, 182, 144–158. [Google Scholar] [CrossRef]
  54. Makles, A. Stata tip 110: How to get the optimal k-means cluster solution. Stata J. 2012, 12, 347–351. [Google Scholar] [CrossRef] [Green Version]
  55. Gram-Hanssen, K. Residential heat comfort practices: Understanding users. Build. Res. Inf. 2010, 38, 175–186. [Google Scholar] [CrossRef]
  56. Halkier, B.; Jensen, I. Doing “healthier” food in everyday life? A qualitative study of how Pakistani Danes handle nutritional communication. Crit. Public Health 2011, 21, 471–483. [Google Scholar] [CrossRef]
  57. Hansen, A.R. The social structure of heat consumption in Denmark: New interpretations from quantitative analysis. Energy Res. Soc. Sci. 2016, 11, 109–118. [Google Scholar] [CrossRef]
  58. Hansen, A.R. ‘Sticky’ energy practices: The impact of childhood and early adulthood experience on later energy consumption practices. Energy Res. Soc. Sci. 2018, 46, 125–139. [Google Scholar] [CrossRef]
  59. Flath, C.; Nicolay, D.; Conte, T.; Van Dinther, C.; Filipova-Neumann, L. Cluster analysis of smart metering data: An implementation in practice. Bus. Inf. Syst. Eng. 2012, 4, 31–39. [Google Scholar] [CrossRef]
  60. Torriti, J. Understanding the timing of energy demand through time use data: Time of the day dependence of social practices. Energy Res. Soc. Sci. 2017, 25, 37–47. [Google Scholar] [CrossRef]
  61. Richardson, I.; Thomson, M.; Infield, D.; Delahunty, A. Domestic lighting: A high-resolution energy demand model. Energy Build. 2009, 41, 781–789. [Google Scholar] [CrossRef] [Green Version]
  62. Halkier, B.; Katz-Gerro, T.; Martens, L. Applying practice theory to the study of consumption: Theoretical and methodological considerations. J. Consum. Cult. 2011, 11, 3–13. [Google Scholar] [CrossRef]
  63. Powells, G.; Fell, M.J. Flexibility capital and flexibility justice in smart energy systems. Energy Res. Soc. Sci. 2019, 54, 56–59. [Google Scholar] [CrossRef] [Green Version]
  64. The Commission for Energy Regulation. Electricity Smart Metering Customer Behaviour Trials (CBT) Findings Report. Available online: https://www.cru.ie/wp-content/uploads/2011/07/cer11080ai.pdf (accessed on 17 March 2020).
  65. Faruqui, A.; Sergici, S.; Akaba, L. The impact of dynamic pricing on residential and small commercial and industrial usage: New experimental evidence from Connecticut. Energy J. 2014, 35, 137–160. [Google Scholar] [CrossRef]
  66. Faruqui, A.; Sergici, S.; Akaba, L. Dynamic pricing of electricity for residential customers: The evidence from Michigan. Energy Effic. 2013, 6, 571–584. [Google Scholar] [CrossRef]
  67. Cappers, P.; Spurlock, C.A.; Todd, A.; Jin, L. Are vulnerable customers any different than their peers when exposed to critical peak pricing: Evidence from the U.S. Energy Policy 2018, 123, 421–432. [Google Scholar] [CrossRef] [Green Version]
  68. Nicholls, L.; Strengers, Y. Peak demand and the “family peak” period in Australia: Understanding practice (in) flexibility in households with children. Energy Res. Soc. Sci. 2015, 9, 116–124. [Google Scholar] [CrossRef]
  69. Faruqui, A.; Sergici, S.; Palmer, J. The impact of dynamic pricing on low income consumers: Evaluation of the IEE low income whitepaper. Rep. Md. Off. People’s Couns. 2010, 20–21. Available online: https://erranet.org/download/impact-dynamic-pricing-low-income-customers/# (accessed on 20 March 2020).
  70. Simshauser, P.; Downer, D. On the inequity of flat-rate electricity tariffs. Energy J. 2016, 37, 199–229. [Google Scholar] [CrossRef] [Green Version]
  71. Qiu, Y.; Colson, G.; Wetzstein, M.E. Risk preference and adverse selection for participation in time-of-use electricity pricing programs. Resour. Energy Econ. 2017, 47, 126–142. [Google Scholar] [CrossRef] [Green Version]
  72. Faruqui, A.; Hledik, R.; Palmer, J. Time-varying and dynamic rate design. Glob. Power Best Pract. Ser. 2012, 1–52. Available online: https://www.raponline.org/wp-content/uploads/2016/05/rap-faruquihledikpalmer-timevaryingdynamicratedesign-2012-jul-23.pdf (accessed on 15 February 2020).
  73. Hobman, E.V.; Frederiks, E.R.; Stenner, K.; Meikle, S. Uptake and usage of cost-reflective electricity pricing: Insights from psychology and behavioural economics. Renew. Sustain. Energy Rev. 2016, 57, 455–467. [Google Scholar] [CrossRef] [Green Version]
  74. Jessoe, K.; Rapson, D. Knowledge is (less) power: Experimental evidence from residential energy use. Am. Econ. Rev. 2014, 104, 1417–1438. [Google Scholar] [CrossRef] [Green Version]
  75. Alberini, A.; Khymych, O.; Šcasný, M. Response to extreme energy price changes: Evidence from Ukraine. Energy J. 2019, 40, 189–212. [Google Scholar] [CrossRef] [Green Version]
  76. Prest, B.C. Peaking interest: How awareness drives the effectiveness of time-of-use electricity pricing. J. Assoc. Environ. Resour. Econ. 2020, 7, 103–143. [Google Scholar] [CrossRef]
  77. Trotta, G. Electricity awareness and consumer demand for information. Int. J. Consum. Stud. 2020. [Google Scholar] [CrossRef]
  78. Nicolson, M.L. Using Behavioural Science to Increase Consumer Adoption of Time-of-Use Electricity Tariffs: Evidence from Survey and Field Experiments. 2018. Available online: https://discovery.ucl.ac.uk/id/eprint/10044460/ (accessed on 27 July 2020).
  79. Stella, H.; Phil, S. Moving forward with actin. Science 2004, 305, 1673n. [Google Scholar] [CrossRef]
  80. Hledik, R.; Gorman, W.; Fell, M.; Nicolson, M.; Huebner, G. The value of TOU tariffs in Great Britain: Insights for decision-makers. Citiz. Advice Final Rep. 2017, 1, 1–63. [Google Scholar]
  81. Lessem, N.; Faruqui, A.; Sergici, S.; Mountain, D. The impact of time-of-use rates in Ontario. Public Util. Fortn. 2017, 7. Available online: http://files.brattle.com/files/7305_the_impact_of_time_of_use_rates_in_ontario.pdf (accessed on 9 June 2020).
  82. Hansen, A.R. Heating homes: Understanding the impact of prices. Energy Policy 2018, 121, 138–151. [Google Scholar] [CrossRef]
  83. Pallesen, T.; Jenle, R.P. Organizing consumers for a decarbonized electricity system: Calculative agencies and user scripts in a Danish demonstration project. Energy Res. Soc. Sci. 2018, 38, 102–109. [Google Scholar] [CrossRef]
  84. Strengers, Y. Prices as instruments of demand management: Interpreting the signals. In Infrastructures in Practice: The Dynamics of Demand in Networked Societies; Taylor & Francis: Abingdon, UK, 2019; pp. 184–196. [Google Scholar]
  85. Christensen, T.H.; Friis, F.; Bettin, S.; Throndsen, W.; Ornetzeder, M.; Skjølsvold, T.M.; Ryghaug, M. The role of competences, engagement, and devices in configuring the impact of prices in energy demand response: Findings from three smart energy pilots with households. Energy Policy 2020, 137. [Google Scholar] [CrossRef]
  86. Gram-Hanssen, K.; Christensen, T.H.; Madsen, L.V.; Do Carmo, C. Sequence of practices in personal and societal rhythms—Showering as a case. Time Soc. 2020, 29, 256–281. [Google Scholar] [CrossRef]
  87. Gram-Hanssen, K.; Hansen, A.R.; Mechlenborg, M. Danish PV prosumers’ time-shifting of energy-consuming everyday practices. Sustainability 2020, 12, 4121. [Google Scholar] [CrossRef]
  88. Katz, J.; Kitzing, L.; Schröder, S.T.; Andersen, F.M.; Morthorst, P.E.; Stryg, M. Household electricity consumers’ incentive to choose dynamic pricing under different taxation schemes. Wiley Interdiscip. Rev. Energy Environ. 2018, 7. [Google Scholar] [CrossRef] [Green Version]
  89. Insight New Ambitious Danish Energy Agreement Secured. Available online: https://investindk.com/insights/new-ambitious-danish-energy-agreement (accessed on 27 May 2020).
  90. Halkier, B. Easy eating? Negotiating convenience food in media food practices. Mak. Sense Consum. 2013, 119–136. Available online: https://forskning.ruc.dk/files/64476845/gupea_2077_34508_3.pdf#page=120 (accessed on 1 June 2020).
  91. Faruqui, A.; Sergici, S. Arcturus: International evidence on dynamic pricing. Electr. J. 2013, 26, 55–65. [Google Scholar] [CrossRef]
  92. Faruqui, A.; Bourbonnais, C. The tariffs of tomorrow. IEEE Power Energy Mag. 2020, 18, 18–25. [Google Scholar] [CrossRef]
  93. Shipworth, M.; Firth, S.K.; Gentry, M.I.; Wright, A.J.; Shipworth, D.T.; Lomas, K.J. Central heating thermostat settings and timing: Building demographics. Build. Res. Inf. 2010, 38, 50–69. [Google Scholar] [CrossRef] [Green Version]
  94. IEA. Energy Policies of IEA countries—Denmark 2011; OECD Publishing: Paris, France, 2012. [Google Scholar]
  95. Centre for Energy Efficiency Denmark’s National Energy Efficiency Action Plan (NEEAP). Available online: https://ec.europa.eu/energy/sites/ener/files/dk_neeap_2017_en.pdf (accessed on 26 February 2020).
  96. Trotta, G.; Spangenberg, J.; Lorek, S. Energy efficiency in the residential sector: Identification of promising policy instruments and private initiatives among selected European countries. Energy Effic. 2018, 11. [Google Scholar] [CrossRef]
  97. Alberini, A.; Bigano, A.; Boeri, M. Looking for free riding: Energy efficiency incentives and Italian homeowners. Energy Effic. 2014, 7, 571–590. [Google Scholar] [CrossRef] [Green Version]
  98. Trotta, G. The determinants of energy efficient retrofit investments in the English residential sector. Energy Policy 2018, 120. [Google Scholar] [CrossRef]
  99. Poortinga, W.; Jiang, S.; Grey, C.; Tweed, C. Impacts of energy-efficiency investments on internal conditions in low-income households. Build. Res. Inf. 2018, 46, 653–667. [Google Scholar] [CrossRef]
  100. Trotta, G. Factors affecting energy-saving behaviours and energy efficiency investments in British households. Energy Policy 2018, 114. [Google Scholar] [CrossRef]
  101. Best, R.; Burke, P.J. Factors Contributing to energy-related financial stress in Australia. Econ. Rec. 2019, 95, 462–479. [Google Scholar] [CrossRef] [Green Version]
  102. Longhurst, N.; Hargreaves, T. Emotions and fuel poverty: The lived experience of social housing tenants in the United Kingdom. Energy Res. Soc. Sci. 2019, 56, 101207. [Google Scholar] [CrossRef]
Figure 1. (a) within sum of squares (WSS), (b) log (WSS), (c) η 2 , and (d) proportional reduction of error (PRE) for all K cluster solutions.
Energies 13 04713 g001
Figure 2. Annual average electricity consumption patterns (kWh) by the hours of the day of the four clusters.
Energies 13 04713 g002
Figure 3. Seasonal average electricity consumption (kWh) by the hours of the weekdays and weekends for the four clusters.
Energies 13 04713 g003
Table 1. Descriptive statistics.
VariablesSampleHourly Electricity Consumption (kWh)Daily Electricity Consumption (kWh)
NMeanStd DevMinMaxMean
Full sample *15,4880.3620.45703.118.6
Single-person households6345 (41%)0.2530.35503.116.12
Single-person households; over 65 years old2680 (17.3%)0.2510.34303.116.06
Single-person households; over 65 years old; lowest income quintile1297 (8.37%)0.2390.33803.115.76
Single-person households; over 65 years old; lowest income quintile; outside the workforce1287 (8.3%)0.2380.33703.115.74
Single-person households; over 65 years old; lowest income quintile; outside the workforce; single-family detached house372 (2.4%)0.3640.44303.118.79
Single-person households; over 65 years old; lowest income quintile; outside the workforce; single-family detached house; built before 1972293 (1.89%)0.3510.42403.118.47
Single-person households; over 65 years old; lowest income quintile; outside the workforce; single-family detached house; built before 1972; floor area between 100 and 200 m2196 (1.27%)0.3330.403.118.05
Single-person households; over 65 years old; lowest income quintile; outside the workforce; single-family detached house; built before 1972; floor area between 100 and 200 m2; owned dwelling156 (1%)0.3340.40703.118.07
Single-person households; over 65 years old; lowest income quintile; outside the workforce; single-family detached house; built before 1972; floor area between 100 and 200 m2; owned dwelling; heating system powered by other sources than electricity137 (0.88%)0.2780.29903.116.7
Final sample: Single-person households; over 65 years old; lowest income quintile; outside the workforce; single-family detached house; built before 1972; floor area between 100 and 200 m2; owned dwelling; heating system powered by other sources than electricity; Region of Southern Denmark67 (0.43%)0.2790.2703.116.7
* Accounting for data-entry errors and missing information. Farmhouses excluded; 19,734 Danish households were in the original sample.
Table 2. Annual average base consumption (kWh), average consumption (kWh), and average peak consumption (kWh) of the four clusters.
Cluster (K)Average Base Consumption (kWh)Average Consumption (kWh)Average Peak Consumption (kWh)
10.10.170.28
20.180.290.46
30.260.360.48
40.340.510.8
Table 3. Daily average electricity consumption (kWh) by season, weekdays, and weekends for the four clusters.
Cluster (K)Winter (Weekdays)Winter (Weekends)Spring (Weekdays)Spring (Weekends)Summer (Weekdays)Summer (Weekends)Autumn (Weekdays)Autumn (Weekends)
14.64.673.994.13.843.814.324.28
27.667.796.656.665.795.77.257.29
310.410.687.888.017.317.138.78.88
416.4816.8811.1711.529.359.3411.3211.88

