Article

Pore-Scale Analysis of Condensate Blockage Mitigation by Wettability Alteration

by
Paula K. P. Reis
and
Marcio S. Carvalho
*
Department of Mechanical Engineering, Pontifícia Universidade Católica do Rio de Janeiro, Rio de Janeiro-RJ 22451-900, Brazil
*
Author to whom correspondence should be addressed.
Energies 2020, 13(18), 4673; https://doi.org/10.3390/en13184673
Submission received: 31 July 2020 / Revised: 27 August 2020 / Accepted: 3 September 2020 / Published: 8 September 2020
(This article belongs to the Special Issue Advances in Enhanced Oil and Gas Recovery)

Abstract

:
Liquid banking in the near wellbore region can lessen significantly the production from gas reservoirs. As reservoir rocks commonly consist of liquid-wet porous media, they are prone to liquid trapping following well liquid invasion and/or condensate dropout in gas-condensate systems. For this reason, wettability alteration from liquid to gas-wet has been investigated in the past two decades as a permanent gas flow enhancement solution. Numerous experiments suggest flow improvement for immiscible gas-liquid flow in wettability altered cores. However, due to experimental limitations, few studies evaluate the method’s performance for condensing flows, typical of gas-condensate reservoirs. In this context, we present a compositional pore-network model for gas-condensate flow under variable wetting conditions. Different condensate modes and flow patterns based on experimental observations were implemented in the model so that the effects of wettability on condensing flow were represented. Flow analyses under several thermodynamic conditions and flow rates in a sandstone based network were conducted to determine the parameters affecting condensate blockage mitigation by wettability alteration. Relative permeability curves and impacts factors were calculated for gas flowing velocities between 7.5 and 150 m/day, contact angles between 45 ° and 135 ° , and condensate saturations up to 35%. Significantly different relative permeability curves were obtained for contrasting wettability media and impact factors below one were found at low flowing velocities in preferentially gas-wet cases. Results exhibited similar trends observed in coreflooding experiments and windows of optimal flow enhancement through wettability alteration were identified.

Graphical Abstract

1. Introduction

Liquid accumulation around producing wells is one of the main causes of productivity decline in gas reservoirs [1,2]. As reservoir rocks tend to be strongly liquid-wet [3], the liquid phase exhibits relatively low mobility in gas-liquid flows, leading to liquid buildup. Commonly, two scenarios induce liquid accumulation in the near wellbore region: fluid invasion during drilling and completion operations [1,4] and condensate dropout in gas-condensate reservoirs [5,6]. In the latter, liquid accumulation unfolds during reservoir depletion, when the bottom whole pressure becomes lower than the produced fluid dew point. In both cases, production may be significantly reduced and compromise profitability.
Several methods of removing/preventing liquid banks around producing wells have been proposed in the literature. Removal of stagnant liquid can be achieved through solvent injection [6,7,8], which seeks the reduction of interfacial tension between gas and liquid. With this procedure, the capillary pressure between the phases becomes lower, reducing the pressure gradient required for liquid mobilization. Another method involves the injection of gas to alter the near wellbore fluids phase behavior and re-evaporate the liquid bank [2,7,8]. While both approaches have proved effective, the positive outcome is temporary, as the treated porous medium is still prone to liquid accumulation.
Alternatively, liquid accumulation could be prevented by altering the reservoir rock wettability to intermediate or preferential gas-wet. Reducing the tendency of liquid to spread on the rock porous surface could lessen liquid accumulation during condensate dropout and prevent drilling and completion fluids imbibition. In the past two decades, plentiful research effort has been directed to developing gas wettability inducing chemicals and testing their suitability for application in reservoir rocks [9,10,11]. Strong indications of improved gas-liquid flow performance have been reported [12,13,14], with minimal impact on the porous medium absolute permeability [15,16], effectiveness at high temperatures [17,18,19] and permanent results [3,20].
Works investigating the effects of wettability change on gas-liquid flow in porous media conventionally resort to spontaneous imbibition and forced flow in cores, using water/oil as the liquid phase and air as the gaseous phase. While these experiments may be adequate to analyze the tendency of well fluid invasion in the reservoir, they do not represent properly condensate dropout and accumulation [21]. The flow of gas and condensate in porous media and its dependency on parameters like flow rate, phases properties and wettability have been proved to be fundamentally different from that observed in conventional two-phase flow systems [22]. The spatial distribution of liquid and gas in porous media obtained from condensation is greatly different than the ones obtained via drainage/imbibition processes, as it is a function not only of the local pressure gradient but also of the local pressure and temperature. Additionally, a dependency of gas and condensate relative permeabilities on flow rate and interfacial tension, not observed in conventional systems, has been extensively reported in the literature [22,23,24,25]. Only a few studies include flooding experiments in wettability altered cores using model fluids that flash into two phases under experimental conditions [1,16,21,26,27]. Their results suggest that the beneficial effects of wettability alteration on gas-condensate flow in porous media are dependent on interfacial tension and flow rate. Hence, generating data regarding condensation and two-phase flow under reservoir conditions is essential for predicting the outcome of wettability alteration for condensate blockage prevention.
With this purpose, pore scale modeling techniques could be employed, as a way of avoiding flow experiments of complex fluids under high pressure and high temperature conditions. Numerous pore network models (PNMs) for gas-condensate flow in strongly liquid-wet media have been proposed to date [22,28,29,30,31]. Among these, only Li et al. [28] presented an analysis of the effect of wettability on critical condensate saturation ( S c c ) and relative permeability curves, by altering the contact angle from 0° to 85°. They noticed a significant increase in the relative permeability of both phases and reduced S c c , when switching from strongly liquid-wet to intermediate gas-wet. Their model, however, employs a very simplistic condensation mechanism, based solely on a pore throat radius threshold, and unrealistic phases configuration in the porous medium, without the formation of wetting films. Other PNMs of gas-liquid flow in gas-wet media have been proposed for evaluating CO2 storage in aquifers [32], slow evaporation in 2D porous media [33,34], water transport in gas diffusion layers of polymer electrolyte fuel cells [35,36] and liquid blocking in tight reservoirs [37,38]. None of these models is suitable for representing condensate dropout and gas-condensate flow in the near wellbore region, since the transition from single-phase to two phase flow due to condensation is not assessed.
Developing such a model relies on the identification of physical phenomena involved in phase change and two-phase flow in gas-wet microchannels. Yet, the impact of wall hydrophobicity on condensation flow has received very little attention in the literature [39]. Chen and Cheng [40] investigated condensation of steam in silicon microchannels. They observed droplet condensation at hydrophobic channel walls, followed by droplet coalescence and blockage of the channel. Formed liquid slugs were then advected by vapor, developing an intermittent flow. Similarly, Fang et al. [39] studied steam condensation on microchannels with different hydrophobicity degrees. They observed dropwise condensation on hydrophobic walls, while hydrophilic microchannels were covered by a stable thin liquid film during phase change. As condensation on gas-wet walls progressed, liquid droplets either grew enough to be dragged by the gas flow or, more commonly, were swept by bigger liquid slugs moving from upstream. Cubaud et al. [41] analyzed two-phase flow in microchannels with surface modifications and verified that liquid-gas flows in hydrophobic channels were very different than the ones observed in hydrophilic channels. In gas-wet channels, both phases flowed in slugs that spanned the entire cross section of the channels, exhibiting the same superficial velocity. Liquid films were absent during flow in hydrophobic channel walls, regardless of the observed void fraction. Wu and Djilali [42] investigated water droplet dynamics in a hydrophobic air flowing microchannel. It was identified that, at a low Reynolds number ( R e 60 ) airflow, drag force on water droplets is minimal, allowing droplets to grow until the channel is obstructed and subsequently be convected by airflow. Santos and Kawaji [43] investigated numerically wetting effects in microfluidic slug flow. They verified that the significant velocity slip developed in hydrophilic microchannels [44,45,46] is absent when the channel walls are hydrophobic, since gas slugs fill the channel cross section.
Based on these analyses, the present work aims to develop a pore network model to evaluate wettability alteration as a condensate banking prevention method. By assigning different flow patterns according to wettability, we expanded the compositional model presented by Reis and Carvalho [47] to encompass condensation and two-phase flow in intermediate and preferential gas-wet media. The flow of a gas-condensate representative fluid at different gas velocities, wetting, and thermodynamic conditions was assessed with the proposed model. For all flow analyses conducted, low Reynolds number flow and local thermodynamic equilibrium at each time step were assumed. The results show the dependency of flow enhancement via wettability alteration on flow conditions and determine the conditions at which wettability alteration has a positive effect on hydrocarbon recovery.

2. Pore-Network Model

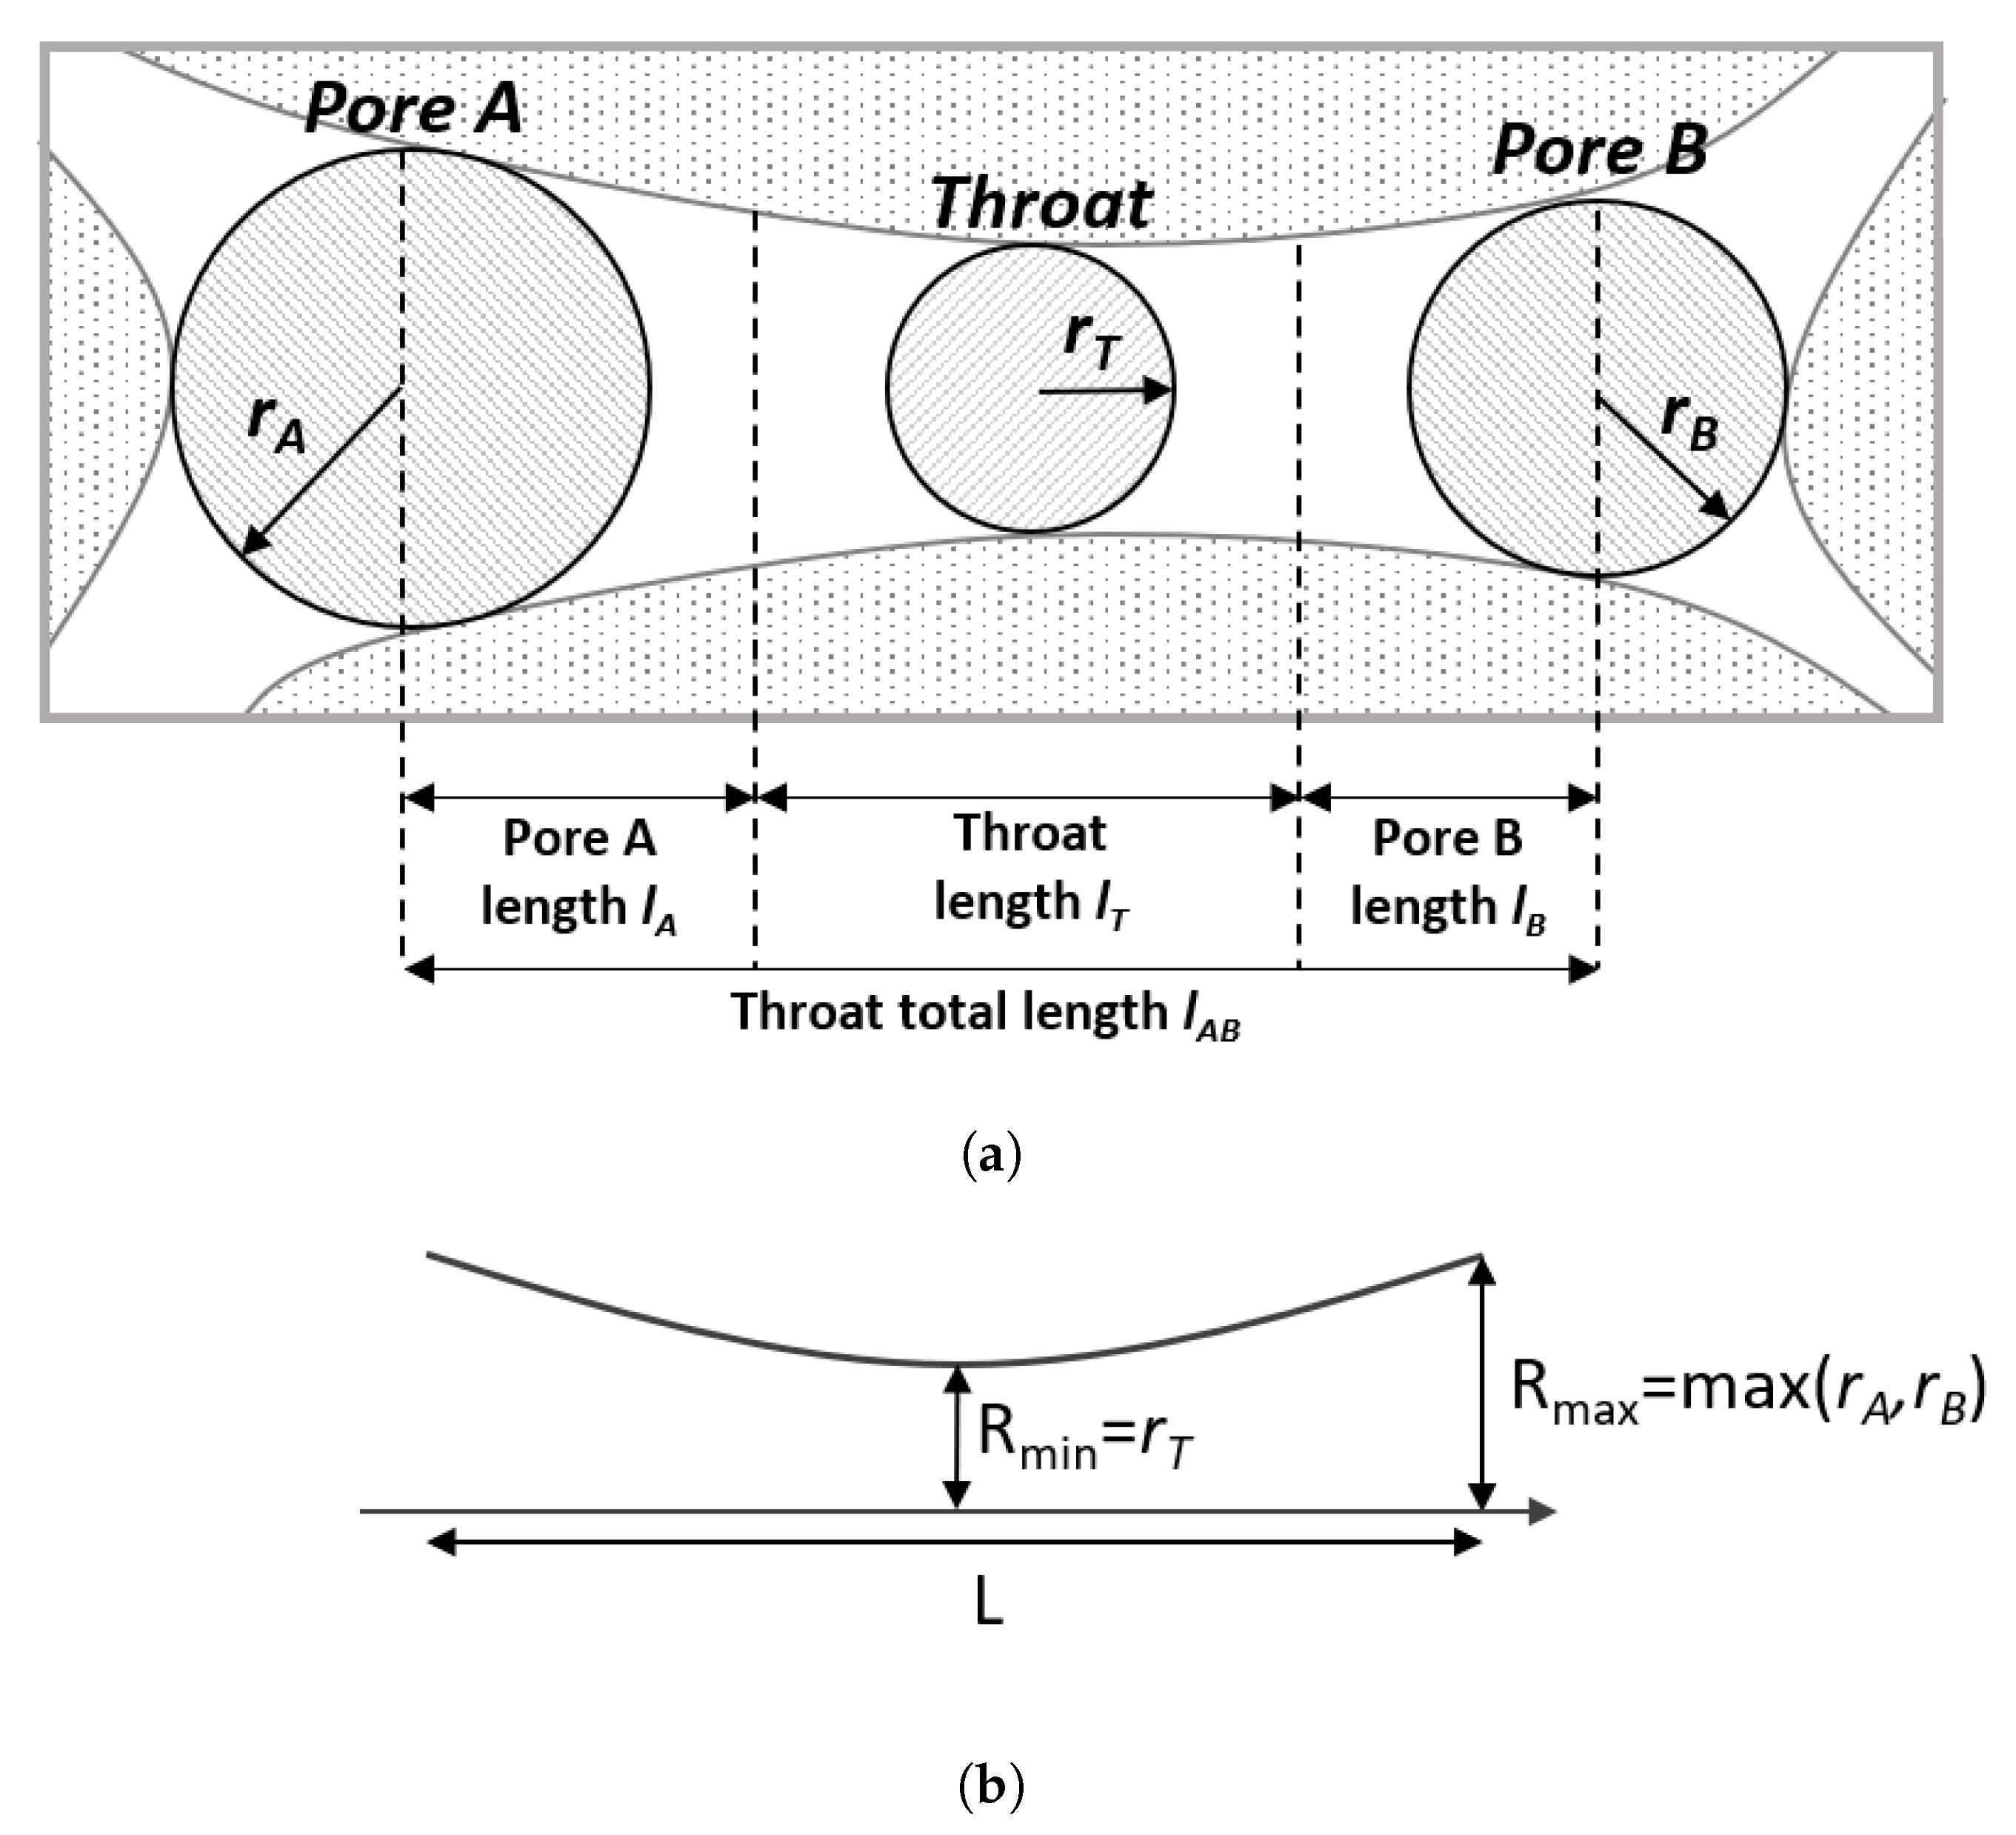
2.1. Pore-Network Geometry

Pore-networks consist of pore bodies connected by pore throats. In the proposed model, 3D pore-networks are used, with pore bodies identified by the index i and pore throats identified by the index j. Pore throats are represented by converging-diverging circular capillaries with hyperbolic profile, as expressed in Equation (1), where L j represents the capillary length, R m i n , j the radius at the constriction ( x = 0 ) and R m a x , j the maximum radius, at x = ± L / 2 . Pore bodies are characterized by the control volume encasing the capillary intersections and half of the capillary lengths, as illustrated in Figure 1.
r j ( x ) = a j + b j x 2 a j = R m i n , j 2 b j = 2 L j 2 ( R m a x , j 2 R m i n , j 2 )
The spatial distribution of pores bodies and throats can be defined based on 3D pore-scale imaging of real rock samples, which leads to irregular networks with variable capillary lengths and coordination numbers (number of capillaries connected to each pore). In the absence of pore-scale imaging, 3D regular lattices with realistic coordination number, capillary length, pore body, and pore throat size distributions can be used to represent porous media. For the results presented in Section 3, the network was based on micro-CT imaging of a sandstone sample [48]. More details of the used network are presented in Section 3.1.
The connectivity between pore bodies and pore throats is mapped by an incidence matrix C, with elements defined as:
c i j = 0 , if the pore throat j is not connected to the pore body i 1 , if the pore throat j enters the pore body i + 1 , if the pore throat j exits the pore body i

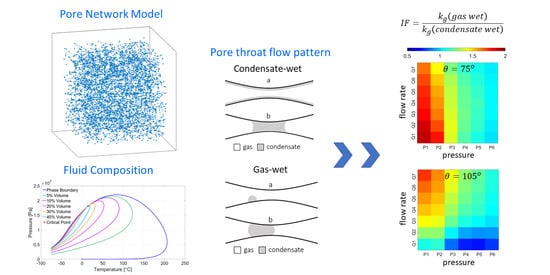
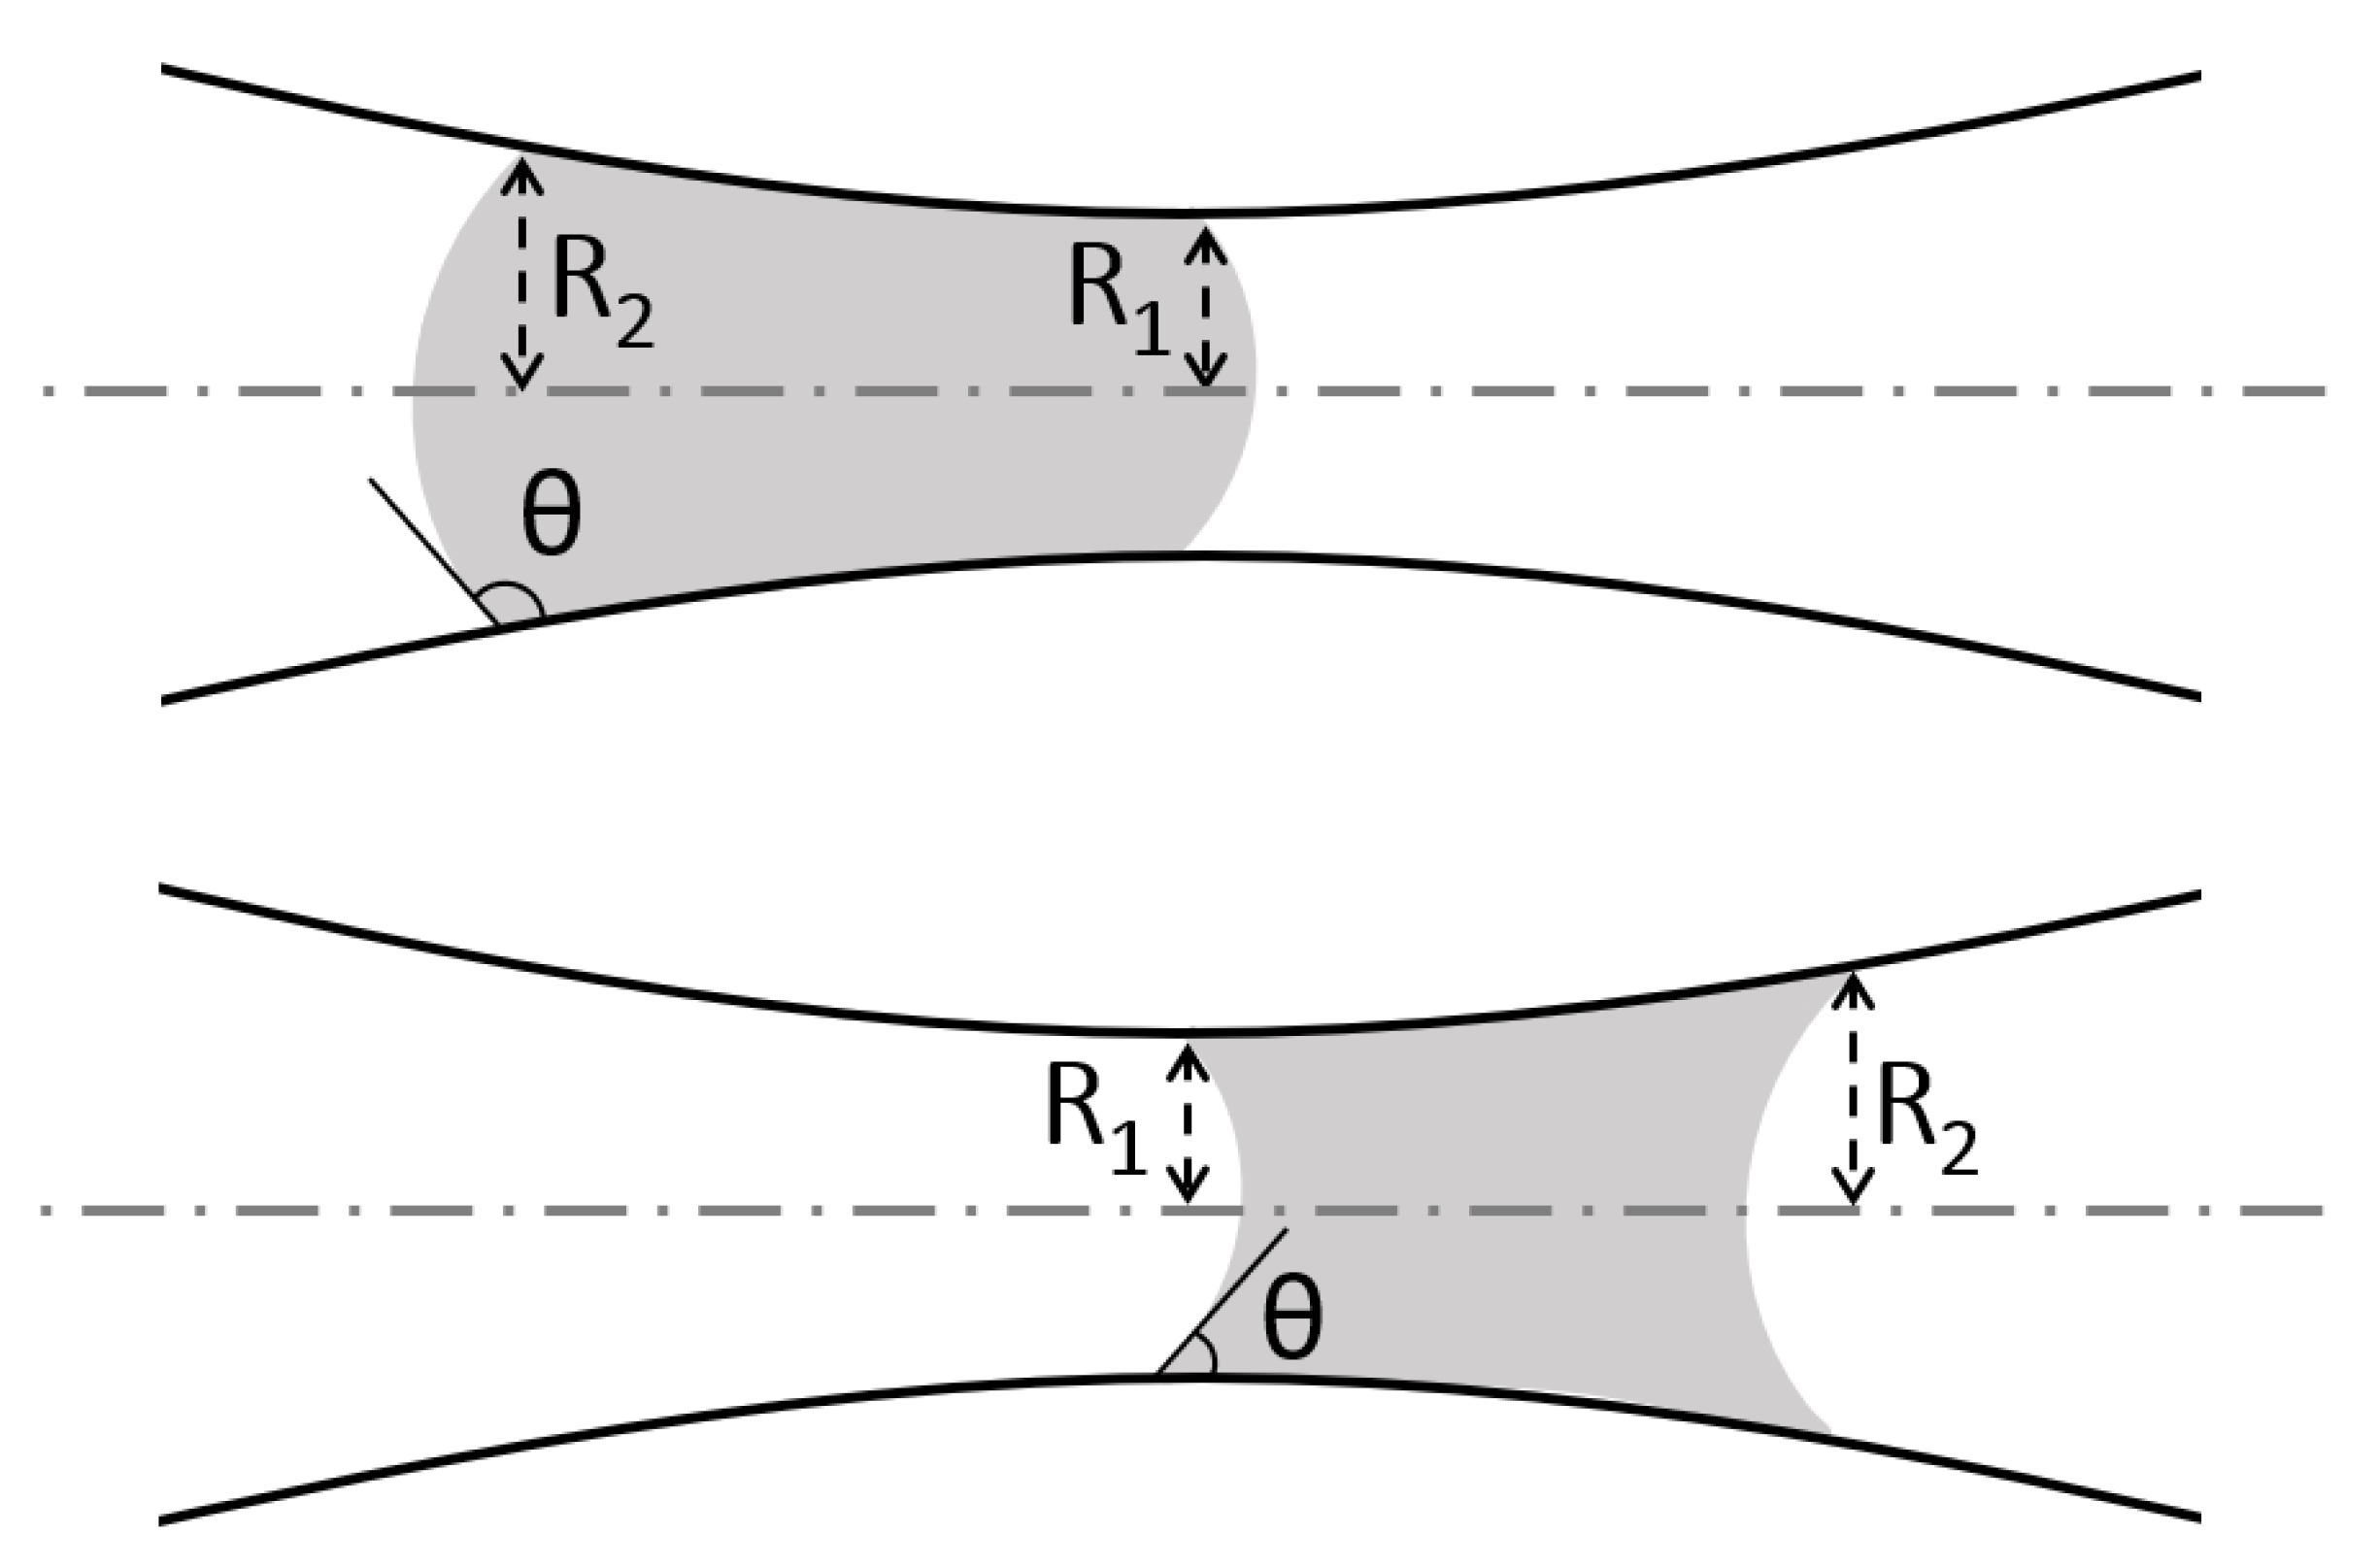
2.2. Two-Phase Flow Patterns

Different condensation modes and two-phase flow patterns were implemented in the model to incorporate wettability alteration effects. In liquid-wet porous media, filmwise condensation is assumed. Hence, at pressures below the dew point, condensate spreads on capillary walls forming a film and the two phases flow in annular configuration, as illustrated in Figure 2a. Depending on local saturation levels and capillary geometry, this liquid film may become unstable, leading to the formation of a liquid bridge at the capillary midsection, in a phenomenon known as snap-off (Figure 2b). In this case, if capillary forces overcome the pressure difference, the flow of both phases is interrupted. Otherwise, if the pressure drop in the capillary is high enough, the condensate bridge is mobilized and the flow is reestablished.
The criteria for snap-off implemented in pore-network models are normally very simplified [30,31,47,49] so that compositional efforts are reduced. Fang et al. [49] simply considered that every capillary with radius equal or inferior than 20 μ m was occupied by a condensate bridge. Bustos and Toledo [30] proposed a model with square capillaries in which the condensate accumulation was initiated at capillary corners and bridges were formed at condensate saturations greater than 21.4%. This value represents the condensate saturation at which the contact between the gas phase and the throat walls is lost. The same criterion was adopted by Momeni et al. [31]. In our model, it was considered that a condensate bridge is formed when a critical condensate film thickness, proportional to the constriction radius of each capillary, is reached. For t c r i t = 0.25 R m i n , (which will be adopted in the analyses presented in this paper) the condensate saturations at which the snap-off occurs vary from ≈1%, for capillaries with very high R m a x / R m i n ratio, to 43.75 % , for unconstricted capillaries. This interval is consistent with the values presented in the literature [30,31]. Furthermore, for the snap-off to happen, the geometry controlled condition for fluid break-up in constricted capillaries proposed by Beresnev et al. [50] has to be met.
In gas-wet media, dropwise condensation is presumed, as depicted in Figure 3a. Due to the lack of affinity between solid walls and liquid, dropped out condensate is collected at droplets that do not spread to establish a film. Furthermore, since the drag force exerted by the gas flow is insignificant at low Reynolds numbers [42], they do not flow. As the liquid saturation increases, droplets grow and form liquid slugs (Figure 3b) which are either advected by the gas, developing a slug flow pattern, or block the flow through the capillary, if the pressure difference is not high enough to overcome the capillary pressure.
Regardless of wettability, once a liquid slug spanning the entire capillary cross-section is formed, the critical interface pressure drop value for it to be unobstructed is given by Equation (2). It is a function of the interfacial tension, σ , the contact angle, θ , and the radii of the condensate bridge menisci, R 1 and R 2 . The radii are related to the capillary geometry and the condensate saturation, as depicted in Figure 4.
Δ P i n t = 2 σ cos θ 1 R 1 1 R 2
Once the flow patterns for the capillaries have been defined, hydraulic conductances for gas and condensate are used to calculate the volumetric flow rates between the pores bodies. The conductances are defined as g n = q n / Δ P , where q n is the volumetric flow rate for phase n and Δ P is the pressure drop in the capillary. When a condensate slug is located at a capillary, Δ P i n t should be subtracted from Δ P for flow rate calculation. As for the pore bodies, it is considered that they exhibit infinite conductances, thus not contributing to the network pressure drop.
To the best of our knowledge, this is the first pore-network model for thermodynamically consistent condensation flow that takes into account the effect of wettability on flow patterns. The implemented flow patterns are consistent with experiments involving two-phase flow visualization in hydrophilic [44,45,46] and hydrophobic [39,40,41,42] microchannels. With this approach, we aim to provide insightful results for the design of wettability altering treatments for gas-condensate reservoirs. Gas-wet behavior will be assigned to contact angles θ 90 ° and liquid-wet behavior to θ < 90 ° . Implementing a transitional behavior for neutral wettability [40] could potentially further improve the results and should be considered for future work.

2.2.1. Conductances for Gas and Condensate Flow in Liquid-Wet Media

For the annular flow pattern arisen in liquid-wet capillaries, the conductances for the gas and liquid are given by Equation (3) [51].
g g a f = π 8 μ g L ( S g R 2 ) 2 + π 4 μ l L ( R 2 S g R 2 ) S g R 2 g l a f = π 8 μ l L ( R 2 S g R 2 ) 2
where, μ g and μ l are the viscosities of the gas and liquid phases, S g is the gas saturation and R and L are, respectively, the equivalent radius and length of the capillary.
These conductances, devised for straight channels, were adapted for converging-diverging capillaries by defining an equivalent radius for each capillary in the network [47]. For capillaries with hyperbolic profile, the equivalent radius is calculated with Equation (4) [52].
R = 2 R m i n 3 R m a x 2 R m a x 2 R m i n 2 R m i n R m a x 2 R m i n 2 + R m a x 2 arctan R m a x 2 R m i n 2 R m i n 2 1 / 4

2.2.2. Conductances for Gas and Condensate Flow in Gas-Wet Media

It is assumed that slug flow in gas-wet capillaries is established at any non-null value of condensate saturation, i.e., slugs are formed at early condensation stages, where S g 1 . The conductances for this flow pattern were calculated based on the pressure drop model proposed by Kashid and Agar [53]. Their model, presented in Equation (5), was developed for slug flow in a cylindrical microchannel in the absence of wetting films.
Δ P s f = 8 v μ w α R 2 L l u + 8 v μ n w ( 1 α ) R 2 L l u + Δ P i n t 2 L l u l u
where v is the flow superficial velocity, μ w and μ n w are the viscosities of the wetting and non-wetting phases, α is the wetting phase fraction, l u is the slug unit length, L is the capillary total length, R is the capillary radius and Δ P i n t is the interface pressure drop.
Using Equations (2), (4) and (5), and considering that only one liquid slug occupies a capillary at a time ( l u = L ), the conductances for gas and liquid during slug flow are given by Equation (6).
g g s f = π R 4 8 L S g S g ( μ g μ l ) + μ l g l s f = π R 4 8 L 1 S g S g ( μ g μ l ) + μ l

2.3. Governing Equations

In the proposed model, the pressure and fluid content of each pore body are related by a system of equations comprising molar balance Equations (Section 2.3.1), volume consistency Equations (Section 2.3.2) and the appropriate boundary conditions (Section 2.3.3). This system is solved with the Newton–Raphson method at each time step and, for each Newton iteration, a PT flash (phase equilibrium calculation of a mixture with known composition at constant pressure and temperature) based on the Peng and Robinson [54] equation of state is performed for each pore body so that gas and liquid properties are updated. Details of the non-linear system solution and phase equilibrium calculations used in our model are described by Santos and Carvalho [51].

2.3.1. Molar Balance Equation

The number of moles in a pore body can vary due to the molar flow rate through its adjacent pore throats, n ˙ j k , and the flow at the network boundaries, s ˙ i k , as shown in Equation (7). The molar flow in a capillary, given by Equation (8), converts the volumetric flow, calculated with the conductances and the pressure drop, into the molar flow, using the molar fraction of each component in the gas and liquid phases, y k and x k , and their molar densities, ξ g and ξ l . Equation (9) represents the pressure that drives the flow through the capillaries. The inclusion of the interface pressure difference in Equation (9) is controlled by the parameter H i n t , which indicates the presence of a liquid slug in a capillary. In Equations (7)–(9), i = 1 n b , j = 1 n t , and k = 1 n c , represent, respectively, the number of pore bodies, pore throats and fluid mixture components in a network.
N i k t = j = 1 n t c i j n ˙ j k + s ˙ i k
n ˙ j k = ( y k ξ g g g + x k ξ l g l ) j Δ P j
Δ P j = m = 1 n b c m j P m H j i n t Δ P j i n t

2.3.2. Volume Consistency Equation

Considering the network slightly compressible, the volume of a pore body can be approximated by Equation (10), where ν i = 1 V i V i P i is the pore compressibility, and V i ¯ and P i ¯ are reference volume and pressure levels. For consistency, this volume has to match the volume of the gas and liquid contained in the pore, V i = V i g + V i l .
Gas and liquid volumes can be determined by relating P i and T with the fluid parameters L i , Z i g , Z i l , x i k and y i k (respectively: the fraction of the N i moles in the liquid phase, the compressibility factors and the molar fractions of each component k in the gas and liquid phases), as presented in Equation (11). By combining Equations (10) and (11), the volume consistency equation, given by Equation (12), is obtained.
V i V i ¯ [ 1 + ν i ¯ ( P i P ¯ ) ]
V i = N i L i Z i l R T P i k = 1 n c υ k x i k + ( 1 L i ) Z i g R T P i k = 1 n c υ k y i k
N i V i ¯ [ 1 + ν i ¯ ( P i P ¯ ) ] L i Z i l R T P i k = 1 n c υ k x i k + ( 1 L i ) Z i g R T P i k = 1 n c υ k y i k = 0

2.3.3. Boundary Conditions

In our model, the flow through the networks may be driven by imposing different pressure levels at the inlet and the outlet, or by prescribing molar flow rate at the inlet and pressure at the outlet. Other parameters that have to be imposed are the composition of the fluid injected in the network and the temperature.

2.4. Model Validation

Validation of the proposed model for liquid-wet media can be found in Reis and Carvalho [47]. In this work, low Reynolds number flow and local thermodynamic equilibrium within each node at each time step were assumed. Coreflooding experiments involving a Berea sandstone core and a binary mixture of C 1 n C 4 were reproduced with the model at different thermodynamic conditions. At interfacial tension values of 0.015 and 0.037 mNm−1 and gas flowing velocities of 9, 18, and 36 m/day, the model presented good quantitative agreement with experimental data. These conditions are consistent with the near wellbore region. For a distance of 3–5 m from the wellbore, a flow velocity of 35.2 m/day is reported for a typical North Sea gas-condensate reservoir [23]. This flow velocity is also consistent with the laminar flow assumption adopted to devise gas and condensate conductances. For a capillary radius of 10 μ m, a viscosity of 3×10⁻⁵ Pa · s and a density of 300 kg/m3 (typical for-gas condensate systems), the corresponding Reynolds number is 0.0815 , within the laminar flow regime and Darcy equation validity range.

3. Results

3.1. Pore-Network Description

A pore-network representing a sandstone was used to generate the presented results. It was adapted from a network presented by Dong [48], based on micro-CT imaging of a sandstone sample (Figure 5a). This network, shown in Figure 5b, has a permeability of 169 mD, a porosity of 17.1 % , and a total volume of 2.67 mm3. A cubic subsection of 1.75 mm3 from the original network was selected, as shown in Figure 5b,c, in order to reduce the computational effort of the flow analyses. In the excerpt from original network, pore body radii and spatial coordinates were maintained, and pore throat radii were used as the R m i n of the adapted network, as indicated in Figure 6. For the definition of R m a x , the radius of the largest pore body connected to each pore throat was used. Pore throat lengths were set to match the original network porosity and permeability. Histograms of resulting R m i n and R m a x are shown in Figure 7.

3.2. Fluid

The composition of the fluid mixture used in the flow analyses is presented in Table 1. We devised this composition to represent a typical mixture found in gas-condensate reservoirs, composed by carbon dioxide, light, intermediate and heavy hydrocarbons. This mixture exhibits retrograde condensation behavior in the temperature range from 15 ° C to 207 ° C, as shown in the phase diagram in Figure 8, obtained with the CMG software Winprop.

3.3. Flow Conditions

In all cases analyzed here, the prescribed boundary conditions were molar flow rate at the network inlet and pressure at the outlet. Different flow rates were used so that gas velocities from 7.5 m/day to 150 m/day were achieved in the networks. The positive effect of velocity on gas-condensate flow has been widely reported in the literature [5,22,25,56,57] for strongly liquid-wet media. By analyzing a wide range of gas flow velocities, we intend to evaluate whether wettability influences the flow rate effect on flow performance.
For each studied flow velocity, different levels of liquid saturation were obtained by changing the pressure at the network outlet. At the temperature of 80 ° C, chosen for the presented analyses, the fluid properties are presented in Table 2. The phases viscosities were calculated with the Lohrenz et al. [58] correlation, while the interfacial tension was calculated with the Weinaug and Katz [59] correlation.
The effect of wettability alteration was assessed by performing all flow analyses with variable contact angle values. For the evaluation of flow in a rock sample with unaltered wettability and perfectly wetted by the liquid phase, θ = 0 ° was used. For wettability altered media, the contact angle range of 45 ° θ 135 ° was explored.
Local Reynolds numbers were calculated for all flow conditions and varied between 2.25 × 10 2 and 4.5 × 10 1 . Therefore, even at the highest tested gas flow velocity, inertial effects are not significant.

3.4. Relative Permeability Curves

Relative permeabilities were calculated with Darcy equation for the flow conditions presented in Section 3.3 under steady-state flow conditions. Figure 9a–c show the relative permeability curves obtained with different contact angles at gas velocities of 7.5 m/day, 45 m/day and 150 m/day, respectively.
Very distinct curves were obtained for flow at contrasting wettability porous media, due to the different condensation modes and flow patterns attributed to gas and liquid-wet cases. For 0 ° θ < 90 ° , which corresponds to preferentially liquid-wet media, condensate accumulation occurs. In these cases, the liquid tends to flow adjacent to pore walls, while the gas flows in channel cores. As a consequence, a significant velocity slip is developed between the phases and liquid saturation builds up. This effect is noticeable in Figure 9: while the maximum liquid dropout for the flowing conditions is 12.12 % , the maximum condensate saturation in the networks, at steady-state flow, is approximately 35 % . A notably dissimilar behavior is exhibited by the curves obtained for the gas-wet cases, 90 ° θ 180 ° . Since it is considered that liquid and gas flow at the same superficial velocity during slug flow, no liquid accumulation occurs. For this reason, the range of condensate saturations covered by these curves is equivalent to the mixture liquid dropout. Expressive differences in condensate saturation for the same flow conditions and different wettabilities, consistent with the results obtained with the proposed model, were also observed experimentally by Fahimpour et al. [21].
When compared to the base case with unaltered wettability, θ = 0 ° , the flow with contact angles of 45 ° , 60 ° and 75 ° led to improvements in both gas and condensate relative permeabilities, for all analyzed pressure levels and flow rates. Even though condensate accumulation still took place in those cases, the interface pressure drop (Equation (2)) was reduced, lowering the pressure drop between the inlet and outlet of the networks. Similar trends of increase in relative permeability for both phases were reported by Zhang et al. [60] and Fahimpour et al. [16]. On the contrary, at fixed saturation levels, the values of gas relative permeability obtained in gas-wet media are significantly lower than the ones obtained in the base case, especially at the low flowing velocities. For these cases, only liquid relative permeabilities are higher than the ones achieved in strongly liquid-wet media. This translation of relative permeability curves to the left has been repeatedly reported in the literature for two-phase flow in cores with wettability altered from liquid to gas-wet [6].
Curves for θ = 90 ° were also included in Figure 9. The condensation and flow behavior for gas-wet media was assigned for this case, so no liquid accumulation took place. For fixed saturations, improvement in gas relative permeability was only noticed at low flow rates, while liquid relative permeability increased significantly for all tested flow conditions.
The positive effect of flow rate in relative permeability was observed for all contact angles used in the analyses, except for the neutral wettability case. This effect is a result of the interplay between viscous forces and capillary forces in gas-condensate flow. As the flow rate is increased, viscous forces gain significance when compared to capillary forces, and fewer flowing paths remain blocked with liquid. Hence, since the capillary pressure for θ = 90 ° is equal to zero, this gradual effect does not happen. Another aspect noticed in the curves related to all cases other than θ = 90 ° is the negative effect of interfacial tension rise as the pressure is depleted. This effect is particularly apparent in liquid relative permeability curves, which can decline even at increasing liquid saturations, if the interfacial tension increment is high enough.
Further analyses of the parameters affecting gas and condensate relative permeabilities in wettability altered porous media are presented in Section 3.5.

3.5. Improvement Factor

Very few experimental studies assessing the effect of wettability alteration on condensate banking provide relative permeability curves as a function of saturation. During coreflooding experiments, the fluid mixture undergoes phase transitions and compositional shifts that make saturation determination highly challenging. As a result, the effect of wettability alteration is commonly evaluated by calculating improvement factors.
The improvement factor (IF) is the ratio between gas relative permeabilities after and before wettability change, for the same injection flow conditions. Kumar et al. [26] presented results for flow of mixtures that flashed into two phases in sandstone cores. At experimental conditions, the interfacial tension was approximately 4 mN/m and IFs varied between 2 and 3. Bang et al. [1] evaluated the effect of wettability alteration in a sandstone core at higher interfacial tension conditions (≈12 mN/m) and reached IFs between 3 and 4. Other authors reported IF in the range 1–2, for both sandstone and carbonate cores [61,62,63], but no details of the fluid properties were discussed.
Those works focus primarily on evaluating the effects of different wettability altering treatments and core properties, and rarely correlate improvement factors with fluid properties and flowing conditions. Fahimpour et al. [21] evaluated the effect of interfacial tension and flow rate for wettability altered carbonate cores. Under the experimental conditions, contact angles decreased monotonically with interfacial tension, and corresponded to 65 ° , 44 ° and 30 ° for σ = 10 , 3 and 1 mN/m, respectively. They measured averaged IFs of 3 for tests at σ = 10.8 mN/m, 1.3 for σ = 2.7 mN/m and 1.1 for σ = 0.77 mN/m, which indicates a significant effect of fluid properties on flow improvement via wettability alteration.
To evaluate thoroughly the effects of wettability, fluid properties and flow velocity on improvement factor, a wide range of flow conditions and contact angle values was examined with the proposed model. Improvement factors calculated for all analyses are shown in Figure 10. Gas flow velocities of 7.5 , 15, 30, 45, 60, 90 and 150 are denoted as Q 1 to Q 7 , while the pressures represented in Table 2 are labeled, in ascending order, as P 1 to P 6 .
The impact of liquid saturation and interfacial tension reported by Fahimpour et al. [21] is apparent in Figure 10. At lower pressures, which are associated with higher interfacial tensions and liquid saturations, higher improvement factors were achieved. This happens because an important effect related to wettability alteration is the reduction of interface pressure drop (Equation (2)). Thus, if interfacial tension and liquid saturation are negligible, this effect becomes less prominent and IFs tend to be lower.
Furthermore evident in Figure 10 is the influence of the degree of wettability alteration on IFs. For both gas and liquid-wet cases, contact angles closer to 90 ° produced more significant improvements, since the reduction of interface pressure drop is greater. Besides, it is noticeable that, for θ > 90 ° , IFs may be lower than one, especially at high pressures and low flowing rates. This is related to the different condensation modes and flow patterns observed in gas-wet and liquid-wet media. At low liquid saturations, condensate tends to be collected on films on pore walls, if the medium is liquid-wet. In this configuration, the negative effect of liquid accumulation on gas flow is less severe, as gas flowing paths are reduced, but not blocked. For the gas-wet case, however, we consider that even at low liquid saturations, liquid slugs are formed. Therefore, by altering the wettability, a negative effect may occur. This effect is more pronounced at low flow rates, as even small liquid slugs can obstruct the flow under weak acting viscous forces.
The fact that more pore throats contain liquid slugs in gas-wet media also intensifies the impact of flow rate on improvement factors, as seen in Figure 10d–f. Since the positive coupling between flow velocity and relative permeability is linked to the ability of viscous forces to overcome capillary forces, more liquid collected on slugs amplifies the effect. As for liquid-wet media, the flow rate effect is not only weaker, but also non monotonic. At low pressure levels improvement factors tend to decrease with flow rate, while at high pressures the effect can be either positive or negative. Independently of wettability preference, for high flow rates occurring in the near wellbore region, all tested contact angles led to improvement factors higher than one, indicating flow enhancement.

3.6. Liquid Accumulation and Compositional Shift

Apart from improvement factors, an important aspect related to wettability alteration for gas-condensate enhanced production involves the fluid phase behavior in the near wellbore region. In liquid-wet porous media, gas develops superior superficial velocities than condensate, leading to liquid accumulation. As a result, valuable heavier hydrocarbon components from the fluid mixture are trapped in the subsurface and the fluid phase behavior is altered. Figure 11, obtained with the CMG software Winprop, shows the phase boundaries and critical points for the original injected composition (Table 1) and for the mixtures contained in the liquid-wet networks during steady-state flow at pressures P 1 to P 6 (Table 2).
As the pressure is lowered, the fluid mixture becomes richer in heavier components and the phase envelope is shifted to the right. Consequently, not only the liquid saturation builds up, but the fluid mixture tends to turn into volatile oil. Such a transition is observed in the envelope related to pressure P 1 in Figure 11, where the critical temperature is 92 ° C, higher than the test temperature of 80 ° C. This affects negatively long-term well deliverability, since further depletion in the reservoir will not vaporize the deposited condensate, as predicted by the phase diagram related to the original composition (Figure 8).
For gas-wet media, the tendency of gas and condensate to flow at the same superficial velocity can preserve the original reservoir fluid composition around producing wells. Therefore, depletion beyond the pressure related to maximum liquid dropout, P 6 = 17.5 MPa for the tested composition, will lead to progressively lower liquid saturations and possibly more favorable producing scenarios.

4. Conclusions

A new compositional pore-network model for gas-condensate flow under variable wetting conditions was proposed. The networks comprised structures of pores bodies connected by converging-diverging circular pore throats. Gas and condensate conductances were calculated based on filmwise condensation followed by annular flow in liquid-wet media, and dropwise condensation followed by slug flow in gas-wet media. Flow through pore throats could be interrupted in liquid-wet channels upon the occurrence of snap-off, and in gas-wet channels during slug flow, granted that capillary forces overcame viscous forces. Fluid content and pressure in each pore were calculated through the solution of a system of non-linear equations with the Newton–Raphson method, while the phases properties were determined with a PT flash.
With the proposed model, flow of a multi-component mixture that experiences retrograde condensation under typical reservoir conditions was analyzed in sandstone based networks with different degrees of wettability alteration. Relative permeabilities and improvement factors were calculated for several flow rates and pressures below the dew point, representing different conditions occurring in the near wellbore region.
Relative permeability curves for liquid and gas-wet media exhibited very different profiles, due to different flow patterns and fluid accumulation propensities. For all tested cases, except for θ = 90 ° , flow rate impacted positively on relative permeabilities, while interface tension impacted negatively. Improvement factors were calculated so that the gas flow performances in altered and unaltered wettability media were compared. Significant effects of contact angle, flow rate and depletion stage on IFs were identified. The dependency of improvement factors on flow conditions predicted by the model agreed qualitatively with experimental results reported in the literature, as higher interfacial tension values led to higher improvement factors. Furthermore, for analogous contact angle and interfacial tension values, the results were quantitatively similar. For θ = 45 ° and 60 ° , and low interfacial tension, the improvement factors for both experiments [21] and numerical modeling were in the range between 1 and 1.5. Contact angles closer to θ = 90 ° led to higher improvement factors in both gas and liquid-wet media. The impact of wettability alteration was more pronounced at lower pressures, in which higher interfacial tension and liquid saturation occur. For gas-wet media, low flow rates and high pressures could lead to I F < 1 , which indicates gas flow impairment. These conditions, however, are more predominant in far wellbore regions.
Fluid phase behavior during depletion was also assessed with the proposed model. In liquid-wet media, the tendency of condensate buildup led to the transition from gas-condensate to volatile-oil behavior, at the pressure associated with the maximum liquid dropout. This can impact long term gas productivity and should also be taken into account when designing a wettability alteration treatment for field application.
We believe that the proposed model could serve as a fast and economical tool for the appraisal of wettability alteration as a condensate blockage mitigation method. Future work on the model could involve devising a correlation to determine the contact-angle as a function of the system thermodynamic state. Additionally, implementing a more gradual flow pattern transition between liquid and gas-wet states could improve the fidelity of flow analyses for near intermediate-wet conditions.

Author Contributions

Conceptualization, P.K.P.R. and M.S.C.; methodology, P.K.P.R. and M.S.C.; numerical implementation, P.K.P.R.; investigation, P.K.P.R. and M.S.C.; resources, M.S.C.; writing—original draft preparation, P.K.P.R.; writing—review and editing, P.K.P.R. and M.S.C.; funding acquisition, M.S.C. Both authors have read and agreed to the published version of the manuscript.

Funding

This study was financed in part by the Coordenação de Aperfeiçoamento de Pessoal de Nível Superior—Brasil (CAPES)—Finance Code 001 and by Repsol-Sinopec Brasil, under the RD&I Levy Fund Program of the National Petroleum Agency (ANP).

Conflicts of Interest

The authors declare no conflict of interest.

References

  1. Bang, V.S.S.; Pope, G.A.; Sharma, M.M.; Baran, J.R., Jr. Development of a successful chemical treatment for gas wells with liquid blocking. In SPE Annual Technical Conference and Exhibition; Society of Petroleum Engineers, 2009; Available online: https://doi.org/10.2118/124977-MS (accessed on 4 September 2020).
  2. Ahmadi, M.; Sharma, M.M.; Pope, G.; Torres, D.E.; McCulley, C.A.; Linnemeyer, H. Chemical treatment to mitigate condensate and water blocking in gas wells in carbonate reservoirs. SPE Prod. Oper. 2011, 26, 67–74. [Google Scholar] [CrossRef]
  3. Wu, S.; Firoozabadi, A. Permanent alteration of porous media wettability from liquid-wetting to intermediate gas-wetting. Transp. Porous Media 2010, 85, 189–213. [Google Scholar] [CrossRef]
  4. Al-Anazi, H.A.; Okasha, T.M.; Haas, M.D.; Ginest, N.H.; Al-Faifi, M. Impact of completion fluids on productivity in Gas/condensate reservoirs. In SPE Production Operations Symposium; Society of Petroleum Engineers, 2005; Available online: https://doi.org/10.2118/94256-MS (accessed on 4 September 2020).
  5. Fevang, Ø.; Whitson, C. Modeling gas-condensate well deliverability. SPE Reserv. Eng. 1996, 11, 221–230. [Google Scholar] [CrossRef]
  6. Ganie, K.; Idris, A.K.; Mohshim, D.F.; Sulaiman, W.R.W.; Saaid, I.M.; Malik, A.A. A review on the wettability alteration mechanism in condensate banking removal. J. Pet. Sci. Eng. 2019, 183, 106431. [Google Scholar] [CrossRef]
  7. Sharma, S.; Sheng, J.J. A comparative study of huff-n-puff gas and solvent injection in a shale gas condensate core. J. Nat. Gas Sci. Eng. 2017, 38, 549–565. [Google Scholar] [CrossRef] [Green Version]
  8. Hassan, A.; Mahmoud, M.; Al-Majed, A.; Alawi, M.B.; Elkatatny, S.; BaTaweel, M.; Al-Nakhli, A. Gas condensate treatment: A critical review of materials, methods, field applications, and new solutions. J. Pet. Sci. Eng. 2019, 177, 602–613. [Google Scholar] [CrossRef]
  9. Kewen, L.; Abbas, F. Experimental study of wettability alteration to preferential gas-wetting in porous media and its effects. SPE Reserv. Eval. Eng. 2000, 3, 139–149. [Google Scholar] [CrossRef]
  10. Ali, N.E.C.; Zoghbi, B.; Fahes, M.; Nasrabadi, H.; Retnanto, A. The impact of near-wellbore wettability on the production of gas and condensate: Insights from experiments and simulations. J. Pet. Sci. Eng. 2019, 175, 215–223. [Google Scholar]
  11. Franco-Aguirre, M.; Zabala, R.D.; Lopera, S.H.; Franco, C.A.; Cortés, F.B. Interaction of anionic surfactant-nanoparticles for gas-Wettability alteration of sandstone in tight gas-condensate reservoirs. J. Nat. Gas Sci. Eng. 2018, 51, 53–64. [Google Scholar] [CrossRef]
  12. Li, K.; Liu, Y.; Zheng, H.; Huang, G.; Li, G. Enhanced gas-condensate production by wettability alteration to gas wetness. J. Pet. Sci. Eng. 2011, 78, 505–509. [Google Scholar] [CrossRef]
  13. Gahrooei, H.R.E.; Ghazanfari, M.H. Toward a hydrocarbon-based chemical for wettability alteration of reservoir rocks to gas wetting condition: Implications to gas condensate reservoirs. J. Mol. Liq. 2017, 248, 100–111. [Google Scholar] [CrossRef]
  14. Hoseinpour, S.A.; Madhi, M.; Norouzi, H.; Soulgani, B.S.; Mohammadi, A.H. Condensate blockage alleviation around gas-condensate producing wells using wettability alteration. J. Nat. Gas Sci. Eng. 2019, 62, 214–223. [Google Scholar] [CrossRef]
  15. Noh, M.H.; Firoozabadi, A. Wettability alteration in gas-condensate reservoirs to mitigate well deliverability loss by water blocking. SPE Reserv. Eval. Eng. 2008, 11, 676–685. [Google Scholar] [CrossRef] [Green Version]
  16. Fahimpour, J.; Jamiolahmady, M. Optimization of fluorinated wettability modifiers for gas/condensate carbonate reservoirs. SPE J. 2015, 20, 729–742. [Google Scholar] [CrossRef]
  17. Tang, G.Q.; Firoozabadi, A. Wettability alteration to intermediate gas-wetting in porous media at elevated temperatures. Transp. Porous Media 2003, 52, 185–211. [Google Scholar] [CrossRef]
  18. Fahimpour, J.; Jamiolahmady, M. Impact of gas–condensate composition and interfacial tension on oil-repellency strength of wettability modifiers. Energy Fuels 2014, 28, 6714–6722. [Google Scholar] [CrossRef]
  19. Wang, Y.; Jin, J.; Ma, L.; Li, L.; Zhao, X. Influence of wettability alteration to preferential gas-wetting on displacement efficiency at elevated temperatures. J. Dispers. Sci. Technol. 2015, 36, 1274–1281. [Google Scholar] [CrossRef]
  20. Fahes, M.M.; Firoozabadi, A. Wettability alteration to intermediate gas-wetting in gas-condensate reservoirs at high temperatures. SPE J. 2007, 12, 397–407. [Google Scholar] [CrossRef]
  21. Fahimpour, J.; Jamiolahmady, M. An Improved Understanding of Performance of Wettability Alteration for Condensate Banking Removal Under Steady-State Flow Conditions. In Abu Dhabi International Petroleum Exhibition and Conference; Society of Petroleum Engineers, 2015; Available online: https://doi.org/10.2118/177901-MS (accessed on 4 September 2020).
  22. Jamiolahmady, M.; Danesh, A.; Tehrani, D.H.; Duncan, D.B. Positive effect of flow velocity on gas–condensate relative permeability: Network modelling and comparison with experimental results. Transp. Porous Media 2003, 52, 159–183. [Google Scholar] [CrossRef]
  23. Henderson, G.D.; Danesh, A.; Tehrani, D.; Peden, J. The effect of velocity and interfacial tension on relative permeability of gas condensate fluids in the wellbore region. J. Pet. Sci. Eng. 1997, 17, 265–273. [Google Scholar] [CrossRef]
  24. Henderson, G.D.; Danesh, A.; Al-Kharusi, B.; Tehrani, D. Generating reliable gas condensate relative permeability data used to develop a correlation with capillary number. J. Pet. Sci. Eng. 2000, 25, 79–91. [Google Scholar] [CrossRef]
  25. Whitson, C.H.; Fevang, Ø.; Sævareid, A. Gas condensate relative permeability for well calculations. Transp. Porous Media 2003, 52, 279–311. [Google Scholar] [CrossRef]
  26. Kumar, V.; Pope, G.A.; Sharma, M.M. Improving the gas and condensate relative permeability using chemical treatments. In SPE Gas Technology Symposium; Society of Petroleum Engineers, 2006; Available online: https://doi.org/10.2118/100529-MS (accessed on 4 September 2020).
  27. Bang, V.S.S.; Pope, G.; Sharma, M.M.; Baran, J.; Ahmadi, M. A new solution to restore productivity of gas wells with condensate and water blocks. SPE Reserv. Eval. Eng. 2010, 13, 323–331. [Google Scholar] [CrossRef]
  28. Li, K.; Firoozabadi, A. Phenomenological modeling of critical condensate saturation and relative permeabilities in gas/condensate systems. SPE J. 2000, 5, 138–147. [Google Scholar] [CrossRef] [Green Version]
  29. Wang, X.; Mohanty, K.K. Pore-network model of flow in gas/condensate reservoirs. SPE J. 2000, 5, 426–434. [Google Scholar] [CrossRef]
  30. Bustos, C.I.; Toledo, P.G. Pore-level modeling of gas and condensate flow in two-and three-dimensional pore networks: Pore size distribution effects on the relative permeability of gas and condensate. Transp. Porous Media 2003, 53, 281–315. [Google Scholar] [CrossRef]
  31. Momeni, A.; Dadvar, M.; Hekmatzadeh, M.; Dabir, B. 3D pore network modeling and simulation for dynamic displacement of gas and condensate in wellbore region. Int. J. Multiph. Flow 2017, 97, 147–156. [Google Scholar] [CrossRef]
  32. Chalbaud, C.; Robin, M.; Bekri, S.; Egermann, P. Wettability impact on CO2 storage in aquifers: Visualisation and quantification using micromodel tests, pore network model and reservoir simulations. In Proceedings of the International Symposium of the Society of Core Analysts, Calgary, AB, Canada, 10–13 September 2007; pp. 10–12. [Google Scholar]
  33. Chapuis, O.; Prat, M. Influence of wettability conditions on slow evaporation in two-dimensional porous media. Phys. Rev. E 2007, 75, 046311. [Google Scholar] [CrossRef]
  34. Chraibi, H.; Prat, M.; Chapuis, O. Influence of contact angle on slow evaporation in two-dimensional porous media. Phys. Rev. E 2009, 79, 026313. [Google Scholar] [CrossRef] [Green Version]
  35. Sinha, P.K.; Mukherjee, P.P.; Wang, C.Y. Impact of GDL structure and wettability on water management in polymer electrolyte fuel cells. J. Mater. Chem. 2007, 17, 3089–3103. [Google Scholar] [CrossRef]
  36. Kuttanikkad, S.P.; Prat, M.; Pauchet, J. Pore-network simulations of two-phase flow in a thin porous layer of mixed wettability: Application to water transport in gas diffusion layers of proton exchange membrane fuel cells. J. Power Sources 2011, 196, 1145–1155. [Google Scholar] [CrossRef]
  37. Shao, C.; Yang, Z.; Zhou, G.; Lu, G. Pore network modeling of water block in low permeability reservoirs. Pet. Sci. 2010, 7, 362–366. [Google Scholar] [CrossRef] [Green Version]
  38. Huang, X.; Bandilla, K.W.; Celia, M.A. Multi-physics pore-network modeling of two-phase shale matrix flows. Transp. Porous Media 2016, 111, 123–141. [Google Scholar] [CrossRef]
  39. Fang, C.; Steinbrenner, J.E.; Wang, F.M.; Goodson, K.E. Impact of wall hydrophobicity on condensation flow and heat transfer in silicon microchannels. J. Micromech. Microeng. 2010, 20, 045018. [Google Scholar] [CrossRef]
  40. Chen, Y.; Cheng, P. Condensation of steam in silicon microchannels. Int. Commun. Heat Mass Transf. 2005, 32, 175–183. [Google Scholar] [CrossRef]
  41. Cubaud, T.; Ulmanella, U.; Ho, C.M. Two-phase flow in microchannels with surface modifications. Fluid Dyn. Res. 2006, 38, 772. [Google Scholar] [CrossRef]
  42. Wu, T.; Djilali, N. Experimental investigation of water droplet emergence in a model polymer electrolyte membrane fuel cell microchannel. J. Power Sources 2012, 208, 248–256. [Google Scholar] [CrossRef] [Green Version]
  43. Santos, R.M.; Kawaji, M. Developments on wetting effects in microfluidic slug flow. Chem. Eng. Commun. 2012, 199, 1626–1641. [Google Scholar] [CrossRef]
  44. Kawahara, A.; Chung, P.Y.; Kawaji, M. Investigation of two-phase flow pattern, void fraction and pressure drop in a microchannel. Int. J. Multiph. Flow 2002, 28, 1411–1435. [Google Scholar] [CrossRef]
  45. Chung, P.Y.; Kawaji, M. The effect of channel diameter on adiabatic two-phase flow characteristics in microchannels. Int. J. Multiph. Flow 2004, 30, 735–761. [Google Scholar] [CrossRef]
  46. Kawaji, M.; Chung, P.Y. Adiabatic gas–liquid flow in microchannels. Microscale Thermophys. Eng. 2004, 8, 239–257. [Google Scholar] [CrossRef]
  47. Reis, P.; Carvalho, M. Compositional Pore-Network Modeling of Gas-Condensate Flow: Effects of Interfacial Tension and Flow Velocity. arXiv 2020, arXiv:2007.12201. [Google Scholar]
  48. Dong, H. Micro-CT Imaging and Pore Network Extraction. Ph.D. Thesis, Department of Earth Science and Engineering, Imperial College London, London, UK, 2008. [Google Scholar]
  49. Fang, F.; Firoozabadi, A.; Abbaszadeh, M.; Radke, C. A Phenomenological modeling of critical condensate saturation. In SPE Annual Technical Conference and Exhibition; Society of Petroleum Engineers, 1996; Available online: https://doi.org/10.2118/36716-MS (accessed on 4 September 2020).
  50. Beresnev, I.A.; Li, W.; Vigil, R.D. Condition for break-up of non-wetting fluids in sinusoidally constricted capillary channels. Transp. Porous Media 2009, 80, 581. [Google Scholar] [CrossRef]
  51. Santos, M.; Carvalho, M. Pore network model for retrograde gas flow in porous media. J. Pet. Sci. Eng. 2019, 185, 106635. [Google Scholar] [CrossRef] [Green Version]
  52. Sochi, T. Newtonian Flow in Converging-Diverging Capillaries. Int. J. Model. Simul. Sci. Comput. 2013, 4, 1350011. [Google Scholar] [CrossRef]
  53. Kashid, M.N.; Agar, D.W. Hydrodynamics of liquid–liquid slug flow capillary microreactor: Flow regimes, slug size and pressure drop. Chem. Eng. J. 2007, 131, 1–13. [Google Scholar] [CrossRef]
  54. Peng, D.Y.; Robinson, D.B. A New Two-Constant Equation of State. Ind. Eng. Chem. Fundam. 1976, 15, 59–64. [Google Scholar] [CrossRef]
  55. Imperial College London. PERM—Petroleum Engineering & Rock Mechanics Group. Micro-CT Images and Networks: Sandstone S4. 2007. Available online: http://www.imperial.ac.uk/earth-science/research/research-groups/perm/research/pore-scale-modelling/micro-ct-images-and-networks/sandstone-s4/ (accessed on 25 August 2020).
  56. Jamiolahmady, M.; Danesh, A.; Henderson, G.; Tehrani, D. Variations of gas-condensate relative permeability with production rate at near wellbore conditions: A general correlation. In Offshore Europe; Society of Petroleum Engineers, 2003; Available online: https://doi.org/10.2118/120088-PA (accessed on 4 September 2020).
  57. Henderson, G.D.; Danesh, A.; Tehrani, D.H.; Al-Shaidi, S.; Peden, J.M. Measurement and correlation of gas condensate relative permeability by the steady-state method. SPE Reserv. Eval. Eng. 1998, 1, 134–140. [Google Scholar] [CrossRef]
  58. Lohrenz, J.; Bray, B.G.; Clark, C.R. Calculating viscosities of reservoir fluids from their compositions. J. Pet. Technol. 1964, 16, 1–171. [Google Scholar] [CrossRef]
  59. Weinaug, C.F.; Katz, D.L. Surface Tensions of Methane-Propane Mixtures. Ind. Eng. Chem. 1943, 35, 239–246. [Google Scholar] [CrossRef]
  60. Zhang, S.; Jiang, G.C.; Wang, L.; Qing, W.; Guo, H.T.; Tang, X.g.; Bai, D.G. Wettability alteration to intermediate gas-wetting in low-permeability gas-condensate reservoirs. J. Pet. Explor. Prod. Technol. 2014, 4, 301–308. [Google Scholar] [CrossRef] [Green Version]
  61. Al-Anazi, H.A.; Xiao, J.; Al-Eidan, A.A.; Buhidma, I.M.; Ahmed, M.S.; Al-Faifi, M.; Assiri, W.J. Gas productivity enhancement by wettability alteration of gas-condensate reservoirs. In European Formation Damage Conference; Society of Petroleum Engineers, 2007; Available online: https://doi.org/10.2118/107493-MS (accessed on 4 September 2020).
  62. Gilani, S.F.H.; Sharma, M.M.; Torres, D.E.; Ahmadi, M.; Pope, G.A.; Linnemeyer, H.C. Correlating Wettability Alteration with Changes in Gas Relative Permeability in Gas Condensate/Volatile Oil Reservoirs. In SPE International Symposium on Oilfield Chemistry; Society of Petroleum Engineers, 2011; Available online: https://doi.org/10.2118/141419-MS (accessed on 4 September 2020).
  63. Karandish, G.; Rahimpour, M.; Sharifzadeh, S.; Dadkhah, A. Wettability alteration in gas-condensate carbonate reservoir using anionic fluorinated treatment. Chem. Eng. Res. Des. 2015, 93, 554–564. [Google Scholar] [CrossRef]
Figure 1. Definition of pore volume.
Energies 13 04673 g001
Figure 2. Stages of condensation and flow in a liquid-wet capillary. (a) Film of liquid at initial state of condensation. (b) Slug of liquid formed after snap-off.
Energies 13 04673 g002
Figure 3. Stages of condensation and flow in a gas-wet capillary. (a) Droplet of liquid at initial state of condensation. (b) Slug of liquid formed with droplet growth.
Energies 13 04673 g003
Figure 4. Condensate menisci radii, R 1 and R 2 , used to calculate Δ P i n t .
Energies 13 04673 g004
Figure 5. Details of the used pore-network generation. (a) Sandstone sample and micro-CT image used to extract the pore-network. Images available on [55]. (b) Pore-network generated with data extracted from the sandstone sample on (a), with used subsection delineated. Data available on [55]. (c) Subsection of the pore-network in (b), adapted for the proposed model.
Energies 13 04673 g005
Figure 6. Pore throat adaptation for the proposed model. (a) Pore body and throat dimensions following the pore-network extraction method proposed by Dong [48]. (b) Pore throat dimensions for the adapted pore-network, based on pore body and throat radii in (a).
Energies 13 04673 g006
Figure 7. Histograms of pore throat dimensions of the adapted network.
Energies 13 04673 g007
Figure 8. Fluid mixture phase envelope.
Energies 13 04673 g008
Figure 9. Relative permeability curves at different gas flow velocities.
Energies 13 04673 g009
Figure 10. Improvement factors for all flowing conditions.
Energies 13 04673 g010
Figure 11. Phase envelope shift due to liquid accumulation.
Energies 13 04673 g011
Table 1. Fluid mixture composition.
ComponentMolar Fraction
CO 2 0.07
C10.65
C20.13
C30.07
C60.05
C100.025
C160.005
Table 2. Fluid properties at flowing conditions.
LabelPressure [MPa]Liquid Dropout [%] μ g [Pa · s] μ l [Pa · s] σ [mN/m]
P621.571.17 3.27 × 10 5 5.58 × 10 5 0.0196
P521.333.51 3.2 × 10 5 5.7 × 10 5 0.0271
P421.845.31 3.12 × 10 5 5.81 × 10 5 0.0359
P320.597.86 2.99 × 10 5 6.04 × 10 5 0.058
P219.6110.6 2.76 × 10 5 6.46 × 10 5 0.1221
P117.512.12 2.4 × 10 5 7.29 × 10 5 0.3501

