Article

On-Line Diagnosis and Fault State Classification Method of Photovoltaic Plant

Department of Electrical Engineering, Hany4ang University, Seoul 04763, Korea
*
Author to whom correspondence should be addressed.
Energies 2020, 13(17), 4584; https://doi.org/10.3390/en13174584
Submission received: 27 July 2020 / Revised: 24 August 2020 / Accepted: 30 August 2020 / Published: 3 September 2020
(This article belongs to the Special Issue Recent Advances in Solar Power Plants)

Abstract

:
This paper presents an on-line diagnosis method for large photovoltaic (PV) power plants by using a machine learning algorithm. Most renewable energy output power is decreased due to the lack of management tools and the skills of maintenance engineers. Additionally, many photovoltaic power plants have a long down-time due to the absence of a monitoring system and their distance from the city. The IEC 61724-1 standard is a Performance Ratio (PR) index that evaluates the PV power plant performance and reliability. However, the PR index has a low recognition rate of the fault state in conditions of low irradiation and bad weather. This paper presents a weather-corrected index, linear regression method, temperature correction equation, estimation error matrix, clearness index and proposed variable index, as well as a one-class Support Vector Machine (SVM) method and a kernel technique to classify the fault state and anomaly output power of PV plants.

1. Introduction

Due to the interest in renewable energy, photovoltaic (PV) power plants have been penetrating power systems. However, a considerable number of photovoltaic power plants have problems such as low power generation, unrecognized fault states and difficulty in analyzing decreased output power. Therefore, most maintenance engineers want to develop economic, efficient and reliable methodologies and tools to monitor and quickly identify the fault state, produce more energy and minimize maintenance planning. The Performance Ratio (PR) index (IEC61724-1 standard) is a health index for photovoltaic power plants that analyzes the solar power plant fault state and decreased output power and evaluates the solar power plant’s performance and aging [1,2,3,4,5,6]. If a fault occurs in a PV power plant, the operator recognizes the anomaly in output power by calculating the PR index, which will show a lower value than that in the normal state. An Operation and Maintenance (O&M) engineer can identify the fault state of a PV power plant and undertake maintenance work for normal generation.
However, a solar power plant operator does not recognize the fault state because the annual PR index does not have a constant value. Operators have a fault recognition problem in PV plants because of the output power’s variable characteristics resulting from changes in ambient temperature. In order to improve the problem of PV plant temperature variability, the National Renewable Energy Laboratory (NREL) proposes the use of the Weather-Corrected Performance Ratio (WCPR) index as the temperature-corrected performance index for PV power plants [7]. WCPR is a temperature-corrected health index for PV power plants that compensates for temperature fluctuations through output power correction based on the average temperature of the solar cell.
Furthermore, PV power plants have large fluctuations due to environmental resource variability. When the irradiation value is small, such as on a rainy or snowy day, plant monitoring, supervisory control and data acquisition systems have a low recognition rate of the fault state in a PV power plant. Some of the recent research on PV fault detection algorithms is based on the irradiance-power linear regression method. This method improves the low recognition rate problem for small irradiation values [8,9]. Additionally, a temperature correction output formula can compensate for the fluctuation value of the output power and will improve variability problems when calculating the output power value.
Some of the PV fault detection methods reported in the literature use electrical circuit simulations of the PV system [10,11,12]. These simulations detect the signal and location of the PV panel and the system fault by using signal analysis methods, such as Time Domain Reflectometry (TDM) and ECM (earth capacitance measurements) [13,14]. The research in [15] proposes a detecting algorithm for a particular fault by utilizing the Voltage Ratio and Power Ratio indices. This method calculates the high and low limit values of the PR and VR indices and classifies the fault of Grid-Connected Photovoltaic (GCPV) systems. Different methods for detecting a PV power plant fault analyze the power loss of PV systems. These methods detect an anomaly in the PV power plant by calculating the efficiency of the overall performance of the plant [16,17]. The author of [18] classifies several types of faults (normal operation, string fault, partial shading) by comparing between the simulated and measured values of the threshold levels. Other methods to detect the low output power performance of the plant use predictive methods that are based on the output power [19,20].
To classify the fault state of PV power plants, recent research has focused on artificial intelligence (AI) techniques. Some researchers have used neural networks, fuzzy logic and expert systems [21,22,23]. These researchers classified the output power patterns by extracting the characteristics of each condition. The author of [24] presents the four major artificial intelligence (AI) techniques: Artificial Neural Networks (ANN), Fuzzy Logic (FL), Genetic Algorithms (GA), and Hybrid Systems (HS). AI-based modeling and techniques, as alternatives to conventional physical modeling, are explained. Other methods are used to detect outlier data from the original data set to define the normal operation level [8,24]. These methods classify the abnormal data of the PV power plant by calculating the outlier levels of a given data set.
Recent research on the anomaly and fault detection of PV power plants has proposed Outlier Mining Techniques to detect the decreased output power value [25,26]. An anomaly detection algorithm is reported in the literature that applies the auto threshold level to classify the decreased output power of PV plants. Additionally, a smoothing technique for the PV power plant output power variable is proposed to recognize the long-term power loss due to faults [25]. This technique does not preserve the raw data because it uses a transforming (or smoothing) technique on the original data. The author of [27] proposed the BNN (Bayesian Neural Network) AI method to detect the anomaly pattern (soiling effect). This AI method classifies the soiling effect by learning the dirty and clean modules of generation data sets on sunny and cloudy days. This paper presents a One-Class Support Vector Machine (OCSVM) to classify the anomaly and fault state of a PV power plant. The fault state and decreased output power are classified using the maximum margin hyperplane method of the Support Vector Machine (SVM) technique, and raw data are transformed into the feature space by using the kernel technique. The recognition rate of the fault state is improved by utilizing the kernel technique of a variable index that separates the fault state from the fluctuations in data of normal generation.

2. Fault State Classification Method for Photovoltaic Plants

2.1. Performance Index of Photovoltaic Plants

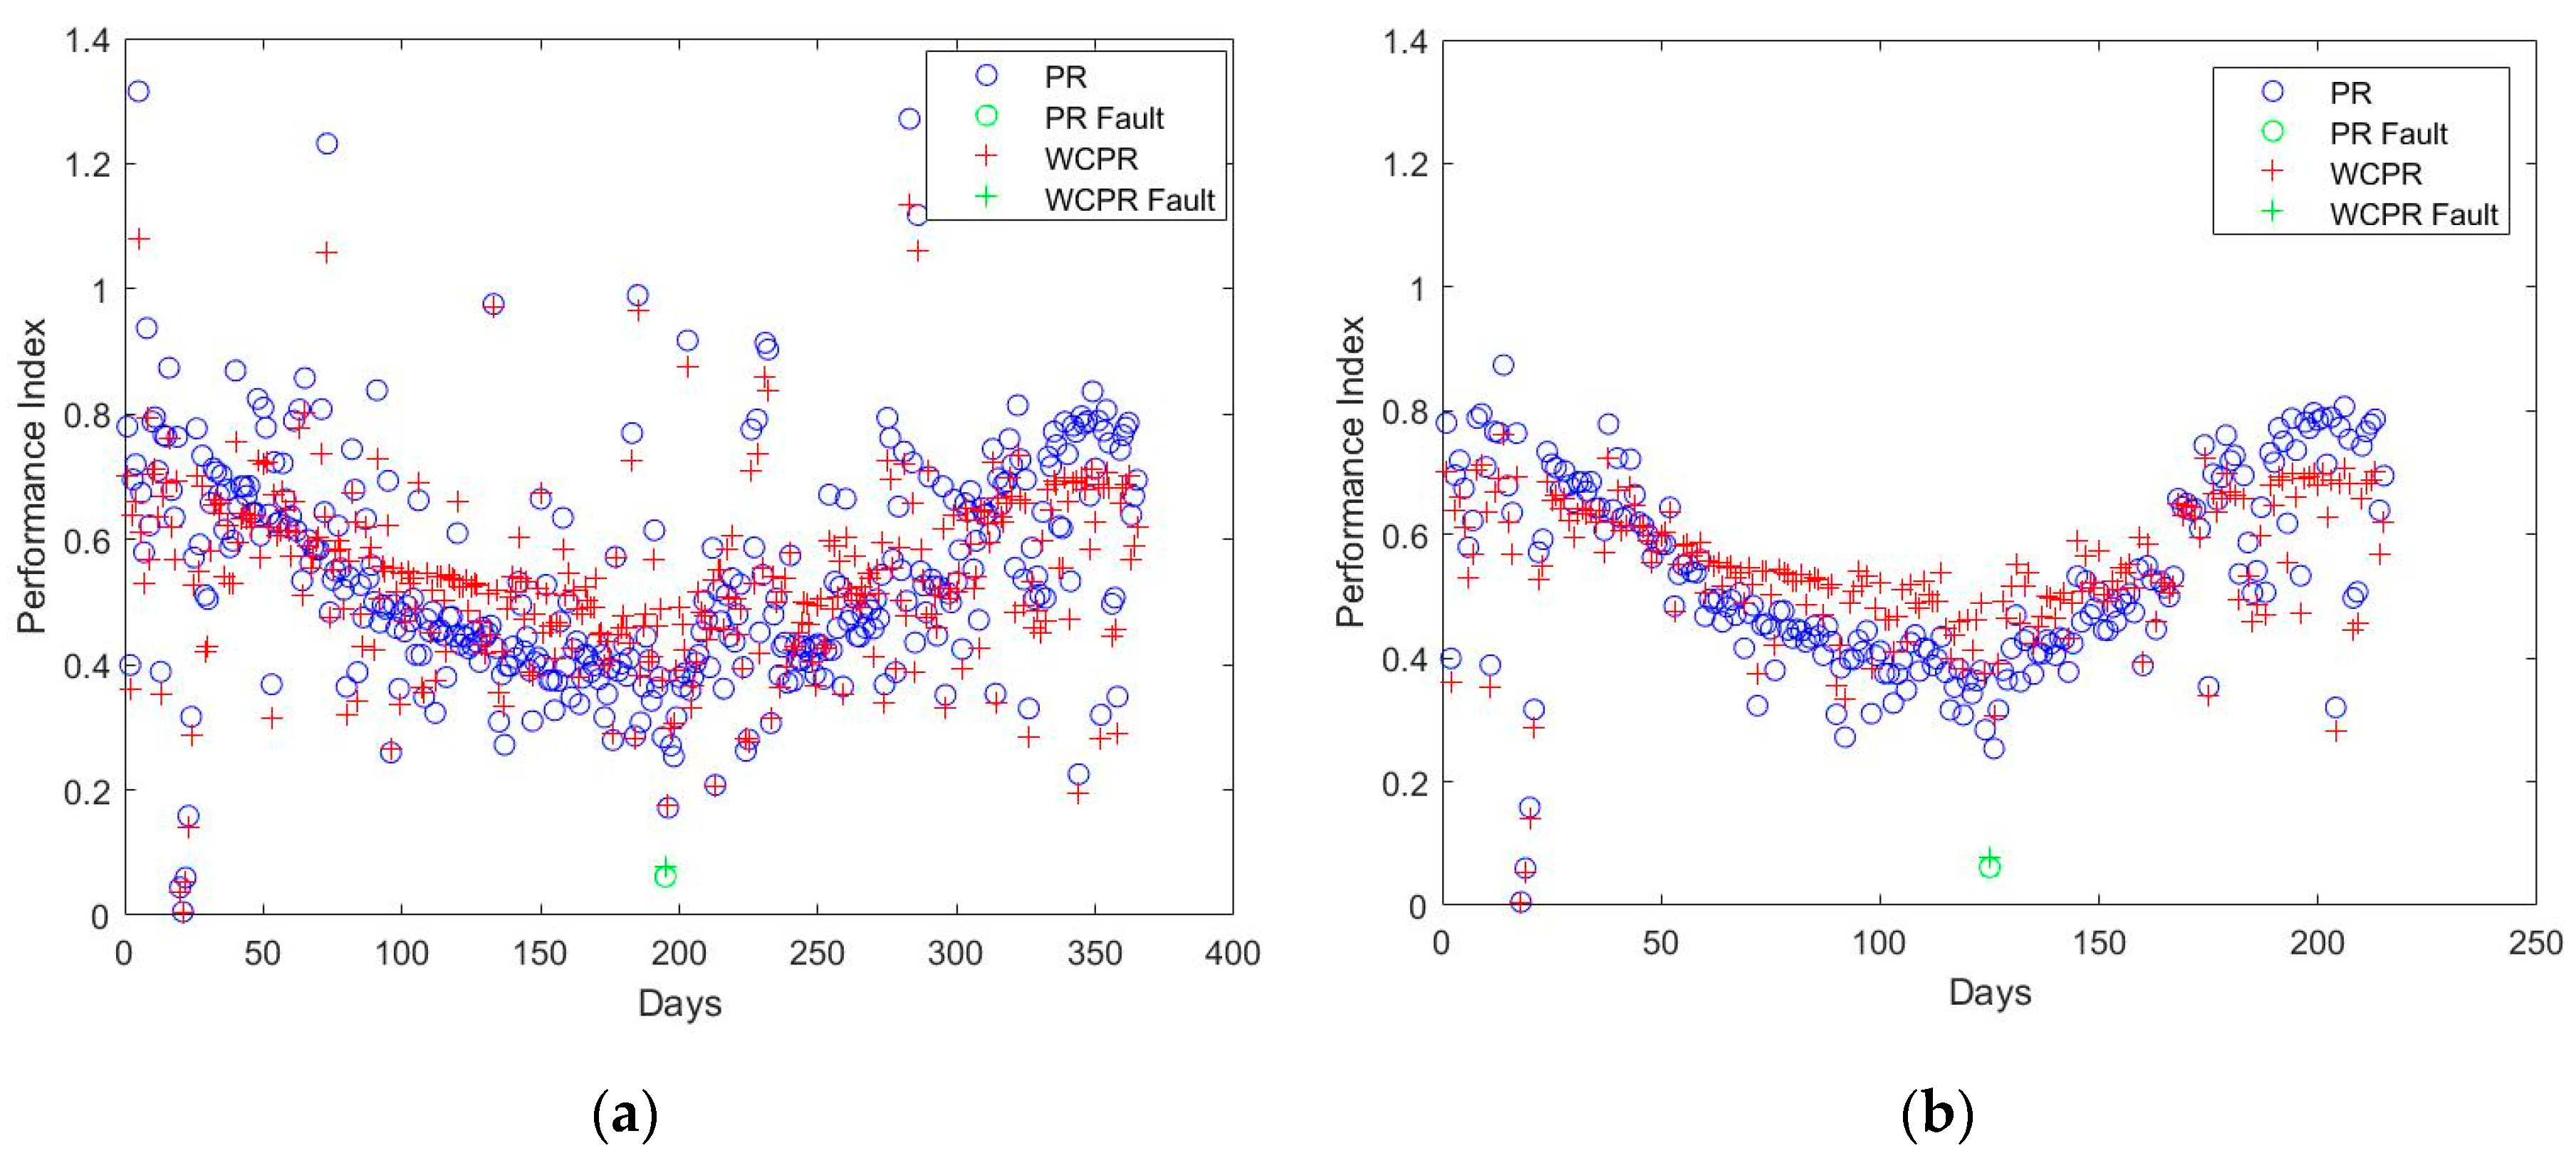
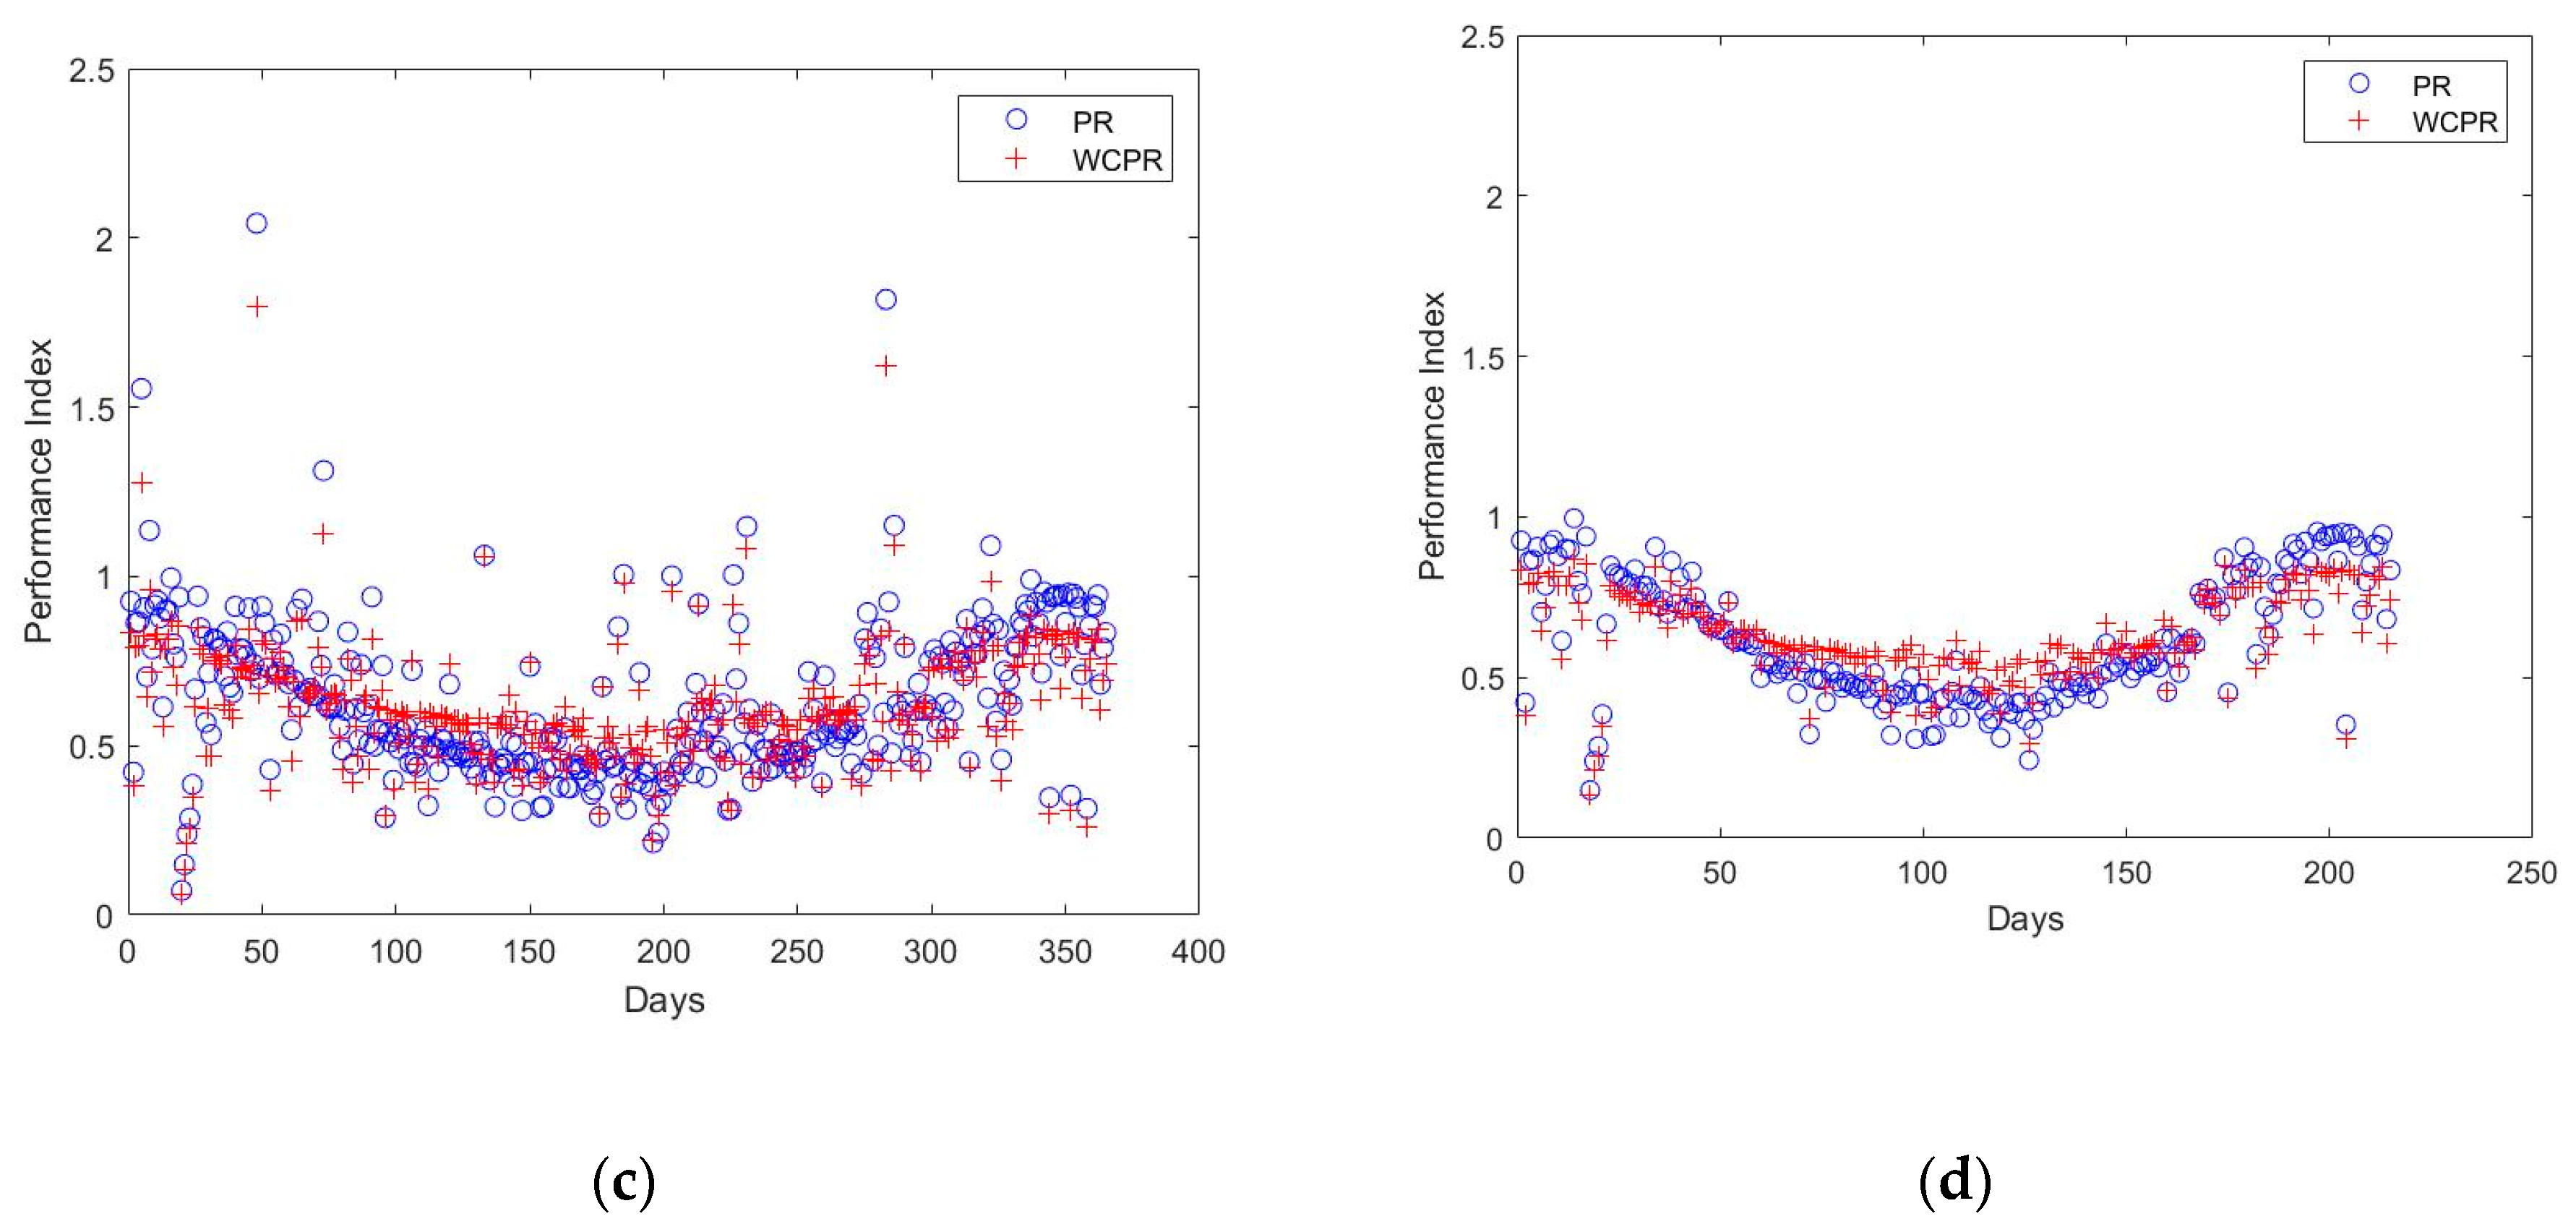
2.1.1. Performance Ratio (PR)

The performance index for solar power plants is proposed by the IEC 61724-1 standard (Performance Ratio, PR) and indicates the efficiency of a solar power plant. If a fault occurs in a photovoltaic power plant, the fault state can be identified through a PR index that has a lower value than that in the normal state. When managing a solar power plant through these indices, the performance index can be used as an asset management index for fault state classification and aging rate calculation.
P R = t = 1 24 E A C ( t ) [ k W h ] t = 1 24 G ( t ) [ W / m 2 ] A [ m 2 ] η [ % ]
where E A C is the AC output power of the solar plant, G is the irradiation, A is the area of the solar power plant, and η is the efficiency of the solar power plant.

2.1.2. Weather-Corrected Performance Ratio (WCPR)

WCPR is a temperature-corrected performance index suggested by the National Renewable Energy Laboratory (NREL) [7]. This index improves fluctuations by compensating for the temperature loss of photovoltaic cells.
W C P R = P R 1 1 + δ ( T c e l l , a v g T c e l l )
where δ is the temperature coefficient of the solar cell, T c , a v g is the annual temperature average of the solar cell, and T c , is the temperature of the solar cell.
An approximate equation for calculating the cell temperature is given by
T c = T a + G 800   W / m 2 ( N O C T 20 )
where T a is the ambient temperature, G is the irradiation, and NOCT is the Normal Operating Cell Temperature.

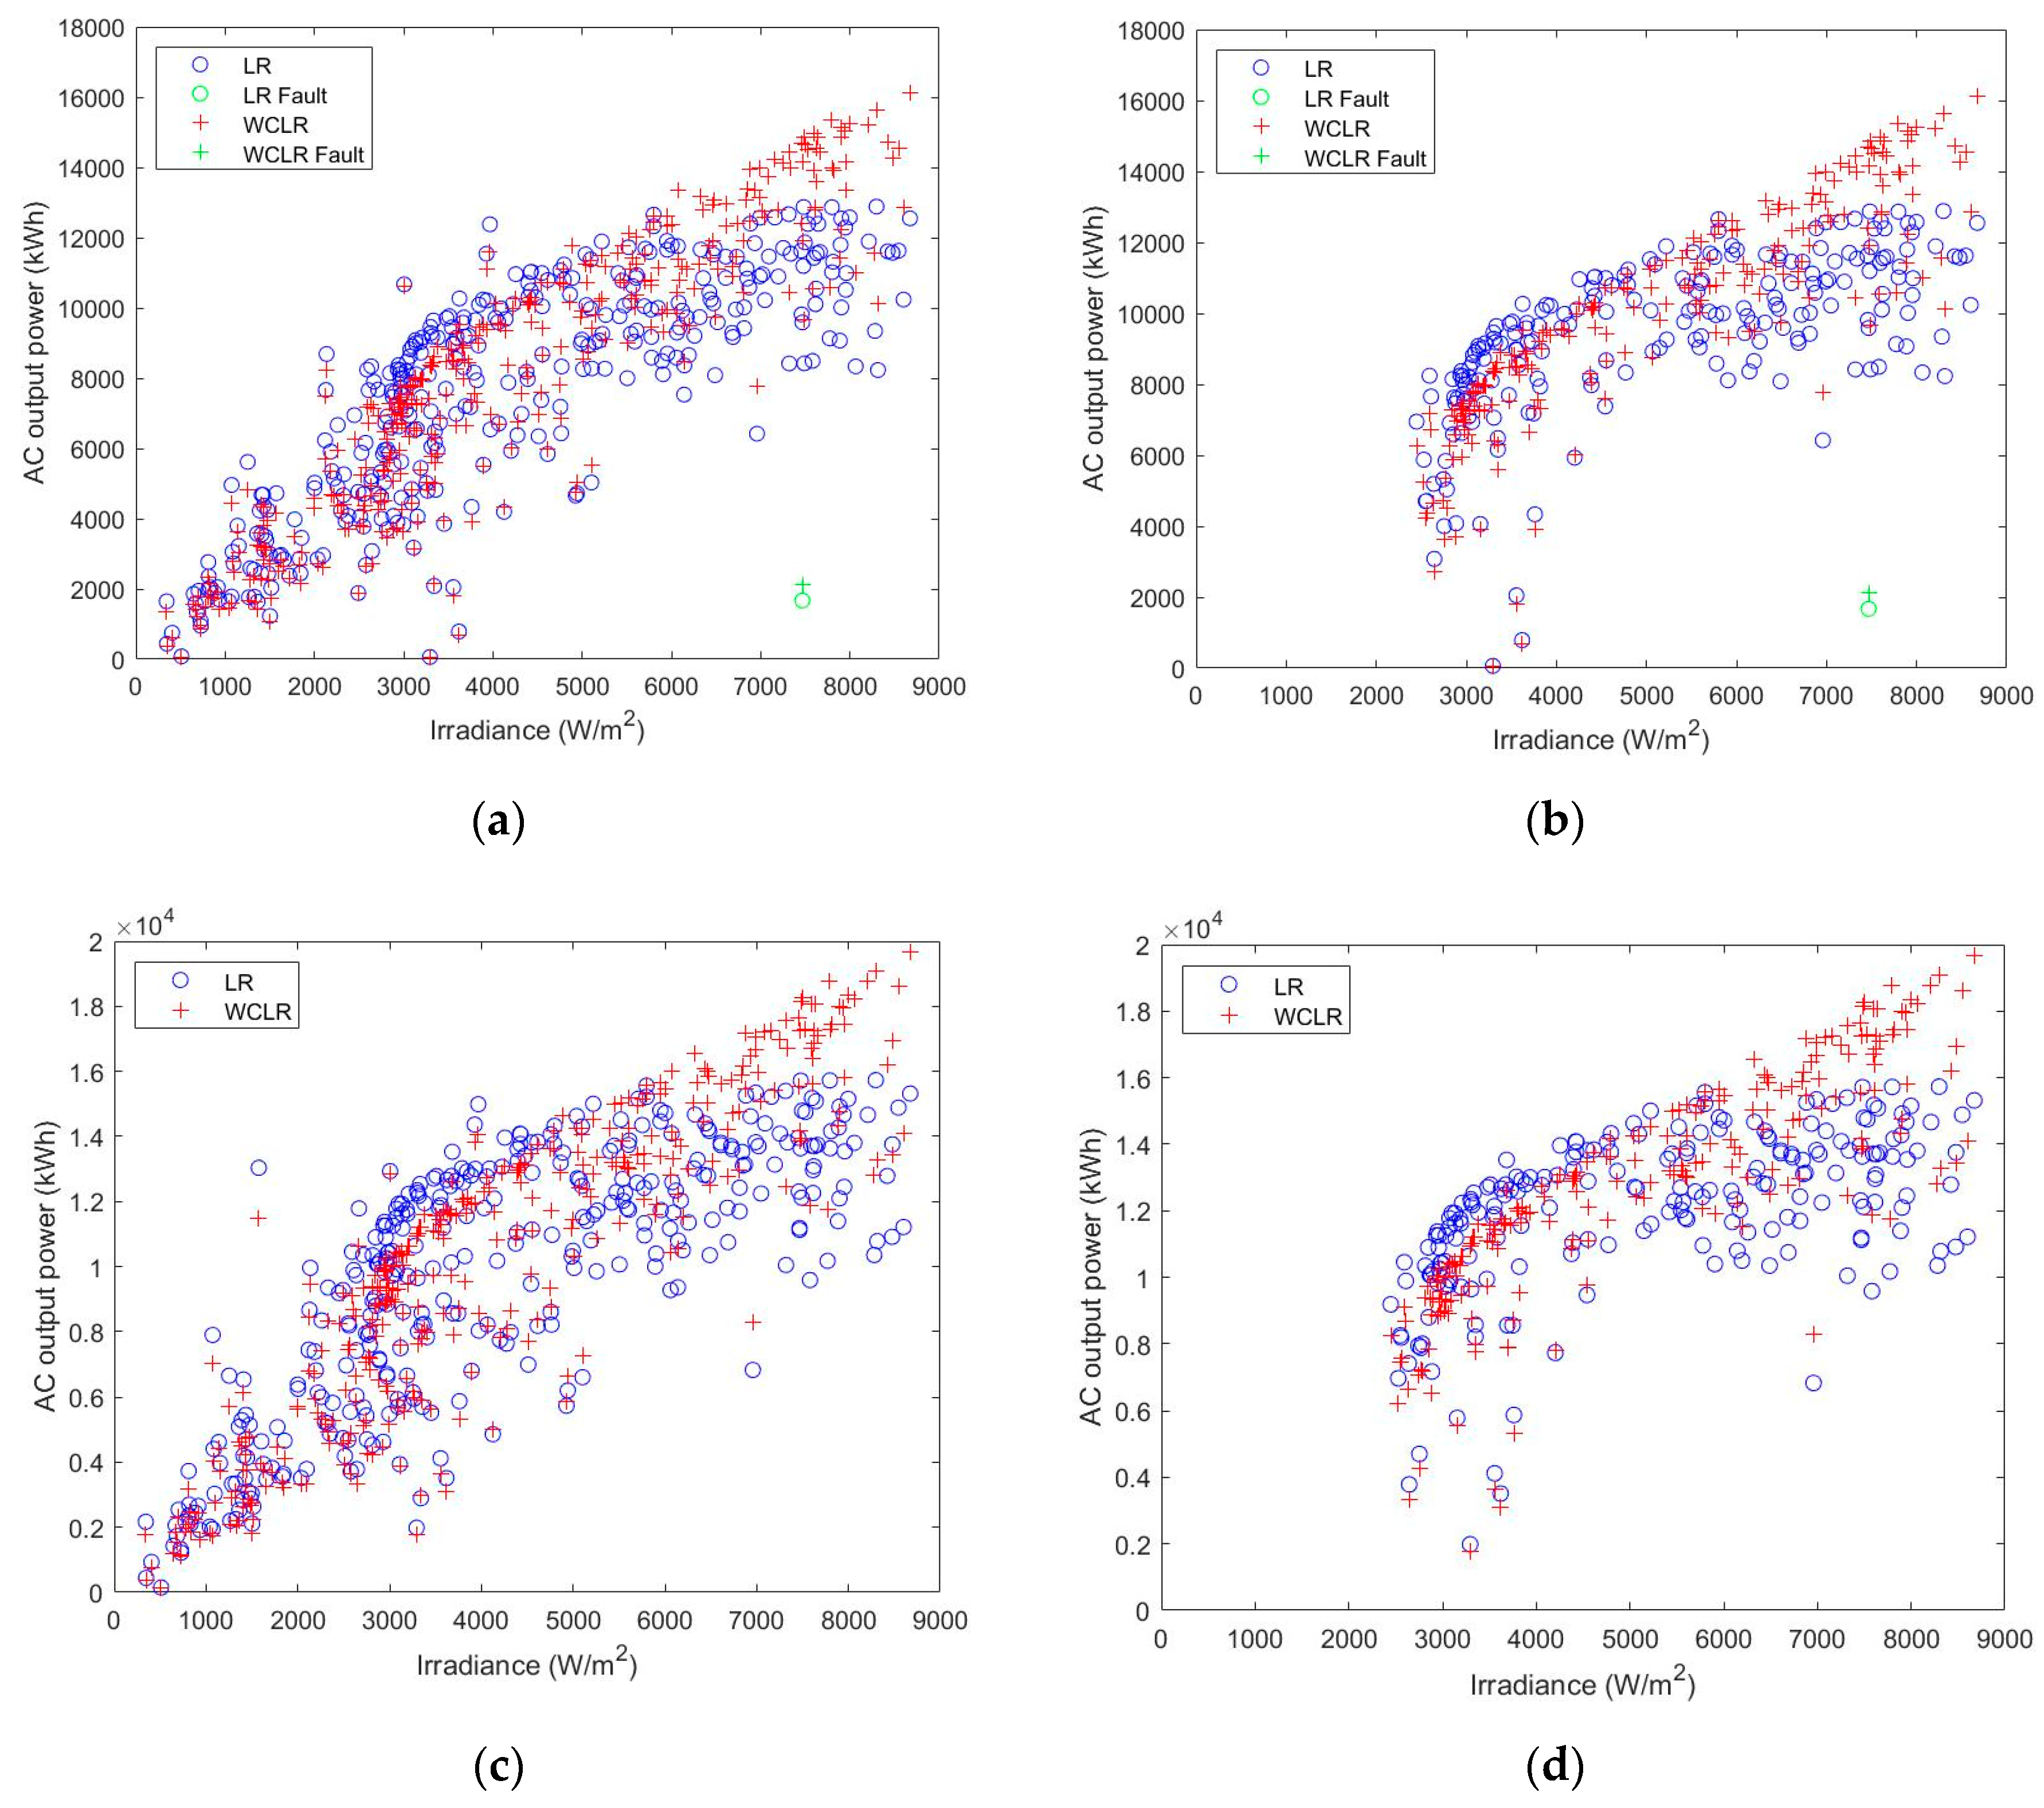
2.1.3. Linear Regression (LR) and Weather-Corrected Linear Regression (WCLR)

The PR index has difficulty classifying the fault state when the solar irradiation value is low. As the PR index has a large error due to the variability characteristics of solar resources when the irradiation is low, LR provides a more accurate representation due to the wide range of input variables and improves the fluctuation error due to the variability in environmental resources. Furthermore, WCLR stabilizes the linear pattern by compensating for the temperature loss of a PV cell.
When a fault occurs in a PV power plant, the coefficient of determination R 2 has a value of 0. On the contrary, the calculated value of R 2 in the normal operation indicates that the irradiance and power value have a strong relation.
E A C , W C = E A C 1 + δ ( T c e l l , a v g T c e l l )
where E A C is the AC output power of the solar plant, and   E A C , W C is the temperature loss-compensated AC output power of the solar plant.

2.2. Solar Power Plant Resource Evaluation Index

2.2.1. Clearness Index (CI)

The clearness index can numerically evaluate the clarity level of the atmosphere and varies under different conditions, such as on clear and cloudy days [28]. This index is a dimension number between zero and one, indicating the fraction of solar radiation that makes it through the atmosphere to strike the Earth’s surface. When performing an evaluation using a clearness index, there is an advantage to performing an accurate numerical evaluation rather than making an ambiguous distinction, such as a clear day versus a cloudy day.
δ = 23.45 sin [ 360 365 ( n 81 ) ]
where δ is the solar declination, and n is the day of the year (a number between 1 and 365).
I o = S C [ 1 + 0.034 cos ( 360 n 365 ) ]
where SC is the solar constant (1367 W / m 2 ), and n is the day of the year (a number between 1 and 365).
H S R = cos 1 ( tanL tan δ )
where H S R is the sunset hour angle, L is the latitude, and δ is the solar declination.
H 0 = 24 π I 0 ( cos L cos δ sin H S R + H S R sinL sin δ )
where H 0 is the extraterrestrial horizontal radiation for the day (kWh/ m 2 /day).
C I ( Clearnessindex ) = H H 0
where H is the irradiation on the day.

2.2.2. Proposed Variable Index (PVI)

A solar power plant has a large amount of its power generation reduced due to the variability in power generation caused by clouds. The output power from renewable energy sources has many fluctuations due to the variability in environmental resources. If the numerical value of variability is accurately evaluated, the performance of solar power plants, taking into account the reduction of power generation due to variability, can be quantitatively evaluated.
P V I = 1 n 1 k = 2 n ( ( E A C , k E D C , k ) 2 ( E A C , k 1 E D C , k 1 ) 2 ) 2 = 1 n 1 k = 2 n | ( E A C , k E D C , k ) 2 ( E A C , k 1 E D C , k 1 ) 2 |
where E A C , k is the k state of AC (output) power, E D C , k is the k state of DC (input) power, E A C , k 1 is the k − 1 state of AC (output) power, and E D C , k 1 is the k − 1 state DC (input) power.

3. Outlier Mining Technique for Photovoltaic Power Plants

3.1. Estimated Error Matrix (EEM)

The estimated error represents the difference between the observed and the estimated values of the regression analysis. The EEM has a large value in the case of fault data due to the large difference between the estimated value of the linear regression analysis and the measured value. Additionally, the EEM can evaluate a higher score in the case of a fault on a clearer day and a lower score in the case of decreased output power due to variability.
E E M = [ y 1 ^ y 1 y n ^ y n ] . / [ y 1 1 y n 1 ] = [ y 1 ^ y 1 y 1 y n ^ y n y n ]
where y i ^ is the estimated value of PV output power, and y i is the measured value of the PV output power.
The EEM represents all the values of the data sets in the form of n × 1 (where n is the data in 365 days). If the maintenance engineer extracts the 1-year data of a PV plant output power, a 365 × 1 matrix is created.

3.2. Estimated Square Error Index (ESEI)

The Estimated Square Error Matrix (ESEM) is created in the form of an n × n matrix by multiplying the estimated error matrix. The distance value between each output is calculated in a diagonal matrix, which can be expressed as an Estimated Square Error Index (ESEI). If a fault occurs in a PV power plant, then the ESEI is larger than the other values due to the high error value and linear algebra technique.
E S E M = E E M E E M
E S E I = d i a g ( E S E M )

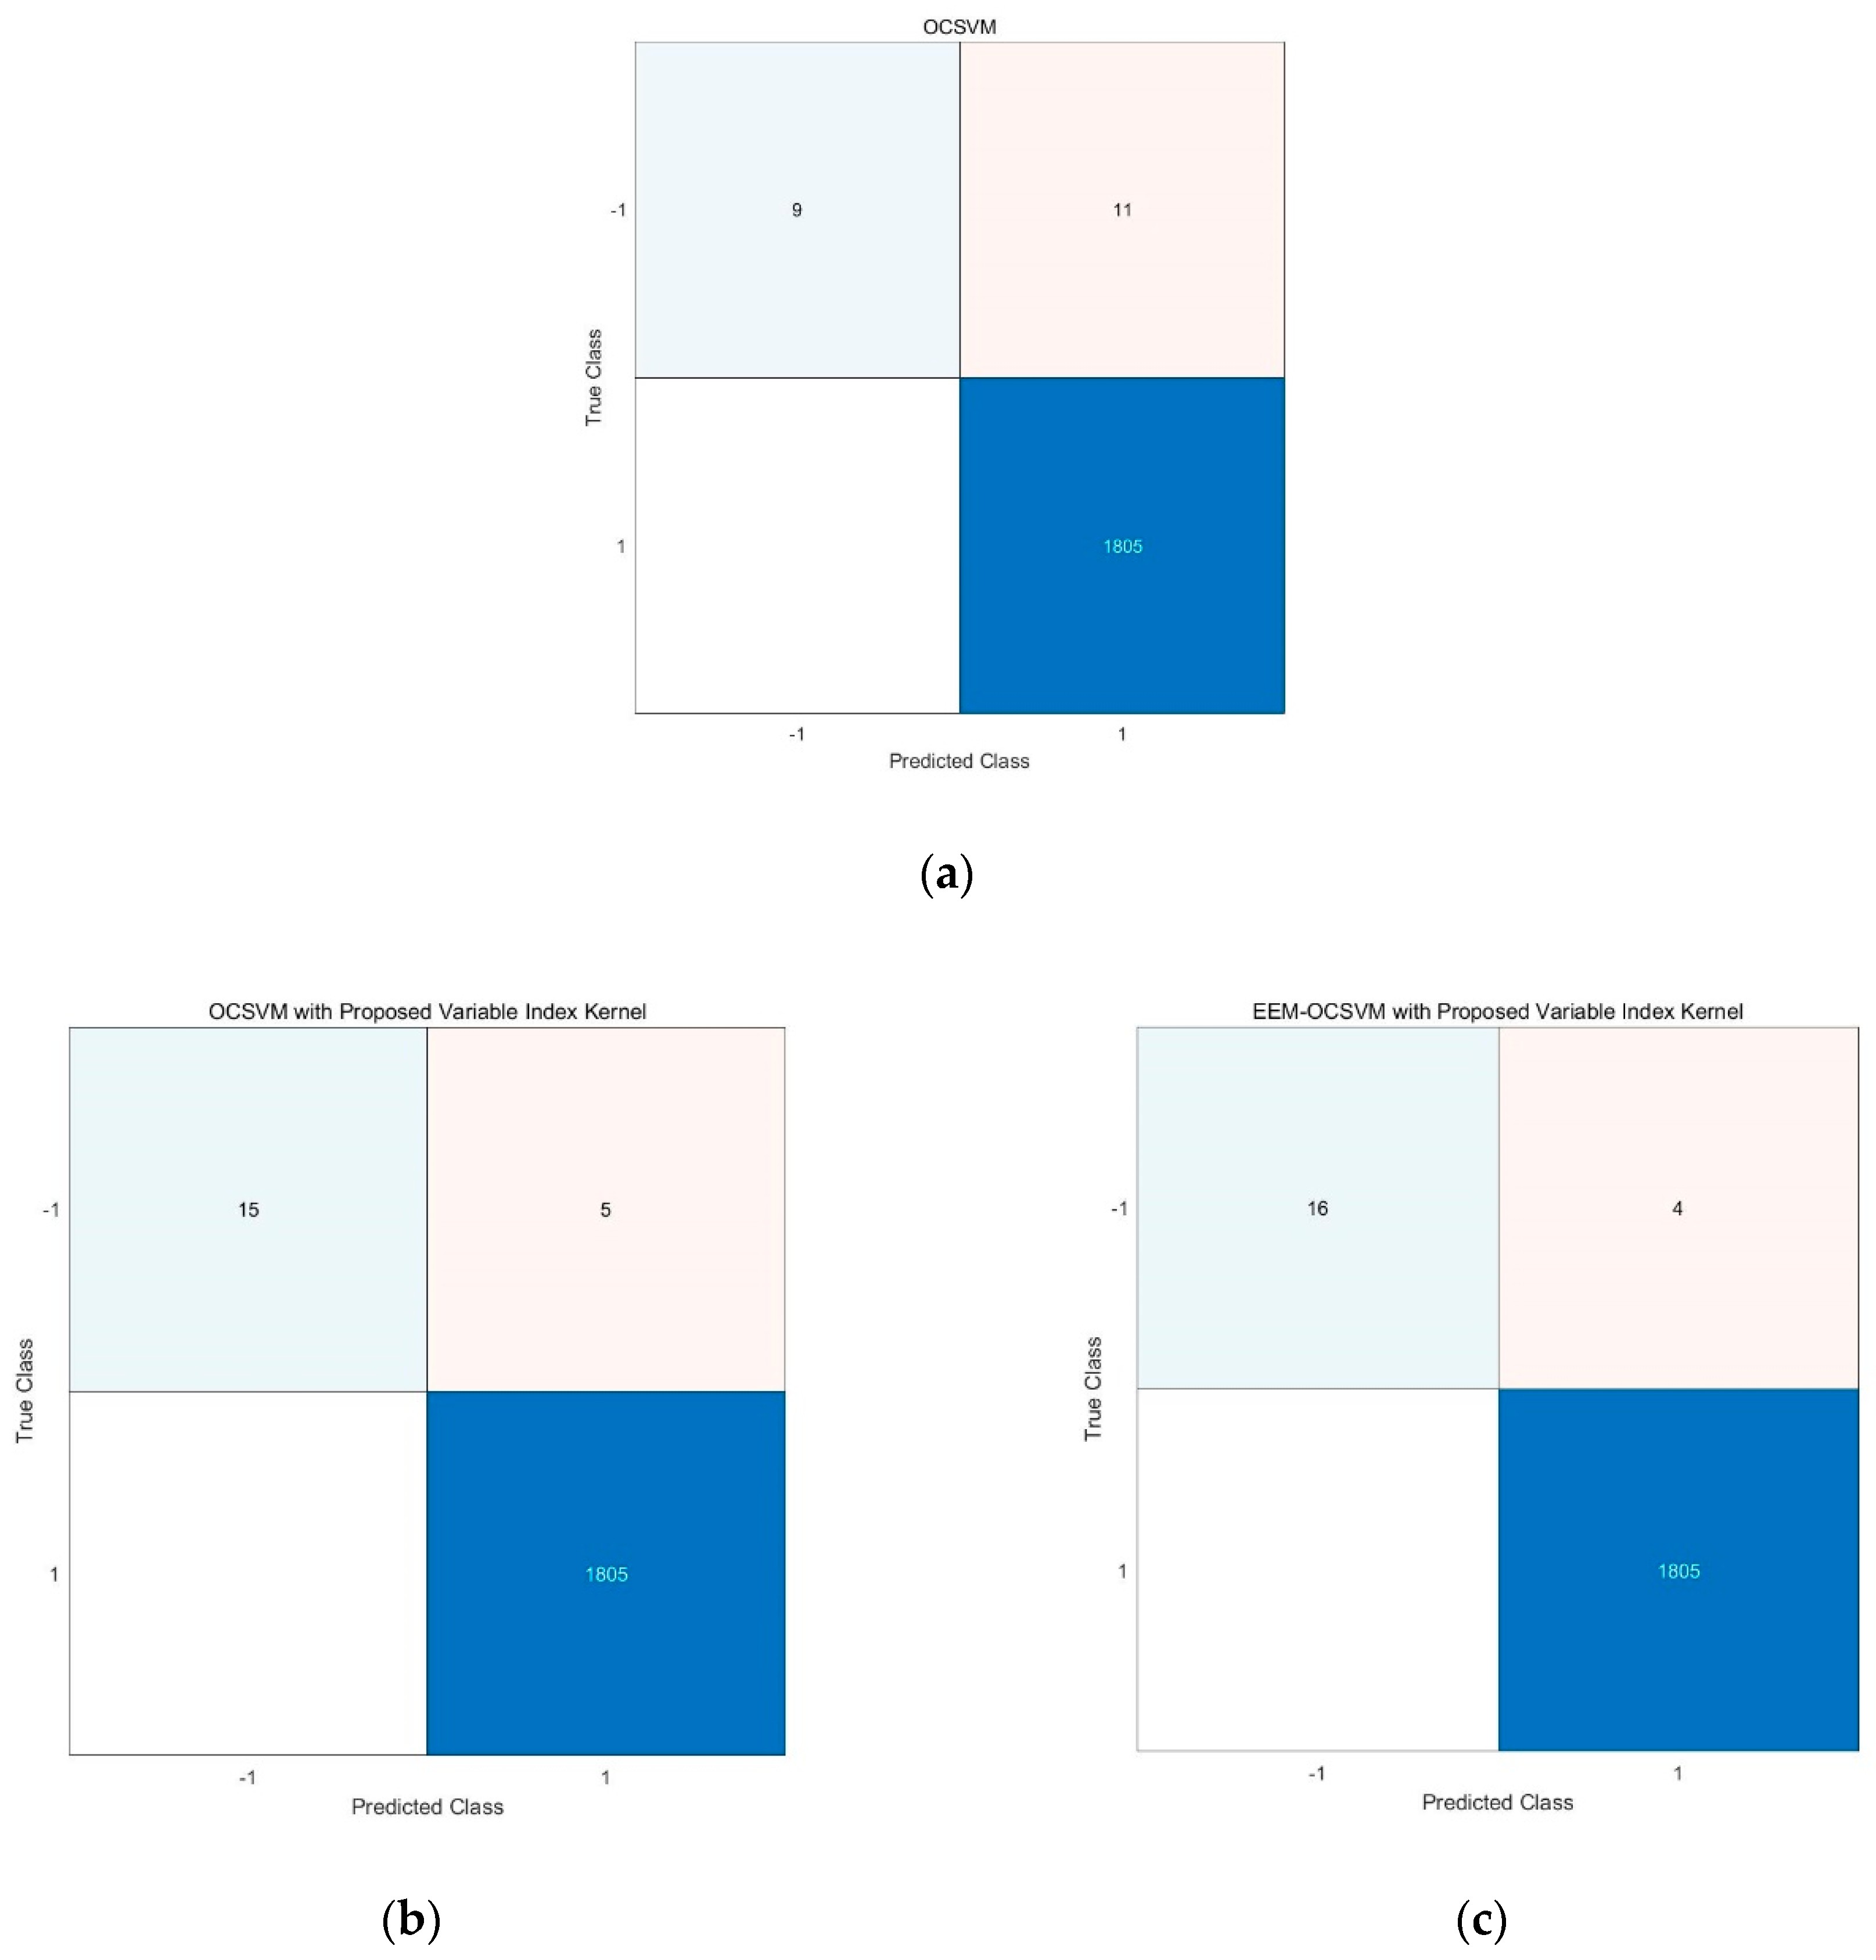
3.3. One-Class Support Vector Machine (OCSVM)

Support Vector Machine (SVM), also known as a support-vector network, is a popular method that analyzes point data to classify multi-labeled data sets. It is a linear classification model that calculates the maximum margin of training data samples. One-Class Support Vector Machine (OCSVM) can identify the “fault” class of photovoltaic output power data.
The OCSVM optimization problem is written as follows:
min w , b , α 1 2 w 2 i = 1 N α i [ y i ( w x i + b ) 1 ]
m a x L ( α i ) α = i = 1 n α i 1 2 i , j = 1 n α i α j y i y j x i T x j
where w is a vector, x x and y x are variables of data sets, and α is a Lagrange multiplier.

3.4. Kernel Function

The kernel function is able to represent a high-dimensional, implicit feature space, without ever computing the data in lower space. It solves the misclassification problem in lower-dimension data sets; the raw data in lower space have to be transformed into a feature vector via kernel mapping:
K ( x i , x j ) = ϕ ( x i ) ϕ ( x j )
where ϕ is the kernel function, and x i and x j are input variables of input space.
The kernel functions applied in this technique are listed below.
-
Polynomial Kernel Function:
K ( x i , x j ) = ( x i x j + 1 ) p
-
Gaussian Kernel Function:
K ( x i , x j ) = exp ( ( x i x j ) 2 2 σ 2 )
-
Sigmoid Kernel Function:
K ( x i , x j ) = tanh ( α x i T y i + c )
where x i and y i are input variables of the input space, p is the degree of the polynomial, σ is the standard deviation, α is the slope, and c is the intercept constant.

4. Case Study

A case study was performed to classify the decreased output power and fault state of a PV power plant by utilizing weather data in South Korea. The PV cell temperature can be calculated by setting the NOCT (Normal Operating Cell Temperature) to 45 degrees. Two power plants located in the mountainous areas of northeast South Korea (latitude 37°45′ N, longitude 128°76′ E) were compared to secure the reliability of the simulation results data. Plant A (altitude: 100 m) generates power through 5136 TS-M390-NA2 modules connected to 318 strings and 16 combiner boxes. Site B (altitude: 500 m) generates power through 5894 TS-M390-NA2 modules connected to 369 strings and 19 combiner boxes.
Table 1 shows the parameters of both power plants’ solar modules, and Figure 1 shows the daily PR and WCPR data of Power Plants A and B for one year.
The PR index has a lot of deviations due to the fluctuation of temperature. Output power variability is compensated for by applying the WCPR, that is, the temperature-corrected health index of a PV power plant. Table 2 shows the value of the health indices of each plant and its conditions. WCPR has a smaller standard deviation, and a comparison of the efficiency values shows that Plant B is the better PV plant. Figure 1b,d show the annual PR and WCPR data of both plants when the clearness index is above 0.5, and Table 2 and Table 3 show the mean and standard deviation of PR and WCPR in the conditions when the clearness index is above 0.5.
An improved method for PV power plant diagnoses is linear regression analysis. The data in Figure 2 show less fluctuation than the results of PR and WCPR (Figure 1) due to the representation of all irradiation values.
Table 4 and Table 5 show the correlation coefficient value of each method, the conditions and the plants. The WCLR compensates for the fluctuation of temperature and shows a higher correlation coefficient value compared to the results of LR (without temperature correction).
Figure 3 and Table 6 show the results of each method. Figure 3b shows how the normal generation data are grouped in contrast to Figure 3a (without the proposed variable index of the linear kernel function). By mapping the reduction in output power due to the variability in the feature space through the kernel function of the PVI index, the unchanged characteristics of the fault state and the variability characteristics of the normal power generation of PV power plants can be better identified. When the EEM technique is applied with the kernel function, Figure 3c and Table 6 show a higher classification margin and identification rate.
Figure 4 shows the confusion matrix of each method and also checks the classification accuracy ((a) OCSVM, (b) OCSVM with the proposed variable index of the linear kernel function, (c) EEM-OCSVM with the proposed variable index of the linear kernel function). In this matrix, 1 is the normal state and −1 is the fault state of the photovoltaic plant; the true and predicted class accuracy values are also checked.

5. Conclusions

This paper presents a method to recognize and classify abnormal output power and the fault state of a solar power plant through an artificial intelligence method. The fluctuation of the PR index due to the ambient temperature of a solar power plant was improved by applying the CI index, as well as by checking the standard deviation value of each of the conditions and plants. Through the application of linear regression, the generation data obtained on a low-irradiation day were improved due to the representation of all values. As a result of applying the temperature correction equation and WCPR index, the output power was stabilized to compensate for the temperature loss of the PV module, and this was numerically demonstrated through the value of the mean, the standard deviation and the correlation coefficient. By evaluating the level of the variability output pattern of the solar power plant and mapping the input variable into the feature space through the kernel function, it was possible to more accurately classify anomalies in output power and the fault state. The recognition rate of the fault state and anomalies in output power was improved, and the classification rate of the fault state was checked by calculating and applying linear algebra such as the EEM and the kernel technique of the proposed variable index. Improved recognition rates of 0.3% and 0.4% were obtained by applying the proposed variable index kernel technique and the proposed EEM variable index kernel technique. This paper proposes a method for identifying major faults in large solar power plants, while the current detection of minor faults, such as cell cracks and leakages, should be managed through on-site diagnosis. Additionally, the classification accuracy can be further improved through maintenance techniques such as thermal imaging and I-V checker inspections.

Author Contributions

Conceptualization, J.-H.S.; methodology, J.-H.S.; writing—original draft preparation, J.-H.S.; writing—review and editing, J.-H.S. and J.-O.K.; supervision J.-O.K.; All authors have read and agreed to the published version of the manuscript.

Funding

This research received no external funding.

Conflicts of Interest

The authors declare no conflict of interest.

References

  1. IEC 61724-1:2017. Photovoltaic System Performance—Part 1: Monitoring; IEC: Geneva, Switzerland, 2017. [Google Scholar]
  2. Basson, H.A.; Pretorius, H.A. Risk mitigation of performance ratio guarantees in commercial photovoltaic systems. In Proceedings of the International Conference on Renewable Energies and Power Qualty (ICREPQ’ 16), Madrid, Spain, 4–6 May 2016; pp. 120–125. [Google Scholar]
  3. Urrejola, E.; Antonanzas, J.; Ayala, P.; Salgado, M.; Ramírez-Sagner, G.; Cortés, C.; Pino, A.; Escobar, R. Effect of soiling and sunlight exposure on the performance ratio of photovoltaic technologies in santiago, Chile. Energy Convers. Manag. 2016, 114, 338–347. [Google Scholar] [CrossRef]
  4. Bizzarri, F.; Brambilla, A.; Caretta, L.; Guardiani, C. Monitoring performance and efficiency of photovoltaic parks. Renew. Energy 2015, 78, 314–321. [Google Scholar] [CrossRef]
  5. Ventura, C.; Tina, G.M. Utility scale photovoltaic plant indicies and models for on-line monitoring and fault detection purposes. Electr. Power Syst. Res. 2016, 136, 43–56. [Google Scholar] [CrossRef]
  6. Chine, W.; Mellit, A.; Massi Pavan, A.; Kalogirou, S.A. Fault detection method for grid connected photovoltaic plants. Renew. Energy 2014, 66, 99–110. [Google Scholar] [CrossRef]
  7. Dierauf, T.; Growitz, A.; Kurtz, S.; Cruz, J.L.B.; Riley, E.; Hansen, C. Weather-Corrected Performance Ratio; NREL: Golden, CO, USA, 2013. [Google Scholar]
  8. Platon, R.; Martel, J.; Woodruff, N. Online Fault Detection in PV Systems. IEEE Trans. Sustain. Energy 2015, 6, 1200–1207. [Google Scholar] [CrossRef]
  9. Lima, L.C.; Ferreira, L.A.; Lima Moraris, F.D.B. Performance Analysis of a grid connected photovoltaic system in northeastern Brazil. Energy Sustain. Dev. 2017, 37, 79–85. [Google Scholar] [CrossRef]
  10. Chao, K.H.; Ho, S.H.; Wang, M.H. Modeling and fault diagnosis of a photovoltaic system. Electr. Power Syst. Res. 2008, 78, 97–105. [Google Scholar] [CrossRef]
  11. Guasch, D.; Silvestre, S.; Calatayud, R. Automatic failure detection in photovoltaic systems. In Proceedings of the 3rd World Conference on Photovoltaic Energy Conversion, Osaka, Japan, 11–18 May 2003; Volume 3, pp. 2269–2271. [Google Scholar]
  12. Hamdaoui, M.; Rabhi, A.; Hajjaji, A.E.; Rahmoun, M.; Azizi, M. Monitoring and control of the performances for photovoltaic systems. In Proceedings of the International Renewable Energy Congress, Sousse, Tunisia, 5–7 November 2009; pp. 69–71. [Google Scholar]
  13. Takashima, T.; Yamaguchi, J.; Otani, K.; Oozeki, T.; Kato, K.; Ishida, M. Experimental studies of fault location in PV module strings. Sol. Energy Mater. Sol. Cells 2009, 93, 1079–1082. [Google Scholar] [CrossRef]
  14. Schirone, L.; Califano, F.P.; Pastena, M. Fault detection in a photovoltaic plant by time domain reflectometry. Prog. Photovolt. 1994, 2, 35–44. [Google Scholar] [CrossRef]
  15. Dhimish, M.; Holmes, V.; Mehrdadi, B.; Dales, M. Multi-layer photovoltaic fault detection algorithm. High Volt. 2017, 4, 244–252. [Google Scholar] [CrossRef]
  16. Wang, J.Y.; Qian, Z.; Zareipour, H.; Wood, D. Performance assessment of photovoltaic modules based on daily energy generation estimation. Energy 2018, 165, 1160–1172. [Google Scholar] [CrossRef]
  17. Firth, S.K.; Lomas, K.J.; Rees, S.J. A simple model of PV system performance and its use in fault detection. Sol. Energy 2010, 84, 624–635. [Google Scholar] [CrossRef] [Green Version]
  18. Chouder, A.; Silvestre, S. Automatic supervision and fault detection of PV systems base on power losses analysis. Energy Convers. Manag. 2010, 51, 1929–1937. [Google Scholar] [CrossRef]
  19. Drews, A.; Keizer, A.C.; Beyer, H.G.; Lorenz, E.; Betcke, J.; Sark, W.G.J.H.M.; Heydenreich, W.; Wiemken, E.; Stettler, S.; Toggweiler, P.; et al. Monitoring and remote failure detection of grid-connected PV systems based on satellite observations. Sol. Energy 2007, 81, 548–564. [Google Scholar] [CrossRef] [Green Version]
  20. Chouder, A.; Silvestre, S.; Sadaoui, N.; Rahmani, L. Modeling and simulation of a grid connected PV system based on the evaluation of main PV module parameters. Simul. Model. Pract. Theory 2012, 20, 46–58. [Google Scholar] [CrossRef]
  21. Mellit, A.; Kalogirou, S.A. Artificial intelligence techniques for photovoltaic applications: A review. Prog. Energy Combust. Sci. 2008, 34, 574–632. [Google Scholar] [CrossRef]
  22. Platon, R.; Pelland, S.; Poissant, Y. Modelling the power production of a photovoltaic system: Comparison of Sugeno-type fuzzy logic and pvsat-2 models. In Proceedings of the ISES-Europe Solar Conference (EuroSun2012), Rijeka, Croatia, 18–20 September 2012. [Google Scholar]
  23. Mellit, A.; Kalogirou, S.A. ANFIS-based modelling for photovoltaic power supply system: A case study. Renew. Energy 2011, 36, 250–258. [Google Scholar] [CrossRef]
  24. Mellit, A.; Kalogirou, S.A. Chapter 2-1-D -A Survey on the application of artificial intelligence techniques for photovoltaic systems. In McEvoy’s Handbook of Photovoltaics, 3rd ed.; Academic Press: San Diego, CA, USA, 2018; pp. 735–761. [Google Scholar]
  25. Benedetti, M.D.; Leonardi, F.; Messina, F.; Santoro, C.; Vasilakos, A. Anomaly detection and predictive maintenance for photovoltaic systems. Neurocomputing 2018, 310, 59–68. [Google Scholar] [CrossRef]
  26. Zhao, Y.; Liu, Q.; Li, D.; Kang, D.; Lv, Q.; Shang, L. Hierarchical Anomaly Detection and Multimodal Classification in Large-Scale Photovoltaic Systems. IEEE Trans. Sustain. Energy 2019, 10, 1351–1361. [Google Scholar] [CrossRef]
  27. Pavan, A.M.; Mellit, A.; Pieri, D.D.; Kalogirou, S.A. A comparison between BNN and regression polynomial methods for the evaluation of the effect of soiling in large scale photovoltaic plants. Appl. Energy 2013, 108, 392–401. [Google Scholar] [CrossRef]
  28. Masters, G. Renewable and Efficient Electric Power Systems; John Wiley & Sons: Hoboken, NJ, USA, 2004. [Google Scholar]
Figure 1. The Performance Ratio (PR) and Weather-Corrected Performance Ratio (WCPR) of each plant and their conditions. (a) Plant A (2 MW); (b) Plant A (2 MW)—CI > 0.5; (c) Plant B (2.3 MW); (d) Plant B—CI > 0.5.
Energies 13 04584 g001aEnergies 13 04584 g001b
Figure 2. The Linear Regression (LR) and WCLR of each plant and its conditions. (a) Plant A (2 MW); (b) Plant A (2 MW)—CI > 0.5; (c) Plant B (2.3 MW); (d) Plant B—CI > 0.5.
Energies 13 04584 g002
Figure 3. Proposed method of PV fault detection (1-year data). (a) One-Class Support Vector Machine (OCSVM); (b) OCSVM with the proposed variable index of the linear kernel function; (c) Estimated Error Matrix (EEM)-OCSVM with the proposed variable index of the linear kernel function.
Energies 13 04584 g003
Figure 4. Confusion matrix of each method. (a) OCSVM, (b) OCSVM with the proposed variable index of the linear kernel function; (c) EEM-OCSVM with the proposed variable index of the linear kernel function.
Energies 13 04584 g004
Table 1. Parameters for the photovoltaic (PV) module of Power Plants A and B.
PV ModuleTS-M390-NA2
Temperature coefficient of Pmpp−0.5 [%]
Cell Efficiency15.5 [%]
Table 2. Mean and standard deviation values of PR, PR (CI > 0.5), WCPR, WCPR (CI > 0.5)—Plant A.
MEANSTANDARD DEVIATION
PR—Plant A0.54080.1812
PR (CI > 0.5)—Plant A0.52930.1574
WCPR—Plant A0.53640.1467
WCPR (CI > 0.5)—Plant A0.54240.1158
Table 3. Mean and standard deviation values of PR, PR (CI > 0.5), WCPR, WCPR (CI > 0.5)—Plant B.
MEANSTANDARD DEVIATION
PR—Plant B0.62470.2277
PR (CI > 0.5)—Plant B0.61760.1917
WCPR—Plant B0.61780.1826
WCPR (CI > 0.5)—Plant B0.62860.1346
Table 4. Correlation coefficient values of LR, LR (CI > 0.5), WCLR, WCLR (CI > 0.5)—Plant A.
R 2
LR—Plant A0.6357
LR (CI > 0.5)—Plant A0.3713
WCLR—Plant A0.8060
WCLR (CI > 0.5)—Plant A0.7000
Table 5. Correlation coefficient values of LR, LR (CI > 0.5), WCLR, WCLR (CI > 0.5)—Plant B.
R 2
LR—Plant B0.5903
LR (CI > 0.5)—Plant B0.2967
WCLR—Plant B0.7944
WCLR (CI > 0.5)—Plant B0.6998
Table 6. The classification accuracy of OCSVM, OCSVM with the proposed variable index of the linear kernel, EEM-OCSVM with the proposed variable index of the linear kernel (5 years of daily data, 1825 data sets).
TPTNFPFNError Rate [%]Classification Accuracy [%]
OCSVM180591100.699.4
OCSVM with Proposed Variable Index Kernel180515500.399.7
EEM-OCSVM with Proposed Variable Index Kernel180516400.299.8
TP is True Positive, TN is True Negative, FP is False Positive, and FN is False Negative.

