Article

Techno-Economic and Environmental Assessment of Biomass Gasification and Fischer–Tropsch Synthesis Integrated to Sugarcane Biorefineries

by
Jéssica Marcon Bressanin
1,2,*,
Bruno Colling Klein
2,
Mateus Ferreira Chagas
2,3,
Marcos Djun Barbosa Watanabe
1,2,
Isabelle Lobo de Mesquita Sampaio
1,2,
Antonio Bonomi
2,
Edvaldo Rodrigo de Morais
1,2 and
Otávio Cavalett
1,2,4
1
School of Food Engineering (FEA), University of Campinas (UNICAMP), 13083-862 Campinas, Sao Paulo, Brazil
2
Brazilian Biorenewables National Laboratory (LNBR), Brazilian Center for Research in Energy and Materials (CNPEM), 13083-970 Campinas, Sao Paulo, Brazil
3
School of Chemical Engineering (FEQ), University of Campinas (UNICAMP), 13083-852 Campinas, Sao Paulo, Brazil
4
Department of Energy and Process Engineering, Industrial Ecology Programme, Norwegian University of Science and Technology (NTNU), NO-7034 Trondheim, Norway
*
Author to whom correspondence should be addressed.
Energies 2020, 13(17), 4576; https://doi.org/10.3390/en13174576
Submission received: 23 July 2020 / Revised: 28 August 2020 / Accepted: 2 September 2020 / Published: 3 September 2020
(This article belongs to the Special Issue Analysis of Bio-Based Products for the Circular Economy)

Abstract

:
Large-scale deployment of both biochemical and thermochemical routes for advanced biofuels production is seen as a key climate change mitigation option. This study addresses techno-economic and environmental aspects of advanced liquid biofuels production alternatives via biomass gasification and Fischer–Tropsch synthesis integrated to a typical sugarcane distillery. The thermochemical route comprises the conversion of the residual lignocellulosic fraction of conventional sugarcane (bagasse and straw), together with eucalyptus and energy-cane as emerging lignocellulosic biomass options. This work promotes an integrated framework to simulate the mass and energy balances of process alternatives and incorporates techno-economic analyses and sustainability assessment methods based on a life-cycle perspective. Results show that integrated biorefineries provide greenhouse gas emission reduction between 85–95% compared to the fossil equivalent, higher than that expected from a typical sugarcane biorefinery. When considering avoided emissions by cultivated area, biorefinery scenarios processing energy-cane are favored, however at lower economic performance. Thermochemical processes may take advantage of the integration with the typical sugarcane mills and novel biofuels policies (e.g., RenovaBio) to mitigate some of the risks linked to the implementation of new biofuel technologies.

1. Introduction

The impact of increasing greenhouse gas (GHG) emissions on climate and the high energy dependence on fossil fuels are alarming issues worldwide. These concerns have encouraged many countries to search for ways to diversify their energy matrices by increasing the proportion of renewable and locally available energy resources. Among the key climate mitigation options, bioenergy plays an important role in many global scenarios focusing on the reduction of fossil fuels dependence for achieving low temperature stabilization targets [1,2]. For example, the different future scenarios described in the Shared Socioeconomic Pathways (SSPs) indicate that the demand for dedicated energy crops for bioenergy can range from less than 5 up to 20 billion tonnes per year by 2100, corresponding to about 200–1500 million hectares of land for such crops [3,4].
In Brazil, incentives to expand the use of ethanol produced from sugarcane juice—hereafter typical first-generation (1G) ethanol—as substitution to fossil gasoline began in the 1970s as a response to the oil crisis. Since then, Brazilian ethanol production costs have declined continuously mainly due to the improvements in agricultural yields and the scale and efficiency gains in the conversion processes [5,6,7]. As a consequence, 1G ethanol has been increasing its share in the energy matrix and significantly contributing to GHG emissions reduction in the transport sector [8]. However, one of the major challenges for the Brazilian energy sector is to continue increasing the bioenergy production in view of the projected long-term growth in energy demands worldwide [9,10] and the climatic commitments pledged in the 21st Conference of the Parties (COP 21) [8,11]. In this regard, the Brazilian government has been developing since 2016 the new National Policy on Biofuels, so-called RenovaBio. This policy came into effect in 2020 and created mechanisms to provide financial incentives to the different liquid biofuel options. These incentives are calculated based on the individual performance of the biofuel production units and proportional to the potential to reduce the GHG emission in comparison to fossil equivalents [12,13].
In this context, innovative second-generation (2G) technologies may provide biofuels, electricity, and chemicals from lignocellulosic material (LCM), such as woody biomass, semi-perennial grasses and agricultural residues, allowing further environmental benefits [14,15]. However, 2G technologies have not yet achieved full commercial scale. Among several alternatives for 2G biofuels, thermochemical routes for conversion of biomass are robust and flexible enough to admit a wide range of feedstock types [16]. In the gasification process, the biomass is partially oxidized with air, steam, or oxygen at high temperatures into a gas mixture, called synthesis gas or syngas. Products from syngas conversion include electricity, hydrogen, ammonia, mixed alcohols, methanol, Fischer–Tropsch (FT) liquid fuels, dimethyl ether (DME), ethanol via acetic acid synthesis and hydrogenation, gasoline via methanol-to-gasoline (MTG), and others [17]. The use of FT technology for biomass-derived syngas conversion may offer the additional benefit of producing fuels that are not easily displaced by ethanol, such as fossil diesel and aviation fuels. Recent literature shows that the economic performance of biorefineries for advanced liquid biofuels derived from gasification of biomass followed by FT synthesis mostly depends on the policy context, as well as the feedstock and capital costs [18,19,20,21,22,23,24,25]. In general, environmental studies show that the life-cycle GHG emissions of advanced liquids biofuels derived from FT technology can be reduced by more than 76% in comparison to fossil fuels, depending on the feedstock and methodological assumptions [21,25,26,27,28,29,30,31].
The integration between 1G and 2G technologies is expected to increase overall process efficiency and mitigate some of the risks linked to the implementation of new advanced biofuel technologies. Co-location strategies take advantage of the shared infrastructure, increased potential for energy integration, and increased market opportunities with a larger portfolio of products with different applications (e.g., aviation fuels and light- and heavy-duty vehicles). Besides numerous combinations of biomass options and thermochemical technologies evaluated in the literature, the possibilities for integrating the gasification followed by FT synthesis with the well-established typical 1G sugarcane distilleries have not been fully addressed and explored. The few recent studies in the literature considering this integration [30,32,33] highlighted that there are still many promising feedstock types and process designs to be assessed. In this perspective, the possibility to examine process alternatives with the use of energy-cane (EC) and eucalyptus wood chips as substitute or complementary to the conventional sugarcane (CS) biomass is very attractive. EC is a variety of cane with higher fiber content and higher potential yields than CS [34,35,36,37,38]. Therefore, the use of EC can be considered in substitution to CS since the focus of the process is the conversion of LCM to advanced liquid fuels. Eucalyptus is also an interesting biomass to complement both CS and EC, facilitating the plant operation during the off-season. This hardwood has already a well-established production chain in Brazil, with substantial production volumes [39], high yields [40,41,42,43], and competitive costs [41,42]. Eucalyptus still has the possibility of being cultivated in marginal areas not usually suitable for agriculture [44], which can ultimately contribute to mitigating any additional pressure for productive land for biofuel production.
In such a context, this work assesses techno-economic and environmental performance of advanced liquid biofuels production options. Biomass gasification and FT synthesis integrated to a 1G sugarcane biorefinery using CS, EC, and eucalyptus as feedstock are considered. An integrated framework to simulate the mass and energy balances of process alternatives and to incorporate techno-economic analyses and sustainability assessment methods based on the life-cycle perspective is applied. Therefore, the studied scenarios consider emerging biomass options (e.g., EC and eucalyptus) and the integrated biochemical and thermochemical biomass conversion processes to address the benefits and tradeoffs of these biofuel production alternatives in terms of technical, economic, and environmental aspects.

2. Materials and Methods

This analysis considers the entire value chain of the selected biorefinery pathways, i.e., both the agricultural (biomass production and logistics) and industrial phases (biomass conversion into different products) in an integrated assessment framework. The agricultural operations are assessed using a spreadsheet-based model, so-called CanaSoft, developed at the Brazilian Biorenewables National Laboratory (LNBR) in the Virtual Sugarcane Biorefinery (VSB) context. The VSB is a computer simulation platform that enables evaluating different innovative routes and technologies associated with the production chain of sugarcane-and other biomasses-both technically and regarding the three pillars of sustainability: economic, environmental, and social impacts [45].
The use of models to simulate and predict a process design operation allows the assessment of the technical parameters involved considering various biorefinery pathways. Nevertheless, many process design analyses use hard convergence simulation models to represent biomass conversion systems, e.g., Aspen Plus® software—based simulations approaches [30,46,47,48,49], and have inherent communication limitations between the different value chain modeling. Therefore, a novel framework based on spreadsheets is developed to obtain material and energy balances of industrial biomass conversion processes in view of reducing both time and complexity for easy compatibilization of biomass production, conversion modeling approaches, and future efforts related to the optimization of multiple biorefinery scenarios. Data from biomass production and conversion models, such as life-cycle inventories (LCI) and production costs, are then used for economic and environmental assessments. The structure of the used analysis framework is shown in Figure 1.

2.1. Biorefinery Configurations

This study considers a typical 1G biorefinery processing conventional sugarcane (scenario 1G-CS). This reference scenario is then compared against a biorefinery design based on the integration of a thermochemical technology with 1G sugarcane biorefinery (1G2G) processing sugarcane and eucalyptus. Two sugarcane varieties are considered for 1G2G biorefinery scenarios: conventional sugarcane (1G2G-CS) and energy-cane (1G2G-EC). In these two scenarios, the residual sugarcane LCM and additional inputs from eucalyptus wood chips are used in the 2G thermochemical process during the sugarcane season. During the sugarcane off-season, eucalyptus wood chips feed the thermochemical conversion route to keep the same processing capacity year-around. The considered 2G-thermochemical pathway includes the gasification of LCM and the further conversion of syngas into liquid biofuels via FT synthesis. Electricity is co-produced in a combined cycle power system.

2.2. Biomass Production Systems

The composition of residual LCM from sugarcane (straw and bagasse) [45] and eucalyptus wood chips as feedstock [50] is relatively similar regarding their carbon, hydrogen, and oxygen contents. The 2G thermochemical operation tolerates both biomasses as feedstock. The LCI and production costs associated with CS and straw production systems, necessary for environmental and economic evaluations, respectively, are obtained using CanaSoft spreadsheet-based model [51]. The entire biomass production system is included in the assessment, comprising pre-planting operations, soil preparation, mechanical planting, cultivation (sugarcane plant and ratoon), mechanical harvesting, and biomass transport to the industrial site. In the present work, the CanaSoft model was expanded and employed including EC and eucalyptus production systems. As the EC production system is not yet consolidated in Brazil, the production parameters are based on the literature and empirical data from the few available field experiments in Brazil [38,52,53,54]. The key parameters for EC agricultural system are described and compared to CS in Table 1, while Table 2 summarizes the main parameters for eucalyptus production systems. Further information about the CanaSoft model and default modeling parameters for sugarcane is found in Bonomi et al. [45].
The amount of sugarcane straw is estimated as 140 kg (dry mass) per tonne of CS stalks. It is considered 50% of straw recovery, of which 4.8% is collected with CS stalks as vegetal impurities and the remaining is recovered compacted in bales. In the EC production system, all the sugarcane straw is collected with the stalks using the integral harvesting system. Diesel is consumed in agricultural mechanical operations, in the transportation of biomass from the field to industrial plant, and transportation of industrial residues and agricultural inputs. It is considered that fossil diesel is replaced by green diesel from FT synthesis when this technological pathway is considered.

2.3. Biomass Conversion Systems

For the 1G ethanol production process, scenarios for CS and EC previously simulated using the software Aspen Plus® in the VSB context is taken as reference [36,45]. These scenarios are reduced in complexity to a black box spreadsheet-model and linearly corrected to allow changes in sugarcane capacity and other key modeling parameters. In both CS or EC processing, a modern autonomous distillery processing 4 million tonnes of cane per year and producing hydrous ethanol (92.6–93.8% w/w) is considered, as described by Bonomi et al. [45]. A season is assumed to consist of 200 working days. After cane reception, electric drivers are employed for milling, thus separating bagasse and juice. Juice receives a chemical treatment to remove impurities. The clarified juice is concentrated and sent to the fermentation unit, in which sugar is converted to ethanol and carbon dioxide by yeasts. Ethanol is recovered from wine in the distillation process, where vinasse is produced and sent back to the field for fertirrigation. The 1G plant’s steam and electricity requirements are supplied by bagasse and straw combustion in cogeneration systems (CHP) in scenario 1G-CS and by the integrated thermochemical plant in scenarios 1G2G-CS and 1G2G-EC. In these integrated 1G2G scenarios, the utilities area is also shared by the combined plants. Sugarcane dry cleaning is not considered. Bagasse from the extraction section is directed to the thermochemical process, as well as the sugarcane straw. When EC is processed instead of CS, as the straw is mixed with the stalks, straw is fed in 2G process together with bagasse. The required capacity of the milling drivers depends on the amount of fiber processed. Sugar extraction is around 95% for CS milling and 87% for EC, which is estimated based on the assumption that the bagasse composition is approximately the same in both cases.
The modeling of 2G thermochemical technologies comprises the development of detailed spreadsheet-based calculations of mass and energy balances. Such models describe a set of unit operations and are based on literature data from commercial and pilot scale of this technology. During the sugarcane season, besides residual LCM from cane (bagasse for both CS and EC biomass and straw for CS), an additional 0.3 million tonnes of eucalyptus wood chips feeds the thermochemical conversion route to ensure the production energy to supply process requirements, including the 1G unit. In sugarcane off-season, assumed as 130 working days, a sufficient amount of eucalyptus is used in the plant to keep equal LCM hourly processing capacity compared to the season period. Advanced liquid transportation biofuels are produced by combining gasification, FT catalytic synthesis, and refining technologies. Steam and electricity are produced to supply the process energy demand or sold to the market in the case of surplus electricity. Figure 2 illustrates the main unit processes for the considered biorefinery scenarios for advanced liquids biofuels production via biomass gasification and FT synthesis integrated to a 1G sugarcane biorefinery.
The thermochemical processes can be divided in the preprocessing, gasification, syngas cleaning and conditioning, fuel synthesis, and hydroprocessing areas. Steam and power generation and the utilities areas are also considered. Technical information about these areas are summarized below, while the detailed assumptions are further presented in the Supplementary Material.

2.3.1. Preprocessing Area

Eucalyptus LCM passes through a chipper for size reduction. Straw coming from the fields in bales (in the case of CS processing) is unbaled, chopped, and sieved. The sugarcane bagasse is produced in the sugar extraction step in a 1G ethanol plant and is assumed to be the proper size for gasification. The feedstock is dried to 10% wt. moisture in a direct-contact steam rotatory dryer [17,18,60].

2.3.2. Gasification Area

After preprocessing, the dried biomass is gasified in a low-pressure indirectly heated circulating fluidized bed gasifier [17,22,30,61,62,63,64,65,66,67,68], operating at 869 °C and 2.3 bar [68]. The gasification area includes parallel gasifier trains, each one with a capacity up to 2000 tonnes of dry biomass per day (83.3 t/h). Steam is injected into the gasifier as reactant and fluidizing medium. The biomass is partially oxidized to a gas mixture (syngas) and a solid char. The heat needed for gasification reactions is supplied indirectly by the circulation of a synthetic sand (olivine) pre-heated in a char combustor. The hot flue gas from the combustor is employed for heat integration.

2.3.3. Syngas Cleaning and Conditioning Area

Operations in this area comprise the reforming of tars, methane, and other light hydrocarbons into carbon monoxide and hydrogen in a fluidized catalytic reactor [68,69]. The water–gas shift reaction also occurs in the reformer to achieve the optimal 2.1 H2/CO molar ratio for the FT process [18]. The residual coke from reforming reactions is removed from tar reformer catalyst by combustion. Hot catalyst flows back to the tar reformer to provide energy for reforming reactions [68]. Hot flue gases from the regenerator are used for heat integration. This catalytic step is followed by syngas cooling, where steam is generated. The next steps are quenching and scrubbing of the syngas for removing particulates and other contaminants [68,69]. Syngas is then compressed, and the acid gas is removed via an amine system [69,70]. The sweet syngas feeds fuel synthesis area while the acid gas is treated in a LO-CAT® system, through hydrogen sulfide oxidation, that isolates carbon dioxide and recovers solid sulfur [69].

2.3.4. Fuel Synthesis Area

Steps involved in this area include gas polishing in zinc oxide (ZnO) bed [69] and hydrogen separation via pressure swing adsorption (PSA) [18], that is directed to hydroprocessing. Then, advanced biofuels are produced via FT catalytic synthesis. The low-temperature (200–240 °C) FT process (LTFT) is conducted in a multi-tubular fixed bed reactor, at 25 bars with a cobalt catalyst [18,71,72]. Heat removal is accomplished by steam generation on the reactor shell side [73]. The FT product carbon number distribution is estimated using the Anderson–Schulz–Flory distribution [72,74]. The FT exiting effluent is cooled, and a gaseous product, liquid water, and liquid FT hydrocarbons are separated. Liquid FT products are sent to refining processes in hydroprocessing area. The gaseous product is split into three fractions. The first portion is a supplemental combustion gases stream sent to the catalytic regenerator in syngas cleaning and conditioning area; the second part is a stream to the gas turbine, enough to satisfy process steam demand (including 1G steam demand). The remaining amount is directed to the FT reactor as a recycle flow.

2.3.5. Hydroprocessing Area

After initial FT liquid distillation, the high molecular weight waxes are cracked using hydrogen from PSA [75]. FT liquid biofuels are obtained: green diesel, green gasoline, and renewable jet fuel. Part of the fuel gases from the hydroprocessing blend are burned in fired heaters to meet thermal demand of this area. The remaining part of these fuel gases from hydroprocessing is sent to a gas turbine [18].

2.3.6. Steam and Power Generation and Utilities Areas

Steam and electricity are produced to attend the process energy demand or for sale, in case of surplus electricity. Gaseous product from FT synthesis and fuel gas from hydroprocessing drive the gas turbine in the combined cycle cogeneration system. The high-temperature exhaust from gas turbines provides thermal energy for steam production in heat recovery steam generators (HRSG). Steam is also produced by recovering heat from the high-temperature syngas after reforming and in FT reactor cooling. Steam at 90 bar and 25 bar drive steam turbines, producing shaft work. Steam at the process required conditions is extracted and the remaining steam is directed to the condensing stages to produce more electric power. Thus, Brayton (gas turbine) and Rankine (steam turbines) thermodynamic cycles are combined, improving overall efficiency [76,77]. The utilities area encompass air systems; cooling water system; flue gas scrubbing system; purge water treatment area; and the storage of chemicals [68].

2.4. Climate Change Impacts

The climate change impacts are determined using the life-cycle assessment (LCA) methodology [78,79]. LCI are constructed based on the modeling of the use of resources and emission of GHG to air considering all the biomass production, conversion, and use stages. Therefore, the analysis can be referred as a cradle-to-grave (or well-to-wheel) analysis. Energy allocation is used since multiple outputs are obtained in the biorefinery scenarios. Climate change impacts are calculated including the 100-year time horizon global warming potentials (GWP 100) according to the Fifth Assessment Report (AR5) from the Intergovernmental Panel on Climate Change [80]. Emission factors from RenovaBio/RenovaCalc [81] are considered to estimate the impact related to biofuels distribution (by road transportation) and use, and to calculate the avoided GHG emissions compared to fossil equivalent scenarios. Hydrous ethanol is compared to fossil gasoline in terms of energy content. Avoided GHG emissions refer to the difference between the biofuel and the corresponding fossil fuel, considering fossil diesel, jet, gasoline, and natural gas GHG emissions same as in the RenovaBio policy (i.e., 86.5, 87.5, 87.4, and 153 gCO2eq/MJ, respectively) [82].

2.5. Economic Assessment

The economic assessment is based on a cash flow analysis for the biorefinery scenarios, considering the investment required to build the plant and all expenses (outflows) and revenues (inflows) for an expected project lifetime. The revenues are calculated based on the historical product’s average prices for a decade [83,84] or, in the case of electricity, the average of 10 years energy auction prices [85]. The potential additional revenues from avoided GHG emissions for liquid biofuels, based on the decarbonization credits from the newly launched RenovaBio policy are also explored in the economic analysis, considering the carbon price as US$10 per tonne of CO2eq avoided [82]. Based on the values of revenues and operating costs (OPEX), as well as capital costs (CAPEX), the cash flow model for financial evaluation is structured. The main economic parameters used to compare biorefinery projects are the net present value (NPV) and internal rate of return (IRR), calculated based on economical engineering tools [86]. Minimum attractive rate of return (MARR) is assumed to be 12% per year [87]. An exchange rate of 3.29 R$/US$ is employed. Other important parameters assumed in the cash flow analysis are provided in the Supplementary Material (Table S4). Capital costs of equipment and areas are scaled based on the process stream and scaling size factor. Streams calculated for season operation are taken as the basis for sizing equipment, except for eucalyptus chipper and condensing turbine, which are based on off-season data. When the stream reaches the maximum equipment capacity, it is split into parallel trains. The plant cost location factor of 1.3 [88] is used to convert investment estimates from the US to Brazil. Prices are inflated to December 2017 using the General Market Price Index (IGP-M) for Brazilian estimates and Chemical Engineering Plant Cost Index (CEPCI) for US data. The total installed costs are calculated using an installation factor over the total purchased equipment costs. Detailed information on capital cost estimates is presented in the Supplementary Material for each process area (Table S3). Project contingency of 5% of total installed costs is also assumed. Annual variable operating costs are determined from material stream flows. The biomass production costs are estimated using the CanaSoft model and is an input to the industrial cash flow analysis. Other raw material costs are inflated to December 2017 and detailed in Supplementary Material (Table S5). Fixed operating costs comprise employee salary costs [89], maintenance [68], and insurance [68] (Table S4 in Supplementary Material). Benefits and overhead are estimated as 90% of salaries [68].

2.6. Uncertainty Analysis

An uncertainty analysis is applied to address the risk associated with the uncertainties and variabilities in key modeling assumptions considered in our study. Uncertainties related to biomass yields, CAPEX, and costs related to industrial inputs, labor, biomass, and products are considered. The Latin Hypercube method inserted in @Risk 6.2® software is employed to assess the impact of uncertainties on IRR and climate change impacts. The parameters considered for risk analysis are detailed in the Supplementary Material (Table S6). A total of 5000 simulations are performed to estimate the uncertainties regarding the integrated scenarios (1G2G-CS and 1G2G-EC).

3. Results and Discussion

3.1. Techno-Economic Assessment of Biorefinery Scenarios

The main technical results of biorefinery scenarios are detailed in the Supplementary Material (Tables S7 and S8) and Table 3 summarizes selected technical results of the evaluated scenarios. Regarding biomass production systems, diesel consumption in agricultural machinery is lower for EC than CS. It occurs mostly because of the higher yield of EC (see Table 1) and its lower fuel consumption in planting operations, since its cycle lasts 10 years, while the CS lasts 5 harvesting cycles. On the other hand, fuel consumption in biomass transport is slightly higher for EC because of its lower loading density in the trucks. In addition, EC has a higher fiber content than CS (Table 1), presenting greater difficulty of extraction in the mills. Therefore, more imbibition water is required (see Table S8 in Supplementary Material), which makes the juice even more diluted and affects the final concentration of potassium in the vinasse. EC leads to lower production costs and lower GHG emissions compared to CS, mostly due to the higher yield of the former variety. There is a reduction on GHG emissions related to CS feedstock in the integrated scenario (1G2G-CS) when compared to CS in the 1G-CS scenario primarily due to the replacement of fossil diesel used in agricultural machinery and transport by green diesel.
Overall CO conversion in the FT reactor depends on the recycle ratio (amount of recycle stream per fresh syngas input) and is different in each scenario since energy requirements also varies. Besides steam produced in syngas cooling and the FT reactor, an expressive amount of steam is generated by heat recovery from the hot flue gas exiting the gas turbine. The integrated 1G sugarcane mill consumes a significant amount of the produced steam. In scenario 1G2G-EC, EC processing in the 1G facility demands larger amounts of steam in comparison to CS. Therefore, a bigger fraction of gaseous product from FT synthesis should be directed to the gas turbine to provide the plant energy requirements. Consequently, the amount of gaseous product available to recycle to the FT reactor is lower (lower recycle ratio) and so is the overall CO conversion.
The energy efficiency of the global process, including ethanol 1G process, is superior in the integrated configuration processing CS (scenario 1G2G-CS) due to higher sugar extraction in the CS, lower steam consumption in the 1G ethanol production process, and higher FT liquid fuels conversion. The calculated energy efficiencies are slightly superior than those reported in literature for similar thermochemical systems, such as 47.6% [24], 47–48% [72], 40% [17], and 42.7% [18]. This can be justified by the fact that integrated scenarios have the contribution of 1G process efficiency.
Figure 3 illustrates fixed capital investment per area of production, while Table 4 presents total CAPEX, that includes fixed capital investment of 1G and 2G units and working capital (10% of fixed capital costs for both units) and other parameters for the economic analysis. The distribution of fixed capital costs per area is generally in line with literature data considering a similar 2G thermochemical plant [17]. Major capital costs contribution is attributed to 2G thermochemical processes since gasification plants are complex and expensive to build. A 2G CAPEX is estimated at US$951 million for scenario 1G2G-CS and US$1030 million for scenario 1G2G-EC (considering fixed capital investment and working capital sum), considering LCM processing capacities of 948 MWth and 1044 MWth (or 203.6 and 224.0 t dry LCM/h), respectively (Supplementary Table S8). These results are in accordance with the literature range [18,20,21,22,24,30,90]. For example, Haarlemmer et al. [20] present capital investments of gasification and FT processes published by several studies with an extrapolation to project the reported results on a 400 MW thermal unit (biomass input of 80 t/h) capacity. Updating their cost analysis to 2017, the range is between US$280 and 1103 million (data adapted from Tock et al. [91] and Festel [92] studies), and there is also a wide range of 2G biofuel cost estimates depending on specific situations. Van Vliet et al. [90] report a study of a two-stage entrained flow gasifier and FT synthesis at a 2000 MW thermal plant. The required investment is US$1340 million (updated to 2017). However, it is important to mention that 2G thermochemical associated CAPEX includes the shared units, such as the steam and power generation and utilities areas, that also provides 1G plant requirements. Fixed capital costs associated to 1G unit slightly increases in 1G2G-EC (US$134.28 million) compared to 1G2G-CS (US$132.45 million) despite the decrease in the volume of hydrous ethanol produced, maintaining approximately the same relative share (12–13%) in both scenarios. This minor absolute increase in the 1G2G-EC scenario is justified by the higher fiber content (requiring more capital costs in the extraction area for the mills) and higher equipment volumes to process a more diluted juice.
Comparing Figure 3a,b, the participation of fuel synthesis and the hydroprocessing areas is lower for 1G2G-EC due to lower recycle ratio to FT reactor and liquid biofuel production. It implies a smaller FT reactor volume (Supplementary Material, Table S8) and smaller required capacities for the following separation stages and hydroprocessing area operations. However, electricity production is favored, increasing the capital costs related to its generation (steam and power generation area). Fixed capital costs of the 2G unit in scenarios 1G2G-CS to 1G2G-EC are US$864.45 and 936.24 million, respectively. The EC scenario requires more CAPEX due to the higher amount of LCM processed and the increase in capacity in the steam and power generation area, which proved to be more impactful on capital costs than the increase of syngas cleaning and conditioning and fuel synthesis areas in scenario 1G2G-CS.
The minimum selling prices (MSP) that enable the venture are between 30–32% higher than fossil selling prices (price to the producer, without marketing taxes) in the scenario 1G2G-EC. For 1G2G-CS, MSP are between 10–12% superior to the fossil ones, contributing to its better economic performance. OPEX (Table 4) decreases in scenario 1G2G-EC because EC production costs are lower than CS. However, EC variety has a higher fiber and lower sugar content than CS. Thus, the biorefinery scenario processing EC shows a decrease in the amount of 1G ethanol production from the fermentation of sucrose. As a result, a reduction in the share of ethanol revenues is observed in 1G2G-EC. In addition, the lower recycle ratio in 1G2G-EC reduces the production of FT biofuels, contributing to the lower revenue. The lower revenue from carbon credits is also observed due to the reduction of FT biofuels production. These aspects, in addition to the superior CAPEX for the scenario 1G2G-EC, contribute to the lower IRR in comparison to 1G2G-CS.
IRR results for both integrated biorefinery scenarios are lower than the minimum acceptable rate of return (MARR). These results are somehow expected since thermochemical processes are not yet a commercial technology at current biomass and fossil fuel prices. In addition to the substantial thermochemical plant’s CAPEX and OPEX, fuel marketing prices must compete on the market with fuels from petroleum. However, it is expected that FT biofuels production costs will decline in the future due to the proceeding on the learning curve for this process [18,19,93]. In addition, thermochemical plants implementation in Brazil may take advantage of its integration with the well-established 1G plants, which provides a crucial participation on revenues (from hydrous ethanol) at much lower investment and operational costs.

3.2. Climate Change Impacts of Biorefinery Scenarios

Figure 4 presents the breakdown of GHG emissions related to the three assessed biorefinery scenarios, including hydrous ethanol (HE), green diesel (GD), renewable jet fuel (RJF), green gasoline (GG), and electricity (EE). The complete life-cycle inventories including all the inputs and airborne emissions for these biorefinery scenarios are presented in the Supplementary Material (Table S9). The assessed thermochemical processes are highlighted in the literature in terms of climate mitigation potential when compared to other similar processes, such as for renewable jet fuel production [26,29,30]. The additional benefits of replacing fossil diesel by green diesel in agricultural machine operations and for the transport of biomass is also considered. In the 1G2G biorefinery scenarios, the 1G process is promoted by diesel substitution and industrial process efficiency increased by the thermochemical route integrated. As a result, HE presents lower GHG emissions (10.2 gCO2eq/MJ in 1G2G-CS) than our estimates for a Brazilian autonomous 1G distillery (about 20.9 gCO2eq/MJ in 1G-CS). This beneficial effect of replacing fossil with GD in the 1G2G scenarios is more evident by comparing GHG emissions from biomass production systems. In scenario 1G2G-CS, the biomass production system contributes 79% (72% from CS and straw and 7% from eucalyptus) to the emission of the production stages, which includes biomass production and its industrial processing, excluding emissions associated with the distribution and use of biofuels. In 1G2G-EC, GHG emissions from the biomass production systems account for about 71% (62% from EC and 9% from eucalyptus) of all the total production stages. These contributions in 1G2G biorefinery scenarios are significantly lower than the 85% presented in the scenario 1G-CS. Besides the contribution of diesel replacement, the introduction of another biomass apart from CS also contributes to lower climate change impacts of biomass production systems in 1G2G scenarios compared to the 1G biorefinery. EC presents a lower contribution to the total impact than CS because its production system presents higher yield and lower GHG emissions per mass unit of biomass (Table 3). Finally, there is an increase in the amount of processed eucalyptus in scenario 1G2G-EC compared to scenario 1G2G-CS, since EC has superior fiber content, increasing the amount of LCM necessary to keep the same capacity during sugarcane off-season. Thus, due to the less expressive participation of both sugarcane varieties in GHG emissions and higher amount of LCM processed, eucalyptus contribution to total GHG emissions is higher in the 1G2G-EC scenario.
Despite the higher participation of the biomass production systems in the GHG emissions, a decrease in the contribution from the industrial production system in scenario 1G2G-CS is observed when compared to scenario 1G2G-EC. There is an increase in the overall process energy efficiency (Supplementary Table S8) and the industrial emissions proportionally decrease. As a result, the total production stages emissions are remarkably close in both assessed biorefinery scenarios (7.6 gCO2eq/MJ in 1G2G-CS and 7.8 gCO2eq/MJ in 1G2G-EC). Since energy allocation is employed, GHG emissions from the production stages, i.e., discounting distribution and use emissions, are equal for all products in the same scenario. Since there are no distribution and use emission factors associated to electricity, only the production stages contribute to electricity impacts, resulting in the best performance among the considered products.
Figure 5 presents the climate mitigation of the assessed biorefinery scenarios considering the use of biorefinery products to replace fossil fuels. Figure 5a shows the reduction in GHG emissions related to each product compared to the fossil equivalent. Both 1G2G biorefinery scenarios show larger GHG emission reduction compared to 1G-CS. Reductions between 85–95% are found for integrated 1G2G scenarios, while 1G-CS present reductions of 76–88% in comparison to fossil fuels. 1G2G-CS presents a slightly larger mitigation potential because of the higher process efficiency (Supplementary Table S8) and consequent more products per unit of biomass feedstock. Scenario 1G2G-CS present about 13% reduction in total energy output in comparison to 1G2G-EC. Despite the energy output disparity, the differences between total annual GHG avoided emissions in the scenarios (Figure 5b) are no longer remarkable because the results will also be affected by the assumptions of what the products are replacing and also if products distribution and use are included. In general, scenario 1G2G-CS favors the production of liquid biofuels, while the 1G2G-EC favors electricity. There is a higher volume of 1G hydrous ethanol production in scenario 1G2G-CS since sugar content in CS is superior than in EC, and so is its extraction in mills. In the same scenario, liquid biofuels are favored by the higher recycle ratio and consequent superior CO conversion obtained (Table 3). The higher the recycle ratio, the lower the fraction of gaseous product directed to the gas turbine and the lower the steam and power generated. Therefore, electricity contribution is less expressive in 1G2G-CS. In 1G2G-EC, electricity is favored due to the lower recycle ratio, which is necessary to attend the higher steam demand of 1G unit processing EC (see Table 3). Electricity share in energy outputs vary from 5–24% in 1G2G-CS and 1G2G-EC, respectively, and its impact is very significant due to the higher GHG impacts of electricity from natural gas. A fossil scenario equivalent to integrated scenarios emits on average 87.2 gCO2eq per MJ of liquid biofuels and 153 gCO2eq per MJ of electricity (considering natural gas combustion on thermoelectric plants). This means that the production, distribution, and use of 1 MJ of liquid biofuels avoids the emission between 66–77 gCO2eq (Figure 5a) while the production of 1 MJ of electricity avoids between 135–145 gCO2eq. Thus, by increasing the production of 1 MJ of electricity contributes to increase avoided GHG emissions by a factor of almost 2 in comparison to the increase that occurs per unit of energy of liquid biofuels production. Therefore, the increased electricity share in output replacing natural gas offsets the efficiency reduction in scenario 1G2G-EC. As a result, total avoided GHG emissions per year are remarkably close in the considered 1G2G scenarios. It is important to highlight that the combustion of natural gas in thermoelectric plants does not represent the Brazilian energy matrix reality, but the intention is to compare with the fossil equivalent, in case of a possible expansion of thermoelectric plants to supply increasing energy demand. The result of avoided emissions per cultivated area (Figure 5c), however, tends to favor scenario 1G2G-EC and EC cultivation abruptly, as land use decreases due to its high productivity (see Table 3). Avoided emissions from 1G-CS and 1G2G-CS per area are very close since there is an increase in avoided emissions in the integrated scenario, however there is also an increase in total cultivated area due to eucalyptus cultivation.

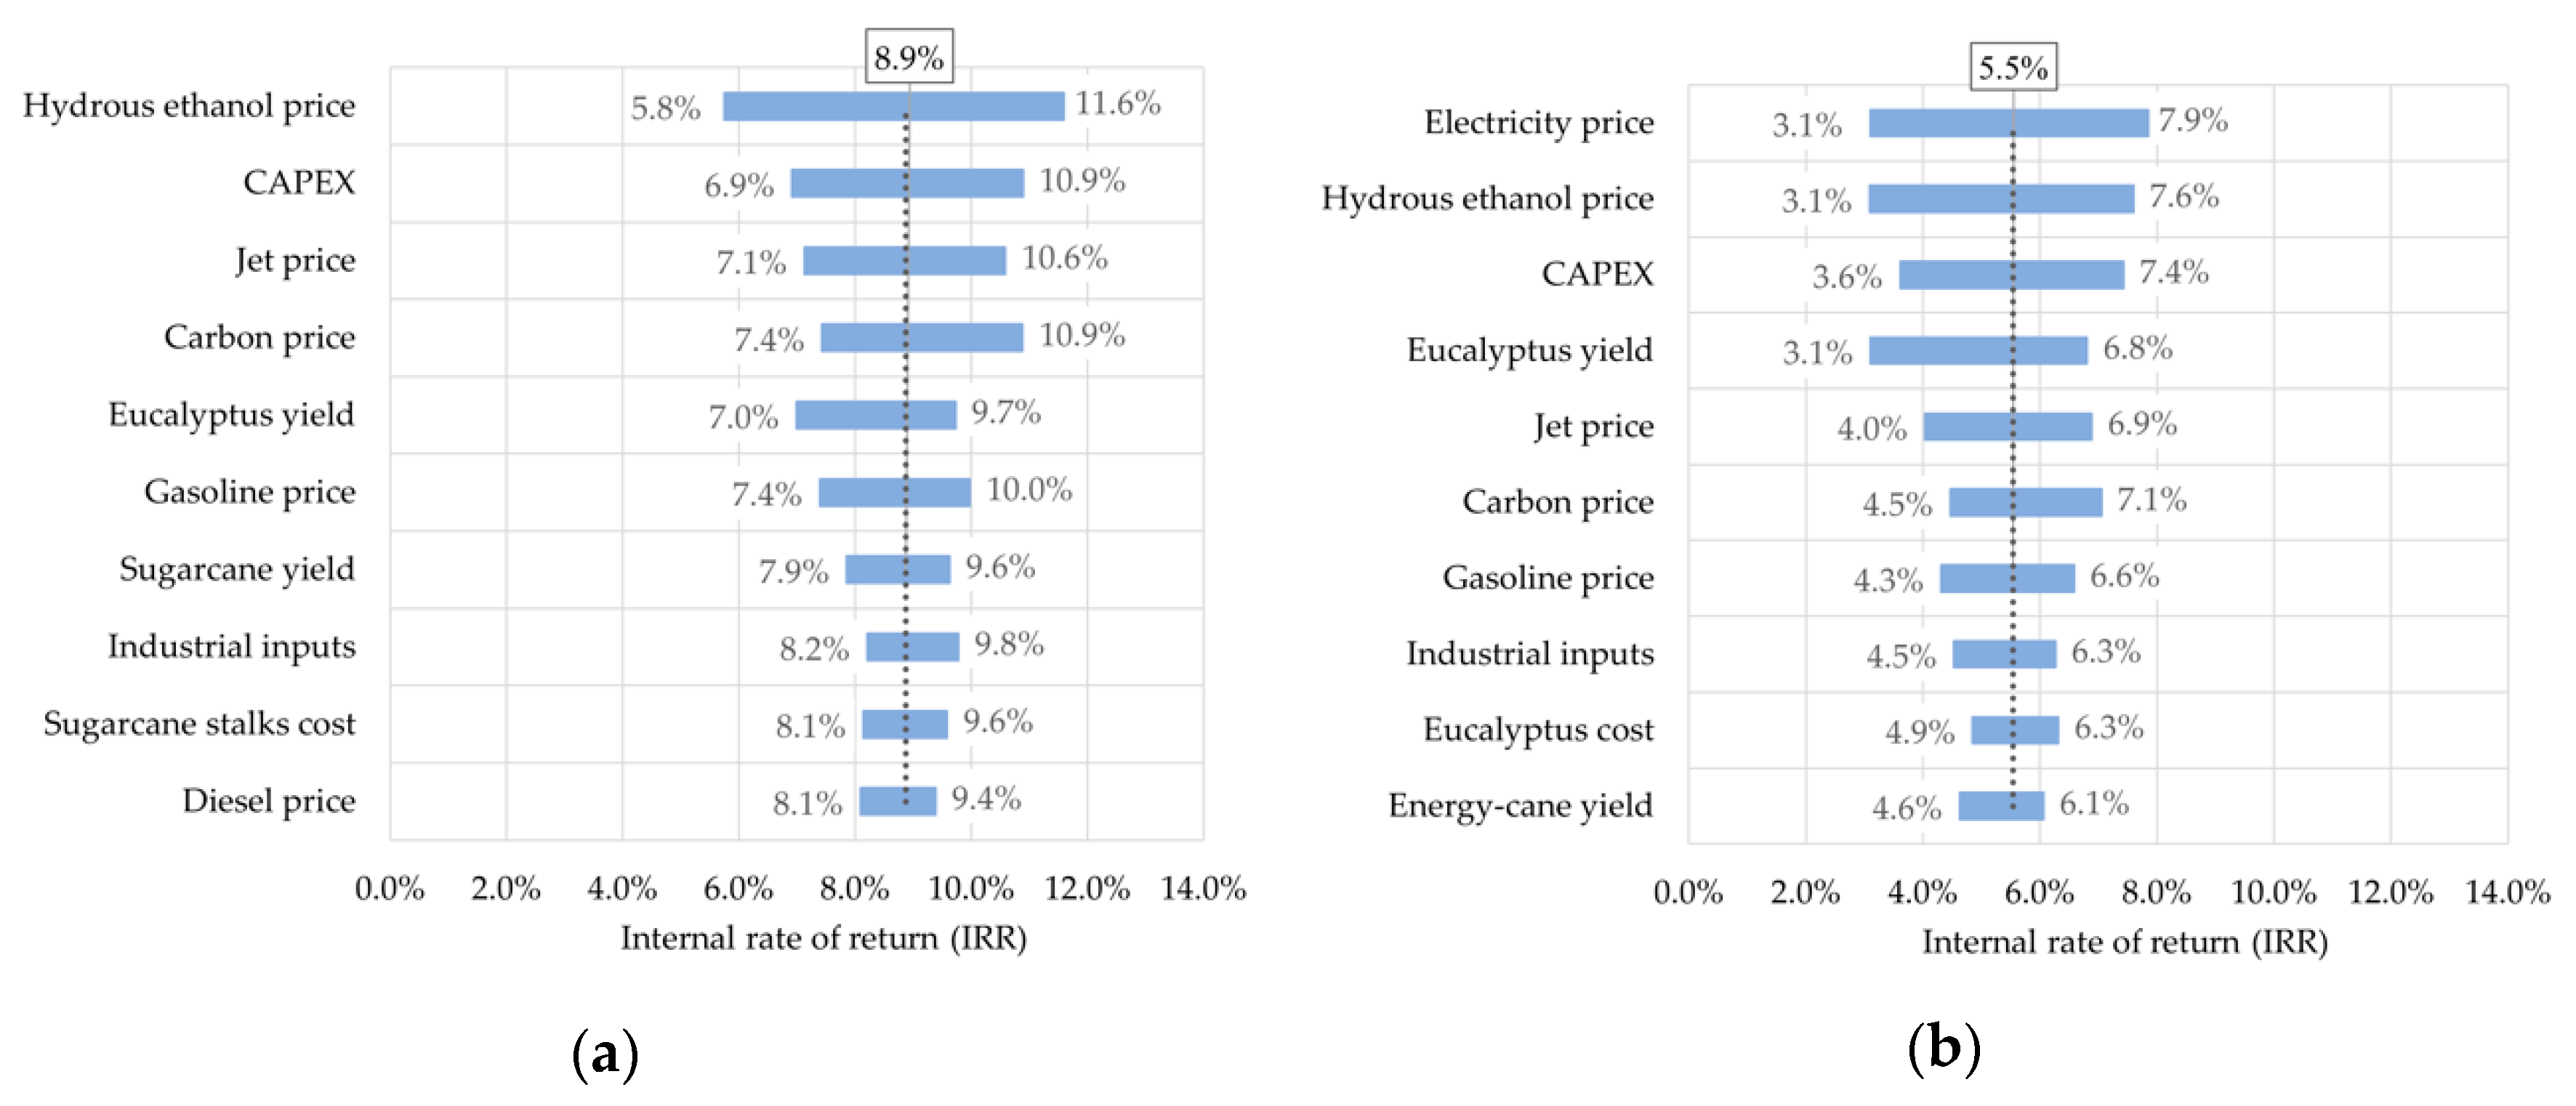
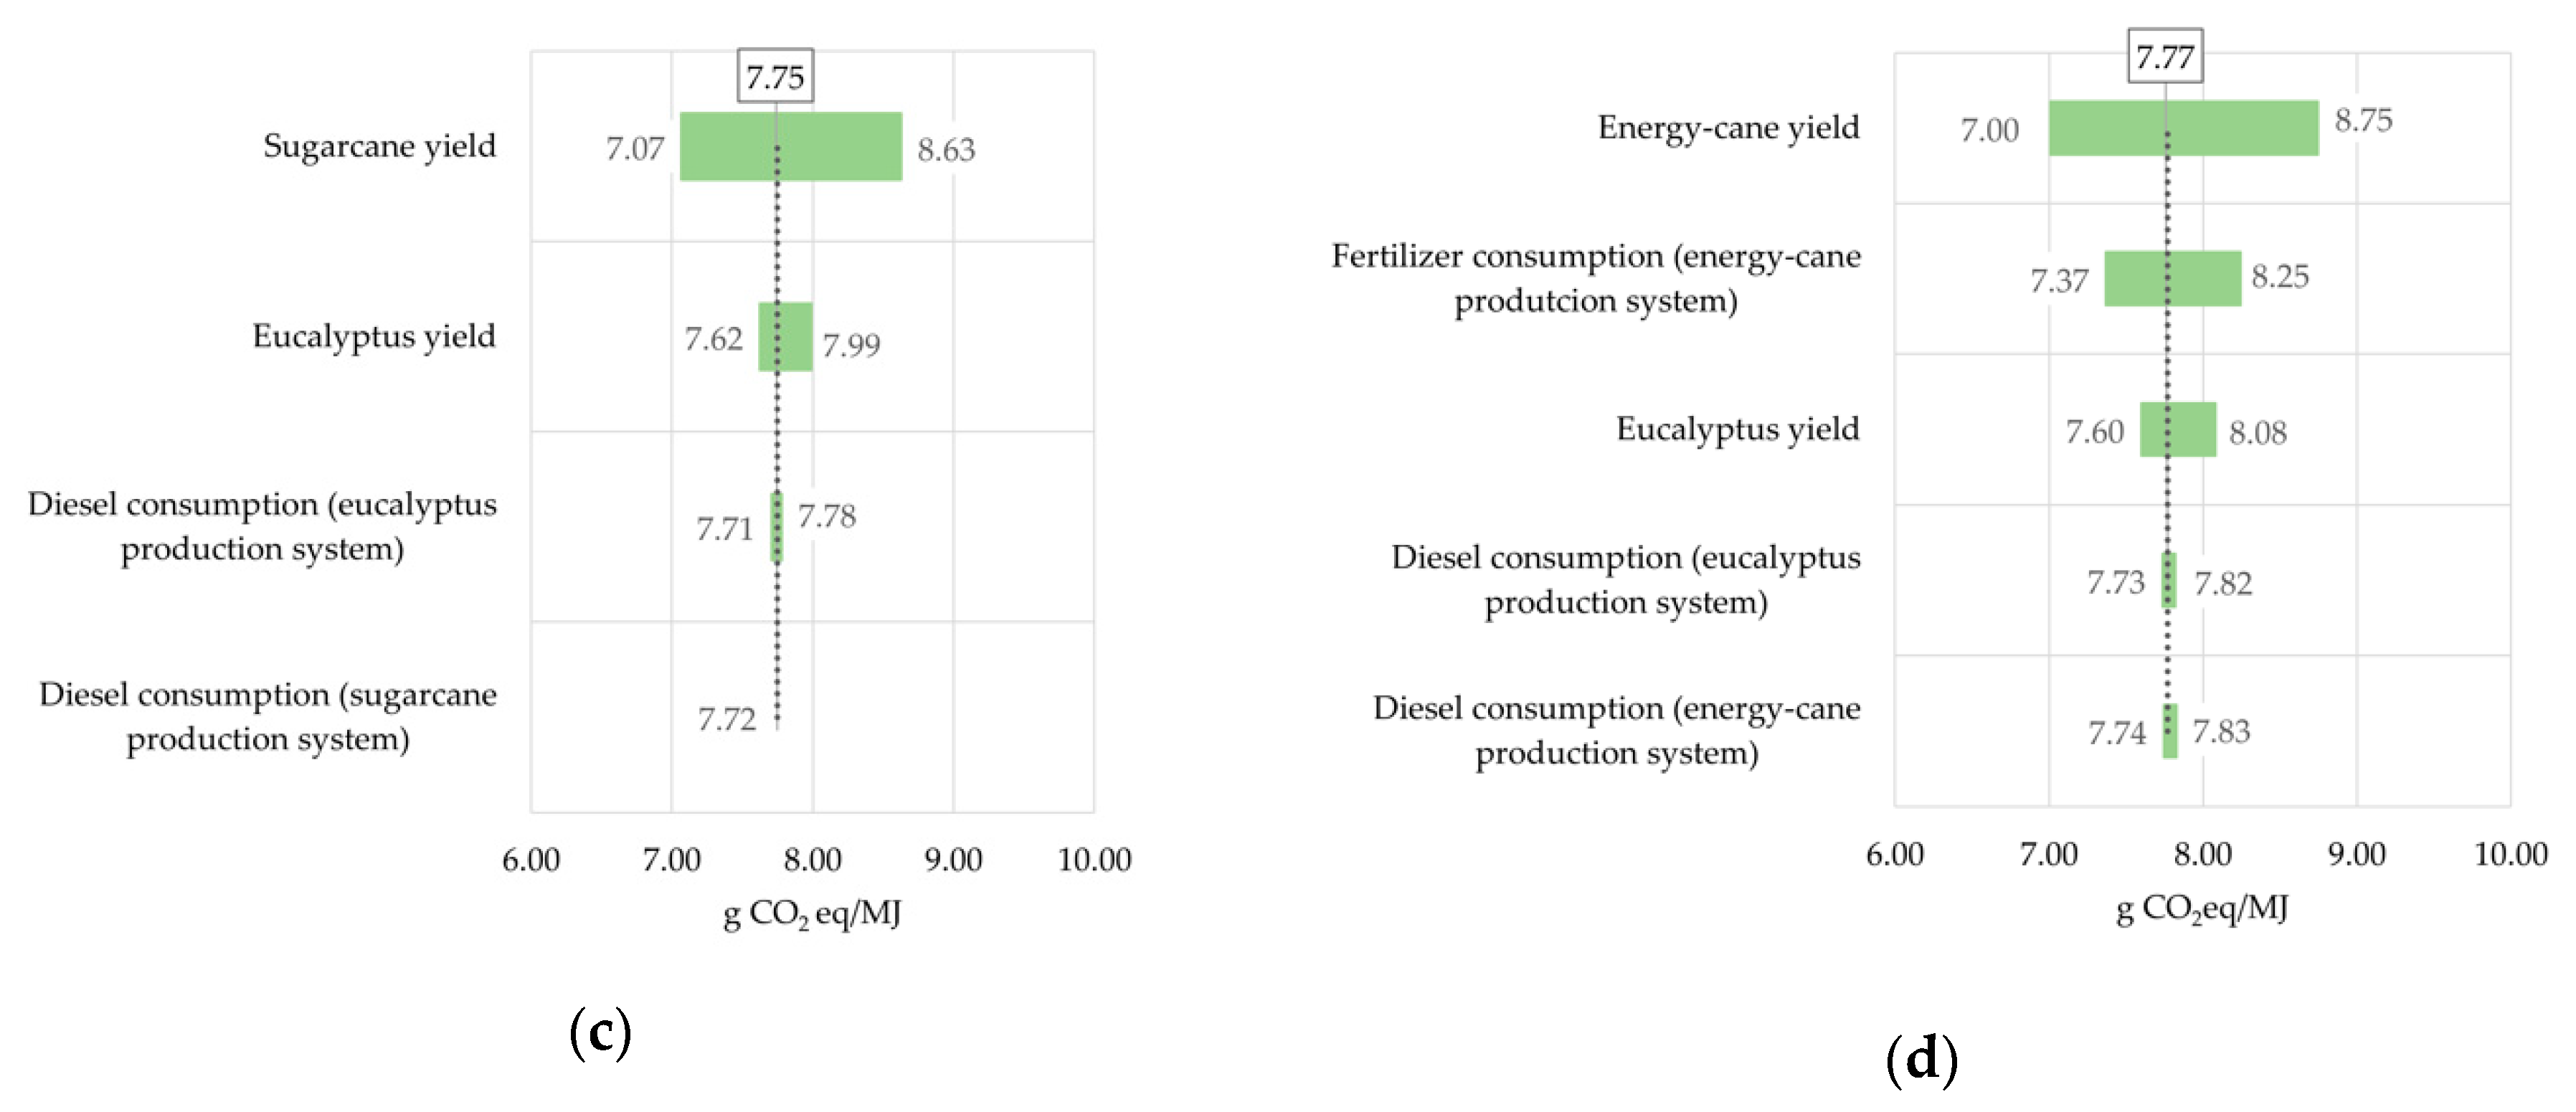
3.3. Uncertainty Analysis of Biorefinery Scenarios

Tornado diagrams presented in Figure 6 represent the risk and uncertainty analysis performed for IRR and climate change impacts in the 1G2G scenarios. As the emissions from production stages are the same for all fuels and electricity (considering energy allocation), that is the assessed response. IRR results strongly depends on the hydrous ethanol price and CAPEX in 1G2G scenarios. The expressive dependence on ethanol revenues confirm the advantage of integrating the thermochemical route to the well-established 1G process. There is a more significant contribution of carbon prices in 1G2G-CS than in 1G2G-EC, as this credit is attributed to liquid biofuels for transport sector only, as stablished in RenovaBio program. 1G2G-CS scenario favors FT liquid biofuels production; while the share of electricity in revenues is more expressive in scenario 1G2G-EC, placing it in a more prominent position in the uncertainty analysis. Besides EC presenting lower production costs, IRR remains lower in scenario 1G2G-EC than 1G2G-CS. Therefore, the impact of revenues on IRR are more significant than biomass costs. The results are promising, but there is still the possibility of process improvements to bring the IRR closer to MARR in future scenarios. The variation of the parameters is made individually in the analysis but accumulating its effects may improve the result. The learning curve over time can lead to lower production costs (lower industrial inputs for example). Even though it is less significant in IRR uncertainty analysis than other parameters, risk associated to costs can also be reduced by lowering the cost of raw materials as a result of increased yield or by other factors. CAPEX can be reduced by the maturity of equipment manufacturing in the country itself. In the case of RenovaBio, only carbon credits avoided were considered, but this is a very simplified estimate. The mechanism of the program is more complex and could further favor biofuels prices in competition with fossil fuels. The impact of several factors together may become the route viable. Regarding climate change impacts, the uncertainties for fertilizer use was performed only for EC, as the uncertainties are greater regarding a crop not yet established. Cane productivity, regardless of variety, is the most impactful parameter for uncertainty in both 1G2G scenarios. However, the general variations are slight, not exceeding the 8.8 g CO2 eq even in the scenario with the highest probable emission, the one with the lowest EC productivity.

4. Final Remarks

Biomass gasification followed by FT synthesis may provide renewable gasoline, diesel, and jet fuel with high mitigation potential, contributing towards Brazil’s targets assumed at COP21. Integrated 1G2G biorefinery scenarios processing CS (or EC) and eucalyptus provide GHG emission reduction between 85–95% compared to the fossil equivalent, depending on the considered product, higher than the mitigation expected by the typical sugarcane 1G biorefinery. However, 2G thermochemical processes take advantage of its integration with the well-established 1G process, a process with crucial participation in revenues (from hydrous ethanol) and much lower risk associated with investment and operational costs. RenovaBio may also contribute to the increase in revenues related to liquid biofuels production proportionally to avoided GHG emissions. Economic parameters can, therefore, be improved by the start of the technological learning curve for 2G thermochemical processes, making possible a reduction on CAPEX and production costs.
This study shows that when using EC instead of CS, the typical 1G process requires more process energy. Therefore, more gaseous product from the FT reactor must be directed to the gas turbine and consequently the recycle ratio to the FT reactor and liquid fuels global conversion is lower, favoring electricity production. In this scenario, a lower amount of hydrous ethanol is produced because of a lower amount of sugar available for 1G fermentation. Comparing the emissions of a product with those of the fossil one that it would replace, an increase in the share of electricity production seems beneficial when it replaces electricity from natural gas. On the other hand, the process efficiency, in this case, is lower and the emissions of each product on an energy basis are higher. As a result, considering the assumptions of this study, the difference between the total annual GHG avoided emissions of the two 1G2G scenarios is not significant. However, when we evaluate the avoided emissions standardized by the cultivated area in each scenario, the area requirements for 1G2G-EC are lower, since EC shows superior yield. Despite the benefit of lower land use, economic performance is impaired. In the 1G2G-CS biorefinery scenario, the revenues from hydrous ethanol and carbon credits are essential, besides higher biomass production costs. Thus, IRR is higher for 1G2G-CS in comparison to 1G2G-EC. Further studies on the optimization of economic and climate benefits of these biorefinery scenarios might help to better address these issues and inform researchers and policy makers regarding better biorefinery value chain design before its large-scale deployment.

Supplementary Materials

The following are available online at https://www.mdpi.com/1996-1073/13/17/4576/s1: Figure S1: Integrated gasification and Fisher-Tropsch synthesis process flow diagram, Figure S2: Steam and power generation and utilities area flow diagram, Table S1: Lingocellulosic biomass characterization, Table S2: Main parameters adopted in process simulation, Table S3: Estimates for capital costs in each thermochemical process area, Table S4: Main parameters considered in the economic analysis, Table S5: Basis for estimating industrial chemicals variable operating costs, Table S6: Ranges in parameters (triangular distributions) considered for uncertainty and risk assessment, Table S7: Selected biomass production system technical results of evaluated scenarios, Table S8: Key technical results of the thermochemical processes, Table S9: Life Cycle Inventory of the biorefinery scenarios (reference flows are per year of plant operation).

Author Contributions

Conceptualization, J.M.B., B.C.K., A.B., E.R.d.M. and O.C.; methodology, J.M.B., B.C.K., M.F.C., M.D.B.W. and I.L.d.M.S.; validation, J.M.B., B.C.K. and M.F.C.; formal analysis, J.M.B., B.C.K., M.F.C. and O.C.; data curation, J.M.B. and O.C.; writing—original draft preparation, J.M.B. and O.C.; writing—review and editing, J.M.B., B.C.K., M.D.B.W., I.L.d.M.S., A.B. and O.C.; supervision: O.C., A.B., E.R.d.M. All authors have read and agreed to the published version of the manuscript.

Funding

This work was funded by Coordenação de Aperfeiçoamento de Pessoal de Nível Superior (CAPES), grant number 88882.143492/2017-01 and 88882.435087/2019-01.

Acknowledgments

This research was supported by LNBR—Brazilian Biorenewables National Laboratory (CNPEM/MCTIC) during the use of the Virtual Sugarcane Biorefinery open access facility.

Conflicts of Interest

The authors declare no conflict of interest. The funders had no role in the design of the study; in the collection, analyses, or interpretation of data; in the writing of the manuscript; or in the decision to publish the results.

Abbreviations

1GFirst-generation
1G2GIntegrated first and second-generation
2GSecond-generation
CAPEXCapital costs
CEPCIChemical Engineering Plant Cost Index
COP2121st Conference of the Parties
CSConventional sugarcane
DMEDimethyl ether
ECEnergy-cane
EEElectricity
FTFischer-Tropsch
GDGreen diesel
GGGreen gasoline
GHGGreenhouse gases
GWPGlobal warming potential
HEHydrous ethanol
HRSGHeat recovery steam generator
IGP-MGeneral Market Price Index
IRRInternal rate of return
LCALife-cycle assessment
LCILife-cycle inventory
LCMLignocellulosic material
LHVLow heating value
LNBRBrazilian Biorenewables National Laboratory
LTFTLow-temperature Fischer-Tropsch
MARRMinimum attractive rate of return
MTGMethanol-to-gasoline
NPVNet present value
OPEXOperating costs
PSAPressure swing adsorption
RJFRenewable jet fuel
SSPsShared Socioeconomic Pathways
VSBVirtual Sugarcane Biorefinery

References

  1. Intergovernmental Panel on Climate Change (IPCC). Global Warming of 1.5 °C. An IPCC Special Report on the Impacts of Global Warming of 1.5°C Above Pre-Industrial Levels and Related Global Greenhouse Gas Emission Pathways, in the Context of Strengthening the Global Response to the Threat of Climate Change; Masson-Delmotte, V., Zhai, P., Pörtner, H.-O., Roberts, D., Skea, J., Shukla, P.R., Pirani, A., Moufouma-Okia, W., Péan, C., Pidcock, R., et al., Eds.; Available online: https://www.ipcc.ch/sr15/ (accessed on 10 August 2018).
  2. Intergovernmental Panel on Climate Change (IPCC). Climate Change and Land: An IPCC Special Report on Climate Change, Desertification, Land Degradation, Sustainable Land Management, Food Security, and Greenhouse Gas Fluxes in Terrestrial Ecosystems; Shukla, P.R., Skea, J., Buendia, E.C., Masson-Delmotte, V.H.-O., Pörtner, D.C., Roberts, P., Zhai, R., Slade, S., Connors, R., Van Diemen, M., et al., Eds.; Intergovernmental Panel on Climate Change (IPCC): Geneva, Switzerland, 2019. [Google Scholar]
  3. O’Neill, B.C.; Kriegler, E.; Ebi, K.L.; Kemp-Benedict, E.; Riahi, K.; Rothman, D.S.; Van Ruijven, B.J.; Van Vuuren, D.P.; Birkmann, J.; Kok, K.; et al. The roads ahead: Narratives for shared socioeconomic pathways describing world futures in the 21st century. Glob. Environ. Chang. 2017, 42, 169–180. [Google Scholar] [CrossRef] [Green Version]
  4. Popp, A.; Calvin, K.; Fujimori, S.; Havlik, P.; Humpenöder, F.; Stehfest, E.; Bodirsky, B.L.; Dietrich, J.P.; Doelmann, J.C.; Gusti, M.; et al. Land-use futures in the shared socio-economic pathways. Glob. Environ. Chang. 2017, 42, 331–345. [Google Scholar] [CrossRef] [Green Version]
  5. Van den Wall Bake, J.D.; Junginger, M.; Faaij, A.; Poot, T.; Walter, A. Explaining the experience curve: Cost reductions of Brazilian ethanol from sugarcane. Biomass Bioenergy 2009, 33, 644–658. [Google Scholar] [CrossRef]
  6. Goldemberg, J. An hystorical account of bioenergy production in Brazil. In Proceedings of the BBEST—Bioethanol Science and Technology Conference, Campos do Jordão, Brazil, 14 August 2011; p. 14. [Google Scholar]
  7. Corrêa do Lago, A.; Bonomi, A.; Cavalett, O.; Pereira da Cunha, M.; Pinheiro Lima, M.A. Sugarcane as a carbon source: The Brazilian case. Biomass Bioenergy 2012, 46, 5–12. [Google Scholar] [CrossRef]
  8. Tolmasquim, M.T.; Gorini, R.; Matsumura, E.; Soares, J.B.; Oliveira, L.B.; Lisboa, M.L.V.; Faria, G.V.R.; Conde, M.R.; Moraes, N.G.; Silva, R.A.M. The Brazilian Commitment to Combating Climate Change: Energy Production and Use; Empresa de Pesquisa Energética (EPE): Rio de Janeiro, Brazil, 2016. [Google Scholar]
  9. Empresa de Pesquisa Energética (EPE). Nota Técnica DEA 13/15—Demanda de Energia 2050; Empresa de Pesquisa Energética: Rio de Janeiro, Brazil, 2016. [Google Scholar]
  10. International Energy Agency (IEA). World Energy Outlook 2016. Available online: https://www.iea.org/reports/world-energy-outlook-2016 (accessed on 7 July 2020).
  11. Ministério do Meio Ambiente (MMA). iNDC (Contribuição Nacionalmente Determinada). Available online: https://www.mma.gov.br/informma/item/10570-indc-contribuição-nacionalmente-determinada (accessed on 20 January 2020).
  12. República Federativa Do Brasil. Lei n°13.576/2017 Dispõe Sobre a Política Nacional de Biocombustíveis (RenovaBio) e dá Outras Providências; República Federativa Do Brasil: Brasília, Brasil, 2017. [Google Scholar]
  13. Klein, B.C.; Chagas, M.F.; Watanabe, M.D.B.; Bonomi, A.; Maciel Filho, R. Low carbon biofuels and the New Brazilian National Biofuel Policy (RenovaBio): A case study for sugarcane mills and integrated sugarcane-microalgae biorefineries. Renew. Sustain. Energy Rev. 2019, 115, 109365. [Google Scholar] [CrossRef]
  14. Cavalett, O.; Chagas, M.F.; Junqueira, T.L.; Watanabe, M.D.B.; Bonomi, A. Environmental impacts of technology learning curve for cellulosic ethanol in Brazil. Ind. Crops Prod. 2017, 106, 31–39. [Google Scholar] [CrossRef]
  15. Junqueira, T.L.; Chagas, M.F.; Gouveia, V.L.R.; Rezende, M.C.A.F.; Watanabe, M.D.B.; Jesus, C.D.F.; Cavalett, O.; Milanez, A.Y.; Bonomi, A. Techno-economic analysis and climate change impacts of sugarcane biorefineries considering different time horizons. Biotechnol. Biofuels 2017, 10, 1–12. [Google Scholar] [CrossRef] [Green Version]
  16. Foust, T.D.; Aden, A.; Dutta, A.; Phillips, S. An economic and environmental comparison of a biochemical and a thermochemical lignocellulosic ethanol conversion processes. Cellulose 2009, 16, 547–565. [Google Scholar] [CrossRef]
  17. Zhu, Y.; Rahardjo, S.T.; Valkenburg, C.; Snowden-Swan, L.; Jones, S.; Machinal, M. Techno-Economic Analysis for the Thermochemical Conversion of Biomass to Liquid Fuels (U.S. DOE); Department of Energy, Pacific Northwest National Laboratory: Richland, WA, USA, 2011. [Google Scholar]
  18. Swanson, R.M.; Satrio, J.A.; Brown, R.C.; Platon, A.; Hsu, D.D. Techno-Economic Analysis of Biofuels Productionbased on Gasification; National Renewable Energy Laboratory: Golden, CO, USA, 2010. [Google Scholar]
  19. Agusdinata, D.B.; Zhao, F.; Ileleji, K.; Delaurentis, D. Life cycle assessment of potential biojet fuel production in the United States. Environ. Sci. Technol. 2011, 45, 9133–9143. [Google Scholar] [CrossRef]
  20. Haarlemmer, G.; Boissonnet, G.; Imbach, J.; Setier, P.A.; Peduzzi, E. Second generation BtL type biofuels—A production cost analysis. Energy Environ. Sci. 2012, 5, 8445–8456. [Google Scholar] [CrossRef]
  21. Baliban, R.C.; Elia, J.A.; Floudas, C.A.; Gurau, B.; Weingarten, M.B.; Klotz, S.D. Hardwood biomass to gasoline, diesel, and jet fuel: 1 Process synthesis and global optimization of a thermochemical refinery. Energy Fuels 2013, 27, 4302–4324. [Google Scholar] [CrossRef]
  22. Diederichs, G.W.; Mandegari, M.A.; Farzad, S.; Görgens, J.F. Techno-economic comparison of biojet fuel production from lignocellulose, vegetable oil and sugar cane juice. Bioresour. Technol. 2016, 216, 331–339. [Google Scholar] [CrossRef]
  23. Im-orb, K.; Simasatitkul, L.; Arpornwichanop, A. Techno-economic analysis of the biomass gasification and Fischer-Tropsch integrated process with off-gas recirculation. Energy 2016, 94, 483–496. [Google Scholar] [CrossRef]
  24. Dimitriou, I.; Goldingay, H.; Bridgwater, A.V. Techno-economic and uncertainty analysis of Biomass to Liquid (BTL) systems for transport fuel production. Renew. Sustain. Energy Rev. 2018, 88, 160–175. [Google Scholar] [CrossRef]
  25. Carvalho, F.; Da Silva, F.T.F.; Szklo, A.; Portugal-Pereira, J. Potential for biojet production from different biomass feedstocks and consolidated technological routes: A georeferencing and spatial analysis in Brazil. Biofuels Bioprod. Biorefin. 2019, 13, 1454–1475. [Google Scholar] [CrossRef]
  26. Han, J.; Elgowainy, A.; Cai, H.; Wang, M.Q. Life-cycle analysis of bio-based aviation fuels. Bioresour. Technol. 2013, 150, 447–456. [Google Scholar] [CrossRef] [PubMed]
  27. Trivedi, P.; Malina, R.; Barrett, S.R.H. Environmental and economic tradeoffs of using corn stover for liquid fuels and power production. Energy Environ. Sci. 2015, 8, 1428–1437. [Google Scholar] [CrossRef]
  28. Wang, W.C.; Tao, L. Bio-jet fuel conversion technologies. Renew. Sustain. Energy Rev. 2016, 53, 801–822. [Google Scholar] [CrossRef] [Green Version]
  29. De Jong, S.; Antonissen, K.; Hoefnagels, R.; Lonza, L.; Wang, M.; Faaij, A.; Junginger, M. Life-cycle analysis of greenhouse gas emissions from renewable jet fuel production. Biotechnol. Biofuels 2017, 10, 1–18. [Google Scholar] [CrossRef] [Green Version]
  30. Klein, B.C.; Chagas, M.F.; Junqueira, T.L.; Rezende, M.C.A.F.; De FátimaCardoso, T.; Cavalett, O.; Bonomi, A. Techno-economic and environmental assessment of renewable jet fuel production in integrated Brazilian sugarcane biorefineries. Appl. Energy 2018, 209, 290–305. [Google Scholar] [CrossRef]
  31. Capaz, R.S.; De Medeiros, E.M.; Falco, D.G.; Seabra, J.E.A.; Osseweijer, P.; Posada, J.A. Environmental trade-offs of renewable jet fuels in Brazil: Beyond the carbon footprint. Sci. Total Environ. 2020, 714, 136696. [Google Scholar] [CrossRef] [PubMed]
  32. Santos, C.I.; Silva, C.C.; Mussatto, S.I.; Osseweijer, P.; Van der Wielen, L.A.M.; Posada, J.A. Integrated 1st and 2nd generation sugarcane bio-refinery for jet fuel production in Brazil: Techno-economic and greenhouse gas emissions assessment. Renew. Energy 2018, 129, 733–747. [Google Scholar] [CrossRef]
  33. Furtado, J.C., Jr.; Palacio, J.C.E.; Leme, R.C.; Lora, E.E.S.; Da Costa, J.E.L.; Reyes, A.M.M.; Del Olmo, O.A. Biorefineries productive alternatives optimization in the brazilian sugar and alcohol industry. Appl. Energy 2020, 259, 113092. [Google Scholar] [CrossRef]
  34. Matsuoka, S.; Kennedy, A.J.; Santos, E.G.D.; Tomazela, A.L.; Rubio, L.C.S. Energy Cane: Its Concept, Development, Characteristics, and Prospects. Adv. Bot. 2014, 2014, 1–13. [Google Scholar] [CrossRef] [Green Version]
  35. Carvalho-Netto, O.V.; Bressiani, J.A.; Soriano, H.L.; Fiori, C.S.; Santos, J.M.; Barbosa, G.V.; Xavier, M.A.; Landell, M.G.; Pereira, G.A. The potential of the energy cane as the main biomass crop for the cellulosic industry. Chem. Biol. Technol. Agric. 2014, 1, 1–8. [Google Scholar] [CrossRef] [Green Version]
  36. Milanez, A.Y.; Nyko, D.; Valente, M.S.; Souza, L.C.; Bonomi, A.; Jesus, C.D.F.; Watanabe, M.D.B.; Chagas, M.F.; Rezende, M.C.A.F.; Cavalett, O.; et al. De promessa a realidade : Como o etanol celulósico pode revolucionar a indústria da cana-de-açúcar—Uma avaliação do potencial competitivo e sugestões de política pública. Biocombustíveis BNDES Set. 2015, 41, 237–294. [Google Scholar]
  37. Boschiero, B.N.; De Castro, S.G.Q.; Da Rocha, A.E.Q.; Franco, H.C.J.; Carvalho, J.L.N.; Soriano, H.L.; Dos Santos, J.A.; Bressiani, J.A.; Kölln, O.T. Biomass production and nutrient removal of energy cane genotypes in Northeastern Brazil. Crop Sci. 2019, 59, 379–391. [Google Scholar] [CrossRef]
  38. Grassi, M.C.B.; Pereira, G.A.G. Energy-cane and RenovaBio: Brazilian vectors to boost the development of Biofuels. Ind. Crops Prod. 2019, 129, 201–205. [Google Scholar] [CrossRef]
  39. Indústria Brasileira de Árvore (IBÁ). Relatório 2017; Indústria Brasileira de Árvore: Brasília, Brazil, 2017. [Google Scholar]
  40. Stape, J.L.; Binkley, D.; Ryan, M.G.; Fonseca, S.; Loos, R.A.; Takahashi, E.N.; Silva, C.R.; Silva, S.R.; Hakamada, R.E.; Ferreira, J.M.; et al. The Brazil Eucalyptus Potential Productivity Project: Influence of water, nutrients and stand uniformity on wood production. For. Ecol. Manag. 2010, 259, 1684–1694. [Google Scholar] [CrossRef]
  41. Cantarella, H.; Nassar, A.M.; Cortez, L.A.B.; Baldassin, R. Potential feedstock for renewable aviation fuel in Brazil. Environ. Dev. 2015, 15, 52–63. [Google Scholar] [CrossRef]
  42. Jonker, J.G.G.; Van der Hilst, F.; Junginger, H.M.; Cavalett, O.; Chagas, M.F.; Faaij, A.P.C. Outlook for ethanol production costs in Brazil up to 2030, for different biomass crops and industrial technologies. Appl. Energy 2015, 147, 593–610. [Google Scholar] [CrossRef]
  43. Eufrade, H.J., Jr.; Melo, R.X.; Sartori, M.M.P.; Guerra, S.P.S.; Ballarin, A.W. Sustainable use of eucalypt biomass grown on short rotation coppice for bioenergy. Biomass Bioenergy 2016, 90, 15–21. [Google Scholar] [CrossRef] [Green Version]
  44. Wilcken, C.F.; Lima, A.C.V.; Dias, T.K.R.; Masson, M.V.; Filho, P.J.F.; Dal Pogetto, M.H.F.A. Guia Prático de Manejo de Plantações de Eucalipto; Fundação de Estudos e Pesquisas Agrícolas e Florestais: Botucatu, Brazil, 2008; Volume 1, p. 25. [Google Scholar]
  45. Bonomi, A.; Cavalett, O.; Pereira da Cunha, M.; Lima, M.A.P. Virtual Biorefinery—An Optimization Strategy for Renewable Carbon Valorization, 1st ed.; Green Energy and Technology; Springer International Publishing: Basel, Switzerland, 2016; ISBN 978-3-319-26043-3. [Google Scholar]
  46. Nitzsche, R.; Budzinski, M.; Gröngröft, A. Techno-economic assessment of a wood-based biorefinery concept for the production of polymer-grade ethylene, organosolv lignin and fuel. Bioresour. Technol. 2016, 200, 928–939. [Google Scholar] [CrossRef] [PubMed]
  47. Pala, L.P.R.; Wang, Q.; Kolb, G.; Hessel, V. Steam gasification of biomass with subsequent syngas adjustment using shift reaction for syngas production: An Aspen Plus model. Renew. Energy 2017, 101, 484–492. [Google Scholar] [CrossRef]
  48. Sampaio, I.L.M.; Cardoso, T.F.; Souza, N.R.D.; Watanabe, M.D.B.; Carvalho, D.J.; Bonomi, A.; Junqueira, T.L. Electricity Production from Sugarcane Straw Recovered through Bale System: Assessment of Retrofit Projects. Bioenergy Res. 2019, 12, 865–877. [Google Scholar] [CrossRef] [Green Version]
  49. Watanabe, M.D.B.; Morais, E.R.; Cardoso, T.F.; Chagas, M.F.; Junqueira, T.L.; Carvalho, D.J.; Bonomi, A. Process simulation of renewable electricity from sugarcane straw: Techno-economic assessment of retrofit scenarios in Brazil. J. Clean. Prod. 2020, 254, 120081. [Google Scholar] [CrossRef]
  50. Telmo, C.; Lousada, J.; Moreira, N. Proximate analysis, backwards stepwise regression between gross calorific value, ultimate and chemical analysis of wood. Bioresour. Technol. 2010, 101, 3808–3815. [Google Scholar] [CrossRef]
  51. Cavalett, O.; Chagas, M.F.; Magalhães, P.S.G.; Carvalho, J.L.N.; Cardoso, T.F.; Franco, H.C.J.; Braunbeck, O.A.; Bonomi, A. The Agricultural Production Model. In Virtual Biorefinery—An Optimization Strategy for Renewable Carbon Valorization; Bonomi, A., Cavalett, O., Pereira da Cunha, M., Lima, M.A.P., Eds.; Green Energy and, Technology; Springer International Publishing: Basel, Switzerland, 2016; pp. 13–51. [Google Scholar]
  52. Matsuoka, S.; Bressiani, J.; Maccheroni, W.; Fouto, I. Bioenergia de Cana. In Cana-de-Açúcar Bioenergia, Açúcar e Ácool; UFV: Viçosa, Brazil, 2012; pp. 544–577. [Google Scholar]
  53. De Lima Silva, J.P.; De Aquino, G.S.; Navroski, D.; De Souza, I.F.; Soriano, H.L.; Bressiani, J.A.; Ralisch, R. Biometrics, productivity and technological quality of 23 energy sugarcane hybrid clones with higher lignocellulosic biomass. Aust. J. Crop Sci. 2018, 12, 915–921. [Google Scholar] [CrossRef]
  54. Moreira, B.R.A.; Viana, R.S.; Lisboa, L.A.M.; Lopes, P.R.M.; Figueiredo, P.A.M.; Ramos, S.B.; Bonini, C.S.B.; Trindade, V.D.R.; Andrade, M.G.O.; May, A. Classifying Hybrids of Energy Cane for Production of Bioethanol and Cogeneration of Biomass-Based Electricity by Principal Component Analysis-Linked Fuzzy C-Means Clustering Algorithm. J. Agric. Sci. 2019, 11, 246. [Google Scholar] [CrossRef]
  55. Chagas, M.F.; Bordonal, R.O.; Cavalett, O.; Carvalho, J.L.N.; Bonomi, A.; La Scala, N. Environmental and economic impacts of different sugarcane production systems in the ethanol biorefinery. Biofuels Bioprod. Biorefin. 2016, 10, 89–106. [Google Scholar] [CrossRef]
  56. Instituto Agronômico (IAC)—FUNDAG. Boletim Técnico n.° 100—Recomendações de Adubação e Calagem Para o Estado de São Paulo; Instituto Agronômico (IAC)—FUNDAG: Campinas, Brazil, 1997. [Google Scholar]
  57. Instituto de Desenvolvimento Agroindustrial (IDEA). Indicadores de Desempenho da Agroindústria Canavieira—Safras 2012/13 e 2013/14; Instituto de Desenvolvimento Agroindustrial (IDEA): Ribeirao Preto, Brazil, 2014. [Google Scholar]
  58. Seixas, F.; Bauch, S.C.; De Oliveira, E.D., Jr. Balanço energético e econômico de duas alternativas de descascamento de madeira de eucalipto Energetic balance and economical study of two debarking alternatives for Eucalypts wood. Sci. For. 2005, 67, 37–43. [Google Scholar]
  59. Federação da Agricultura e Pecuária de Goiás (FAEG). Custo Operacional de Produção de Eucalipto em Goiás; Federação da Agricultura e Pecuária de Goiás (FAEG): Goiânia, Brazil, 2012. [Google Scholar]
  60. Amos, W.A. Report on Biomass Drying Technology; National Renewable Energy Laboratory: Golden, CO, USA, 1998. [Google Scholar]
  61. Petersen, A.M.; Farzad, S.; Görgens, J.F. Techno-economic assessment of integrating methanol or Fischer-Tropsch synthesis in a South African sugar mill. Bioresour. Technol. 2015, 183, 141–152. [Google Scholar] [CrossRef]
  62. Feldmann, H.F.; Paisley, M.A.; Appelbaum, H.R.; Taylor, D.R. Conversion of Forest Residues To a Methane—Rich Gas in a High-Throughput Gasifier; Battelle: Columbus, OH, USA, 1988. [Google Scholar]
  63. Bain, R.L. Material and Energy Balances for Methanol from Biomass Using Biomass Gasifiers; National Renewable Energy Laboratory: Golden, CO, USA, 1992. [Google Scholar]
  64. Craig, K.R.; Mann, M.K. Cost and Performance Analysis of Biomass-Based Integrated Gasification Combined-Cycle (BIGCC) Power Systems; National Renewable Energy Laboratory: Golden, CO, USA, 1996. [Google Scholar]
  65. Spath, P.; Aden, A.; Eggeman, T.; Ringer, M.; Wallace, B.; Jechura, J. Biomass to Hydrogen Production Detailed Design and Economics Utilizing the Battele Columbus Laboratory Indirectly-Heated Gasifier; National Renewable Energy Laboratory: Golden, CO, USA, 2005. [Google Scholar]
  66. Xu, G.; Murakami, T.; Suda, T.; Matsuzawa, Y.; Tani, H. The superior technical choice for dual fluidized bed gasification. Ind. Eng. Chem. Res. 2006, 45, 2281–2286. [Google Scholar] [CrossRef]
  67. Corella, J.; Toledo, J.M.; Molina, G. A review on dual fluidized-bed biomass gasifiers. Ind. Eng. Chem. Res. 2007, 46, 6831–6839. [Google Scholar] [CrossRef]
  68. Dutta, A.; Talmadge, M.; Hensley, J.; Worley, M.; Dudgeon, D.; Barton, D.; Groenendijk, P.; Ferrari, D.; Stears, B.; Searcy, E.M.; et al. Process Design and Economics for Conversion of Lignocellulosic Biomass to Ethanol—Thermochemical Pathway by Indirect Gasification and Mixed Alcohol Synthesis; National Renewable Energy Laboratory: Golden, CO, USA, 2011. [Google Scholar]
  69. Nexant Inc. Equipment Design and Cost Estimation for Small Modular Biomass Systems, Synthesis Gas Cleanup, and Oxygen Separation Equipment—Task 2: Gas Cleanup Design and Cost Equipment Design and Cost Estimation for Small Modular Biomass Systems, Synthesis Gas; Work performed by Nexant Inc.: San Francisco, CA, USA; National Renewable Energy Laboratory: Golden, CO, USA, 2006. [Google Scholar]
  70. Francis, S.M.; Richard, E.T. Oilfield Processing of Petroleum: Natural Gas; PennWell Books: Tusla, OK, USA, 1991; Volume 1, ISBN 978-0878143436. [Google Scholar]
  71. Dry, M.E. The Fischer—Tropsch process: 1950–2000. Catal. Today 2002, 71, 227–241. [Google Scholar] [CrossRef]
  72. Tijmensen, M.J.A.; Faaij, A.P.C.; Hamelinck, C.N.; Van Hardeveld, M.R.M. Exploration of the possibilities for production of Fischer Tropsch liquids and power via biomass gasification. Biomass Bioenergy 2002, 23, 129–152. [Google Scholar] [CrossRef]
  73. Espinoza, R.L.; Steynberg, A.P.; Jager, B.; Vosloo, A.C. Low temperature Fischer-Tropsch synthesis from a Sasol perspective. Appl. Catal. A Gen. 1999, 186, 13–26. [Google Scholar] [CrossRef]
  74. Song, H.; Ramkrishna, D.; Trinh, S.; Wright, H. Operating strategies for Fischer-Tropsch reactors: A model-directed study. Korean J. Chem. Eng. 2004, 21, 308–317. [Google Scholar] [CrossRef]
  75. Klerk, A. De Fischer-Tropsch fuels refinery design. Energy Environ. Sci. 2011, 4, 1177–1205. [Google Scholar] [CrossRef]
  76. Rezaiyan, J.; Cheremisinoff, N.P. Gasification Technologies—A Primer for Engineers and Scientists; CRC Press: Boca Raton, FL, USA, 2005; ISBN 978-0824722470. [Google Scholar]
  77. Basu, P. Biomass Gasification and Pyrolysis; Academic Press: Burlington, MA, USA, 2010; ISBN 9780123749888. [Google Scholar]
  78. Associação Brasileira de Normas Técnicas. ABNT NBR ISO 14044: Gestão Ambiental—Avaliação do Ciclo de Vida—Princípios e Estrutura; Brazilian Technical Standards Association: Rio de Janeiro, Brazil, 2009. [Google Scholar]
  79. Associação Brasileira de Normas Técnicas. ABNT NBR ISO 14044: Gestão Ambiental—Avaliação do Ciclo de Vida—Requisitos e Orientações; Brazilian Technical Standards Association: Rio de Janeiro, Brazil, 2009. [Google Scholar]
  80. Intergovernmental Panel on Climate Change (IPCC). Climate Change 2014: Synthesis Report. Contribution of Working Groups I, II and III to the Fifth Assessment Report of the Intergovernmental Panel on Climate Change; The Core Writing Team, R.K., Pachauri Meyer, L., Eds.; IPCC: Geneva, Switzerland, 2014. [Google Scholar]
  81. Agência Nacional do Petróleo Gás Natural E Biocombustíveis (ANP). Planilha RenovaCalc V.6.1 (Ferramenta de Cálculo da Intensidade de Carbono de Biocombustíveis). Available online: http://www.anp.gov.br/producao-de-biocombustiveis/renovabio/renovacalc (accessed on 16 July 2020).
  82. Ministério de Minas e Energia (MME). RenovaBio. Consulta Pública—Anexo da Nota Técnica no 12/2018/DBIO/SPG. Proposta de Metas Compulsórias Anuais de Redução de Emissões na Comercialização de Combustíveis. Available online: http://www.mme.gov.br/c/document_library/get_file?uuid=40d35ad0-582d-82e3-1de0-61979c5905ae&groupId=36224 (accessed on 13 July 2020).
  83. Agência nacional do Petróleo Gás Natural e Biocombustíveis (ANP). Preços de Produtores e Importadores de Derivados de Petróleo. Available online: http://www.anp.gov.br/precos-e-defesa-da-concorrencia/precos/precos-de-produtores (accessed on 6 December 2018).
  84. Centro de Estudos Avançados em Economia Aplicada (CEPEA). Indicador Mensal Etanol Hidratado CEPEA/ESALQ Combustível—Estado de São Paulo. Available online: http://cepea.esalq.usp.br/etanol/ (accessed on 9 December 2018).
  85. Câmara de Comercialização de Energia Elétrica (CCEE). Historical Prices of Electricity in the Regulated Market (Auctions). Available online: https://www.ccee.org.br/portal/faces/pages_publico/o-que-fazemos/como_ccee_atua/precos/historico_preco_semanal?_afrLoop=1103462852327649&_adf.ctrl-state=h9vdymyim_82#!%40%40%3F_afrLoop%3D1103462852327649%26_adf.ctrl-state%3Dh9vdymyim_86 (accessed on 12 April 2018).
  86. Newnan, D.G.; Eschenbach, T.G.; Lavelle, J.P. Engineering Economic Analysis, 9th ed.; Oxford University Press: New York, NY, USA, 2004; ISBN 0-19-516807-0. [Google Scholar]
  87. Watanabe, M.D.B.; Pereira, L.G.; Chagas, M.F.; Cunha, M.P.; Jesus, C.D.F.; Souza, A.; Rivera, E.C.; Maciel Filho, R.; Cavalett, O.; Bonomi, A. Sustainability Assessment Methodologies. In Virtual Biorefinery—An Optimization Strategy for Renewable Carbon Valorization; Springer International Publishing: Basel, Switzerland, 2016; pp. 155–188. [Google Scholar]
  88. INTRATEC. Location Factor for Brazil. Available online: https://www.intratec.us/indexes-and-pricing-data/location-factor/brazil (accessed on 3 September 2020).
  89. Programa de Disseminação das Estatísticas do Trabalho (PDET). Base de Dados Online. Available online: http://pdet.mte.gov.br/acesso-online-as-bases-de-dados (accessed on 22 October 2019).
  90. Van Vliet, O.P.R.; Faaij, A.P.C.; Turkenburg, W.C. Fischer-Tropsch diesel production in a well-to-wheel perspective: A carbon, energy flow and cost analysis. Energy Convers. Manag. 2009, 50, 855–876. [Google Scholar] [CrossRef]
  91. Tock, L.; Gassner, M.; Maréchal, F. Thermochemical production of liquid fuels from biomass: Thermo-economic modeling, process design and process integration analysis. Biomass Bioenergy 2010, 34, 1838–1854. [Google Scholar] [CrossRef]
  92. Festel, G.W. Biofuels—Which is the most economic one? Chimia (Aarau) 2007, 61, 744–749. [Google Scholar] [CrossRef]
  93. Mustapha, W.F.; Bolkesjø, T.F.; Martinsen, T.; Trømborg, E. Techno-economic comparison of promising biofuel conversion pathways in a Nordic context—Effects of feedstock costs and technology learning. Energy Convers. Manag. 2017, 149, 368–380. [Google Scholar] [CrossRef]
Figure 1. Connection between agricultural and industrial computational simulations.
Energies 13 04576 g001
Figure 2. Block flow diagram for first-generation (1G) process integrated to the 2G thermochemical conversion of lignocellulosic materials to advanced Fischer–Tropsch (FT) biofuels.
Energies 13 04576 g002
Figure 3. Fixed capital investment shared by area in (a) 1G2G-CS and (b) 1G2G-EC scenarios.
Energies 13 04576 g003
Figure 4. Breakdown of GHG emissions of hydrous ethanol (HE), green diesel (GD), renewable jet fuel (RJF), green gasoline (GG), and electric energy (EE) in the evaluated biorefinery scenarios.
Energies 13 04576 g004
Figure 5. Avoided GHG emissions. (a) Avoided GHG emissions of hydrous ethanol (HE), green diesel (GD), renewable jet fuel (RJF), green gasoline (GG) and electric energy (EE) in g CO2 eq/MJ (solid bars) and their percentage of reduction compared to fossil equivalent fuels (▲); (b) total annual avoided GHG emissions broken down into each biofuel contribution and (c) per area of biomass cultivated.
Energies 13 04576 g005
Figure 6. Tornado diagrams for risk analysis of IRR in (a) 1G2G-CS and (b) 1G2G-EC scenarios and GHG emissions related to production stages in (c) 1G2G-CS and (d) 1G2G-EC scenarios.
Energies 13 04576 g006aEnergies 13 04576 g006b
Table 1. Main parameters of conventional sugarcane and energy-cane production systems.
ParameterUnitConventional Sugarcane (CS)Energy-Cane (EC)
ValueReferenceValueReference
Fiber content 1%12.7 2[36]21.3 3[36]
Yieldt/ha/year80 4[45]140 5Average yield, based on [38,52,53,54]
Number of cuts per cycle 5[55]10[36]
Straw recovery%50Assumption100Assumption
Spatial dispersion factor 6%6[45]6Based on [45] 7
Urea-plantingkg N/ha/year30[55]30Based on [55] 7
Single superphosphate-plantingkg P2O5/ha/year180[55]180Based on [55] 7
Potassium chloride-plantingkg K2O/ha/year120[55]200Based on [56] 8
Urea-ratoonkg N/ha/year120[55]180Based on [56] 9
Single superphosphate-ratoonkg P2O5/ha/year0[55]40Based on [56] 10
Potassium chloride-ratoonkg K2O/ha/year 150[55]220Based on [56] 11
Vinasse applicationm3/ha/year220[57]330Assumption 12
1 Mineral impurities not included.2 Stalks fiber content (fiber content at mills, including vegetal impurities, is 14%). 3 Integral composition (stalks + straw). 4 Stalks yield (wet basis). 5 EC yield refers to the total biomass, including stalks and straw, which are not separated in the harvesting process. 6 The spatial dispersion factor represents the concentration of biomass in the circular area around the mill [45]. 7 Assumed the same as CS. 8 For high sugarcane yield. 9 Calculated based on the crop nutrient export, considering the export of 0.9 kg N per tonne of material, and the application of an excess of 20% in relation to the export. 10 Calculated based on the crop nutrient export, considering the export of 0.2 kg P2O5 per tonne of material, and the application of an excess of 20% in relation to the export. 11 Calculated based on the crop nutrient export, considering the exportation of 1.1 kg K2O per tonne of material, and the application of an excess of 20% in relation to the export. 12 Assumed to maintain the sugarcane cultivation area that receives vinasse similar to that of CS, since vinasse derived from EC is more diluted in terms of potassium than CS and potassium extraction in the case of EC is also higher.
Table 2. Main parameters of the eucalyptus production system.
ParameterUnitValueReference
Yield (including bark)m3/ha323[58]
Production cycleyears7[58]
Effective harvest days per year-350Assumed
Basic densityt/m30.39[58]
Bark content% v/v14.4[58]
Spatial dispersion factor%5.3Based on industry information
Single superphosphate–plantingkg P2O5/ha330[59]
NPK 04-30-10–plantingkg/ha420[59]
Potassium chloride-maintenancekg K₂O/ha0.28[59]
Ammonium sulfate–maintenancekg N/ha0.25[59]
Table 3. Selected technical results of the evaluated scenarios.
Technical ResultsUnit1G-CS1G2G-CS1G2G-EC
Biomass delivered to industrial plant
(per year)
CS (stalks)Million t (wet basis)44-
CS straw1 (bale + vegetal impurities)Million t (dry basis)0.280.28-
ECMillion t (wet basis)--4
EucalyptusMillion t (dry basis)-0.800.86
Total area for biomass productionha52,63297,10776,985
Diesel consumption 2m3/year15,49525,81623,981
Biomass cost 3CS (stalks)US$/wet t23.3219.74-
CS strawUS$/dry t26.7021.46-
ECUS$/wet t--14.44
EucalyptusUS$/m3-26.1726.18
Biomass production system greenhouse gas (GHG) emissionsCSg CO2 eq/wet kg40.328.6-
ECg CO2 eq/wet kg--21.6
Eucalyptusg CO2 eq/wet kg-7.77.7
Product output (per year)Hydrous ethanolmillion L360360234
Green diesel sold to market 4million L-7146
Renewable Jet Fuelmillion L-11684
Green Gasolinemillion L-145104
ElectricityGWh7512861194
Global efficiency 5% (LHV basis)45.457.750.9
FT reactor recycle ratio(mole of recycle per mole of fresh feed)-3.50.6
Overall FT reactor CO conversion (season) 6%-96.163.4
1G facility steam demandt/h260.2260.2399.2
1 Including bales and vegetal impurities. 2 Including agricultural machinery and transport of inputs, industrial residues, and biomass. For detailed information regarding diesel consumption, see Supplementary Material (Table S7). 3 Including biomass transportation to the biorefinery. 4 Already discounting diesel consumption.5 Energy output (MJ per year) per energy content in biomass including 1G and 2G processes, calculated according to Furtado Júnior et al. [33]. 6 For off-season data, see Supplementary Material (Table S8).
Table 4. Economic outputs of evaluated scenarios.
Parameter1G-CC1G2G-CC1G2G-EC
CAPEX (million US$)408.771096.581177.57
Fixed capital investment 1G (million US$)371.60132.45134.28
Fixed capital investment 2G (million US$)-864.45936.24
Working capital (million US$)37.1699.69107.05
OPEX (million US$ per year)118.03231.26207.28
Feedstock98.18136.59115.76
Other inputs3.3351.6645.67
Employee costs2.776.136.24
Maintenance11.1529.5132.12
Insurance and others2.606.987.49
Revenue (million US$ per year)221.90387.65323.95
Electricity45.4617.3372.30
Hydrous ethanol171.41171.41111.68
Gasoline-74.2753.55
Jet fuel-69.6150.19
Diesel-40.0125.81
Carbon credits5.0315.0210.40
Minimum selling price
Electricity (US$/MWh)51.6267.6179.46
Hydrous ethanol (US$/L)0.410.530.63
Gasoline (US$/L)-0.570.67
Jet fuel (US$/L)-0.670.79
Diesel (US$/L)-0.630.74
Net present value (NPV) (million US$)131.87−179.55−404.35
NPV/CAPEX0.32−0.16−0.34
IRR (% per year)16.49.46.2
Return of investment (years)4.98.010.6

