1. Introduction
Geophysics has changed significantly over the last three decades. An increase in computing power and technological progress allowed geophysicists to solve the ever more complex tasks. At the same time, the field of applications of geophysics has been expanding, and the market for geophysical services is changing. We posit that a change in geophysical tasks, applications, geography, and technology will inevitably lead to a shift in the professional language. If one can track changes in the frequency of terms used in recent years, one can shed light on the current state of academia and the industry, and possibly predict future changes. Here, we apply language processing methods to analyze changes in the professional language in geophysics.
The biases of different origin complicate big data [
1]. In machine learning, the difference between training data set and test data set can cause a bias. Massive sample study can lead to a bias associated with errors resulting from sampling or study design [
2]. Supposedly, it is better to have a smaller and more representative data set rather than more of biased data. Our goal is to understand what the modern geophysical language sounds like and what the future of geophysics might be. Here, we analyze only the scientific papers presented at the Society of Exploration Geophysicists (SEG) annual conferences and exhibitions. A program committee selects the papers for each annual conference; this procedure is the initial filter. Also, it is worth noting that presenting at such a meeting is a demonstration of technical capabilities of industrial companies and scientific viability of academic institutions. Each annual conference is a snapshot of the state of geophysics, and we use these snapshots for analysis and predictions.
Each SEG Annual Conference and Exhibition is one of the biggest gatherings of geophysicists in the world. Abstracts of the SEG annual conferences are a representation of the state of geophysical science, devoted mainly to the oil and gas industry. Over the last 30 years, articles in the electronic form have been available for analysis [
3]. SEG conducts all their annual conferences in the USA, and the last one was held in San Antonio, TX, in 2019. For analysis, we have selected the proceedings of all SEG annual conferences that form the most representative data set. Each conference proceedings reflects the state of academia and the oil and gas industry up to the submission deadline, because both academic institutions and industrial entities present their best achievements in the field.
In addition to conference proceedings, one can use journal articles for data mining as the volume of data each year is comparable to that in the SEG Annual Conference and Exhibition proceedings. For example, Vlad analyzed author information of the papers in the geophysics journals between 1936 and 2017 [
4], not considering article texts and the use of terms. He studied the number of co-authors, the number of publications by various universities and institutes, and other interesting features of 11,658 articles published over 81 years. The number of journal publications per year is smaller, but they are full-size papers. However, the release of articles in journals occurs with significant delays, and it is periodic, monthly or quarterly. At a conference, publications happen all at once each year. The research materials published in journals are usually reported at conferences; therefore, the conference proceedings include most of the content of full-size articles. Moreover, the number of research teams presenting their work is several times larger in conference proceedings when compared with the study of any particular journal. SEG annual conference proceedings represent a collection of scientific research from a large number of scientific and engineering teams in one place each of the 30 years. Therefore, their analysis allows one to conduct a uniquely comprehensive language study and trace the dynamics of changes in academia and industry.
2. Materials and Methods
In this work, we have used the open-source Python libraries to transform, filter and process alphanumeric text: TextBlob, NLTK (Natural Language Toolkit), argparse, Pandas, Scrapy, Requests-HTML, sqlite3, and NumPy. To generate graphs, we have used Matplotlib, Plotly, PIL (Python Imaging Library), and others.
We used the digital versions of the SEG Annual Conference proceedings that have been available online for 30 years.
Figure 1 shows our workflow. We digitized articles in the PDF format from the SEG digital library website, converted them into plain TXT format using “pdftotext” with “nopgbrk” (ignore page breaks), “enc ASCII7” (encode ASCII7 for the output) and “eol” (set the end-of-line convention) flags. The text dump was filtered to remove common words, misspellings, etc. from a NLTK dictionary “stopwords.” After the initial filtering, we tokenized the text by year and obtained si-, bi-, and trigrams (“sigram”-is a word, “bigram”-a two-word phrase, and “trigram”-a three-word phrase.). According to [
5], with a handful of exceptions most of geophysical English terms are formed by one, two, or three words. Hence in this manuscript, we only consider si-, bi-, and trigrams. Furthermore, we counted the number of times each word or phrase was repeated in the text. In the end, the entire text accumulated over 30 years is transformed into list of words and phrases with the corresponding number of repetitions for each year. We then analyze this list during an observation time, and display the results in a graphical format.
We normalize the data to the number of pages of all articles each year. Often pages are not entirely filled with text; there are many graphs and formulas. Since we precisely know the number of characters used, we can estimate the number of pages. We calculate the average number of pages, , for each year using the formula: , where i is the corresponding year, -number of symbols, and 3000 is the number of characters for a common, single-spaced web page. The estimated number of analyzed pages is 115,973. When analyzing the graphs in this paper, one can state the number of times a phrase occurred per page each year.
When we attempted to digitize the abstracts from the 1980s, numerous recognition errors, merged words, and typos occurred. Therefore, here we present the results of phrase count only for the period between 1990 and 2019.
In total, we have analyzed 21,864 papers consisting of more than 52 million words or more than 347 million symbols. The main result of this work is an open access database. This article is but a short example of how our database can be used to identify and summarize the processes taking place in industry and science. We encourage readers to use for their own research our published database with the abundance of material [
6].
3. Results
We present our analysis of the manuscript texts from the SEG annual conferences. However, instead of focusing on average text length or sentence complexity, we investigate the technical side. For example, we analyze and compare the frequency of occurrence of technical terms, such as “data” or “velocity.” This type of analysis sheds light on technology development and trends in the field.
3.1. Most Common Words and Phrases
Figure 2 shows the most commonly used si-, bi- and trigrams that have appeared in conference materials from 1990 to 2019. The most frequent words are “data,” “model,” “velocity” and “seismic.” Throughout the whole period of the study, the word “data” was mentioned more than 377,700 times, “seismic” 252,400 times, “model” more than 251,500 times, and “velocity” more than 223,300 times over the last 30 years. In comparison, the word “that” was mentioned 324,240 times.
Figure 2 does not include frequencies of abbreviations of the plotted terms. Most of the tri- and bigrams are devoted to seismic exploration and seismic data processing.
The frequent use of these words tells us that most of the SEG articles are about seismic exploration and seismic data processing. The terms “wellbore” and “logging” were more popular during the 1990s, and now their relative occurrence is declining.
While the scaled average occurrences provide information regarding the key concepts used over time, they are of less interest for exactly the same reason. A more exciting approach is to monitor the evolution of other technical terms that constitute a subfield in geoscience or pertain to other disciplines. Such an analysis, however, is infinite. We limited the scope of this paper to the objectives of our study, methods of data gathering and processing, shales, and neural networks. We also considered the fastest growing and declining trends in the SEG publications.
3.2. Objects of Study
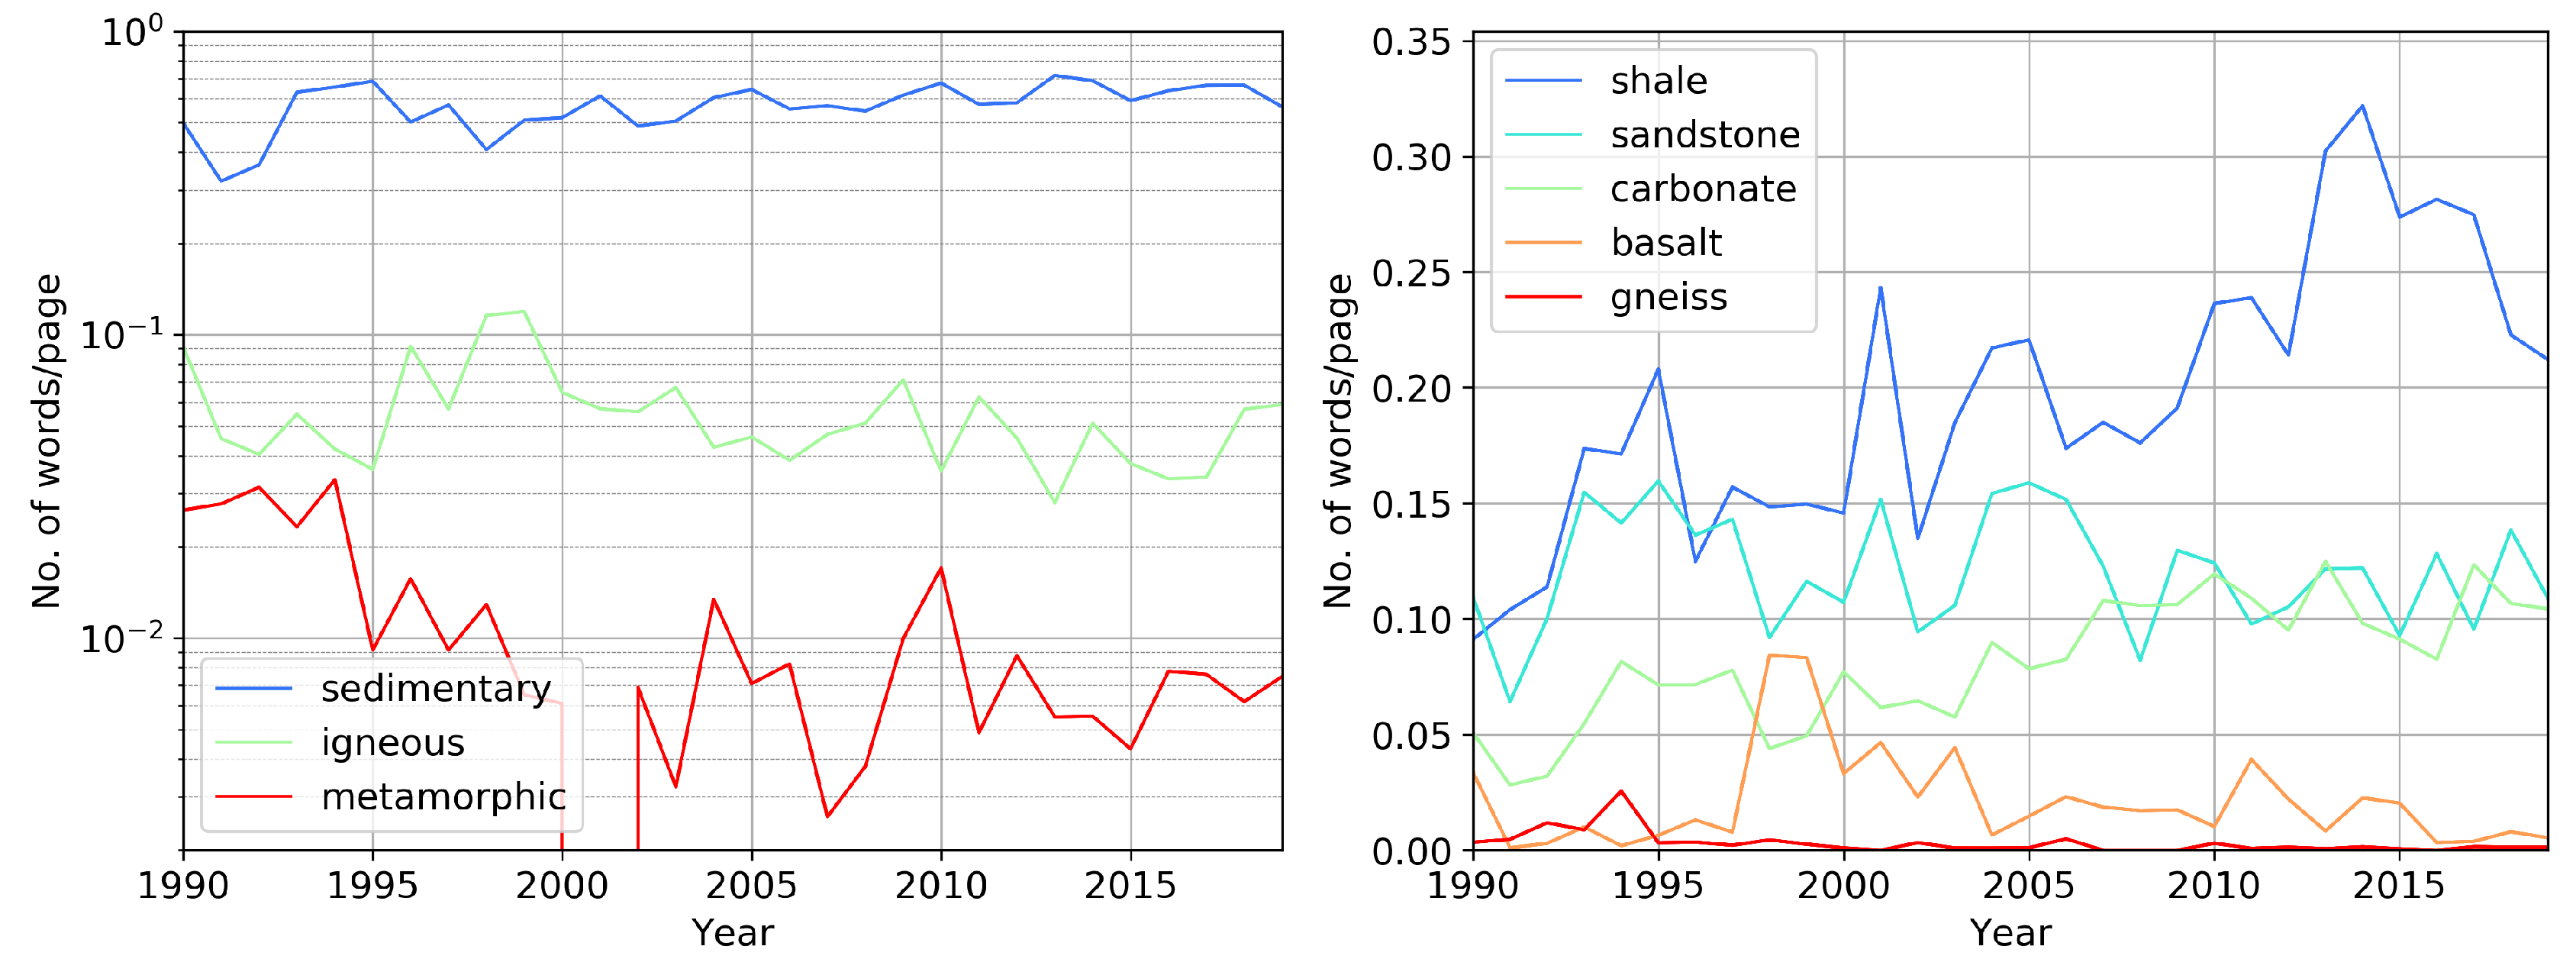
Figure 3 breaks down the most studied types of rocks. Each of the words on the left includes the most common names of rocks, e.g., sedimentary: shale, sandstone, conglomerate, carbonate, etc.; igneous: granite, diorite, basalt etc.; metamorphic: gneiss, phyllite, slate, etc. It shows the relative distribution of the objects of study: most research deals with the sedimentary rocks. Terms that describe igneous rocks are used about ten times less than “sedimentary,” and the least used terms are related to metamorphic rocks.
Figure 3 (right) shows the occurrence of rock types with time. The shale revolution that started in 2007 is clearly visible. The most frequent names of rocks are “shale,” “sandstone” and “carbonate.” We note how “shale” peaks around 2015 and starts declining afterwards. In addition, there is a steady increase in the appearance of “carbonate” (1990–2005), while “sandstone” has been used uniformly over the years. An attentive reader may notice that during the growth of the use of “shale,” the fluctuations in the use of “sandstone” and “carbonate” decreased.
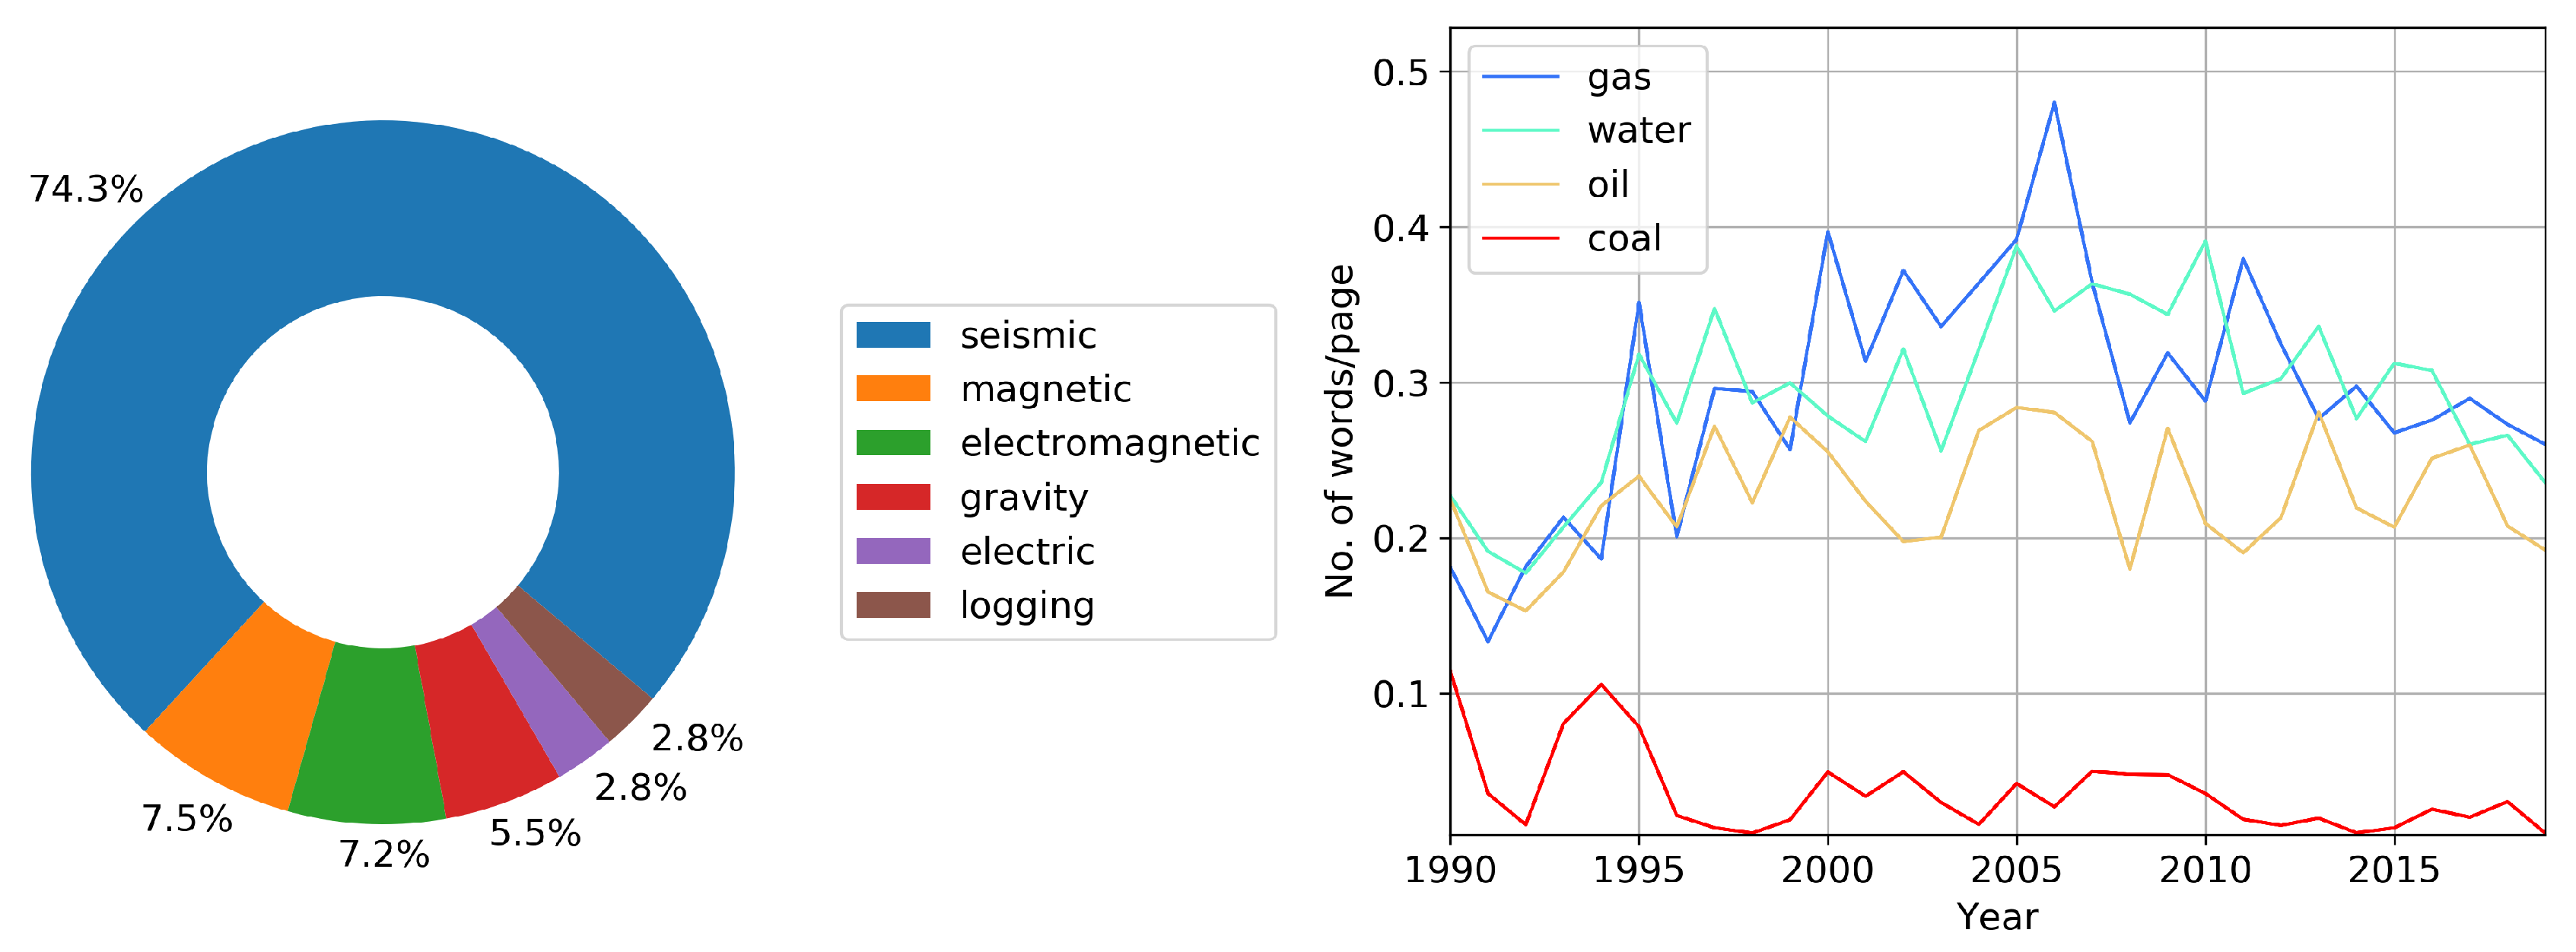
We break down the logical sum (Each of the words represents the sum of the related words: “seismic,” “seismics”; “magnetic,” “geomagnetic,” “aeromagnetic”; “electromagnetic,” “em”; “gravity,” “gravimetry,” “gravimetric”; “electric,” “geoelectric”; “logging,” “borehole geophysics.” Please note that we present here words related mainly to methods of exploration geophysics. We have not mentioned words related to other branches of geophysics, because they are much less common in the SEG annual meetings.) of the names of geophysical methods used between 1990 and 2019, see
Figure 4 (left). These composite words practically do not change over time, and we show the total in a pie chart. In
Figure 4 (left) we show the occurrence of the most common geophysical methods, and give an estimate of the SEG annual conference content. Three quarters of the material relates to the collection and processing of seismic data; the remaining quarter accounts for all other methods. We see that the primary method discussed at the SEG annual conferences is “seismic.” Its usage is an order of magnitude higher than those of all other methods, and its frequency of occurrence is still growing. It is worth noting that the word “seismic” is mentioned about four times more often than the word “geophysics.” In
Figure 4 (right), we break down the names of main resources that sustain our unsustainable civilization [
7]. We observe a slight increase in the frequency of the words “gas” and “water” from 1995 to 2015. Perhaps this is due to an increase in reservoir modeling research.
Figure 3 and
Figure 4 show that for the last 30 years there have been no significant changes in the use of geophysical methods and objects, with the exception of an increase in the frequency of occurrence of “shale” between 2007 to 2014.
Significant changes have occurred in the use of terms related to specific methods of geophysical survey and data processing. These changes will be discussed in the subsequent sections of the paper.
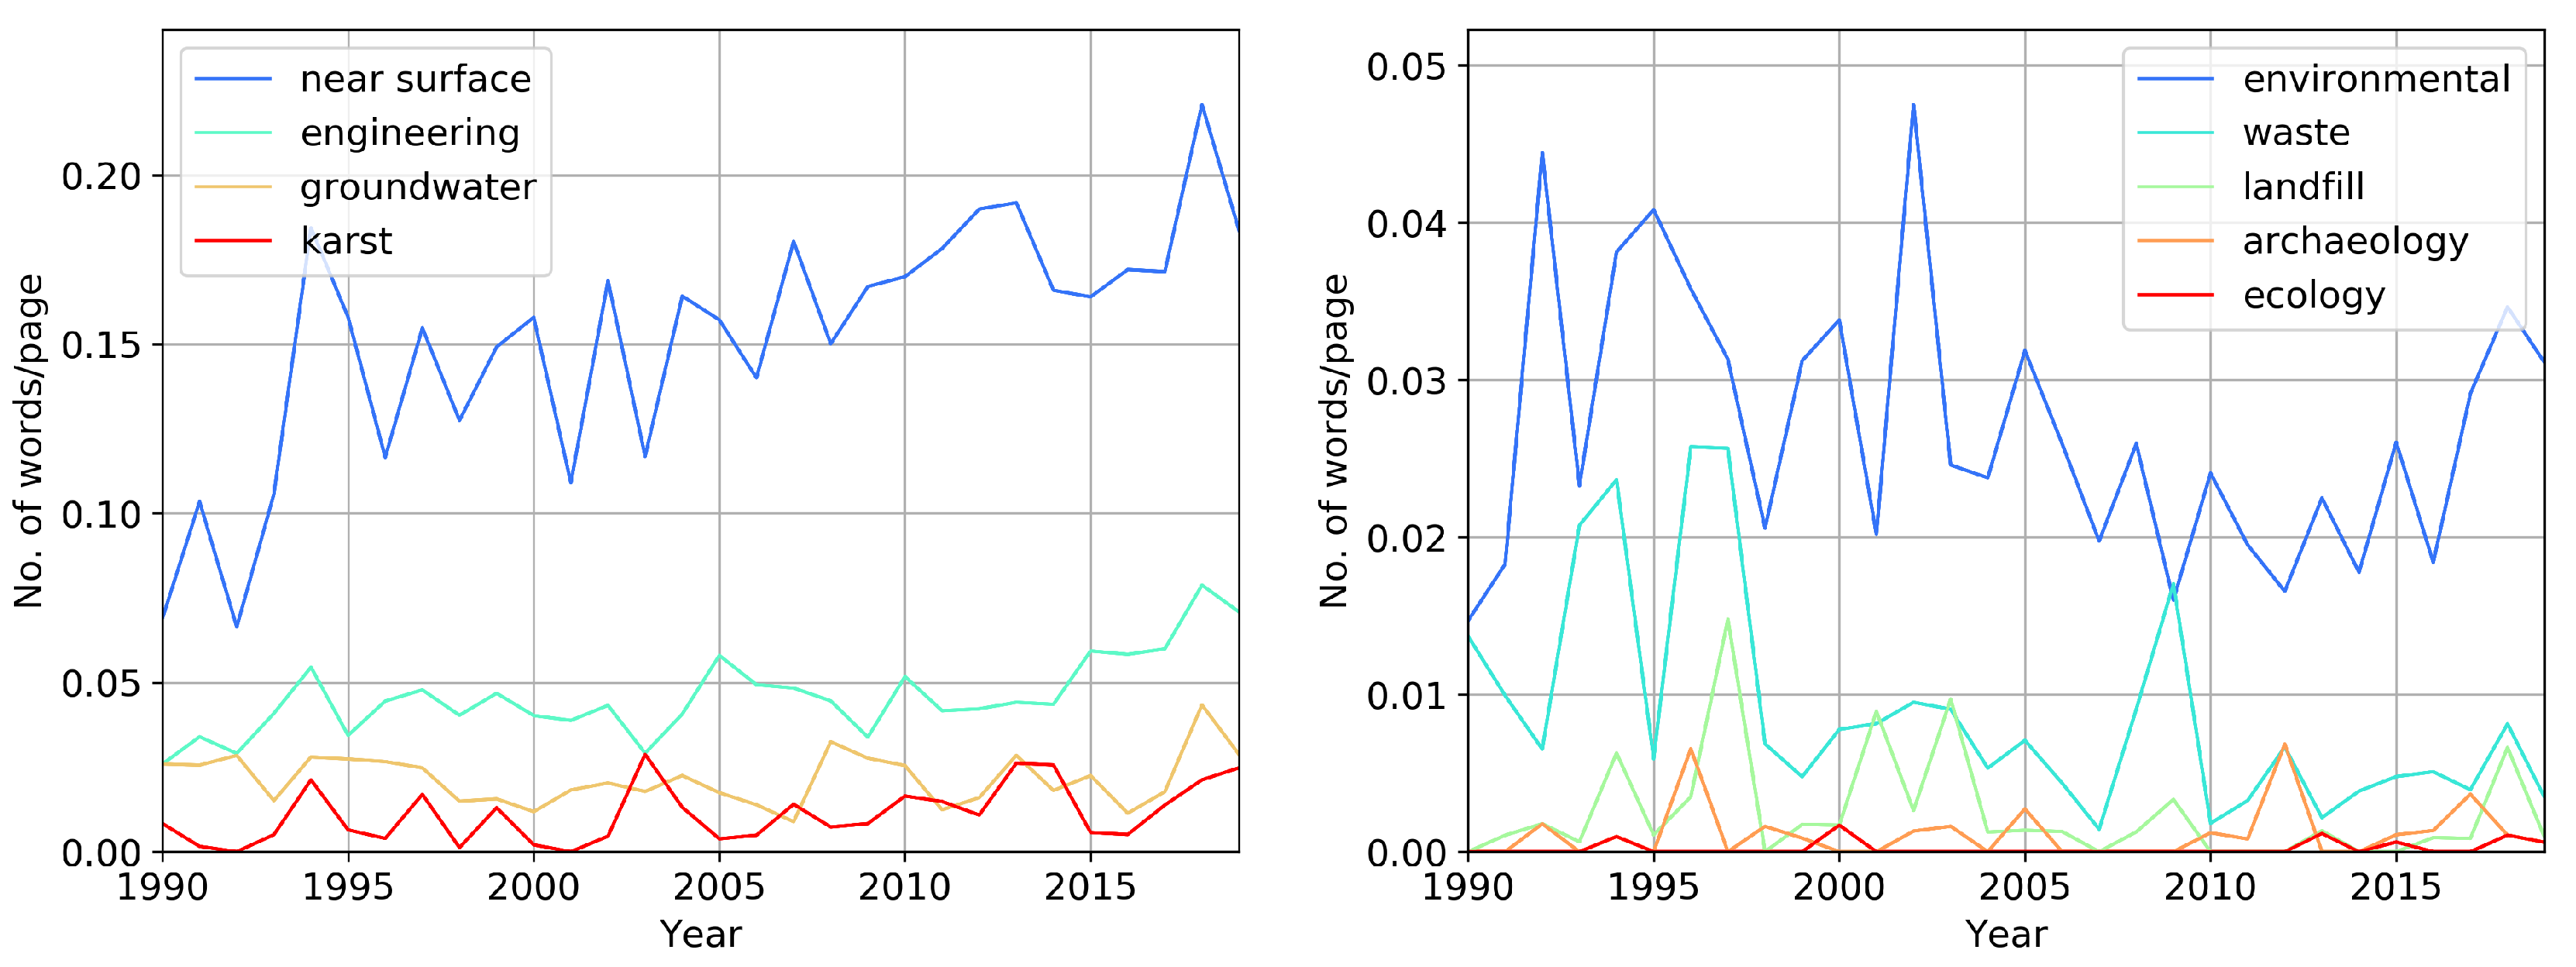
Figure 5 breaks down the frequency of terms in engineering geophysics. The left graph shows a steady increase in the mentions of words “near surface” and “engineering” in the past 30 years. Near-surface geophysics is mainly engaged in engineering tasks. The graph on the right shows the frequency of study objects in near-surface geophysics. On average their frequency does not change with time. It is worth noting the increase in the use of terms “environmental” and “waste” in the 90s. The word “waste” is found in the text with the following adjectives: hazardous, radioactive, nuclear, and others. The word “groundwater” is slightly growing in occurrence, showing that the task of finding water has become more relevant lately. We see that “ecology” and “archeology” do not occur much in the proceedings. Overall, we observe a slight increase in engineering geophysics terms.
3.3. Processing and Data Acquisition Methods
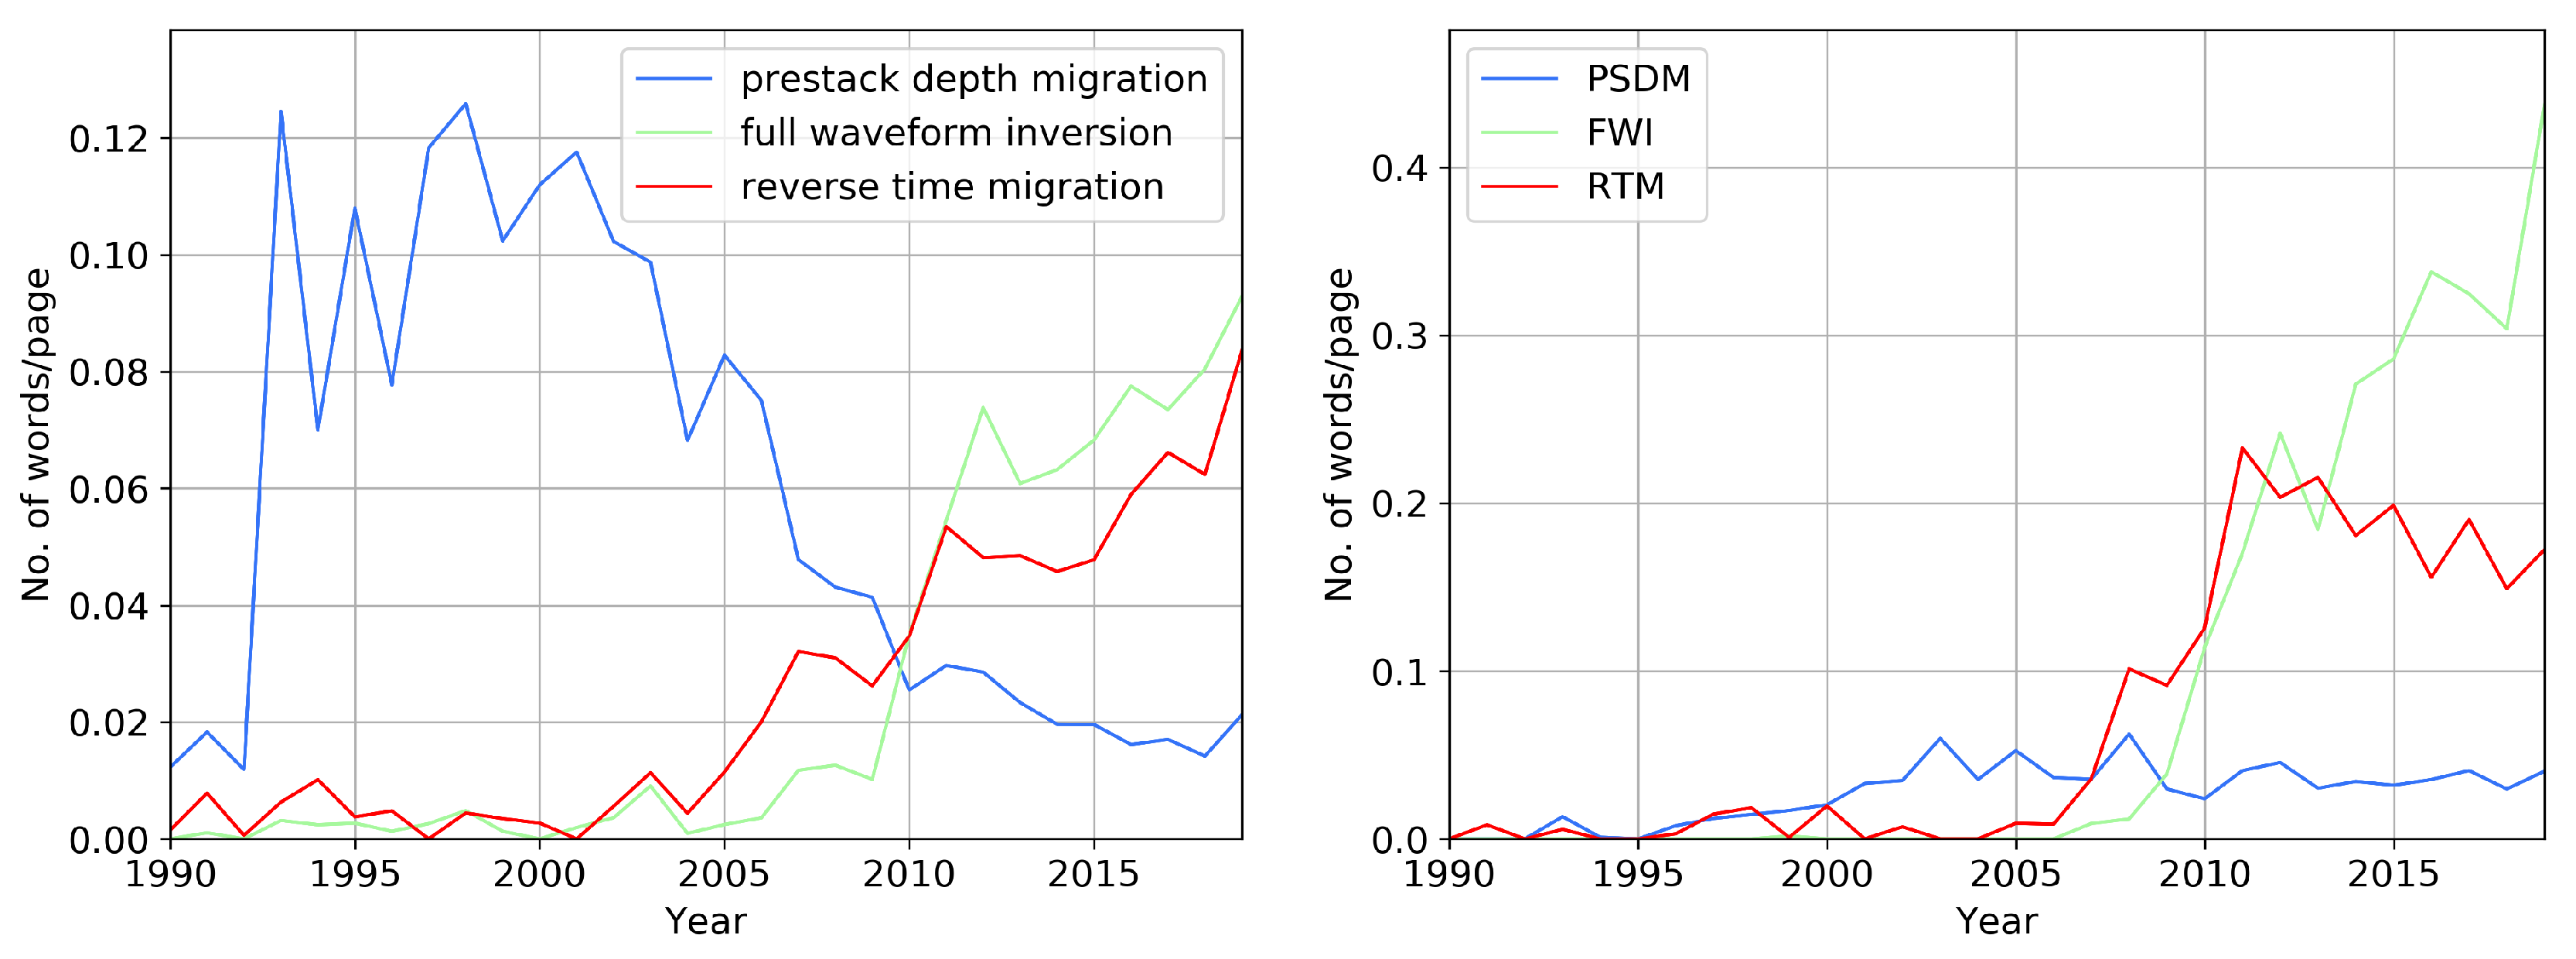
Of all the trigrams, the most frequently used now is “full waveform inversion” (
Figure 6), and it is still growing together with the abbreviation “FWI.” Full waveform inversion is a complicated data-fitting technique based on using the entire content of wavefield in order to extract quantitative information from seismic data [
8]. The second one is “reverse time migration,” and the 2019 top three close with “convolutional neural network.”
Figure 6 shows how the occurrence of “prestack depth migration” was surpassed by “full waveform inversion” and “reverse time migration.” The frequency of occurrence is higher if we consider abbreviations, in the right part of
Figure 6. It is interesting to note that the abbreviations “FWI” and “RTM” are used more often than “PSDM,” even when it was much more accessible. Perhaps this suggests a tendency to reduce and simplify terms. Some terms inevitably supplant other words, provided that the volume of published material is approximately the same. While reviewing conference proceedings for the last 30 years, we found many terms that were popular in the past, but did not find applications in the modern world.
Figure 7 (left) breaks down other trends in the seismic data processing algorithms. We see that “machine learning” appeared in the SEG annual conference proceedings more often in the past few years. The occurrence of “broadband” started to increase in the early 2010s, with a decline in 2016–2018, and it began to grow again in 2019. Using a wider frequency range and inclusion of low frequencies proved to contribute to better resolution, penetration, and inversion [
9]. In addition, “Marchenko” begins to emerge. “Marchenko” is a set of data-driven methods that help us to project surface seismic data to points in the subsurface. It relates the Green’s function from a virtual source inside a medium to the reflection response at the surface of that medium [
10,
11]. The “Markov”-chain-based approach is able to account for the change in seismic response of damaged structures [
12], and it correlates with the occurrence of the word “seismicity.” The term “seismicity” is used for induced seismicity risk estimation [
13], mine development [
14], and other applications. It is known that “machine learning” and “neural networks” have recently significantly evolved towards image recognition. In seismic data processing, “machine learning” is assumed to be really helpful with interpolation, automatization of reflection tracking, and data reconstruction from the under-sampled or missing traces [
15]. We will devote a separate section of the paper to the usage of “neural networks.”
Figure 7 (right) shows classic methods of seismic data processing and related terms. We see the rise and decline in the appearance of these methods in the last ten years. These methods were developed in the 1990s, by now they have already been studied sufficiently, and therefore their usage is declining. It should be noted that despite the decline in the frequency of occurrence of “Kirchhoff” (migration), “CMP” (Common Mid Point) gather, “NMO” (Normal Move Out), “velocity analysis” and “interferometry,” all of these words are used in industrial seismic activities. These words are still used quite often, but research and development of the methods associated with them occurred in the 1990s and early 2000s. The decrease in the frequency of occurrence suggests that research on this topic has decreased.
3.4. Shale Reserves
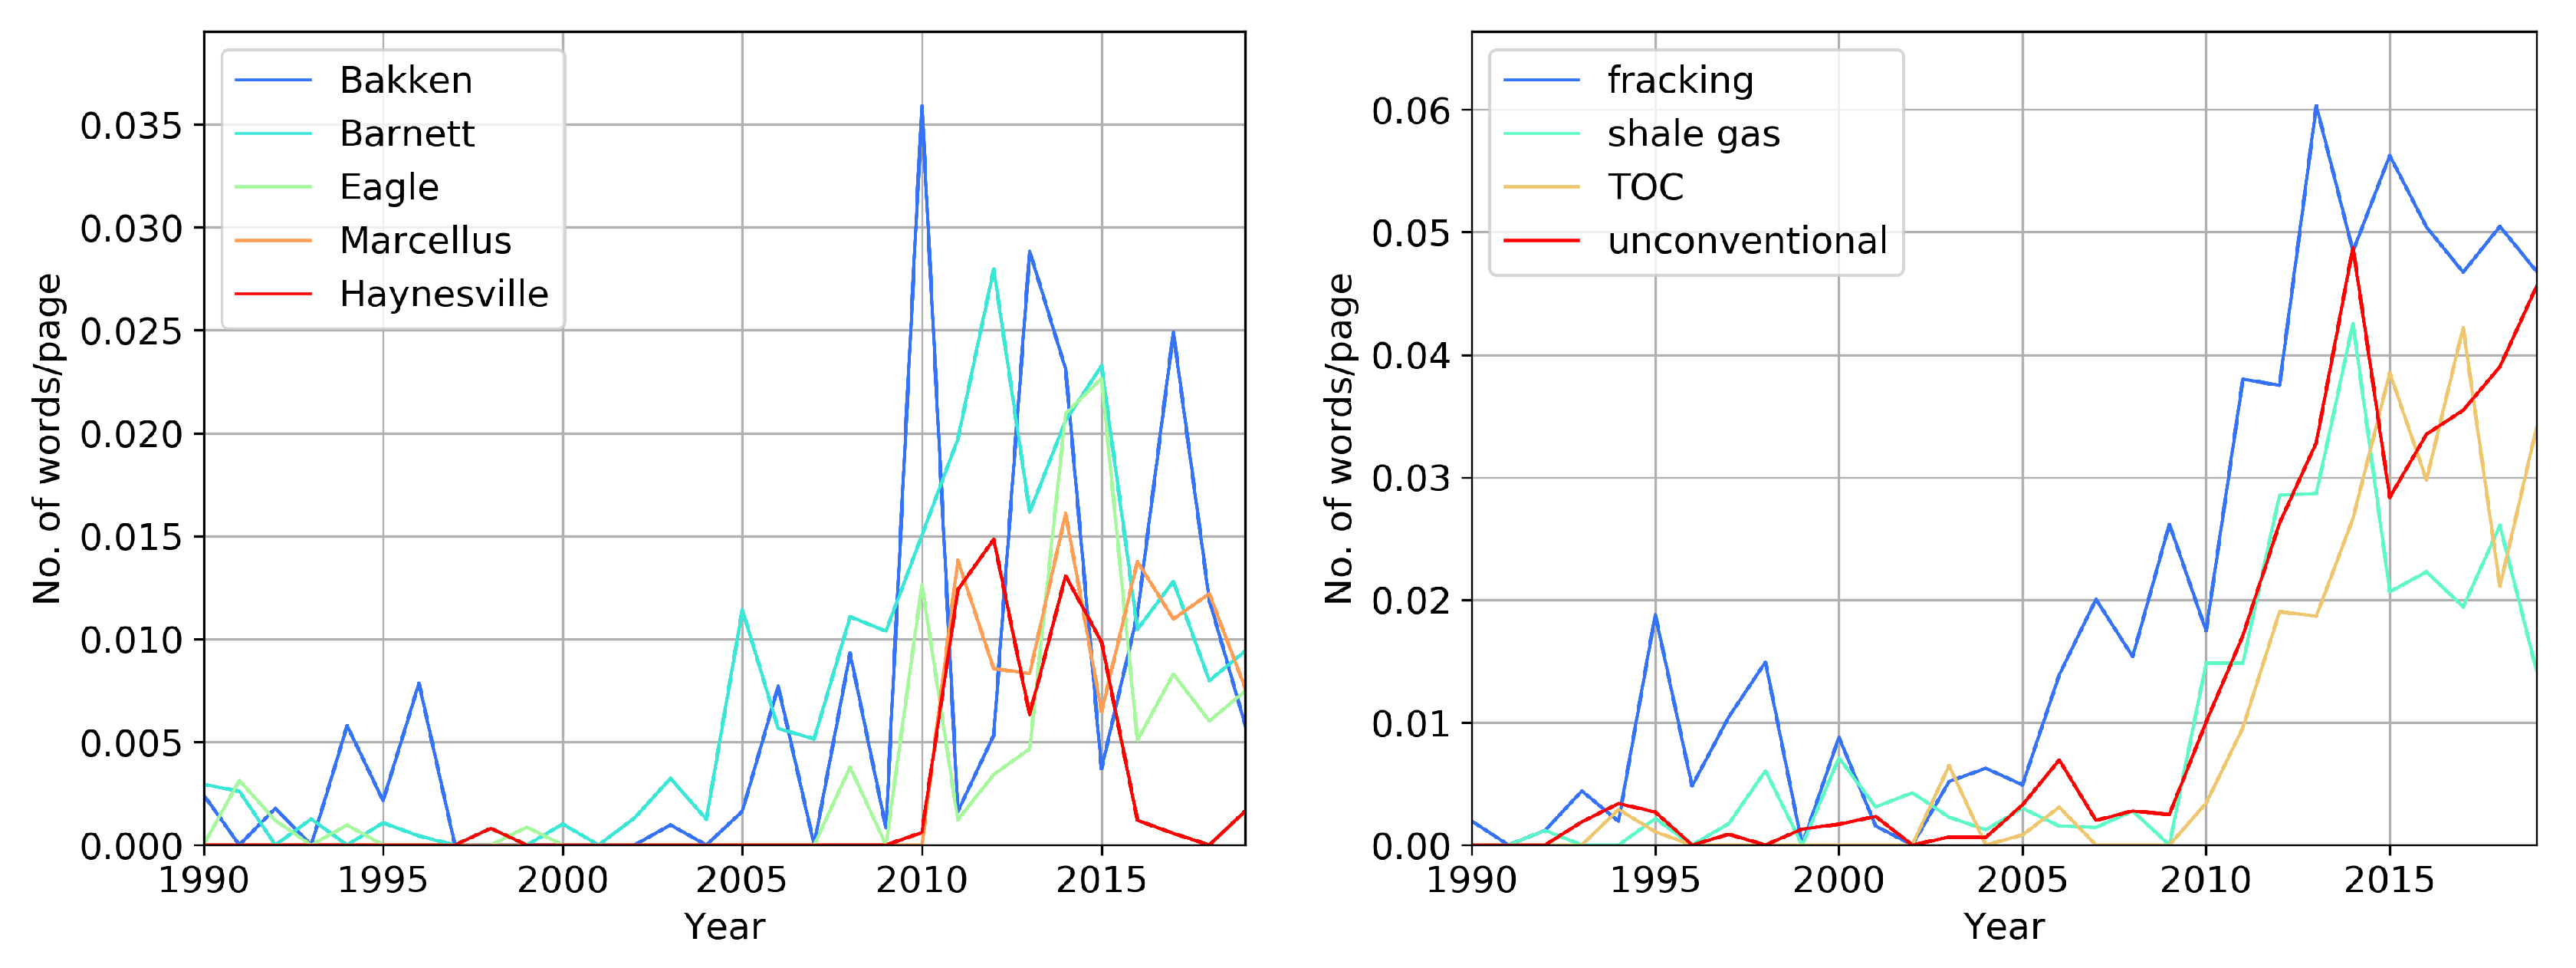
Figure 8 shows the most often used names of shale plays on the left, and “fracking” (includes “hydraulic fracturing,” “frac,” and “fracking”), and “shale gas” + “gas shale” on the right. We observe that the shale-related terms peaked between 2005 and 2015, and declined afterwards. In the past 20 years, “Bakken” [
16,
17] and “Barnett” [
18,
19] shales were mentioned more frequently than all other shale deposits. In 2019 “Marcellus,” “Eagle” (Ford), and “Barnett” have similar occurrences, about one time per hundred pages. However, the term “fracturing” does not show such a fast decline. Despite the fact that the names of gas shale deposits declined in use over the past three years, words that relate to the development and description of these deposits (“fracking,” “TOC”-total organic carbon, “unconventional”) showed continuing robust use.
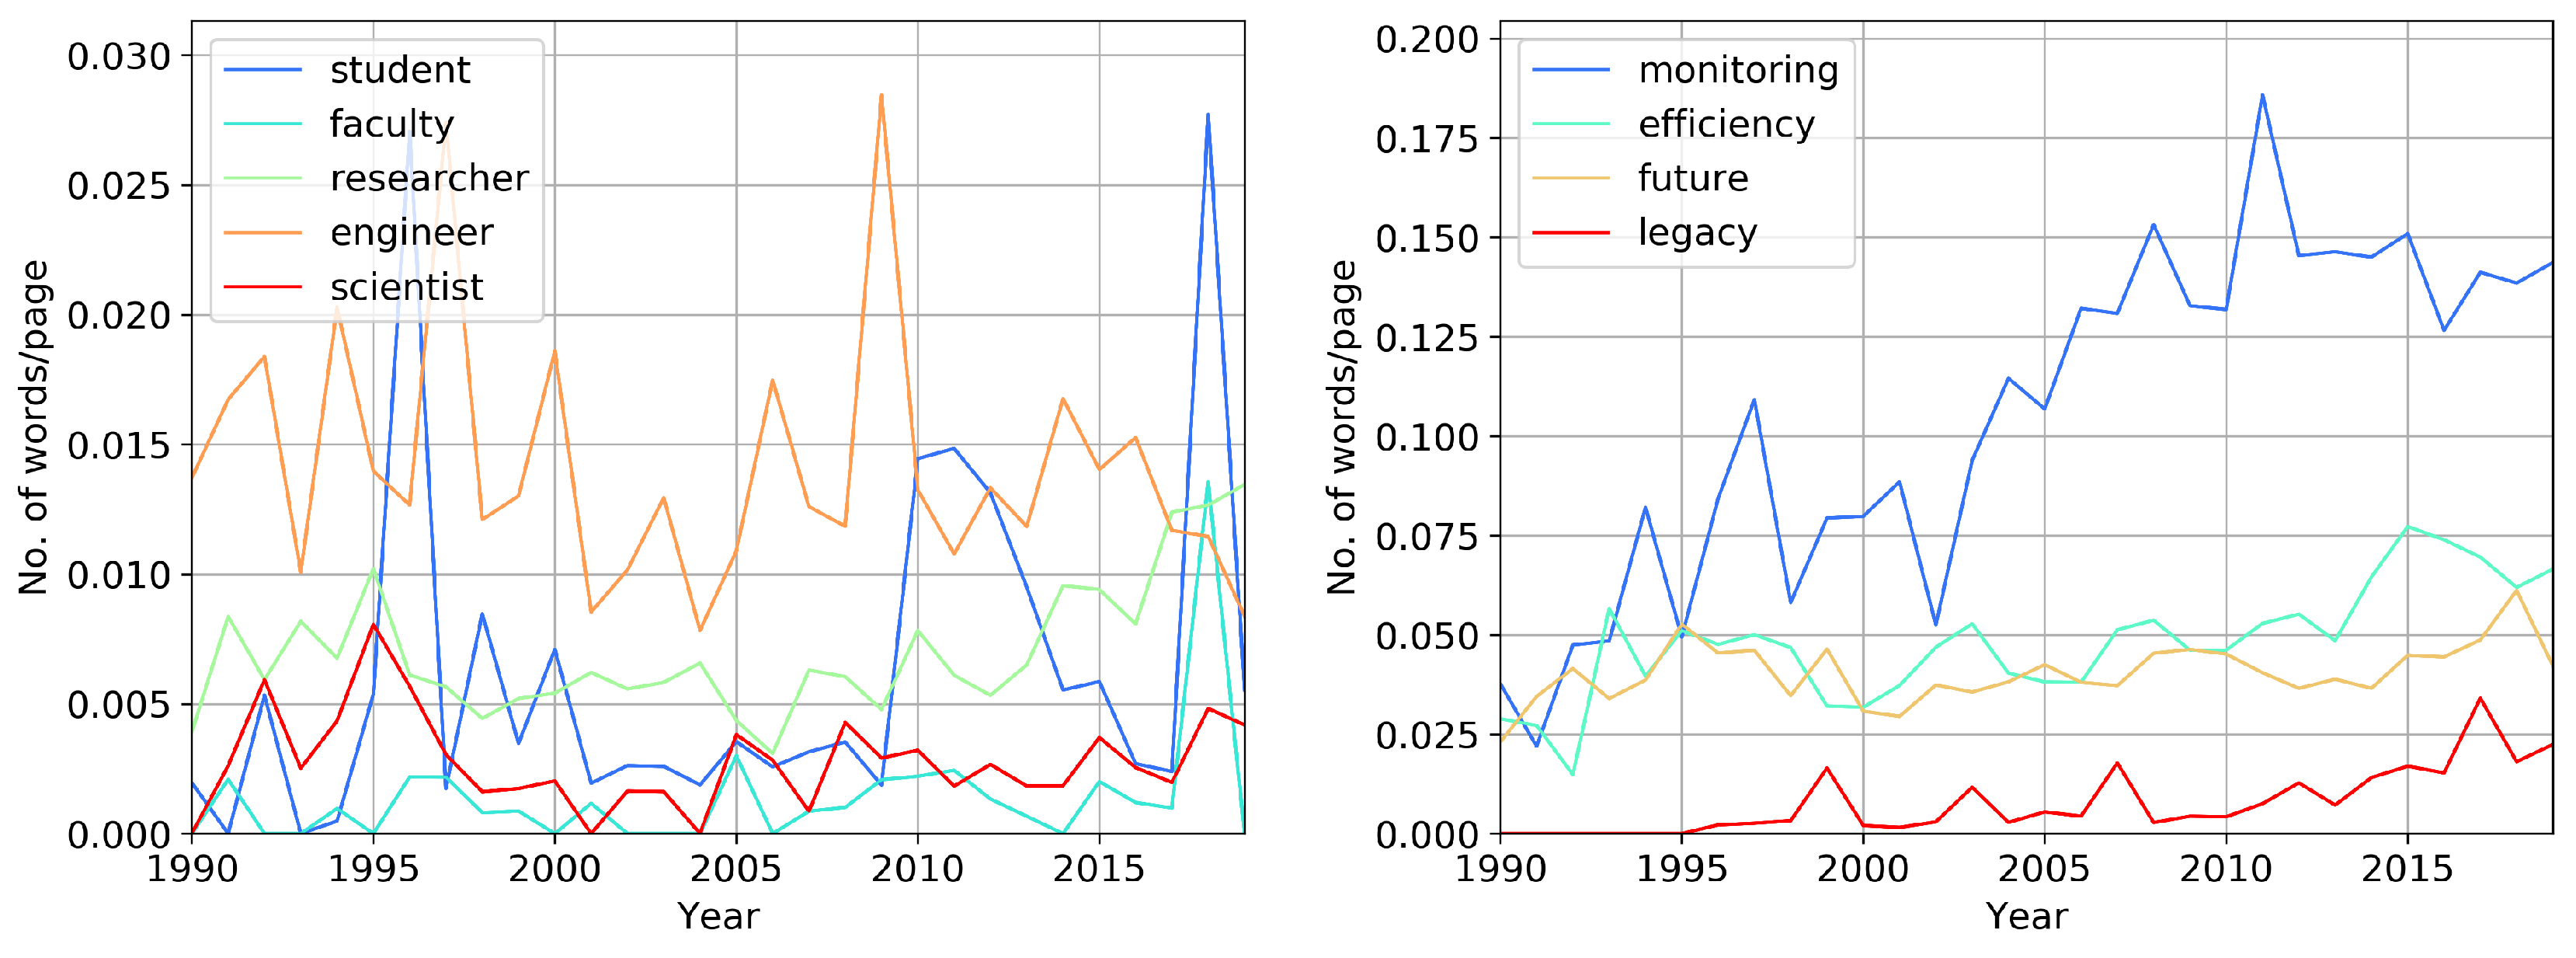
It is curious that in 2018, we observe an increase in the words “student,” “faculty,” and “researcher," see
Figure 9 (left). Does this mean that the number of academic papers grew then? You may notice the peaking of “engineer” after peaking of “student.” We observe growth in the frequency of “researcher” in the past ten years, and this word appeared more often than “engineer” in 2019. During the 1990s, we see more of “engineer” in comparison with “researcher” and “scientist.” In the past decade, this situation reversed, bringing “researcher” to the first place.
In
Figure 9 (right), we observe an increase in the usage of “monitoring.” For example, this term applies to microseismic monitoring and reservoir monitoring. The increased use of “monitoring” and “efficiency” indirectly indicates the concentration of researchers on brown fields, rather than on exploration and new development. The term “legacy” primarily refers to old data that is reprocessed using modern methods, including CNN. Since SEG has used the word “future” uniformly over the last 30 years, then-perhaps-we can all agree that the past has been shut and put behind us 30 times. What we mean is that the common use of the word “future” in no way brings this future closer.
3.5. Neural Networks
Poulton [
20] reviewed neural network applications in geophysics. She concluded that the main advantage of neural networks (NN) was high speed. NN do not replace physics-based modeling, but can be an intelligent amplification technique. In 2002, it was assumed that in the future, neural networks would be built into software packages and help the interpreter, freeing him from finding first breaks, tracking horizons, and other routine activities. A lot of research has been done in recent years to find the uses of neural networks in science in general and in geophysics in particular. There are many studies on the tasks neural networks can solve: reducing the noisiness of aerial electromagnetic surveys [
21], automated fault prediction [
22], prediction of laboratory earthquakes using machine learning [
23], and many others. Neural networks in geophysics are used for a very wide range of tasks and this is really an unusual phenomenon.
We see that usually growth in the use of terms is saw-like; it is non-monotonic with several peaks and valleys. Each peak represents the next phase of implementation, new research objectives, and new teams that have mastered a method. “Neural networks” show a qualitatively different picture. From 1990 to the beginning of 2000, attempts were made to use neural networks in geophysics, but they were suspended until 2016, when a rapid growth in the use of this and related terms began. On average, we find a “neural network” phrase on every fourth page of the conference materials. If we observe an increased interest in this topic, then the researchers sincerely believe that using machine learning can solve many problems of geophysics. Given this context, we pose the question: is automation of geophysical data processing the main problem of modern geophysics? We believe that the main problem of geophysics is the lack of new research objects, such as hydrocarbon reservoirs and other mineral deposits. Lack of survey objects is the reason for an increased interest in the development of methods for automatic processing of geophysical data. At the same time, use of, e.g., “monitoring” and “efficiency” is growing, which indicates an understanding of the need for higher recovery of hydrocarbons and for the monitoring of developed fields.
Figure 10 shows the appearance of “neural network,” “deep learning,” “artificial intelligence” and “field data.” We use the last phrase for reference as it has always been used. In 2019, “neural network,” occurred more often than “field data.” The same trend had already happened in 1993 and from 1999 to 2001. Later, this trend declined for a while but now “neural network,” “deep learning,” and “artificial intelligence” have started to grow again (“artificial intelligence” appeared during the 1980s). The question is: will this growth continue, or will it decline again, as it did in 1993–1995? The decline in interest in neural networks in the early 2000 can be explained by an insufficient amount of computing power to realize the capabilities of this method. Today, technological progress allows us to use neural network methods successfully for facial recognition in real time, which is a worrisome trend. We also see attempts to introduce neural networks to other domains. It is not necessary to be a rocket scientist to understand the reasons for the increasing interest in neural networks in geophysics. Experts want to automate geophysical data processing as much as possible. It remains only to be seen whether we need to automate seismic data processing deeply. With time, we will have fewer oilfields to be explored, providing space for monitoring and increasing production efficiency.
4. Discussion
Fortune Business Insights predicts a 40% growth of the global geophysical market by 2026 [
24]. At the same time, the influence of the COVID-19 quarantine and a decrease in oil prices in spring 2020 have not been taken into account [
25]. From text analysis, we see that the crisis of the geophysical market began to develop long before the fall of oil prices and the COVID-19 pandemic in early 2020. We understand that the number of new large objects of research is decreasing, and geophysicists are switching to solving methodological problems. Researchers master machine learning methods, for example, to reprocess historical data. At the same time, Compagnie Générale de Géophysique (CGG), Fugro, and WesternGeco left marine seismic, while others (Dolphin Geophysical, Global Geophysical Services, Geokinetics, and REFLECT Geophysical) have filed for bankruptcy [
26]. A decrease of the new research on new fields/locations forces researchers to put more effort into the processing of historical data and searching for new processing techniques, like neural networks. In 2019, the usage of phrase “neural network” exceeded that of “field data;” however, we doubt that this growth will continue. More likely, “neural network”-related topics will occupy a niche in geophysics in the coming years. As a result, we can assume a decline in geophysics and a contraction of the geophysical market shortly, and this makes us wonder where is it better to direct efforts of the geophysicists? We suggest looking at the gradient of use of words over time, which might show us what the new trends in geophysics are.
The emergence of new techniques in geophysics inevitably leads to an increase in the use of terms related to these techniques. The frequency of occurrence of words can be used to track trends in the equipment, processing methods, math algorithms, and types of resources, including oilfields and the kinds of rocks under study. The amount of information hidden in language is astounding. Our study is unique, because we have at our disposal an almost complete history of the development of geophysics. Moreover, our approach allows us to track exactly how the professional language changes over time.
It is interesting to know the terms that are gaining popularity now and discover the current trends in geophysics.
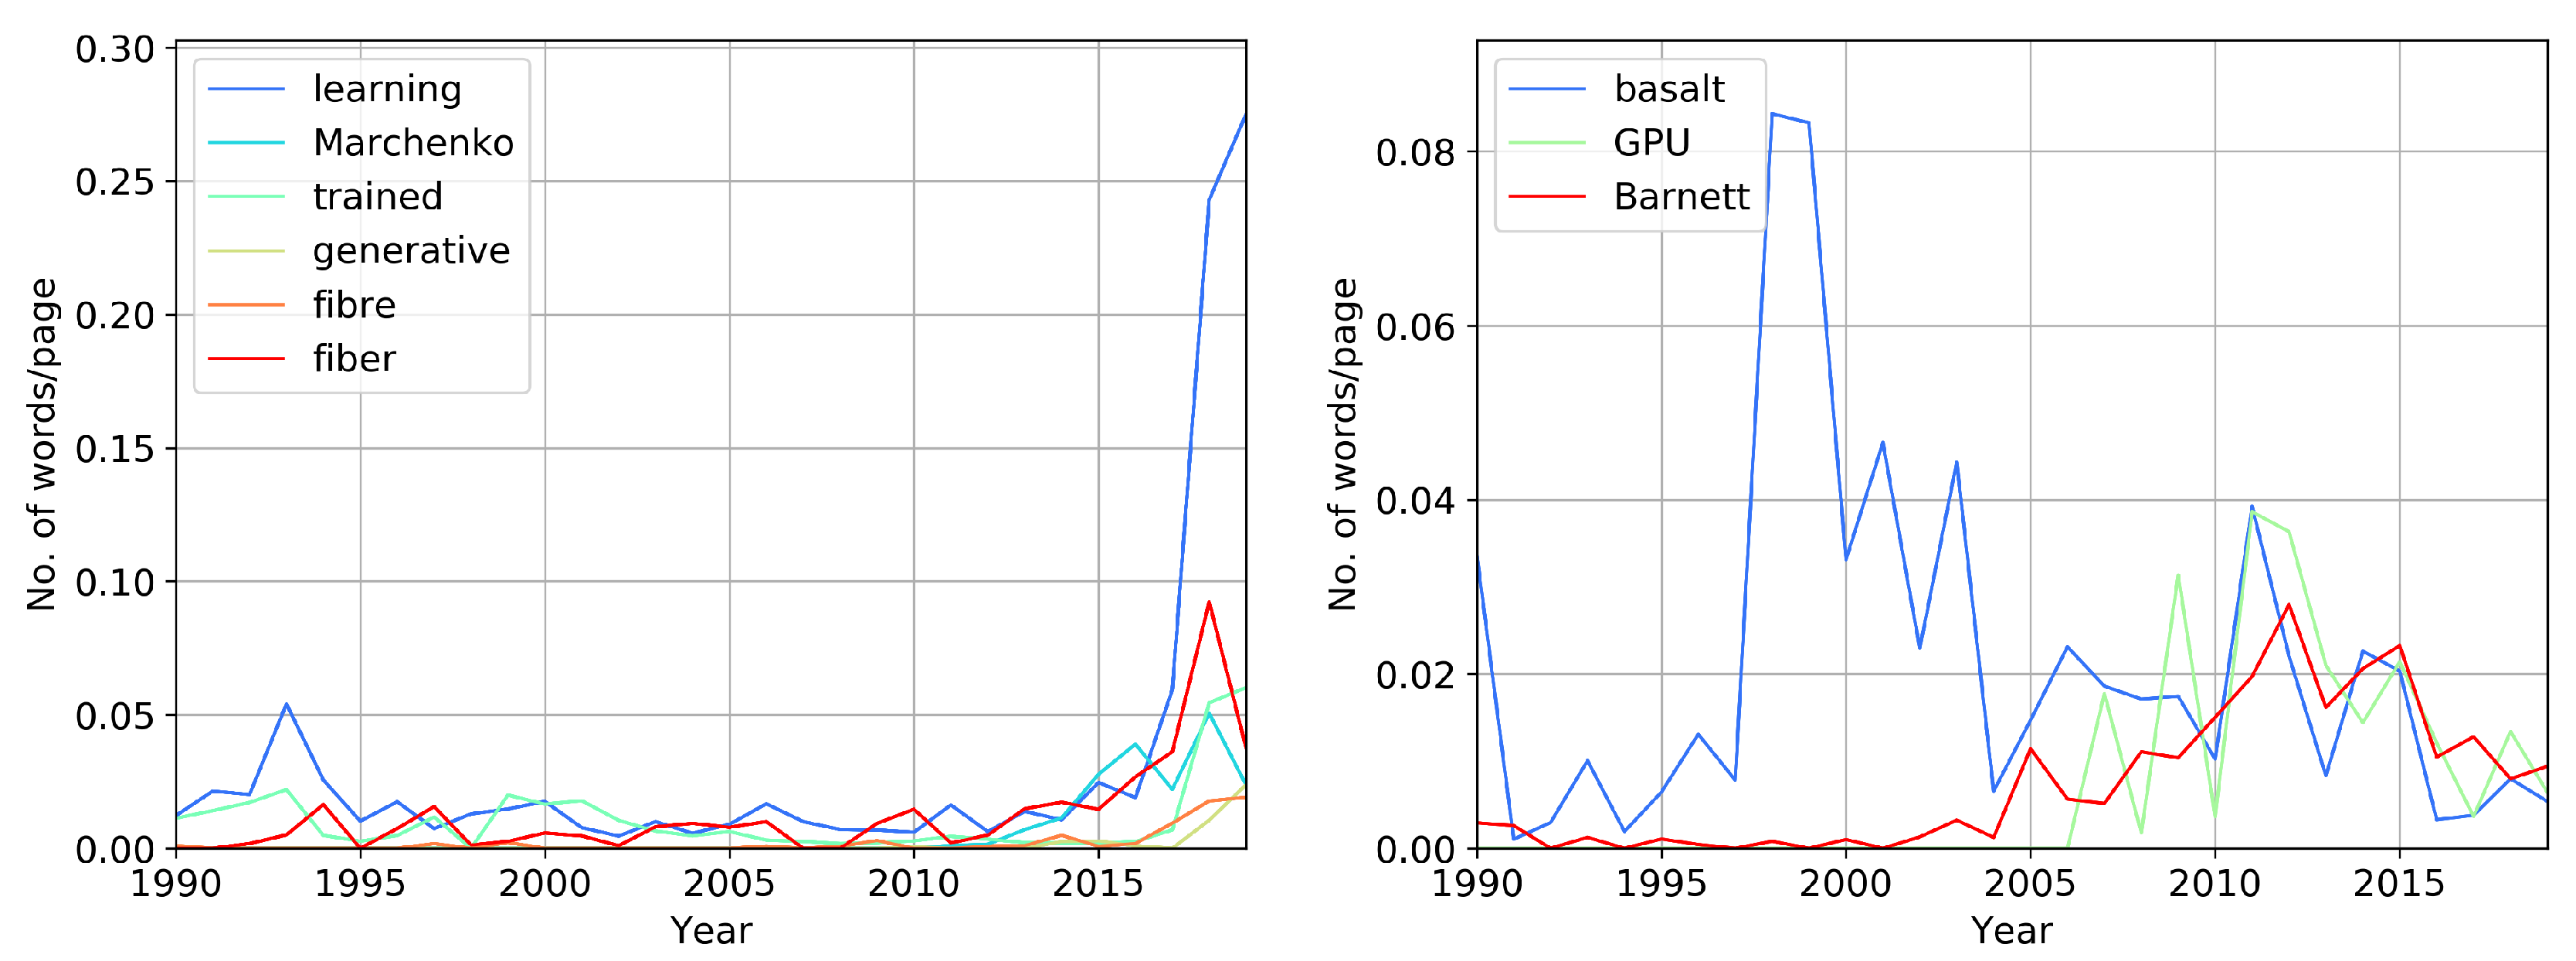
Figure 11 shows words with the highest growth in occurrence on the left and highest rate of decline on the right. As one can observe, the majority of words that have grown in occurrence relate to the neural network method. Is it reasonable to assume that these words will continue to gain popularity in the years ahead and that the topic will remain relevant? For example, the phrases “streamer em” and “receiver deghosting” grew in occurrence at a very fast rate during 2011–2015, but since 2015, they have been declining as quickly as they were growing before. The word “fiber” and “fibre” (“The British spelling of fiber” [
27]) is increasing in use almost as rapidly; this refers to fiber optics, because seismic sensors based on fiber optics are now growing in use, and because of their effectiveness in detecting faults filled with geothermal fluids [
28], microseismic monitoring of hydraulic fracturing [
29,
30,
31], and other applications. The term “distributed acoustic sensing” (DAS) shows good correspondence with the word “fiber” as DAS is based on fiber optics, and these terms are closely associated. Here, the use of the word is directly related to the production of the corresponding equipment. For “neural network,” one can use the existing computing power. In contrast, the development of optical fiber requires production. However, in 2019, we observe a decline in the usage of the word “fiber.” “Wasserstein” (metrics) and (data) “augmentation” have also grown in frequency in the last three years, but not as fast as “Marchenko.” In conclusion, the lack of research objects forces professionals to develop data processing methods and, for example, reprocess legacy data.
Figure 11 (right) shows words that decreased in occurrence in the past four years. Interestingly, there has been a reduction in the use of the abbreviation “GPU” by researchers, as opposed to seven to eight years ago when the abbreviation was trending. The “Barnett” shale is one of the most well studied shale deposits, and the authors believe that the fading of interest in it is a natural phenomenon related to terminal production decline there [
16]. Curiously, there increased interest in “basalt” at the turn of the century, and we observe the second increase in the early 2010s.
Besides “neural network”-related terms in
Figure 12 (left), we observe an increase in usage of “tight sandstone” and “igneous rock.” It is interesting to note that for 30 years, “igneous rocks” were rarely discussed, except for 2009. In 2018 and 2019; however, we observe several papers discussing igneous rocks found in the Chinese and Brazilian oil fields. Their acoustic and elastic properties must be considered in reservoir characterization [
32]. In
Figure 12 (right) one can see the bigrams that show a decrease in the frequency of occurrence in the past four years. When new research topics appear, they will partially or entirely replace the old ones, because the number of articles is limited each year.
Hill first described Gaussian beam migration in 1990 [
33]. It is a seismic method that can image steeply dipping reflectors, and will not produce unwanted reflections from the structure in the velocity model. At the 1993 SEG Annual Conference, we observe several papers reporting beam migration in seismic data processing. In 2001, we notice an increase in the number of occurrences of “beam migration.” With an increase of computing power, it became possible to use this method for 3D AVO analysis (Amplitude Variation with Offset) of small and medium-size 3D seismic surveys [
34]. Interest in this method raised two more times in 2008 and 2015. Frequency peaks appear with enviable regularity every seven or eight years. Moreover, each subsequent peak is higher than the previous one. In 1990, a new method appeared; in 1993, we observe testing on synthetic data; in 2001, professionals report the results of processing small and medium volumes of data; in 2007 and 2008, the results of use on large objects in the Gulf of Mexico [
35], are published by CGGVeritas. Over 25 years, we have seen the emergence of this new technology, testing, and applications in field exploration. However, since 2015, we have seen a decrease in the frequency of use of “beam migration.”
Figure 12 (right) shows a reduction in use of other seismic terms and “Barnett shale.”
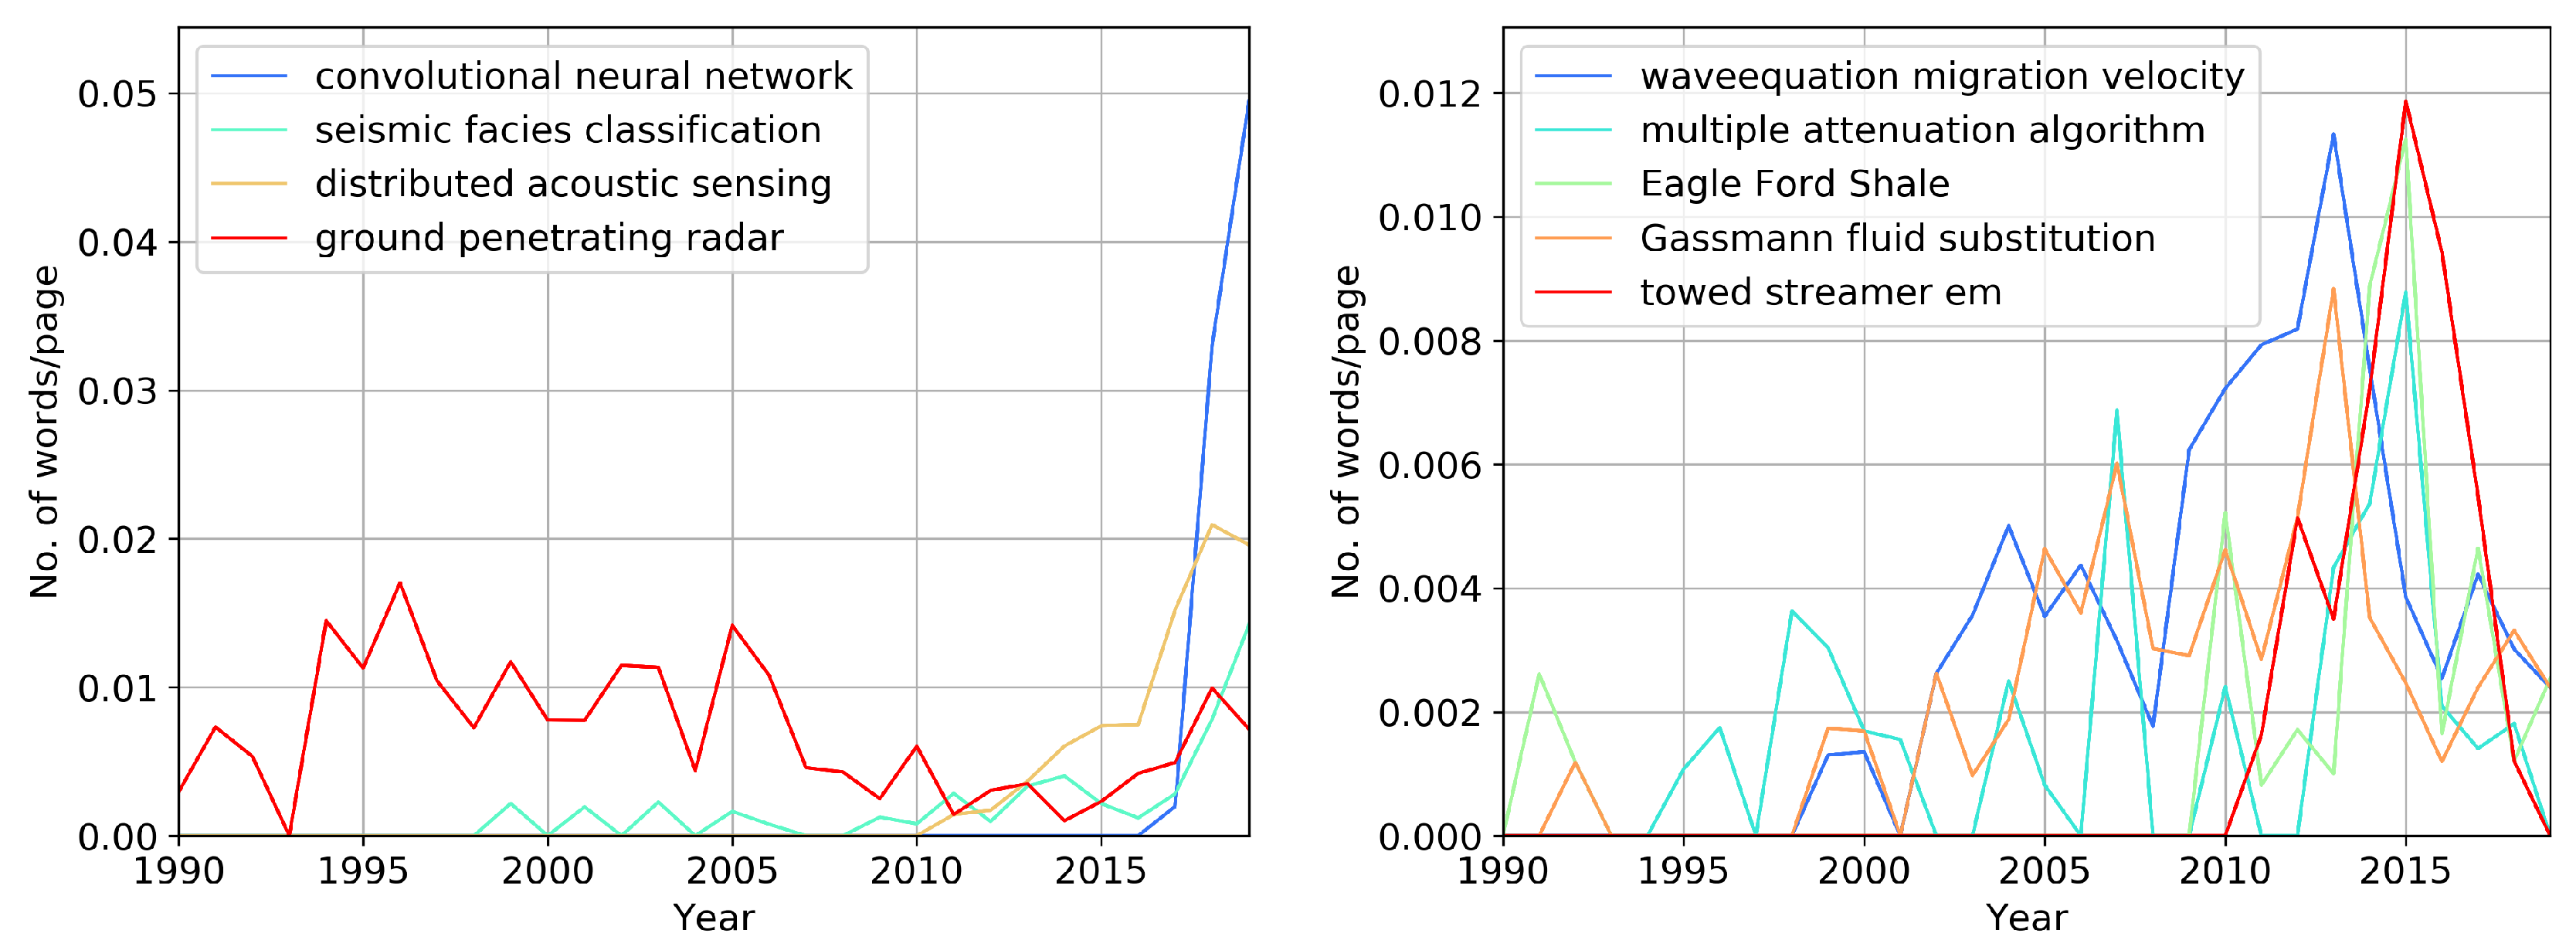
Let us now consider the fastest growing and declining trigrams,
Figure 13. “Convolutional neural network” (CNN) shows the fastest growth; the second one is “distributed acoustic sensing” (DAS), which is related to the fiber-optic measurement systems. In the recent few years, researchers were using CNN to perform “seismic facies classification,” which is why we observe an increase in usage of this term. We also see a relative increase for “ground penetration radar;” however, we see this term more often during the 1990s and early 2000.
Figure 13 (right) shows a decrease in the use of specific seismic terms, as for the case of bigrams and the names of the shale plays. From 2010 to 2019, we observe an increase and decrease in interest in the phrase “towed streamer EM.” Towed streamer electromagnetic systems allow one to collect data at a high rate and over huge survey areas [
36]. It is necessary to have significant objects to survey broad areas. Presently, only smaller oil and gas exploration projects exist, “towed streamer EM” is used less often.
It would be interesting to trace how the different methods are developing in geophysics, electrical exploration methods, petrophysics, engineering geophysics. For this reason, it is worthwhile to study the materials of conferences and publications of other journals with a different specialization. Research on conference materials of other societies (SPWLA, EAGE, SPE) will provide a complete picture of advances in the oil and gas industry, and we will devote a separate publication to this fascinating topic.
We encourage readers to use our data available online [
6]. The data include the filtered word lists with the frequency of use each year, the number of pages, and the average number of co-authors. Thus, the reader will be able to conduct their research, and test their hypotheses or assumptions.


