Abstract
The publication concerns the problem of adopting proper environmental conditions in the assessment of mold development in the so-called thermal bridges in the form of corners. The paper discusses the factors determining the development of mold and the models that predict its growth. The conditions of the internal microclimate, which is used in hygrothermal diagnostics of walls, were also recalled. Thermal bridges are areas where mold development takes place, therefore the climatic conditions in the room taken for their assessment—As it is currently applied—Are considered inappropriate. This thesis is confirmed by the results of in situ studies of changes in temperature and relative humidity in the area of corners. Some of these findings are presented in the work. On their basis, the author introduces the concept of the so-called geometric climate that would take into account the change of these parameters within thermal bridges of the corner type.
1. Introduction
The presence of fungi in buildings causes the biodegradation of the materials used in construction by changing their functional properties [1,2,3,4,5]. They also contribute to the deterioration of the air quality in the room due to the presence of toxic metabolites [6,7,8,9,10,11,12]. It is estimated that the risk of mold development may also appear in the case of thermo-modernized buildings or in the so-called thermal bridges [13,14,15].
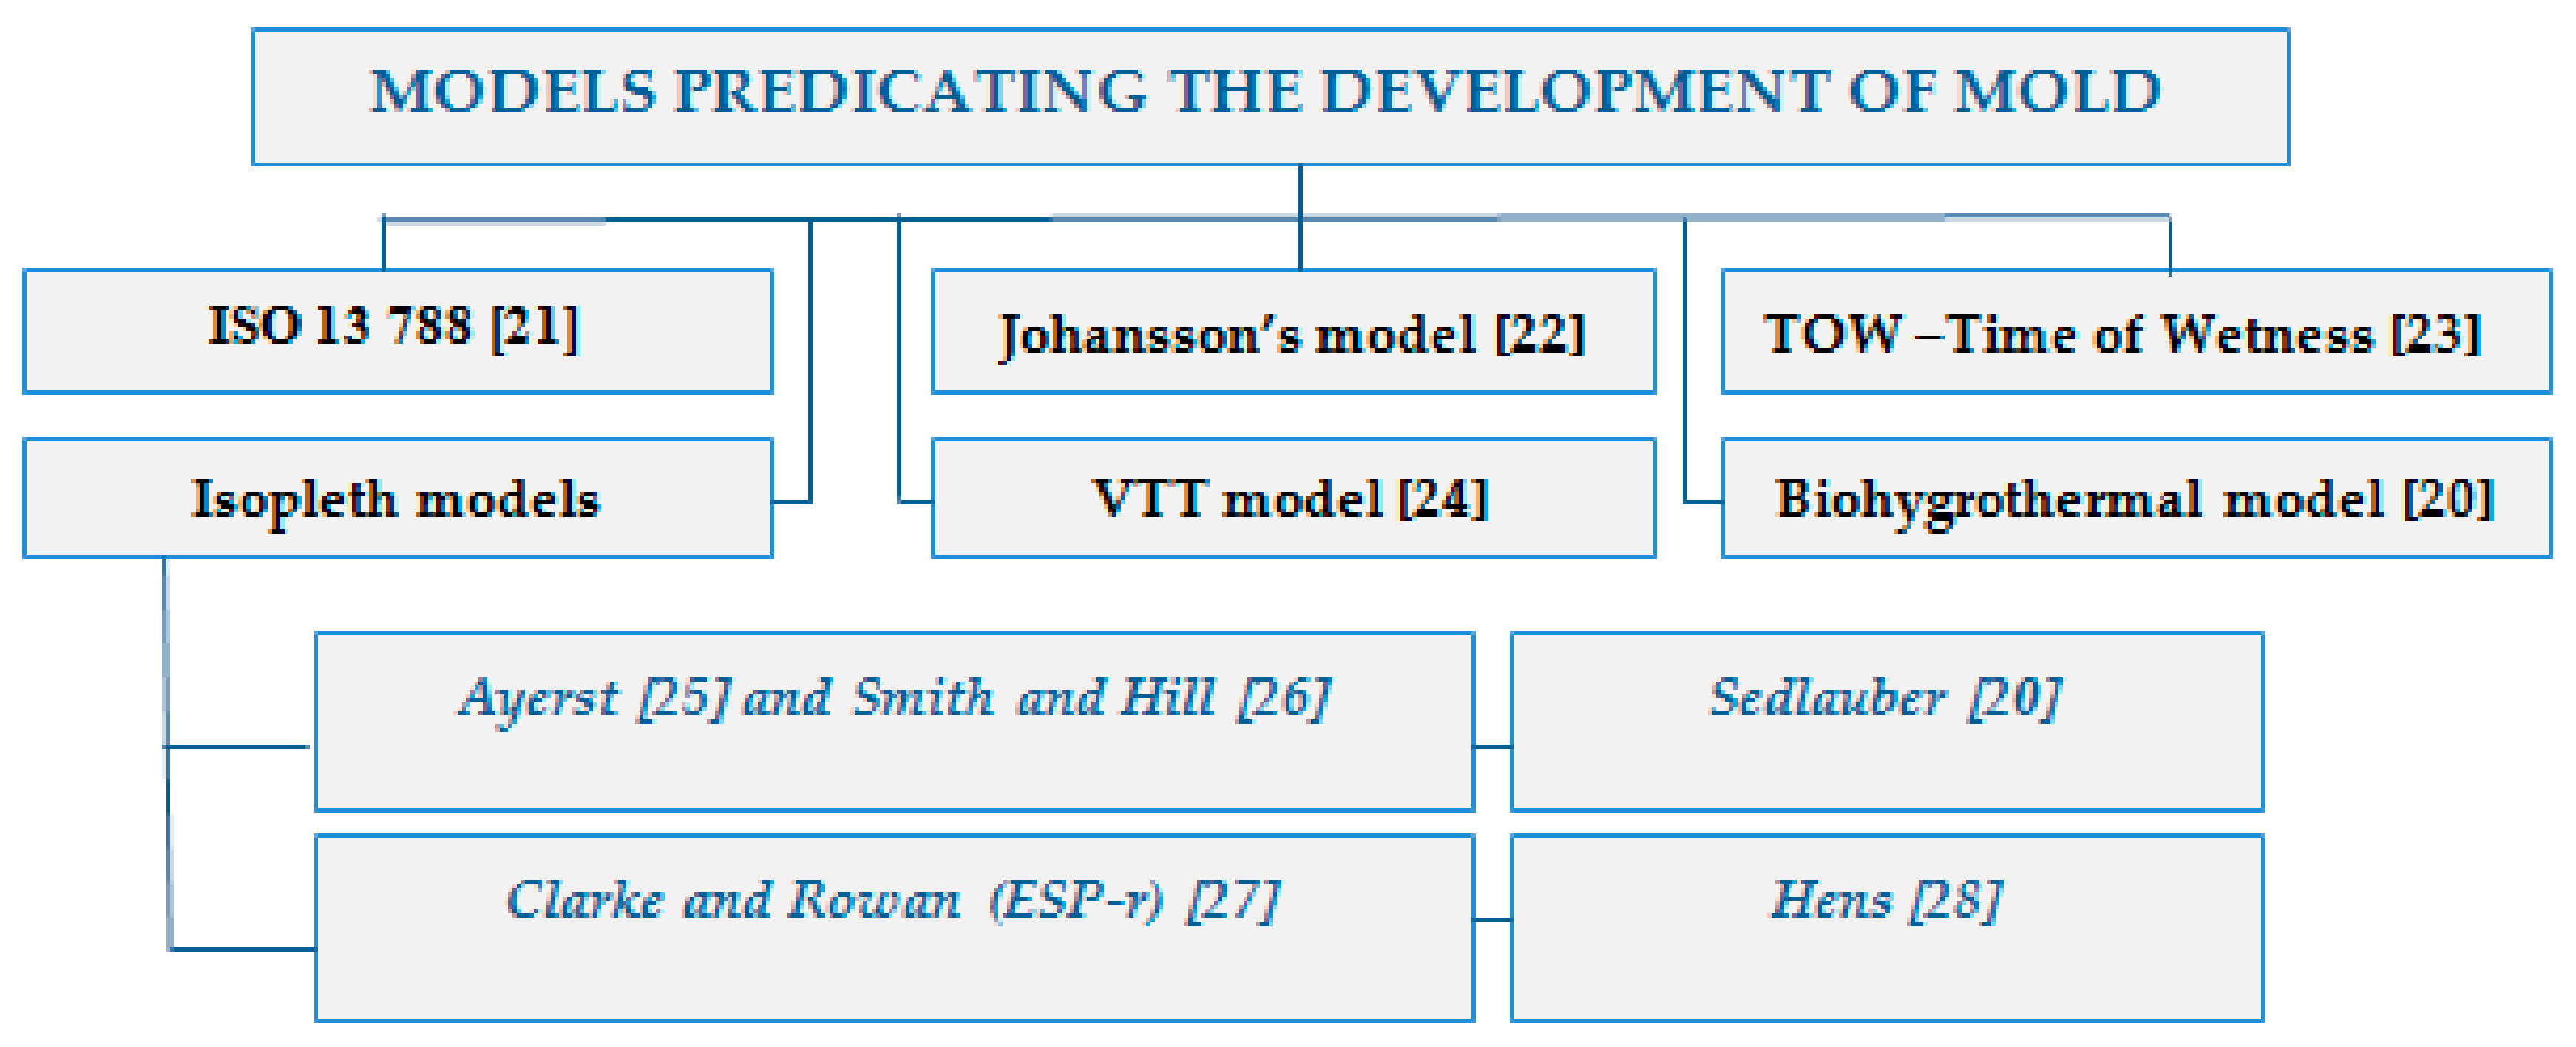
In order to predict the risk of mold development, available mold growth forecasting models can be used, presented in Figure 1 [16,17,18,19,20]. These models can be divided into basic (e.g., fRsi factor—ISO 13788) and complex (e.g., biogyrothermal model) [18,19,20,21,22,23,24,25,26,27,28].
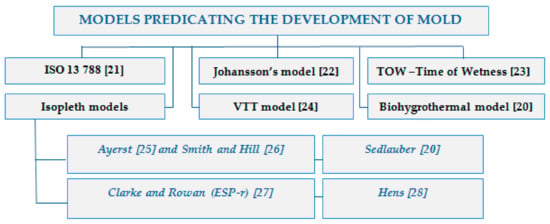
Figure 1.
Models of mold growth.
Their effectiveness and application have been extensively extensively described in the works [21,22,23,24,25,26,27,28]. The difficulty, however, is their application in real conditions or in engineering. Each of these models is developed on the basis of different experiments and adopts different assumptions. Consequently, a different result can be obtained by using a different mold prediction model in the assessment. The main concerns are:
- complex process of mold growth and its high susceptibility to boundary and climatic conditions; they change dynamically and individually, depending on the use of the premises (described in the Section 2),
- a limited number of simulation tools for the design or diagnosis of partitions in the context of mold growth.
In this article, the fRsi factor and the biohygrothermal model (models most often used in the design process) were used to assess the risk of mold. The temperature factor fRsi can be calculated for both a flat wall surface and two or three-dimensional places—using the ISO 13 788 standard (Figure 1). Its value is determined on the basis of humidity classes or constant relative humidity, which is a great simplification of the problem. In the case of the biohygrothermal model that has been implanted into the WUFI [29] program (ultimately WUFIBio), the boundary conditions consist of hourly climatic data (for the indoor environment—ambient temperature and relative humidity) or user-defined measurement data. The users can define their own boundary conditions, but in the case of diagnosing mold development—they can only do this in a simple model for a flat wall.
Therefore, the problem is places with complex geometry, e.g., two or three-dimensional elements, where the initiation of mold development occurs first, and due to the conditions prevailing there, it can be more intense than on a flat wall.
The aim of the article is to point out the difficulties in forecasting mold growth for thermal anomalies or thermal bridges in the form of corners.
The climatic conditions in the room taken for their assessment—as is currently applied—are considered inappropriate. This thesis is confirmed by the results of in situ studies of changes in temperature and relative humidity in the area of corners. Some of these studies are presented in the work. On their basis, the author introduces the concept of a geometric climate that would take into account the change of these parameters within thermal bridges of the corner type.
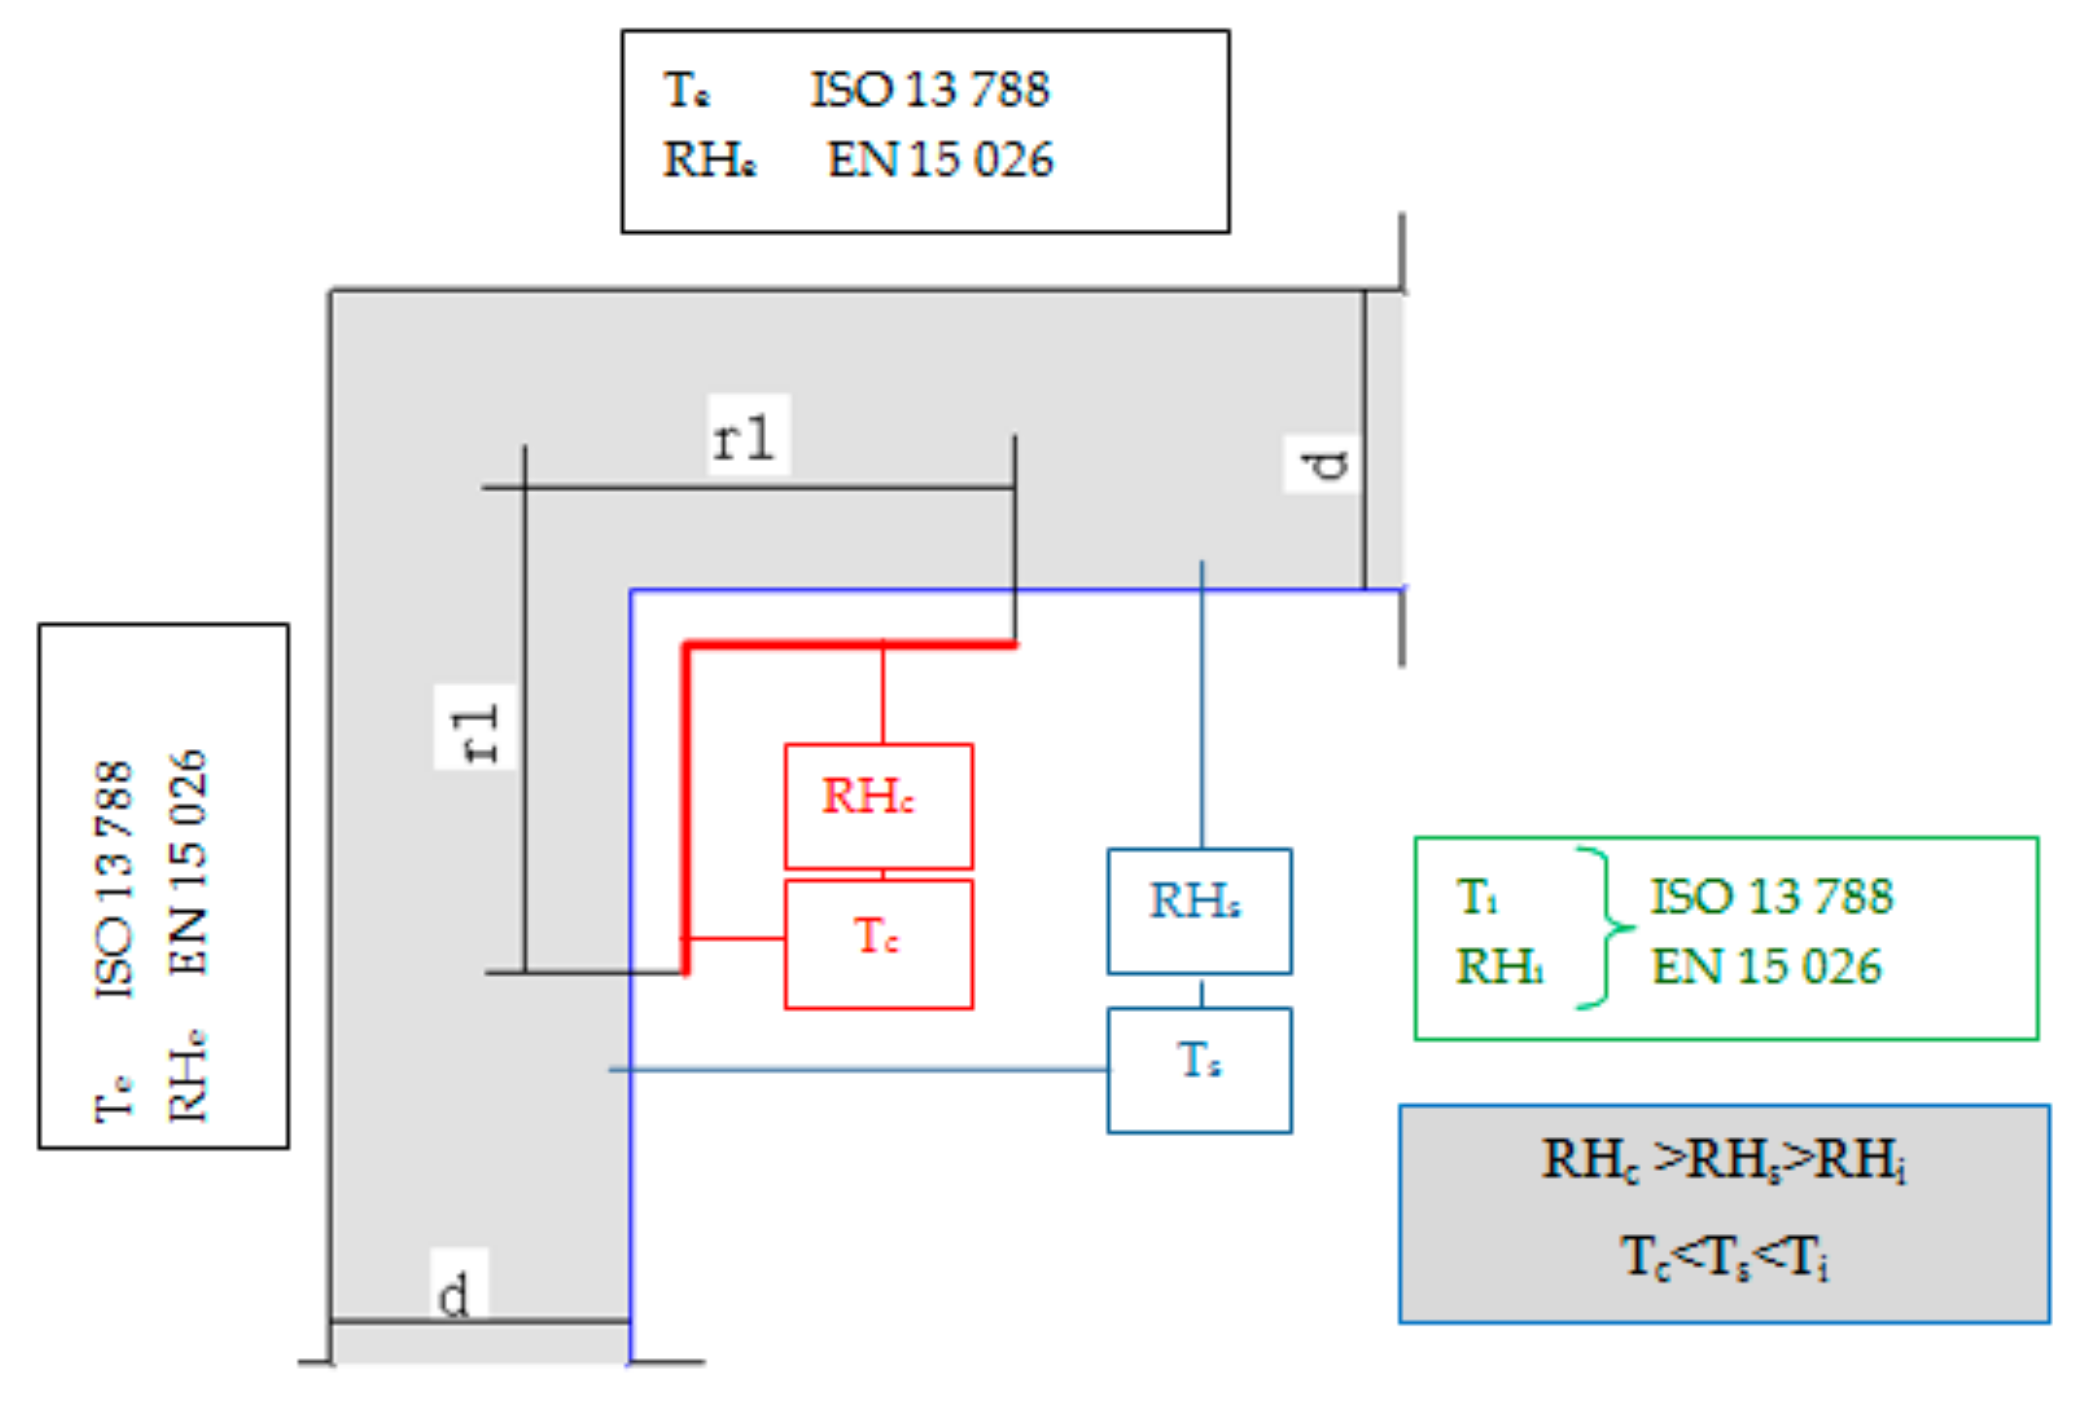
The author’s research will ultimately result in determining the impact range of the corners (r1) and determining the area where different hygrothermal conditions (from those in the rest of the room) will be assumed (Figure 2).

Figure 2.
Assumptions (index i—Inside, s—Surface, c—Corner).
2. Materials and Methods
2.1. Factors Affecting the Development of Mold
Mold growth and its dynamics are determined by many factors. The basic ones include:
2.1.1. Temperature
According to the literature data [20,30,31,32,33], the development of mold can occur in the temperature range from −20 °C to 60 °C [19] e.g., Aspergillus sp. and Penicillium sp. retain their ability to germinate at the temperatures down to −10°C. The temperatures inside buildings, or on indoor surfaces usually range from 0 °C to 30 °C, and therefore temperature provides the optimal conditions for their growth.
2.1.2. Humidity
Relative humidity (RH) is the most investigated criterion, considered the most decisive for mold growth and research mostly investigates the critical range 75–95% RH [31,32,34,35,36,37].
As early as in the 1950s, the classification of mold growth was proposed as dependent on the relative humidity, i.e., xerophilic fungi, which are able to grow below the relative humidity level of 85% and hydrophilic fungi which start growing at the relative humidity level of 95%. The current test results are correcting these values by approximately 5 to 10%. Each individual species of fungi has its own specific characteristic range of humidity that allows the species to live, and which determines, among other things, the intensity of growth.
Following the observations [31,32] they distinguished three groups of mold:
- the 1st fungi group of the type Aspergillus repens, Aspergillus Versicolor, and others which have a xerophilic nature, i.e., they tolerate dry environment, are able to grow when the equilibrium index aw is above 0.80, which corresponds to the relative humidity of the air below 80%,
- the 2nd fungi group of the type Cladosporium for which the minimum index aw for the growth is within 0.80–0.90, which corresponds to the relative humidity of 80–90%,
- the 3rd group of fungi such as Phoma herbarium, various species of Ulocladium, Stachybortys atra, which grow only when the index aw is above 0.90, i.e., when the relative humidity is above 90%,
- It should be remembered that every change in temperature is followed by a change in the relative humidity of the air, and thus the process of fungi growth should be treated with simultaneous consideration of these two parameters. The dependence of the growth of mold on temperature and relative humidity is represented by the so-called isoplets.
2.1.3. Substrate
Apart from humidity and temperature, the most important factor affecting the development of mold is the content of nutrients in the substrate on which the fungi grow. Research on this issue was presented in [20,38,39,40,41]. The contamination of the surface with dust or oily substances may lead to the germination of spores and the onset mycelium growth.
Research carried out by [38,40,41] showed that soil and fat contamination significantly affect the growth of mycelium. This means that dust or other impurities are sufficient to create a nutritious layer even on originally “sterile” substrates.
Numerical analyzes also determine the quality of the substrate in the context of favorable conditions for the development of mycelium on the surface of materials.
- o Substrate class 0:
Optimal culture medium (e.g., full medium). This isopleth system represents the maximum growth possible for any mold found in buildings.
- o Substrate class I:
Bio-utilizable substrates, such as wallpaper, plaster board, building products made of biologically degradable materials, strongly contaminated surfaces.
- o Substrate class II:
Less bio-utilizable substrates with porous structure, such as plasters, mineral building materials, certain woods, insulating materials not included in group I. (WUFIBio source).
2.1.4. Growth Time
The growth and development of mold depends on the hygrothermal conditions, the type of substrate and material, but also on the time needed for fungi growth. Table 1 presents the data involving the relative humidity and temperature—their duration over 24 h—to facilitate a visible growth of mycelium Table 1.

Table 1.
Dependence of fungi growth on hygrothermal and other conditions [20,23,40,42,43].
Depending on the method of research and the substrate, mold growth may occur under various climatic conditions. For example, Zöld [43] gives the number of hours per day during which mold can develop. He conducted tests at a temperature below 20 °C and humidity of 75%. In a situation where relative humidity is exceeded for more than 12 h within 5 days, the situation is considered critical. A smaller figure (the period of time during the day required to exceed relative humidity) is provided by Cziesielski [44] and Richter [45], but this time must always be observed for a minimum of the next 5 days.
2.1.5. pH Reaction
The optimal growth range occurs at the pH values between 5 and 7. Most species grow in the range of 3 to 9. For example, wallpapers and paint coatings have a pH value from 5 (wallpaper over woodchip) to 8 (new color, freshly painted). Building materials such as concrete have a pH value higher than 12, but due to deposits, dust, and dirt that may be present on this type of material, mold growth cannot be ruled out. Additionally, mold can change the pH value of their immediate environment in the way that supports their growth. This is done by activating the “proton pump”. Fungi release various organic acids [20,38,46], as a result of which the extracellular space changes its reaction.
2.2. Analysis of Internal Conditions in Partition Modeling in Order to Avoid Mold Growth
The methods commonly used in engineering practice include the method referred to in ISO 13788, based on the so-called temperature factor on the internal surface fRsi. Its limit value was defined on the basis of the growth conditions of the mold species Aspergillus versicolor.
where: θsi calculated temperature of the internal surface at the critical place [oC],
where Ti—Temperature of indoor air [oC]; Te—Temperature of outdoor air [oC]; Rsi—Internal surface resistance [m2K/W]; U—Thermal transmittance [W/m2K].
When the value of temperature factor is higher than 0.70, the risk of mold development is lower than 5% [47]. In most European countries the value is above 0.72. However, there are countries in which the requirements are not so strict, and this value is within the range of 0.65–0.70 (e.g., Netherlands) [47]. For Polish conditions, the limit value was set (specified in the Regulation) at 0.72. The calculations of the fRsi factor for a wall are made on the basis of constant boundary conditions or depending on the humidity class—But these are monthly averages. Unfortunately, they do not reflect the real conditions of the microclimate, especially inside the rooms—resulting from their specificity or habits of the residents. The information presented above clearly shows that the process of mold development depends also on many factors and it has a dynamic nature—even short-term changes in relative humidity can provoke the development of this type of microorganisms. The mentioned standard (ISO 13 788) involves critical surface humidity and internal condensation, but it does not take into account other aspects related to moisture, e.g., building moisture, moisture convection, or others referred to in the standard ISO 13788 (Figure 3 and Figure 4).
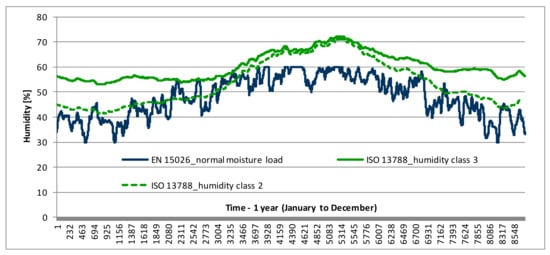
Figure 3.
Relative humidity of the indoor air according to standards ISO 13788 and EN 15026.

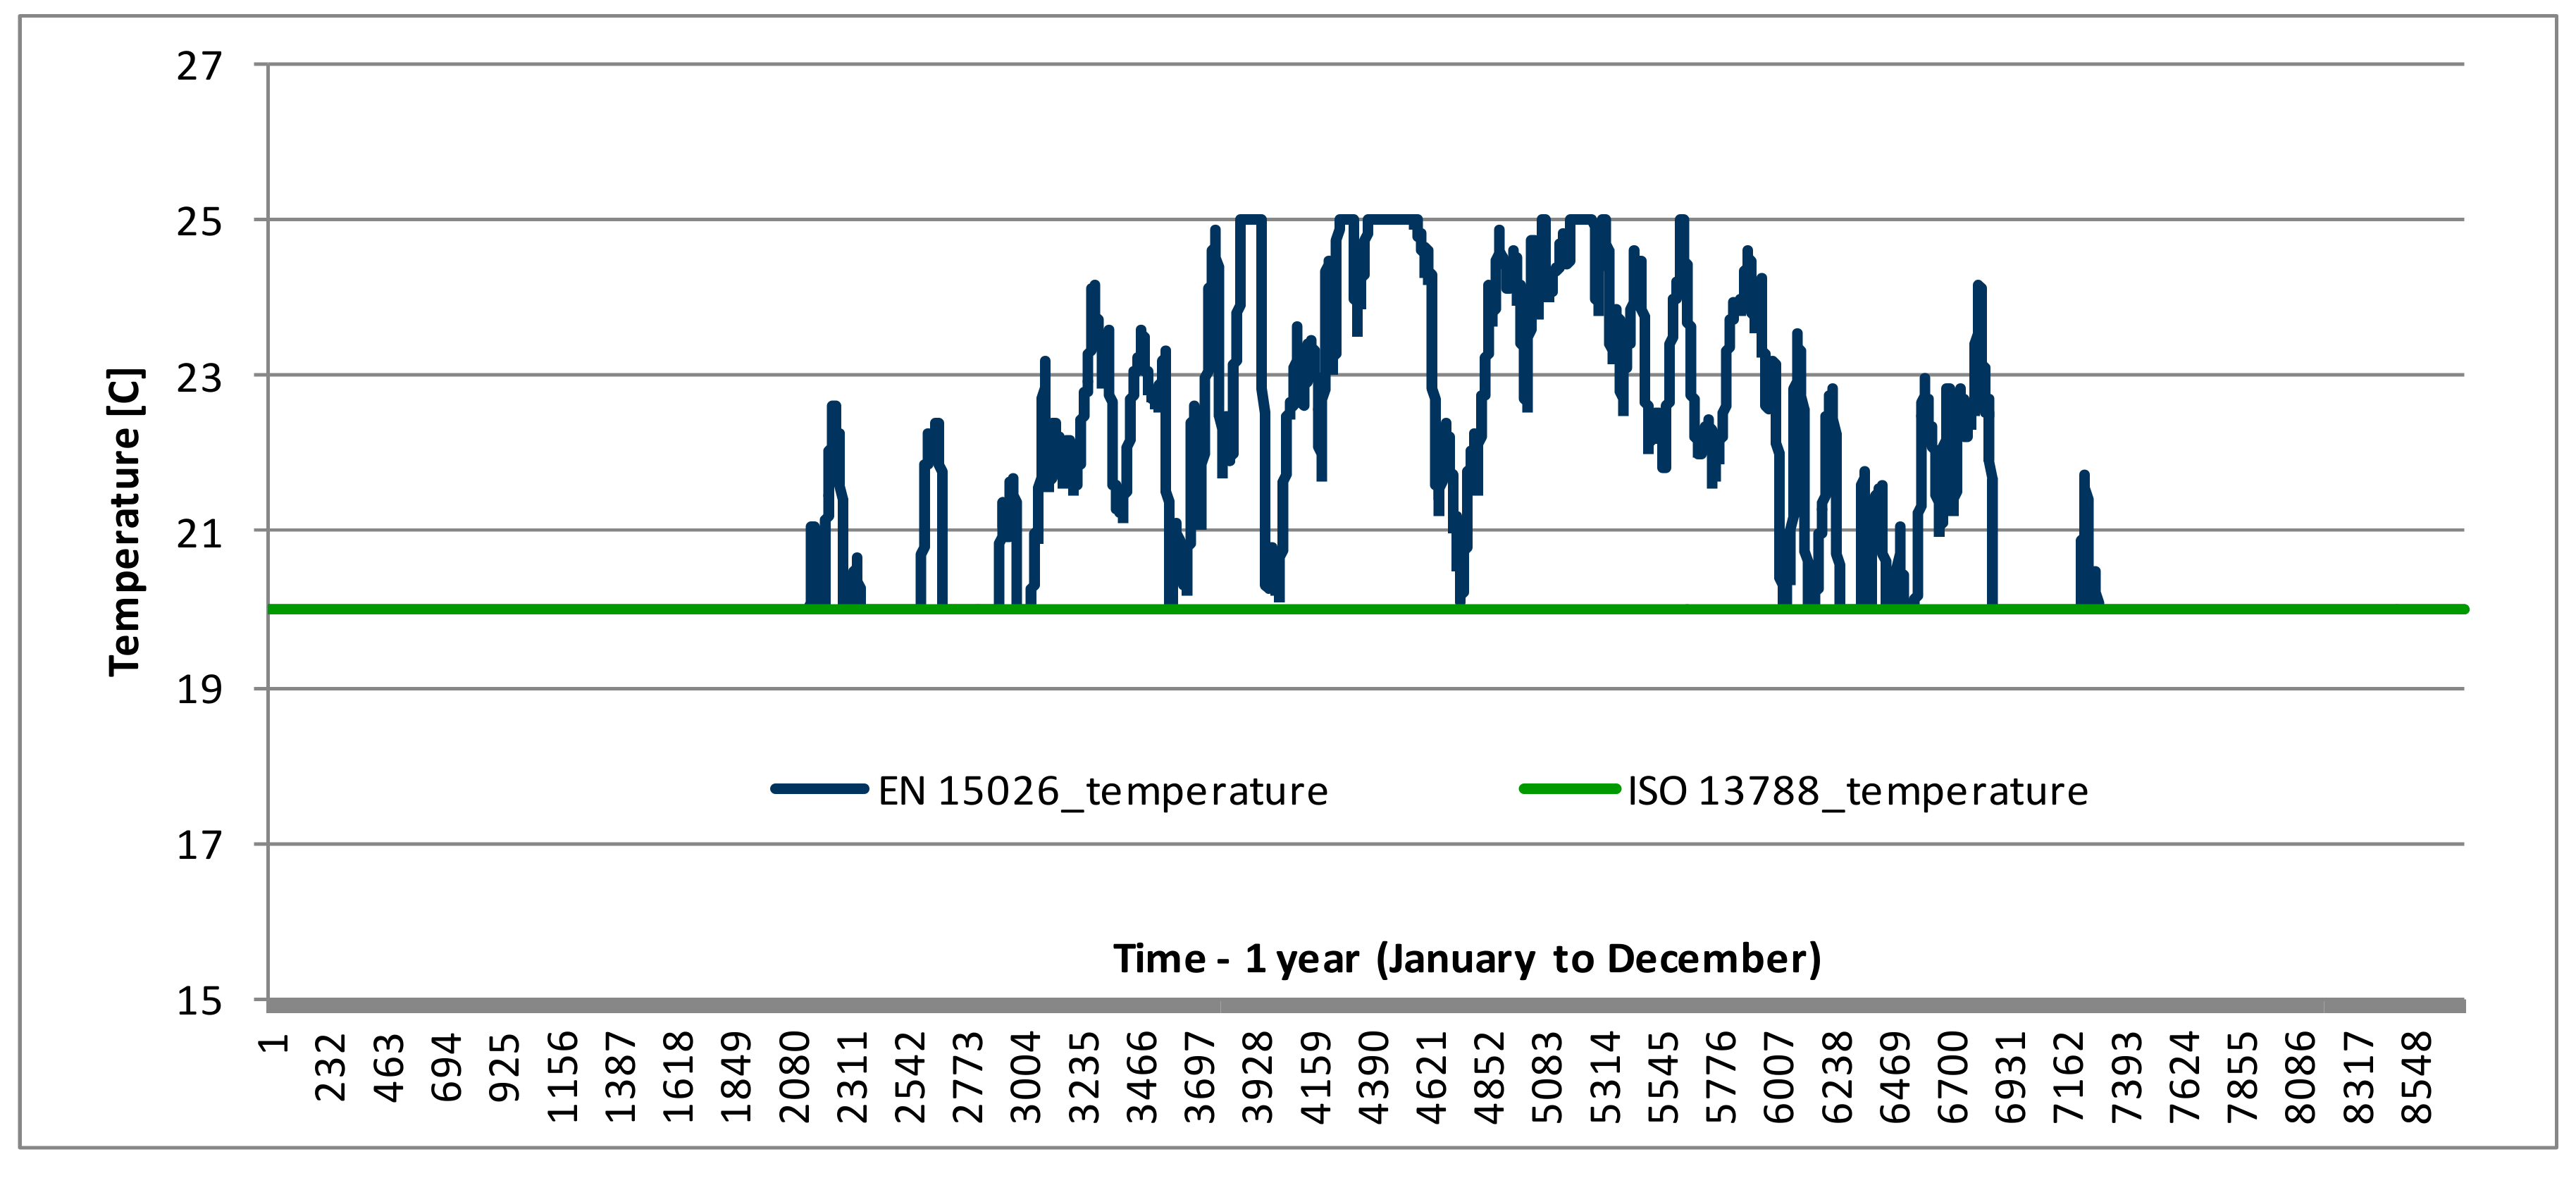
Figure 4.
Indoor air temperature according to standards ISO 13788 and EN 15026.
Another method that is used in engineering practice is mold development analysis based on the WUFIBio program (biohygrothermal model). In this case, modelling of the partition is carried out in the WUFI program, on the basis of which we can perform a thorough analysis of the partition, i.e., also in the context of an increase in water content in the partition plane, but above all imposing other boundary conditions. The program allows, depending on the needs, to choose the microclimate conditions based on the ISO 13788 standard but also on the EN 15026 standard (Figure 3 and Figure 4), sinusoidal curves or the ASHRE 160 standard. In the case of more complex analyses, i.e., when determining biological development, corrosion, decay, and destruction or degradation caused by moisture, we suggest using the assumptions from the EN 15026 [48] standard in applications. The indoor conditions adopted there should correspond with the strictest conditions involving the use of a building. For example, it could happen that a building that has a very small indoor moisture load (e.g., a warehouse) has been transformed into a building with a high moisture load, e.g., laundry.
To define the indoor climate, the following parameters should be used:
- -
- equivalent indoor temperature,
- -
- water vapor pressure or other humidity parameter.
The data should be selected in the following order (of importance):
- -
- values measured for similar buildings in a similar climate,
- -
- results of hygrothermal simulations,
- -
- determination of the flow of the generated moisture and the multiplicity of ventilation, and on this basis the calculation of internal conditions should be carried out.
In the article, the author presents the results of measuring indoor climate parameters for two groups of buildings (W_1 and W_2). The results of measurements (temperature and relative humidity of air) were compared with indoor air conditions based on ISO 13 788, EN 15026.
The goal was to validate commonly used indoor climate models with real-world housing conditions (typical residential buildings were considered).
In their work, the author performed calculations regarding the risk of mold development based on:
2.3. Research Stand
Test stands were located in detached houses in Upper Silesia. The tests were carried out in living rooms.
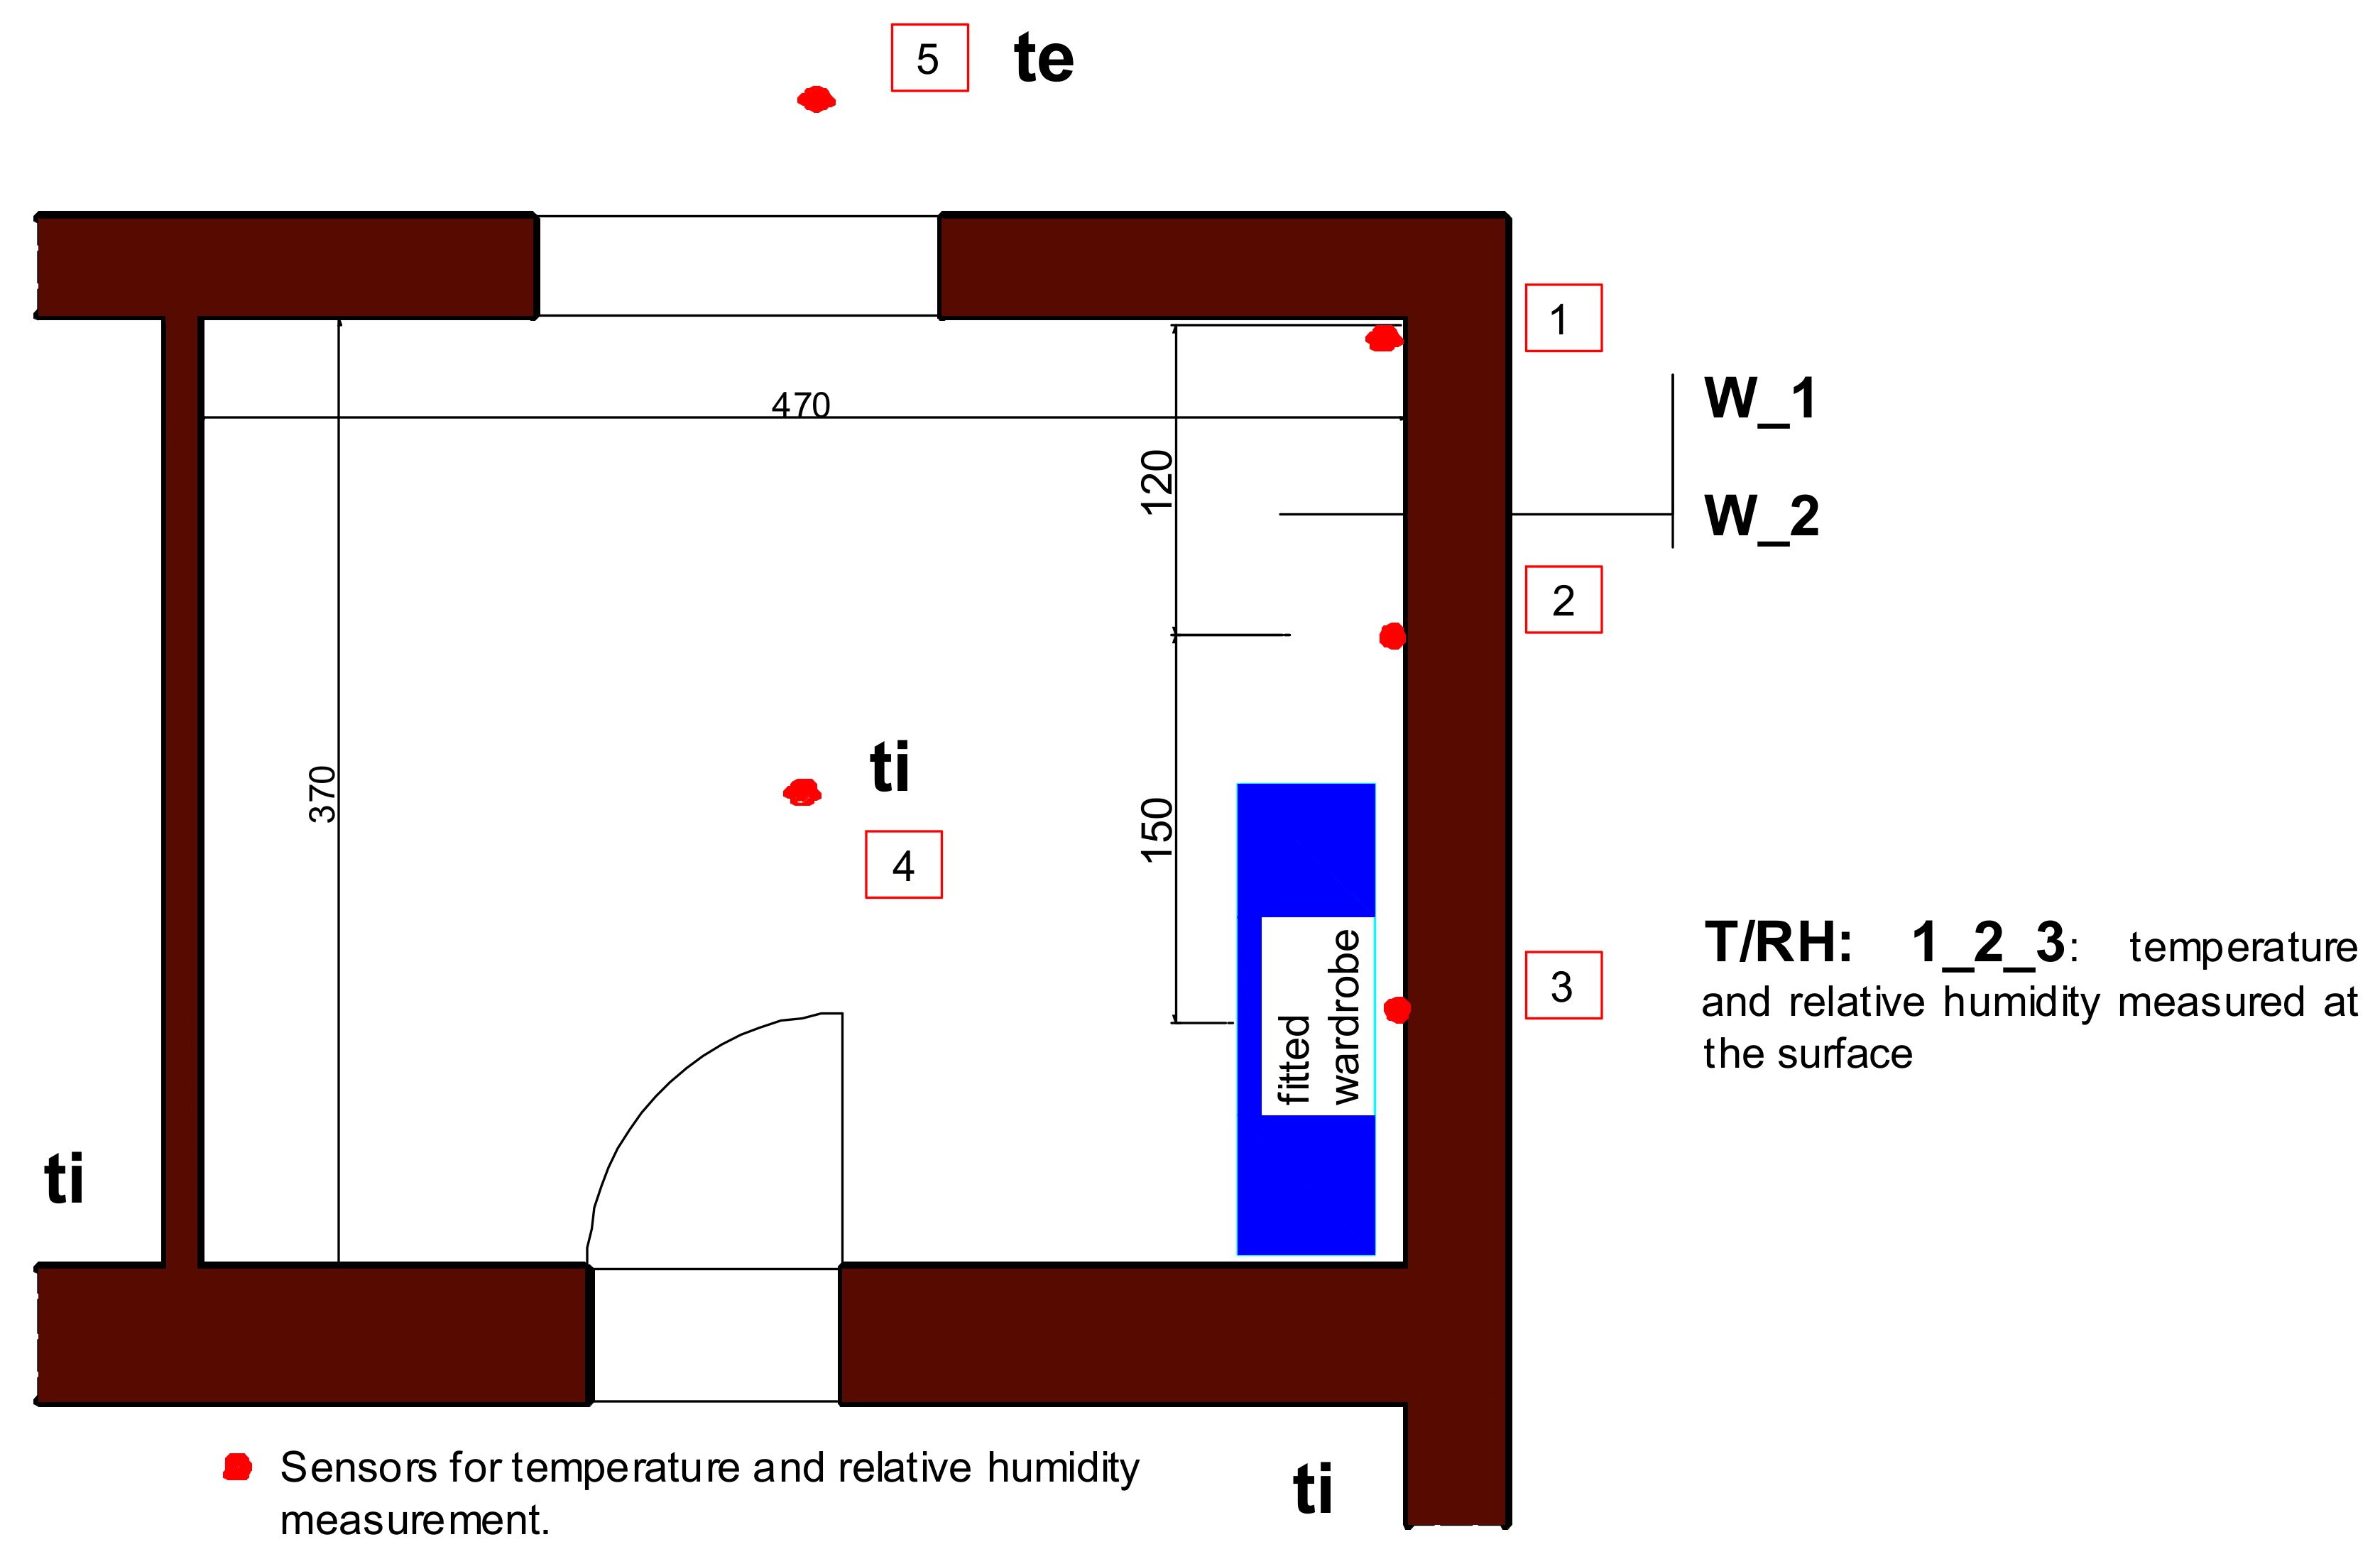
The examination of the microclimate of the rooms comprised logging of temperature and relative humidity of indoor air in specific places in the room, i.e., (Figure 5):
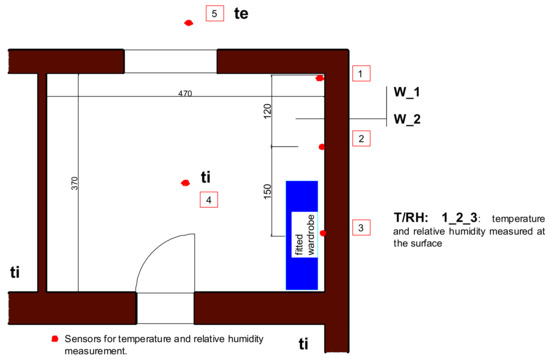
Figure 5.
Diagram of an exemplary room with the layout of sensors.
- 1-
- temperature, relative humidity of the air near the corner,
- 2-
- temperature, relative humidity of the air near the surface of a flat wall,
- 3-
- temperature, relative humidity of the air ‘behind the furniture’ (other),
- 4-
- temperature, relative humidity of the air in the room,
- 5-
- temperature, relative humidity of the outdoor air.
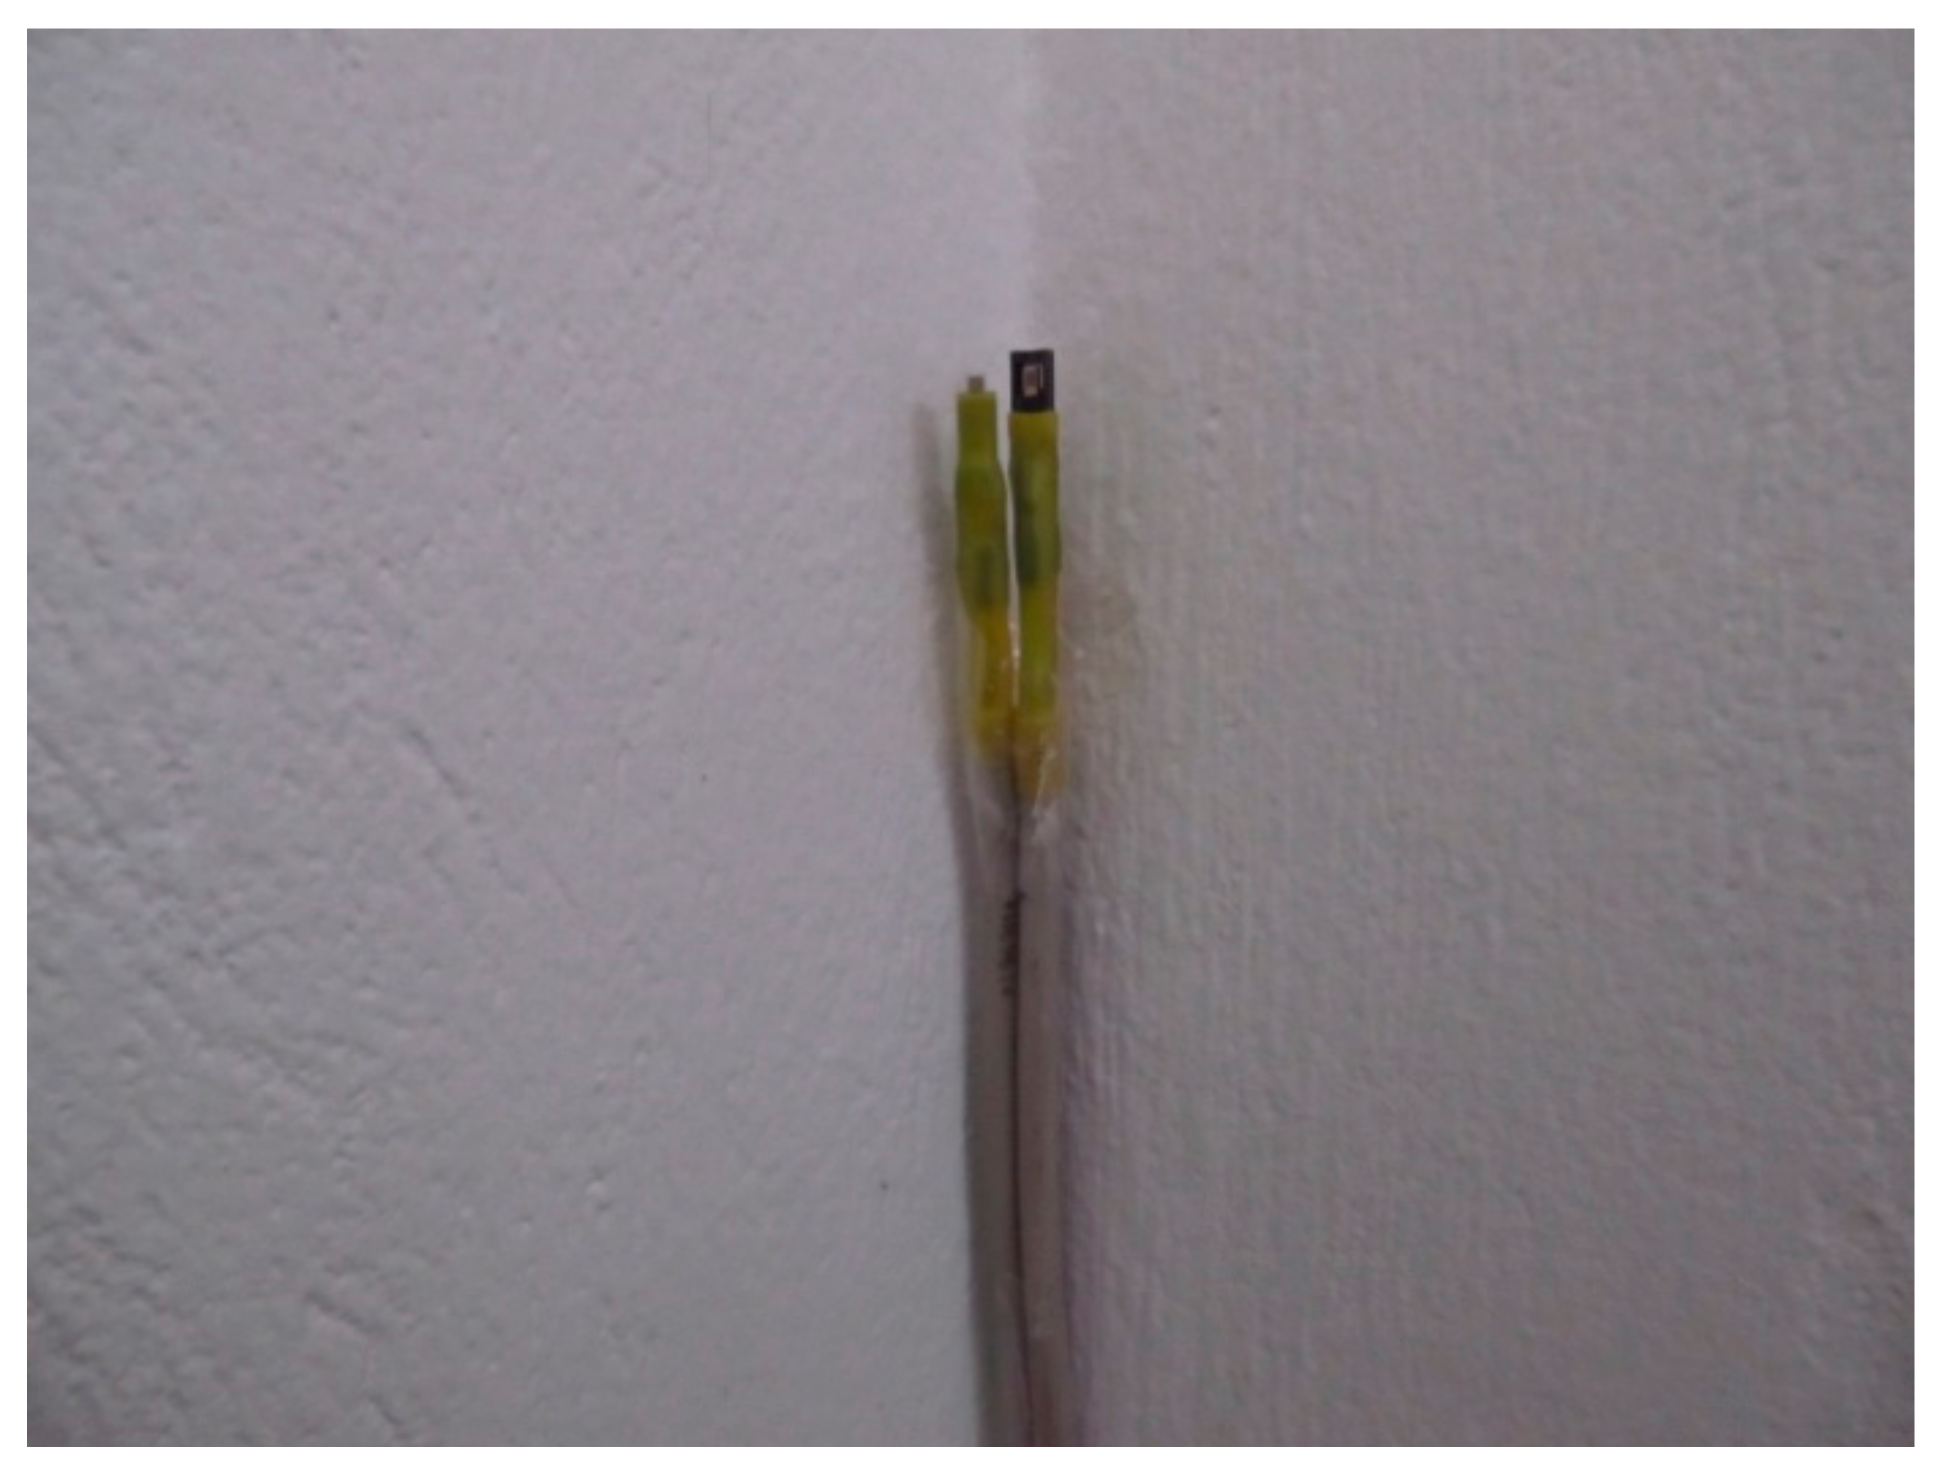
The measurement was carried out using the AR207/8 /S1/ PPPP/IP30 multi-channel data logger. For the measurement of air temperature Pt 100 sensors were used: HIH-4000-002-type sensors for measuring relative humidity. To double-check, the measurements were verified with the sensors St 171 (Figure 6 and Figure 7).
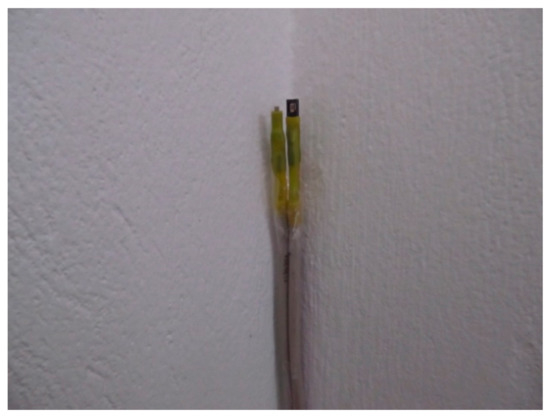
Figure 6.
Installation of temperature (Pt-100) and humidity (HIH-4000) sensors in the external corner of the building.
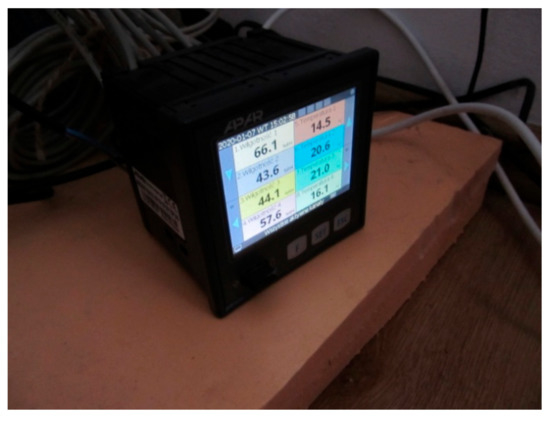
Figure 7.
Measurement recording device AR207.
The research comprised two models of buildings located in Upper Silesia, Poland, i.e.,:
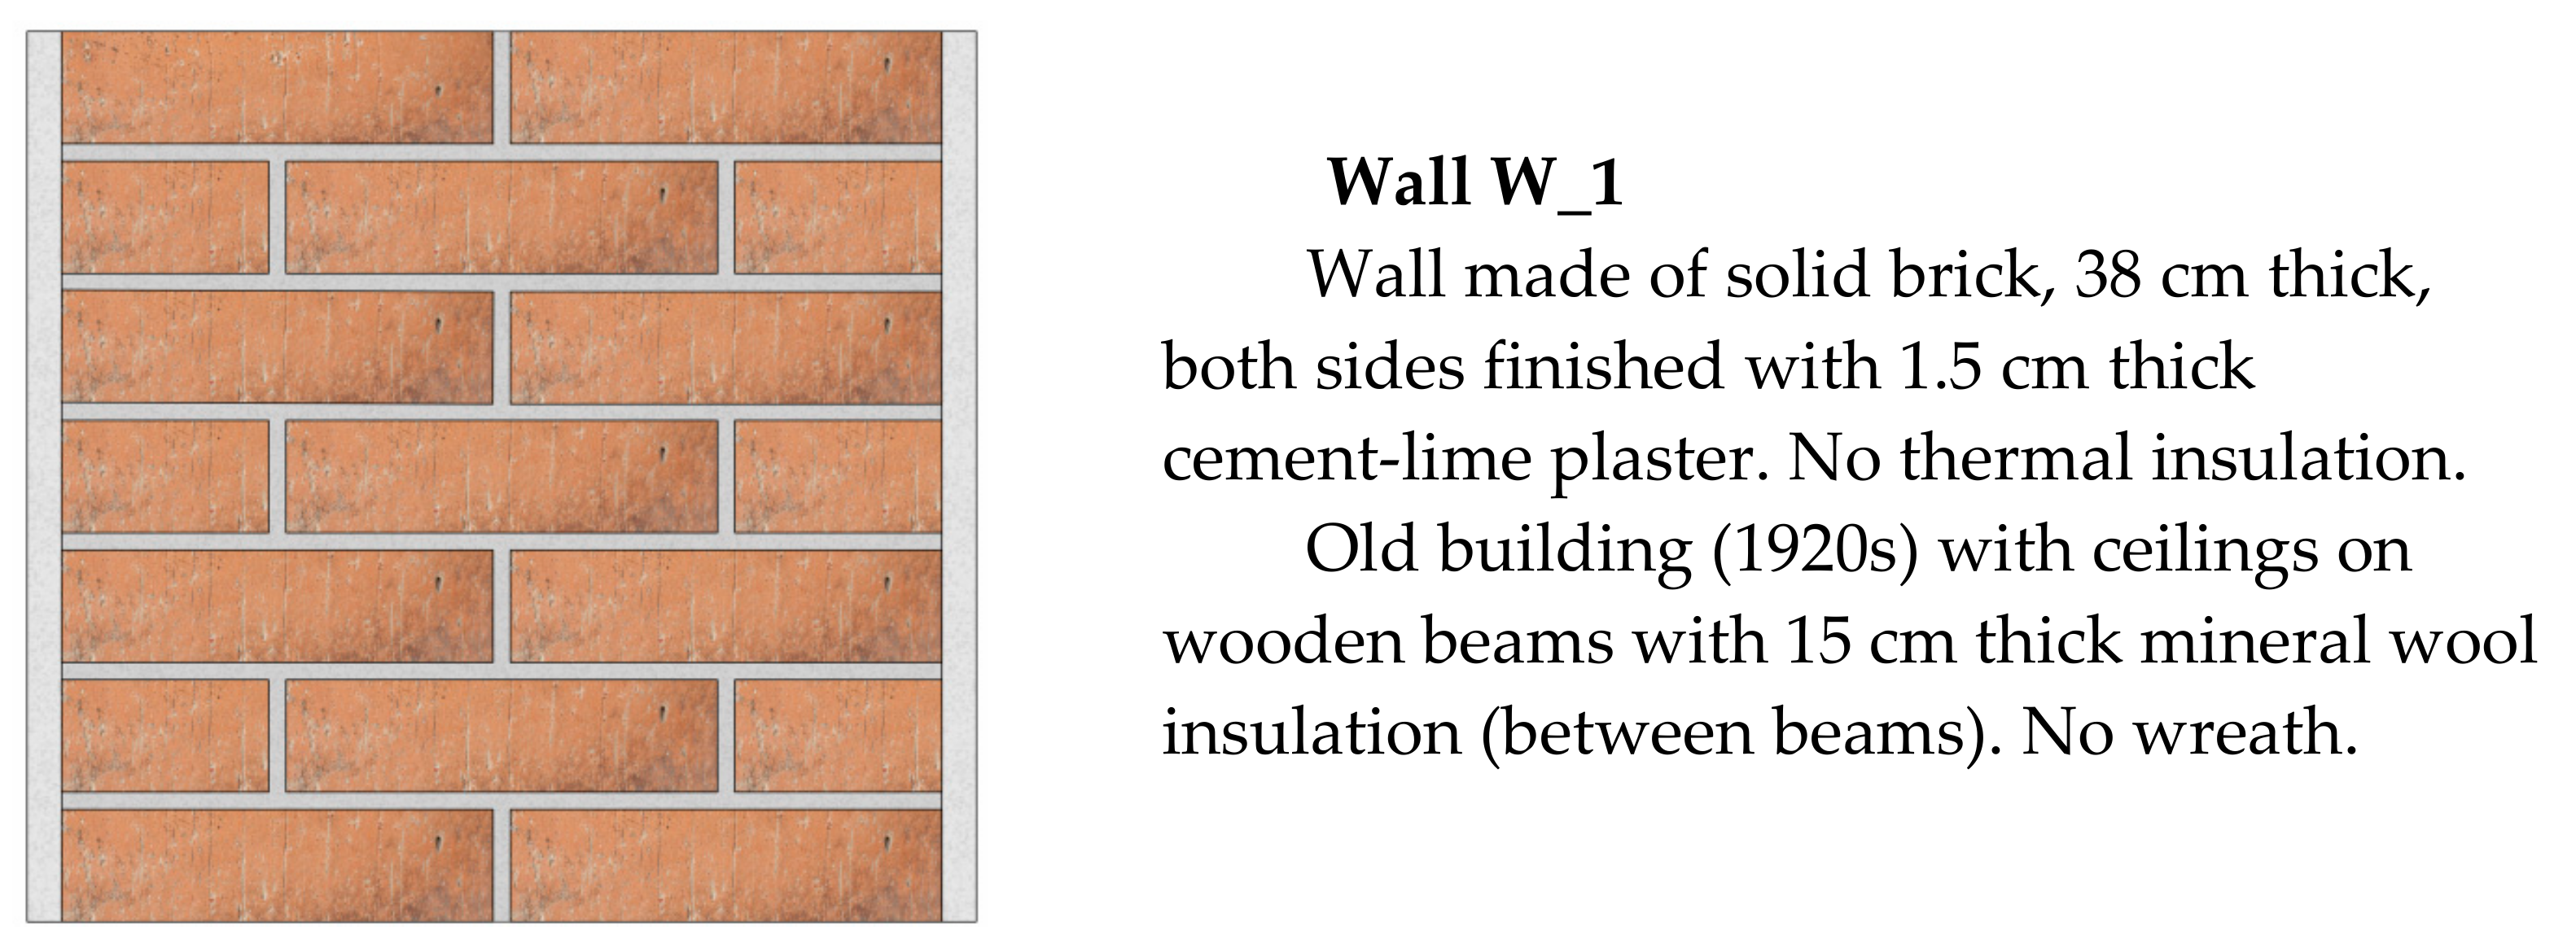
- non-insulated buildings, made in traditional technology, with walls made of 38 cm-thick bricks and insulation value of the envelope at the level of U = 2.00 ÷ 2.40 [W/m2K] (variant W_1), (Figure 8),
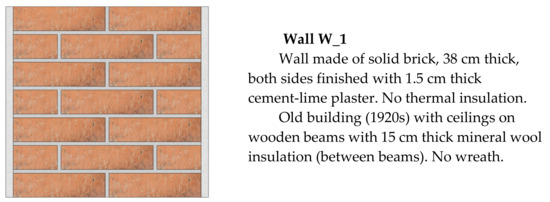 Figure 8. Description of the wall system solution for variant W_1.
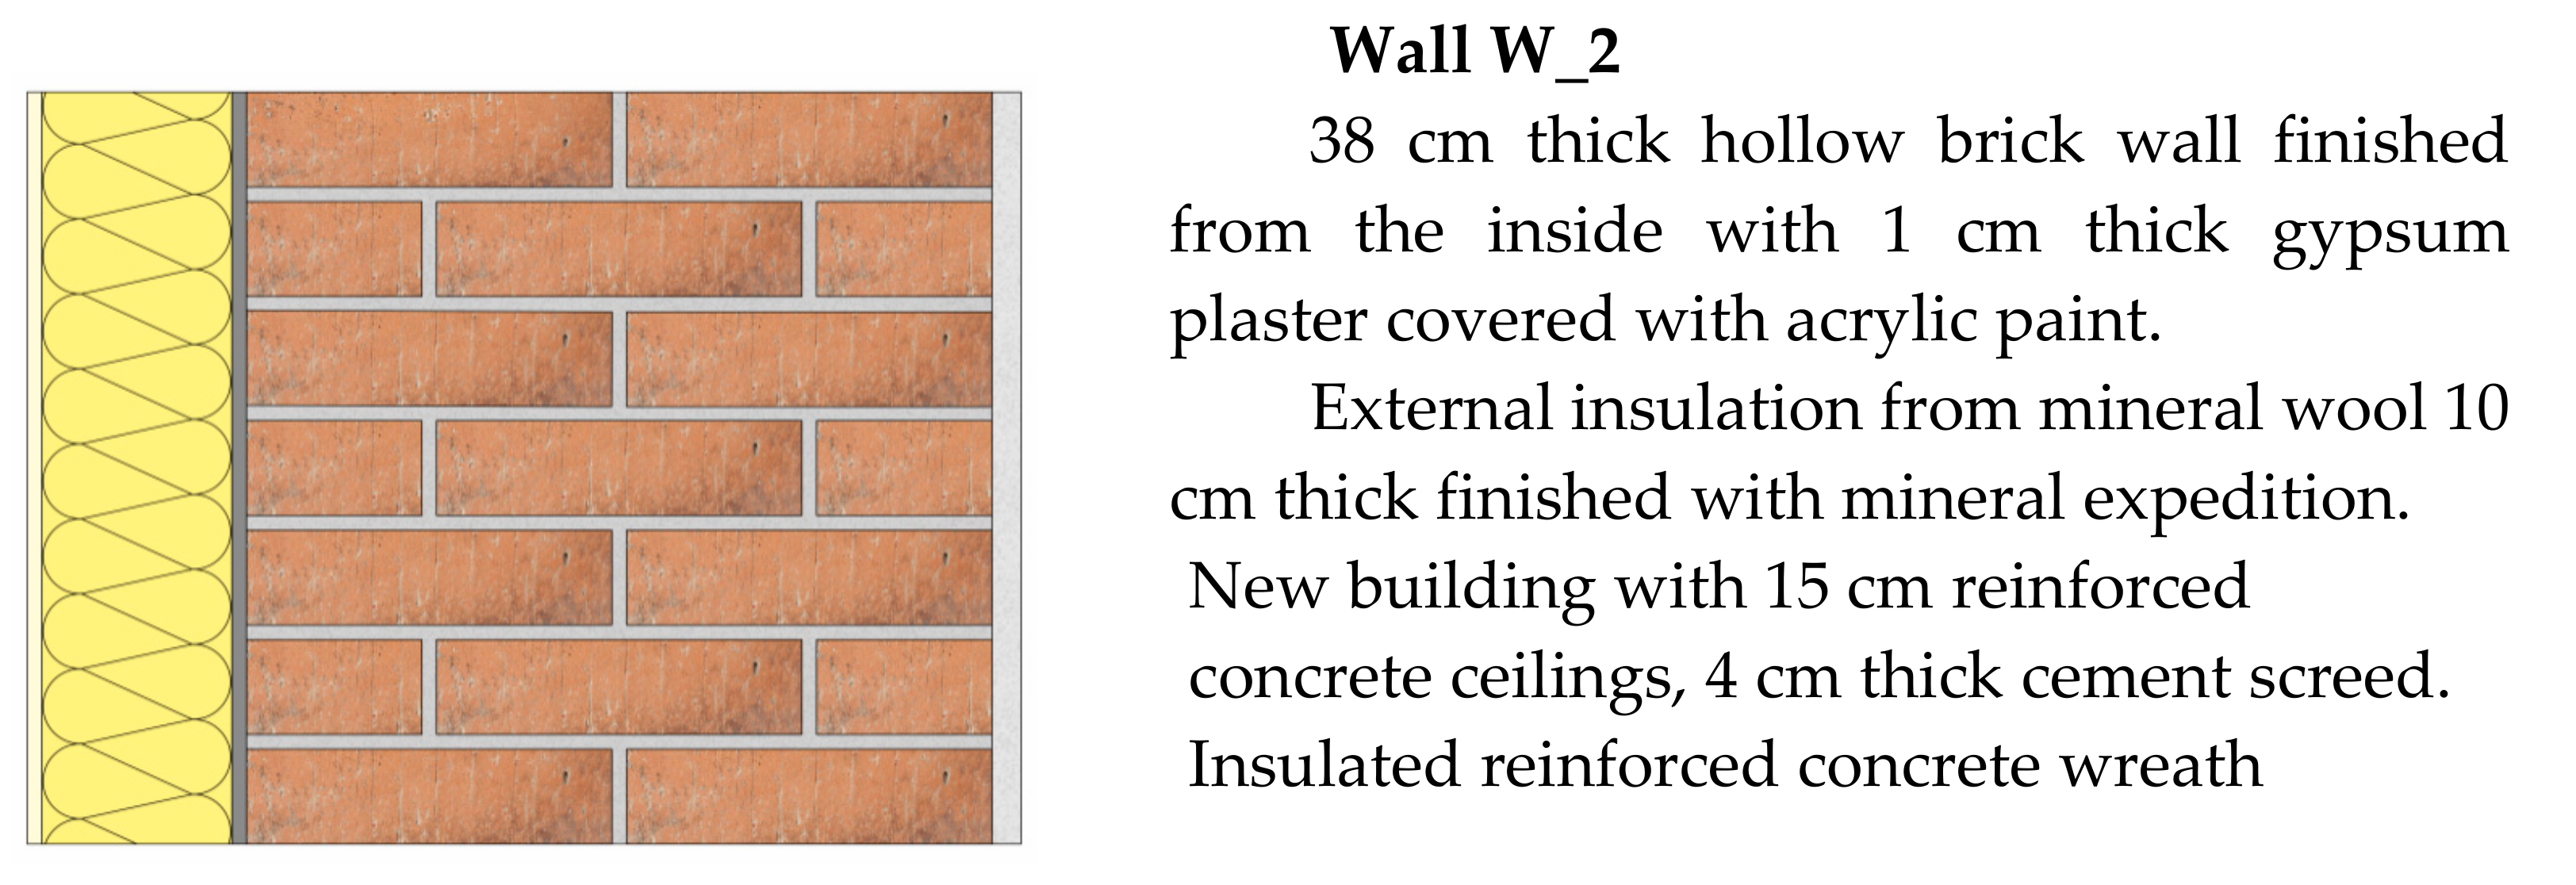
 - insulated buildings, made in traditional technology, with wall insulation value at the level of U = 0.25 ÷ 0.30 [W/m2K] (variant W_2), (Figure 9).
 Figure 9. Description of the wall system solution for variant W_2.
 - both groups of buildings had a gravity ventilation system, central heating, solid fuel stove, new PVC window frames.
3. Results and Discussion
3.1. In Situ Research
The measurement was carried out with a 1 h time step for the heating season of 2017. The selected research results are presented below (Figure 10, Figure 11, Figure 12 and Figure 13).
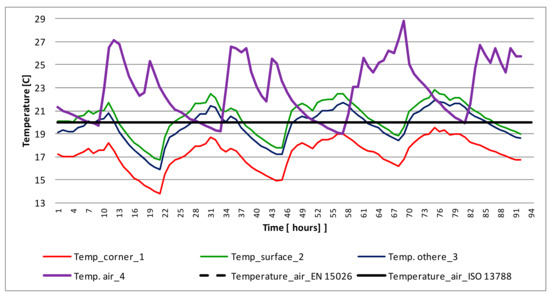
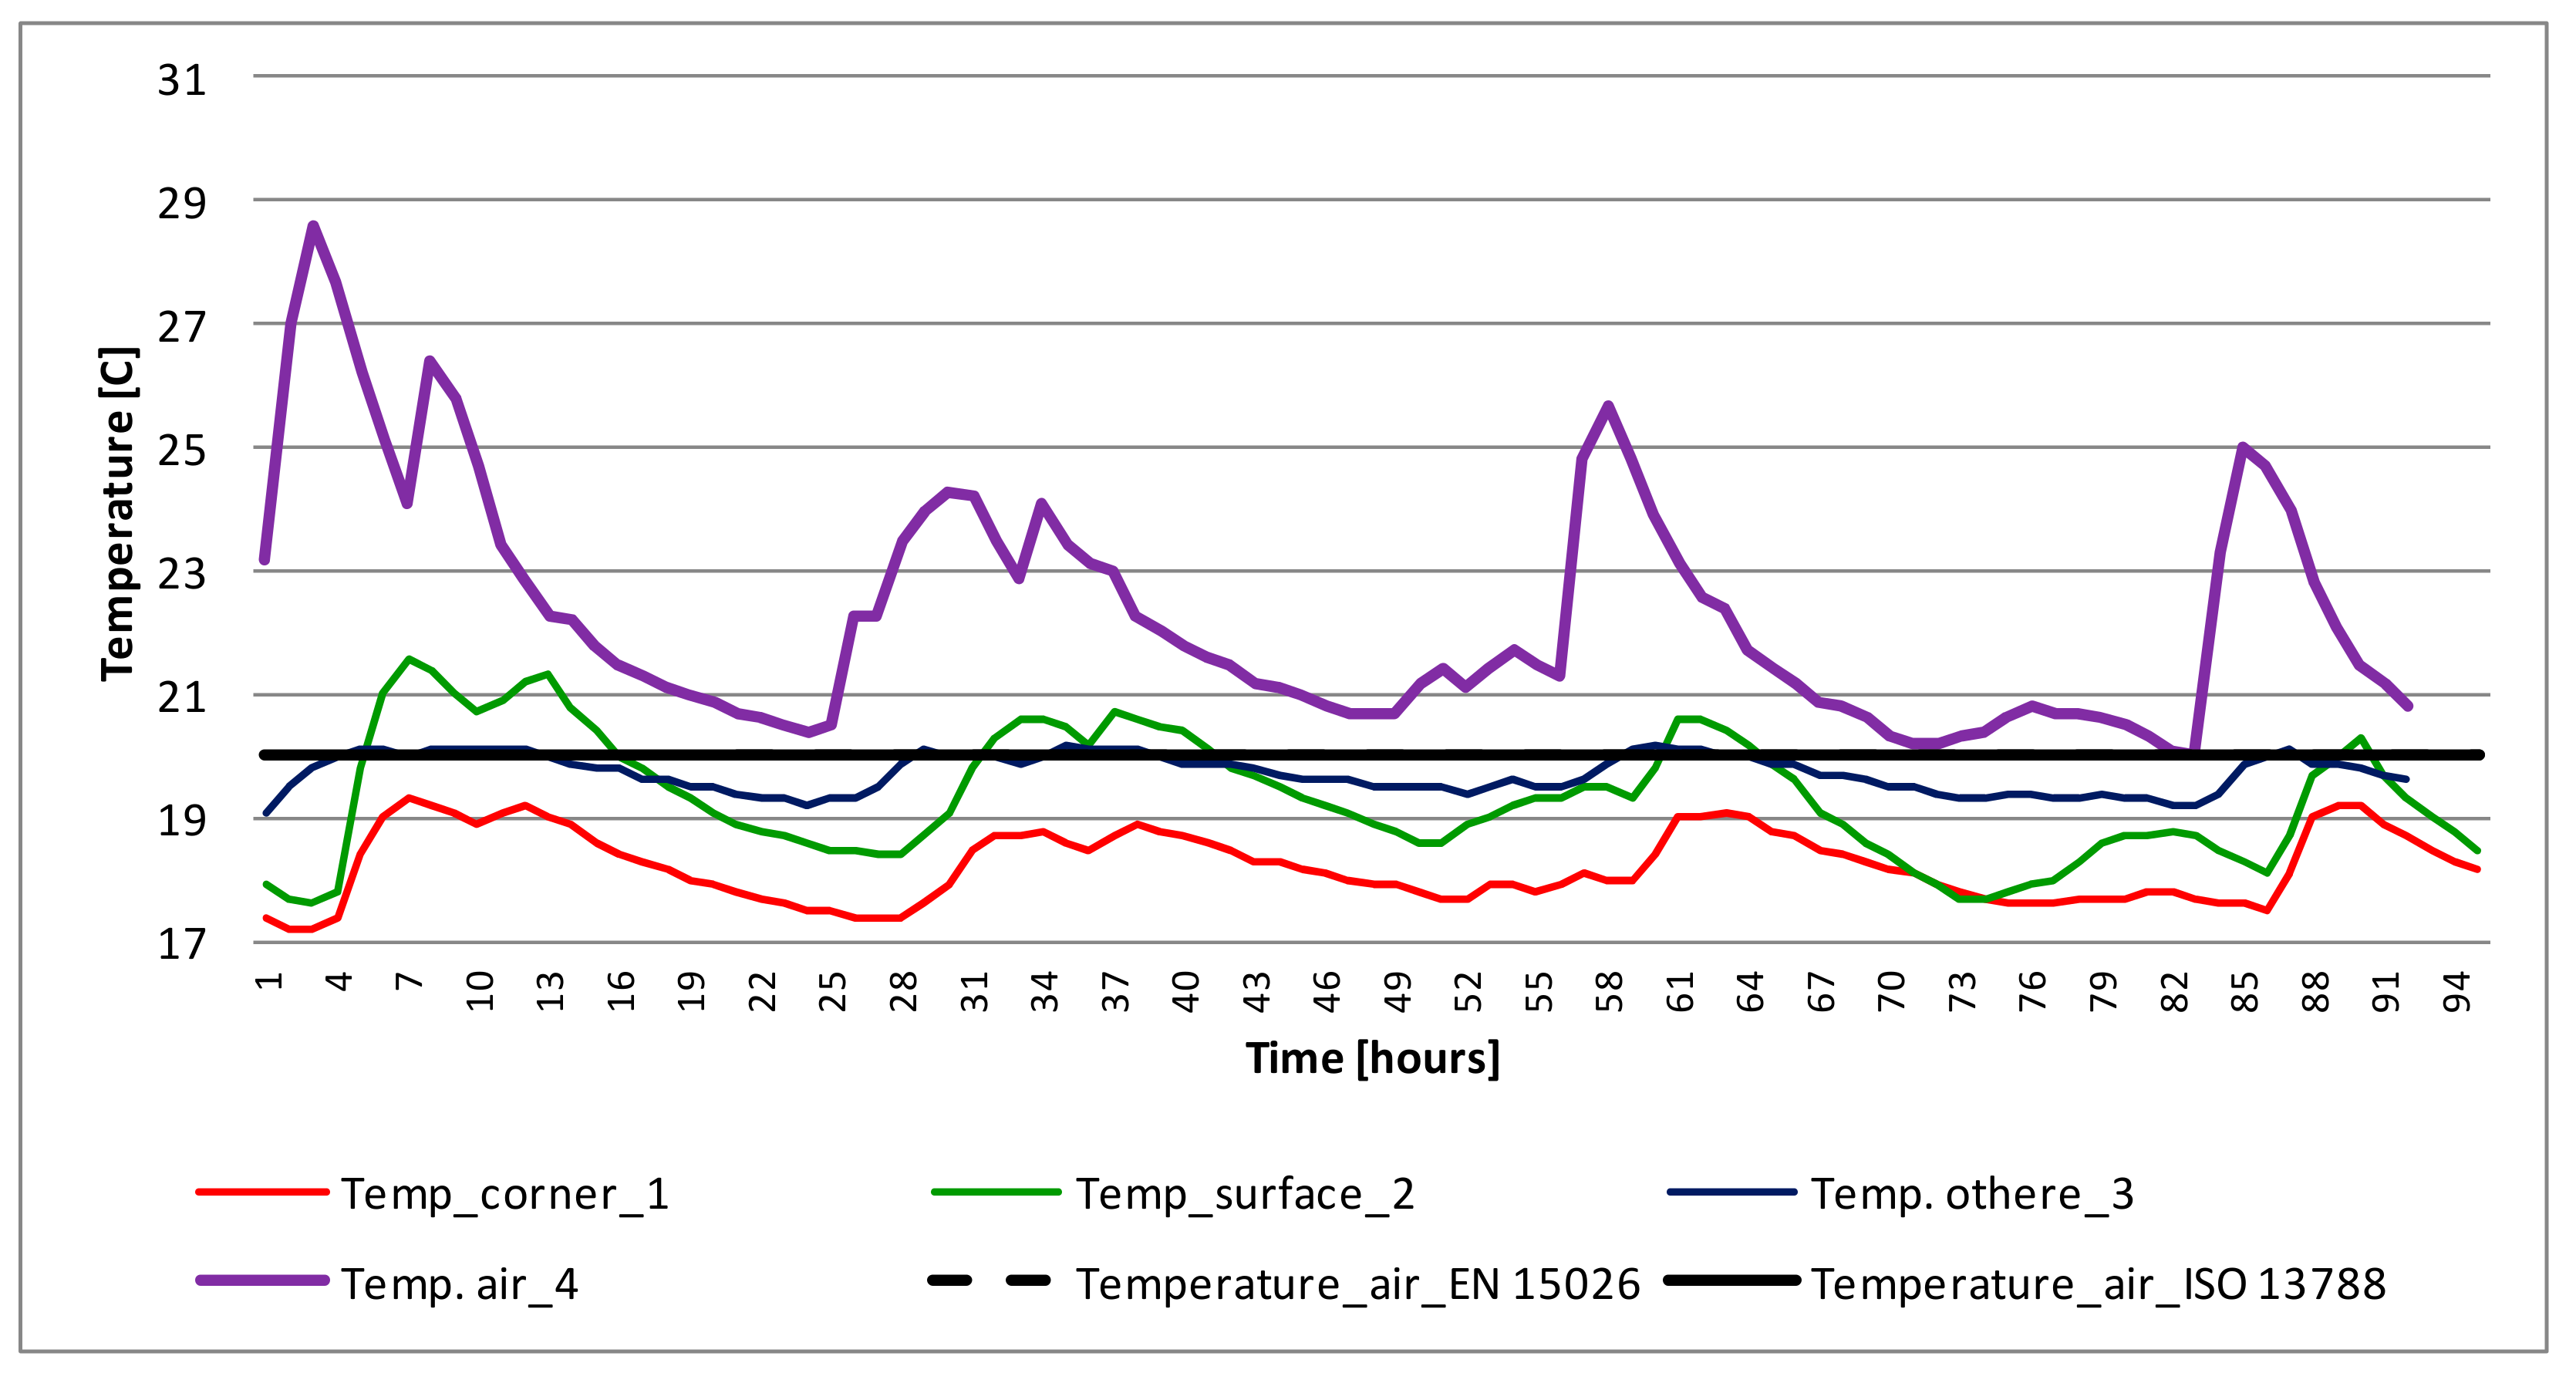
Figure 10.
Changes of indoor air temperature for the room with external walls W_1 (symbols as in the picture Figure 5).

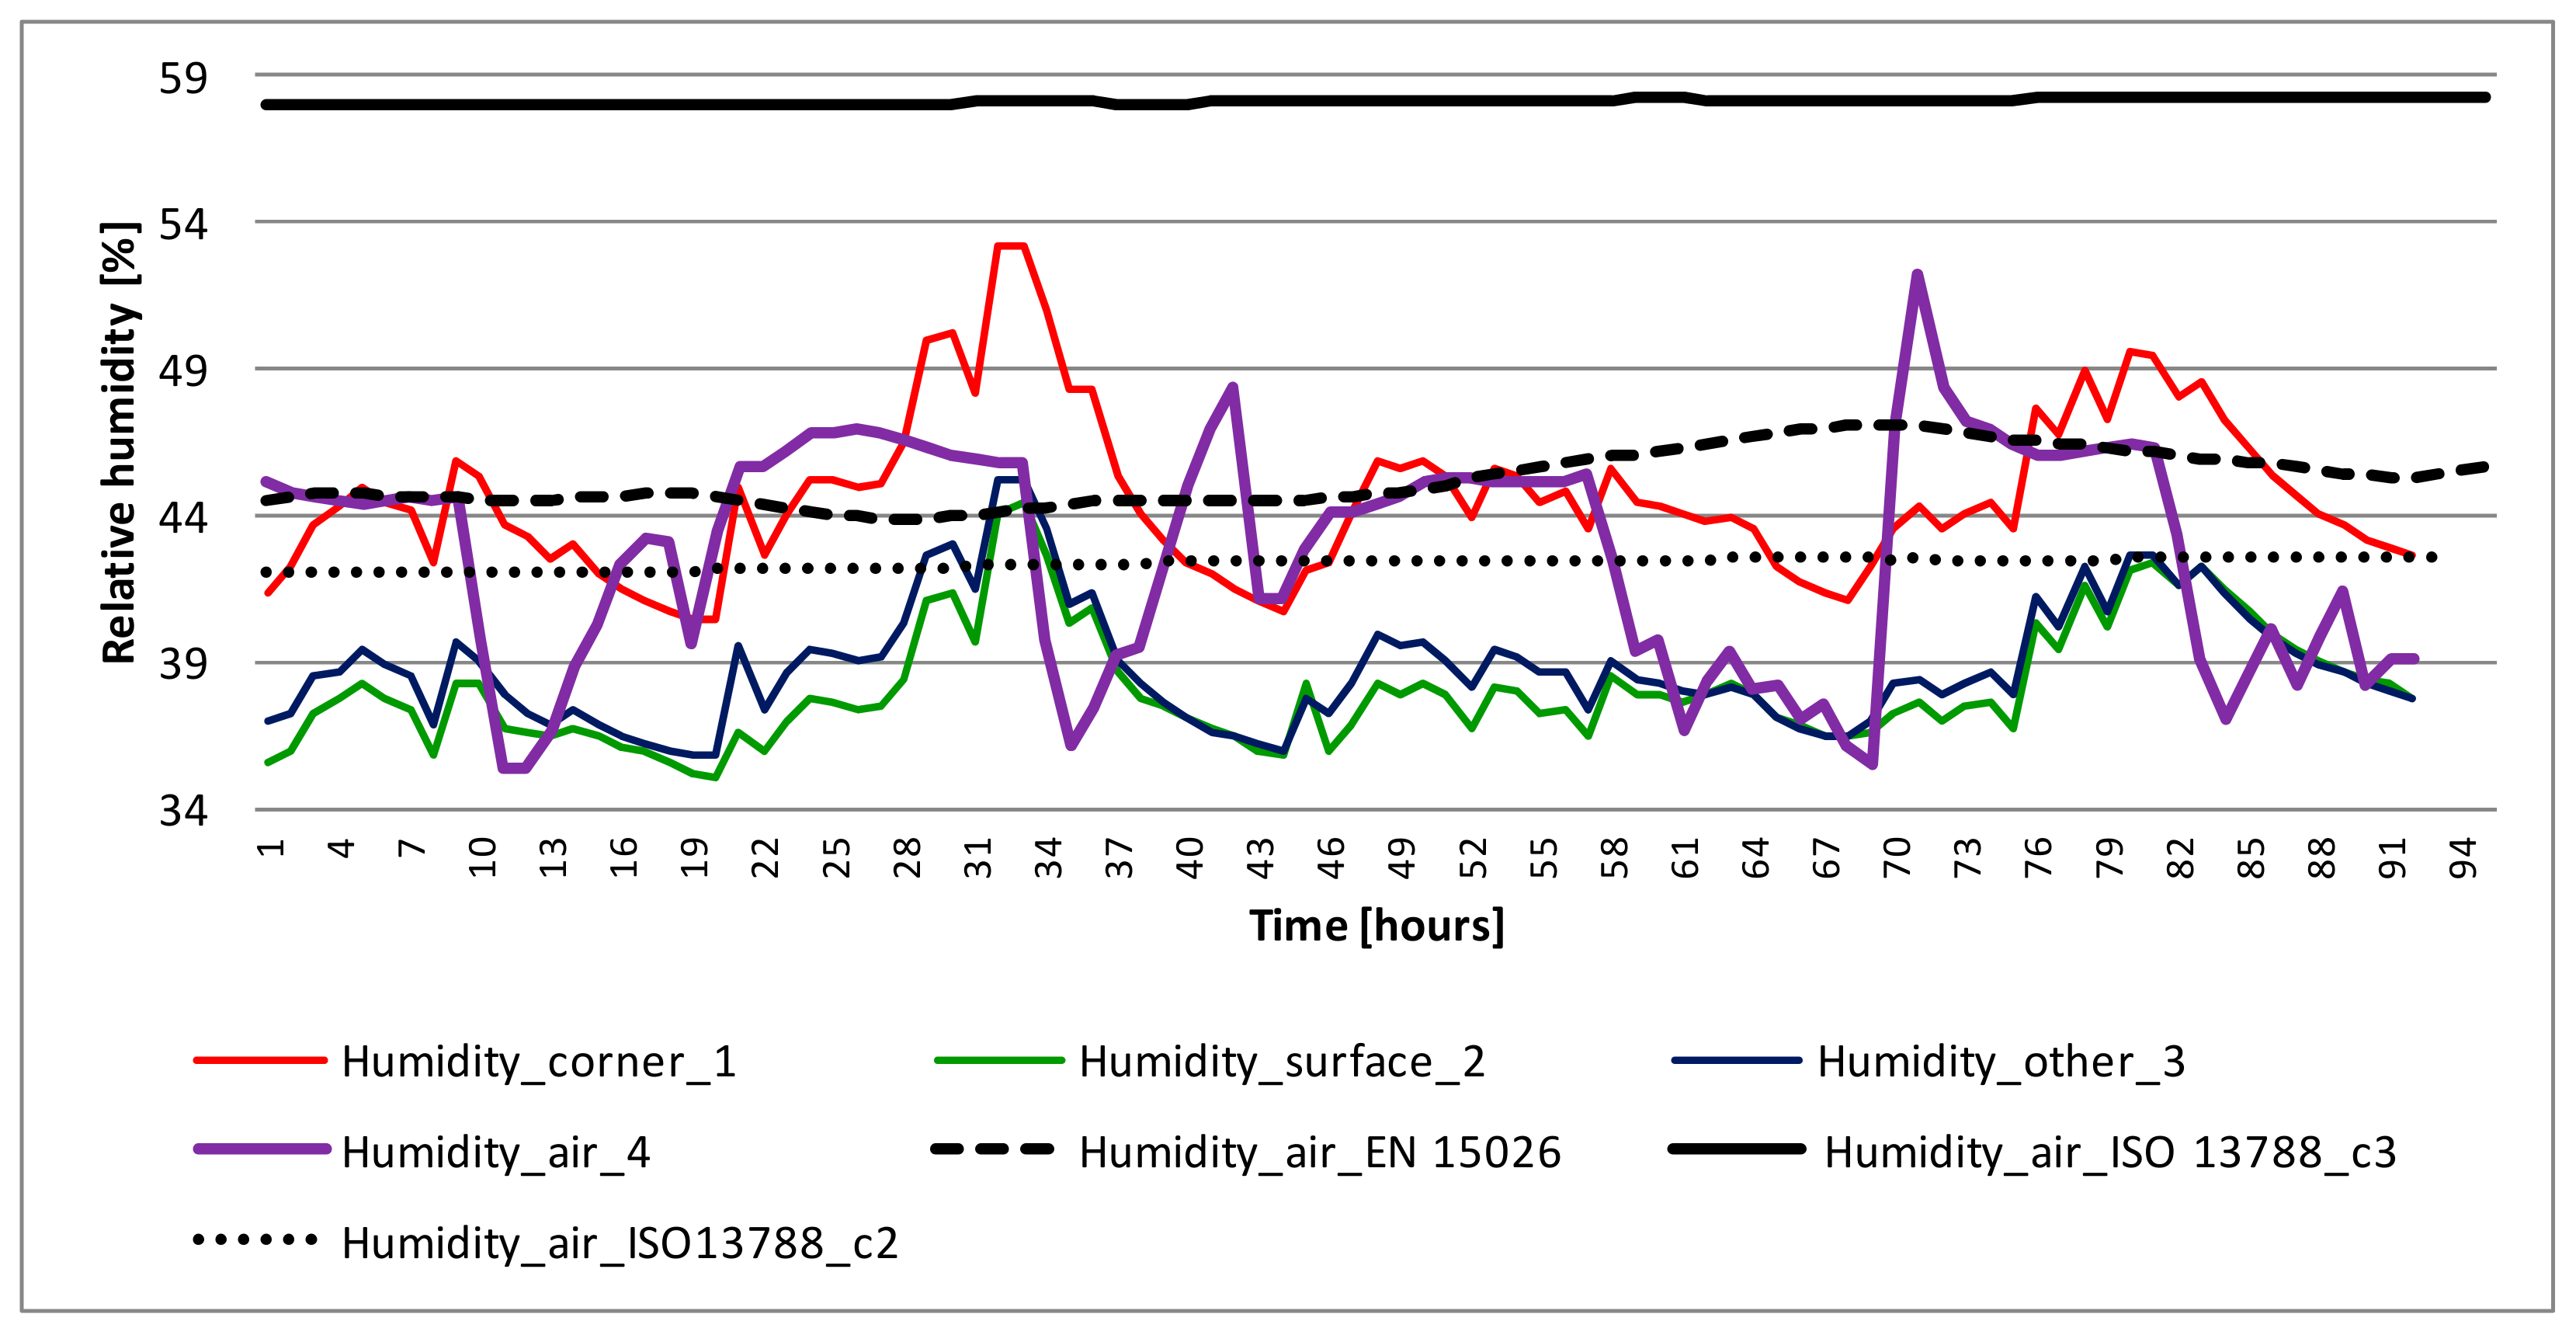
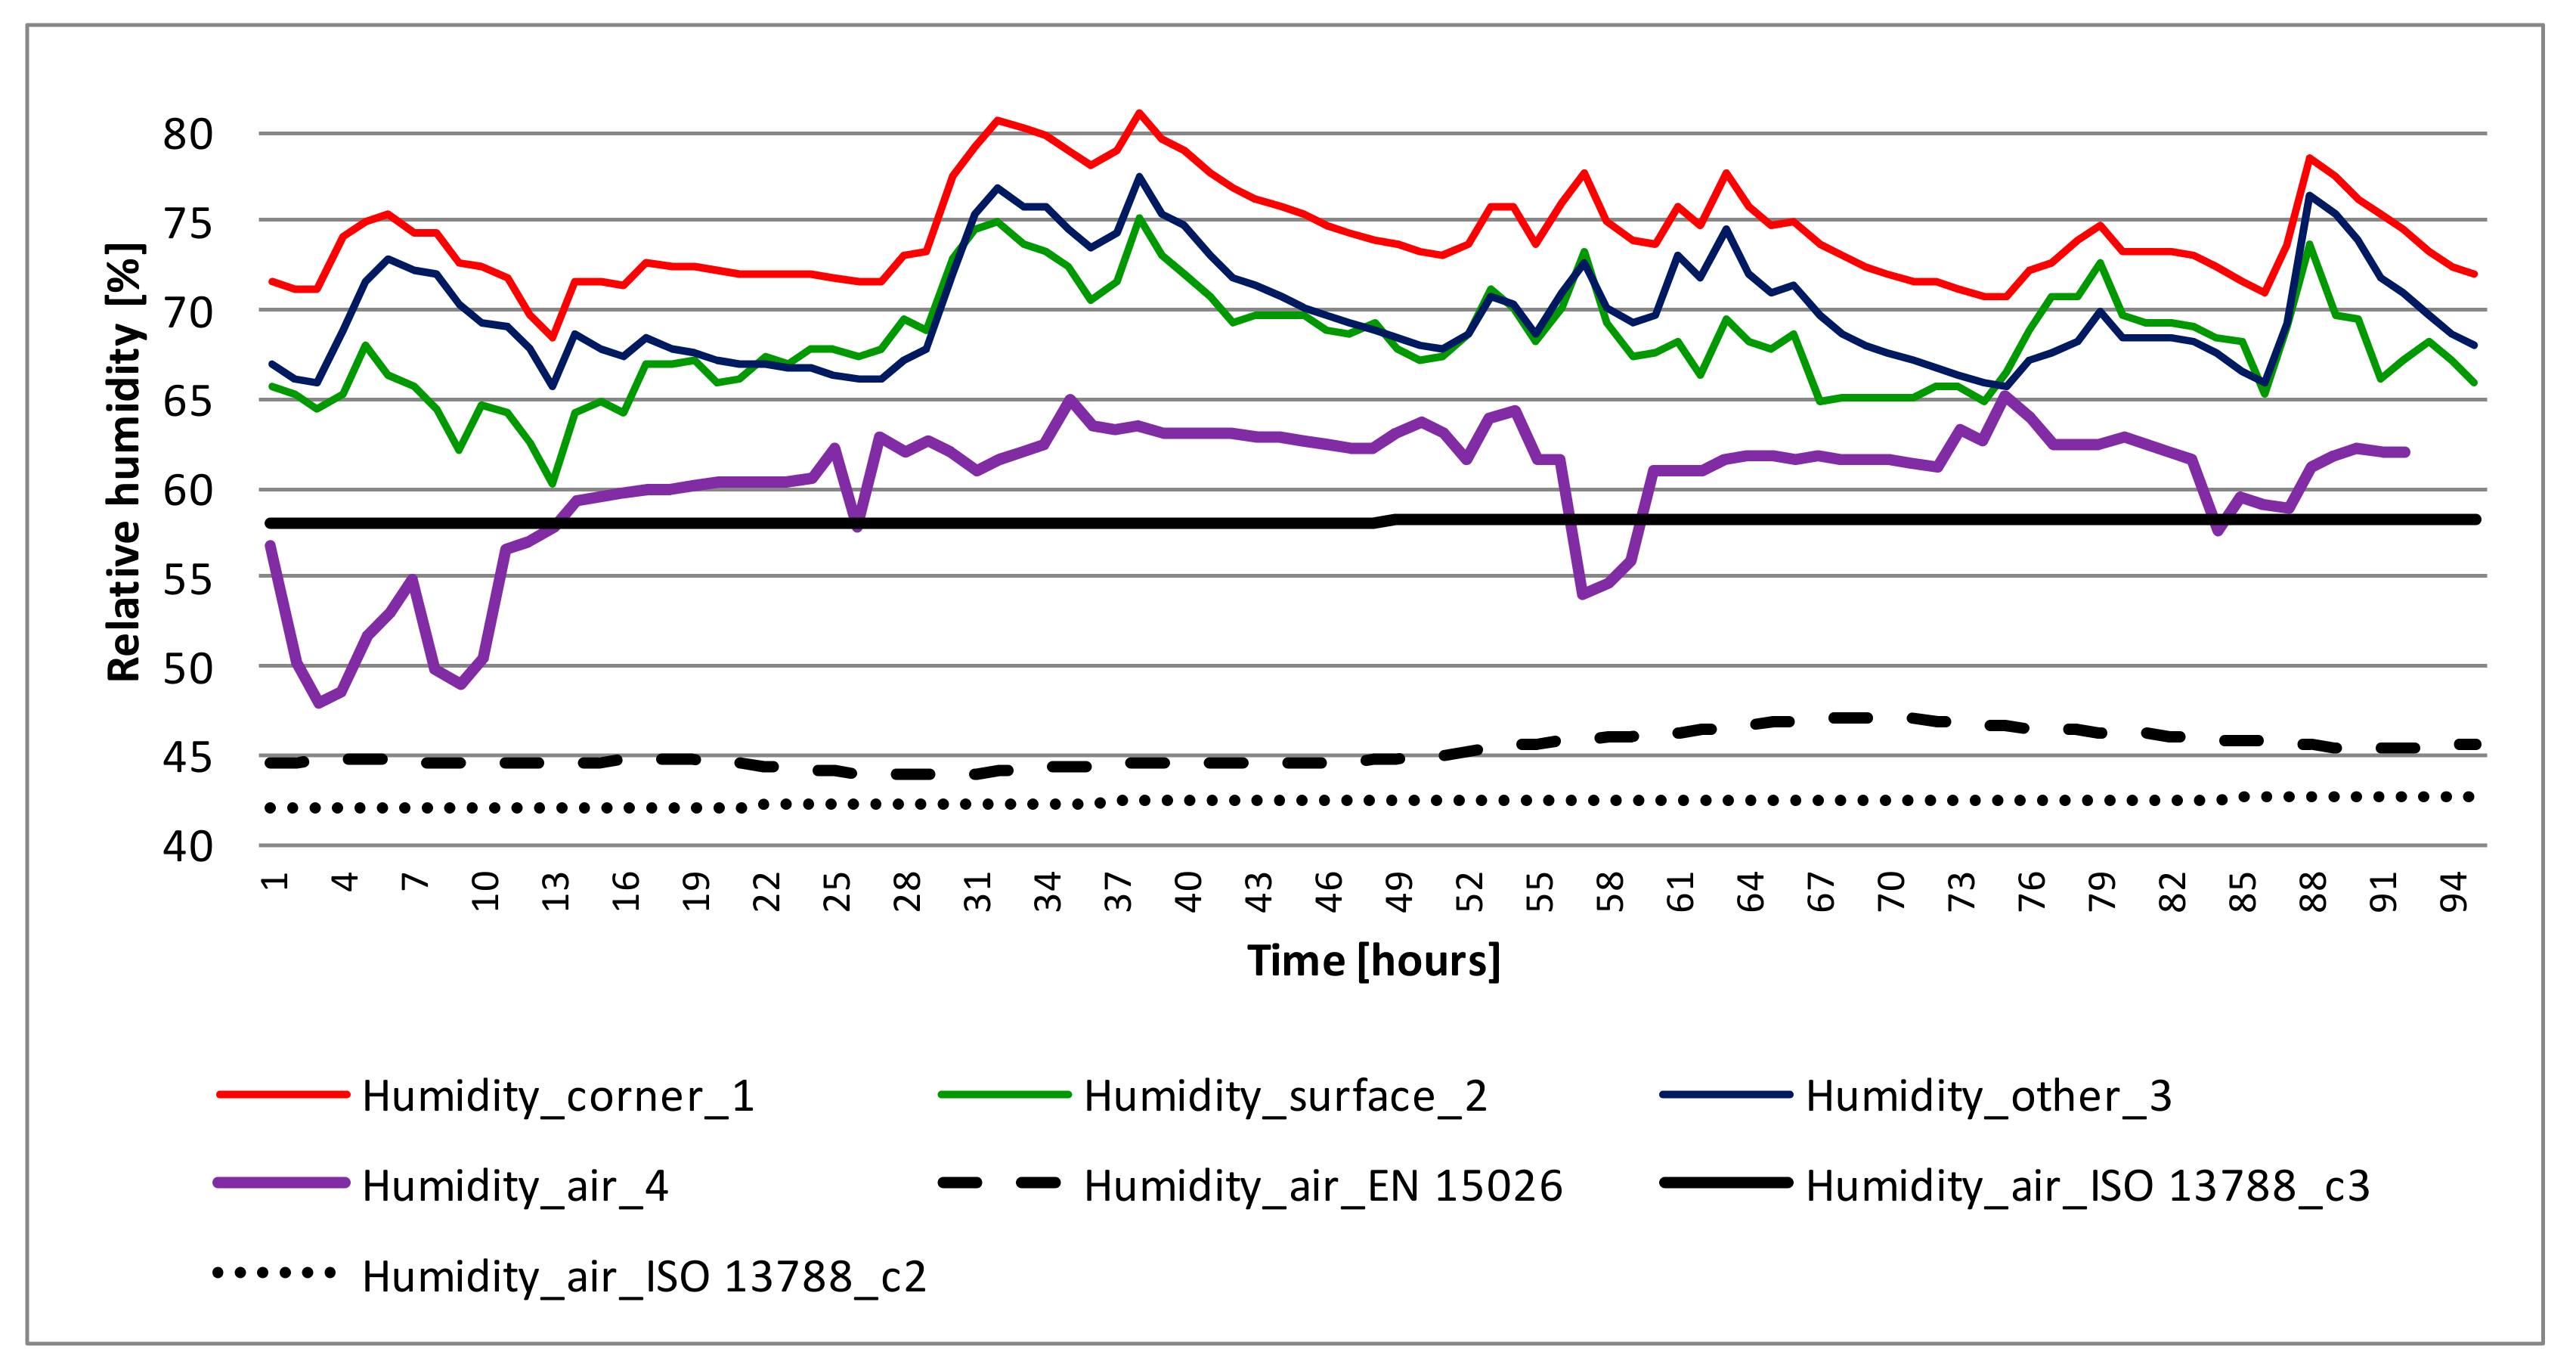
Figure 11.
Changes of relative air humidity for the room with external walls W_1 (symbols as in the picture Figure 5).
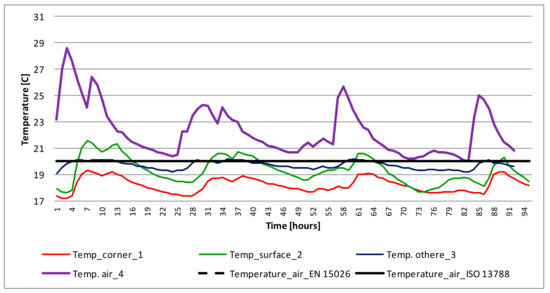
Figure 12.
Changes in indoor air temperature for the room with external walls W_2 (symbols as in the picture Figure 5).
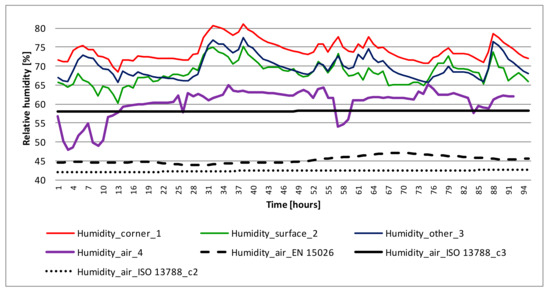
Figure 13.
Changes of the relative air humidity for the room with external walls W_2 (symbols as in the picture Figure 5).
In order to show more clearly the differences in the measurement values, the graphs present the selected measurement period of February 2017, Figure 10, Figure 11, Figure 12 and Figure 13 (the lowest average outdoor temperatures for the region).
For both groups of buildings, we can observe large discrepancies between the parameters of indoor climate, depending on the place. For variant 1, the difference between the temperature of the indoor air and the surface of the indoor wall is within 5–8 °C (Figure 10). The lowest temperature occurs near the corner and it is lower than the wall surface temperature by approximately 3 °C. In addition, we can observe a large daily shift of the temperature of indoor environment in relation to the remaining measuring points. With respect to the changes in the relative humidity of the air for variant No.1, its highest value is observed for the corner and has the maximum value of 55% (Figure 11).
For variant No. 2, the difference between the temperature of the indoor air and the surface of the indoor wall is within 2 °C (Figure 12). The lowest temperature occurs near the corner and it is lower than the temperature near the wall surface by approximately 2 °C. With respect to the changes in the relative humidity of the air for variant No. 2, its highest value is observed for the corner and is up to 80%. For the surface of a flat wall its limit value is 60% (Figure 13).
When the results are compared with popular models of indoor climate, the following findings are obtained:
- -
- lack of compliance in the values and in the changing trend involving the distribution of temperature for the measured and calculation values. In accordance with the assumptions of ISO 13788, a constant indoor air temperature of 20 °C is assumed. The standard EN 15026 assumes a constant value of the indoor air temperature in the period from November to April, and it also has the value of 20 °C. The calculation assumptions were adopted for typical residential buildings (both for ISO 13788 as well as for EN 15026). For both variants, the indoor air temperature was higher than the design temperature. What should be a matter of concern is that the temperatures in the remaining measuring points were much lower (than the design temperature values adopted in the standards).
- -
- lack of compliance in the values and in the changing trend involving the distribution of relative humidity for the measured and calculated values. According to the assumptions of ISO 13788, the humidity value in the analyzed period should not exceed 55% (for class 3) and ~43% (for class 2), according to the EN 15026 standard is ~45%.
In the case of the ISO 13 788 standard, the 2nd class of rooms, i.e., buildings with unknown occupancy, and the 3rd class of rooms, i.e., dwellings with normal occupancy and ventilation, were adopted. The two variants of buildings are located in the same town (distance 600 m), loaded in the same way (family 2 + 2), heated in the same way, similar volume, surface, and geometry of the building. However, for each case, the profiles of changes in microclimate parameters differ significantly. Determining the class of use of buildings is one of the problems that directly translates into the correct design of the entire wall system. Both buildings were loaded equally, but for the first building W_1 (historical building) class 2 “fits” more, and for the second (W—new building) class 3 does (in the context of convergence with the measurement results). The author claims that this is a significant problem which directly translates into the correctness of calculations and requires further diagnosis.
For the remaining measuring points of the type: ‘corner’, ’other’, the value of the relative air humidity near the indoor surface reaches even 80%. From the previously mentioned considerations, we can see that these are conditions conducive to the development of mold. According to [31], we can protect ourselves against mold by keeping relative humidity of the air below 70%. A full guarantee is obtained when maintaining it below 60%.
3.2. Mold Risk Development Assessment
3.2.1. Temperature Factor on the Inner Surface fRsi
For building walls from variant 2 (W_2), under real conditions, mold growth is observed on the inner surface of the walls, in the corners and at the point of connection with the reinforced concrete ceiling (Figure 14). In this case, mold risk assessment was performed on the basis of the method given in ISO 13 788.

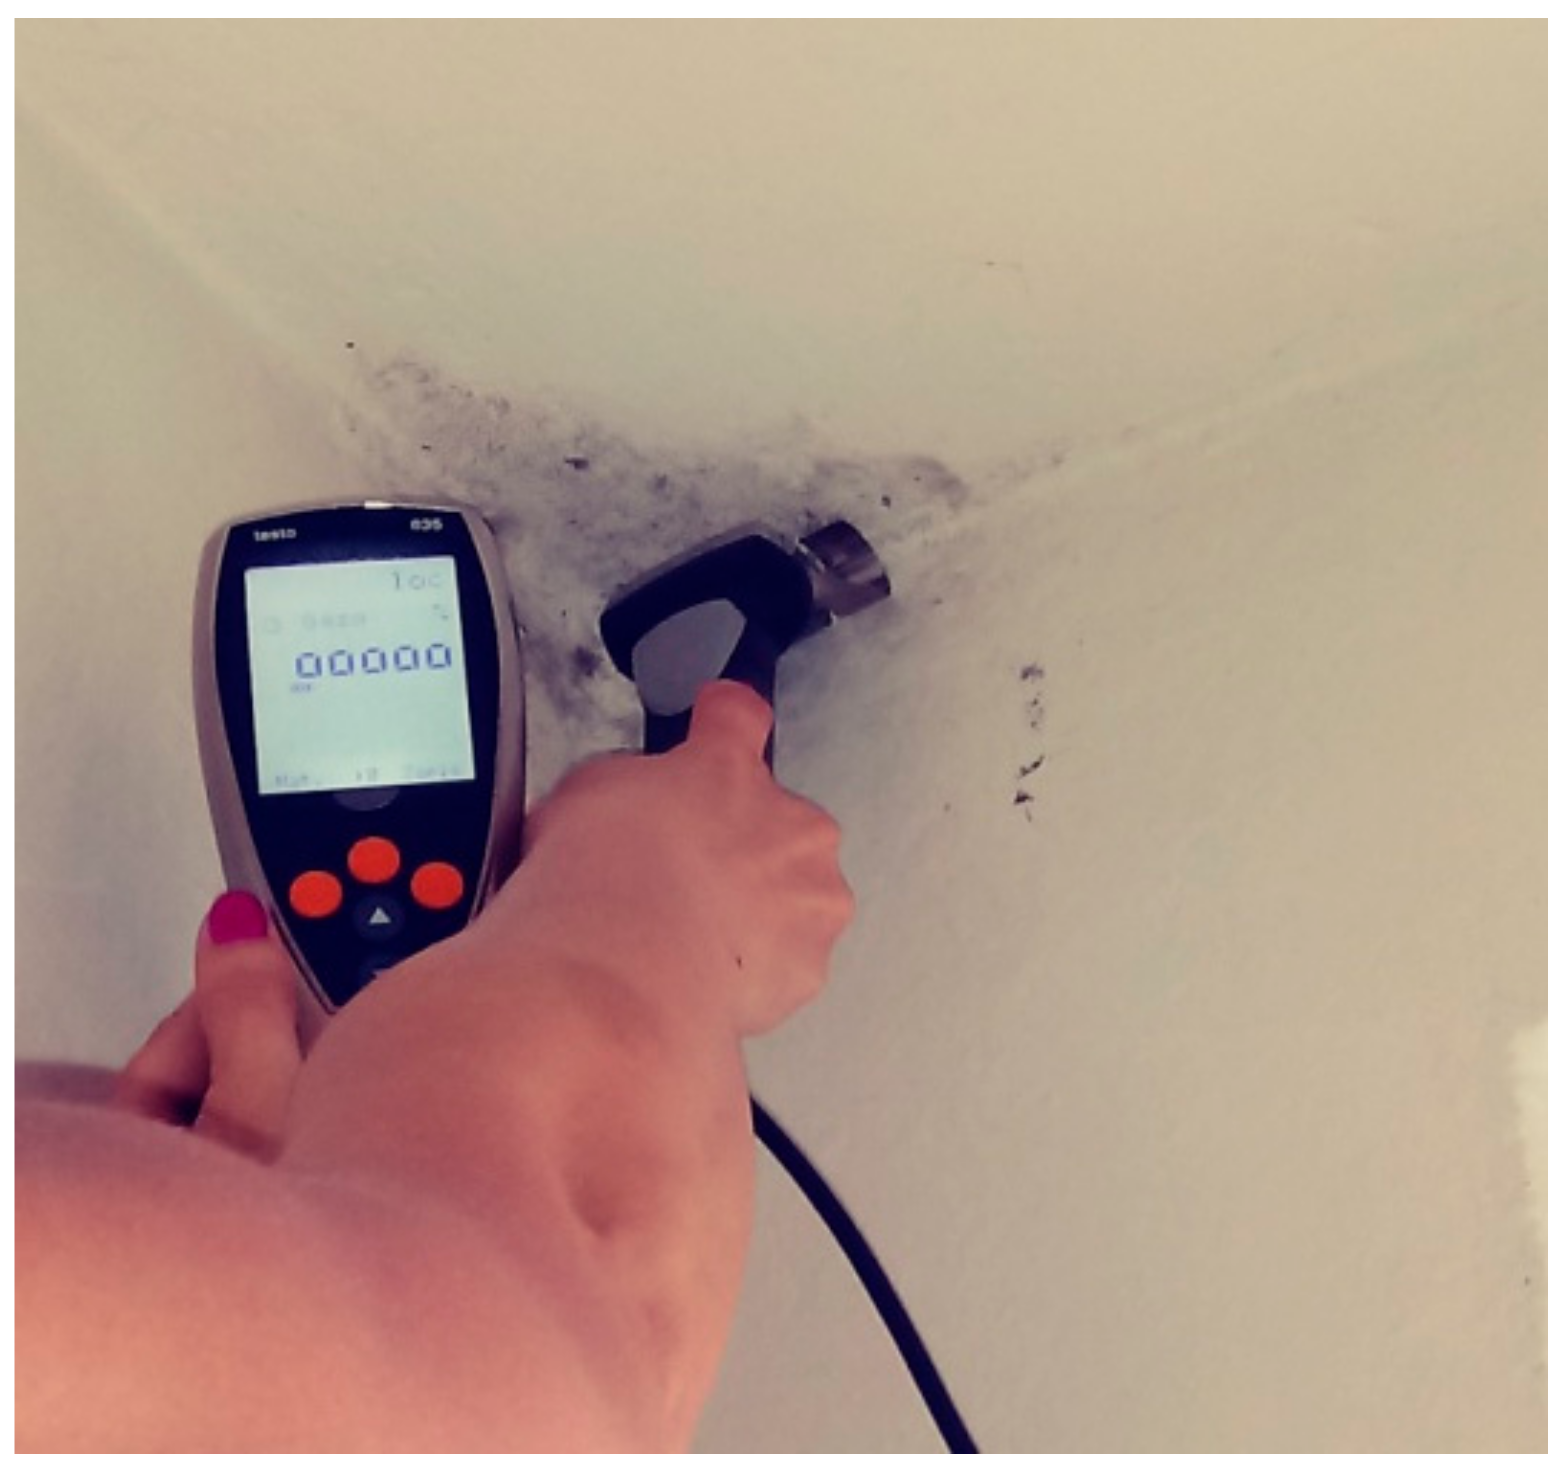
Figure 14.
Analyzed corner. Measurement of surface humidity with the Testo 635-2 instrument.
For the corner in the place of mold development, the measurement of surface mass moisture was carried out using the dielectric method and the Testo 635 test apparatus (Figure 14) (The non-destructive stray field measurement uses the ability of water molecules to dampen and thus change electromagnetic fields; the electric field penetrates the material via the contact plates and creates a measuring field with a depth of approximately 5 cm).
The mass moisture of the wall in the analyzed area is outside the range. It should be added that the building where the photograph was taken, and the research was carried out had undergone a comprehensive thermo-modernization which met the highest standards and demands of building construction. For the investigated corner (Figure 14, Figure 15 and Figure 16) a node model was made in the Psi Therm program. On the basis of the equation No 1, the likelihood of mold growth—the so-called fRsi factor—Has been estimated.
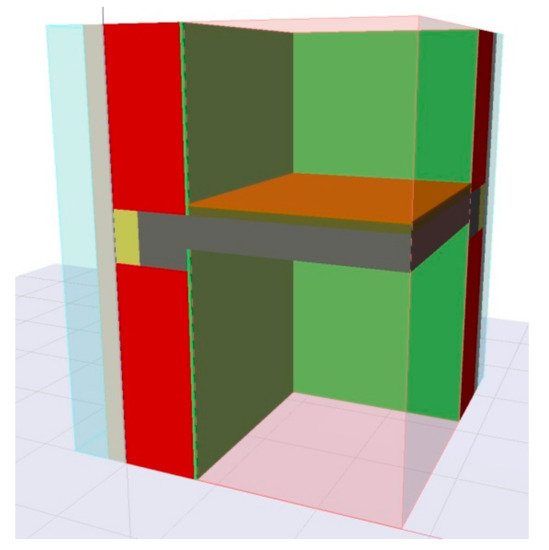
Figure 15.
Corner model in the Psi-Therm 3D program.

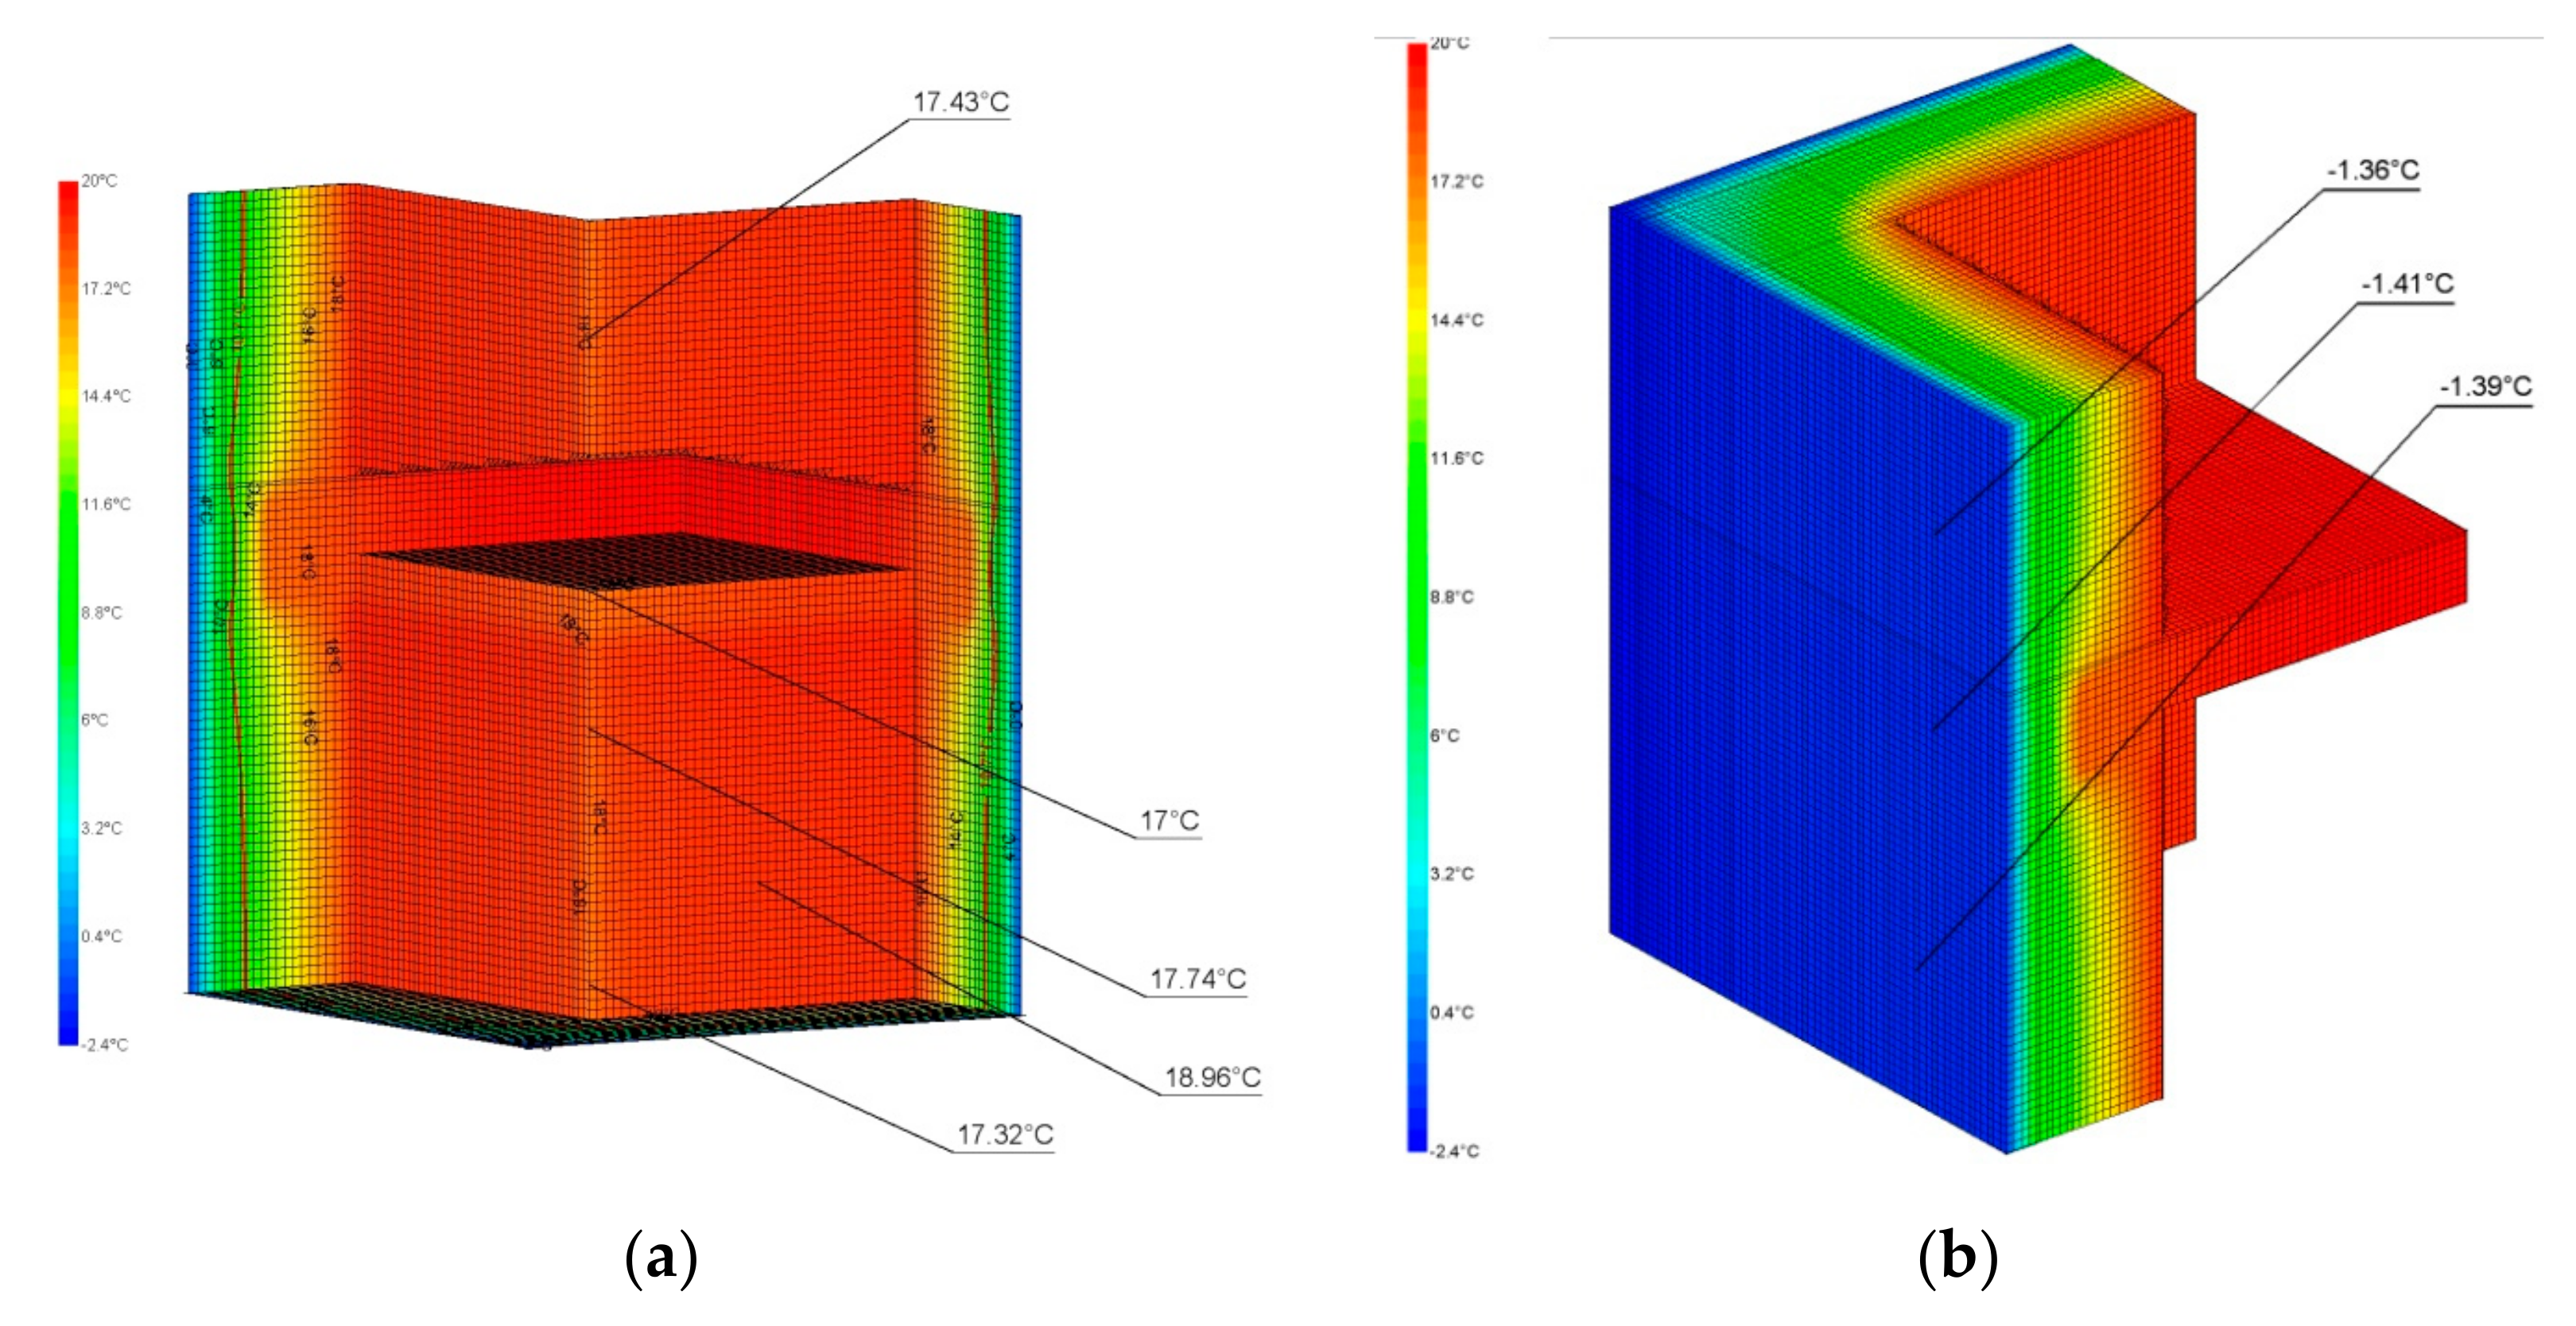
Figure 16.
Distribution of isotherms in the model: (a) view from the side of the internal environment, (b) view from the side of the external environment Calculations carried out for microclimate conditions in accordance with ISO 13788 (i.e., ti = 20 °C, te = − 2.4 °C)
Adopted Climatic Conditions
The calculations were carried out for two cases:
- in the first case, the boundary conditions were adopted based on the ISO 13 788 standard given in Table 2,
Table 2. Material data accepted for analysis.
Calculations were carried out for the critical month, i.e., February.
For the corner (Figure 14) a node model was made in Psi Therm 3D (Figure 15). The program is used to construct detailed sections of the building to determine heat flows and surface temperatures. Based on the analyses carried out, the temperature distribution in selected elements of the grid for the model above (Figure 15) was then used for further calculations (Figure 16).
For both cases, calculations show that the fRsi value is greater than the limit value (see point 2.2) —Table 3. According to analyses (Table 3), there is no risk of mold growth on the wall surface in option 2. Despite this, in Figure 12, so-called thermal bridges, mold develops.
Table 3.
Calculation results for the variant 2 (W_2).
The fRsi factor was determined based on the development of the mold fungus Aspergillus versicolor. Its development occurs at the humidity above 80%. The assumption that only this mold fungus can occur in buildings is wrong—Although it occurs most often.
3.2.2. Biohygrothermal Model
The evaluation of envelopes in the context of a potential threat of mold development should comprise all aspects related to their development and referred to point 2 (Materials and Methods). For this purpose, the author used the WUFI Bio program (Wufi). The wall of the building from variant No.2 (Wall—W_2) (Figure 14) was adopted for the assessment. A continuous development of mold on the surface can be observed for this wall.
For variant 1 (Wall—W_1), no mold growth is observed, which is why this case was omitted in the analysis. In the modeling process, material data from Table 2 were applied, the conditions of the indoor climate were adopted on the basis of
- EN 15026
- ISO 13788
- the measurement data were taken from the research stand (temperature, humidity—for option No. 2)
The climate from the base for the Katowice location was adopted as the external climate. The partition is situated towards the north. This was taken into account in the calculations, mainly due to driving rain and longer drying time. It was not a climate based on measurements, because it does not yet have all the parameters. Nevertheless, due to the close location of the research stand, it was treated as a local climate.
In a building, mold develop on various substrates having diverse levels of nutrients. Three classes of substrate were introduced with the aim of taking into consideration the critical water content and growth rate. The fourth class K is applicable in particular to fungi whereof potential health risks are the highest (Aspergillus fumigatus, Aspergillus flavus, Stachybotrys chartarum, and others) [47]. For the analysis, the class II substrate was adopted, i.e., the substrate with a porous structure such as plasters, mineral building materials, and insulating materials.
For the envelope designed with the assumption of the indoor climate maintained inside the room that meets the requirements of the standards EN 15026 and ISO 13 788, the development of mold on the indoor surface of the envelope is not expected (Figure 17 and Figure 18). For both cases, no exceeding of the critical water content was observed (Figure 17 and Figure 18). It is assumed that mycelium does not grow then. Mycelium growth is assumed to stop when the water content in the spore falls below the critical water content and to resume instantly when the critical water content is exceeded again.
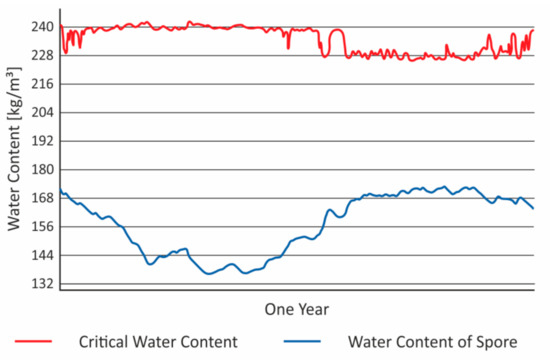
Figure 17.
Changes in water content for the envelope according to the calculations for the indoor climate, EN 15026.
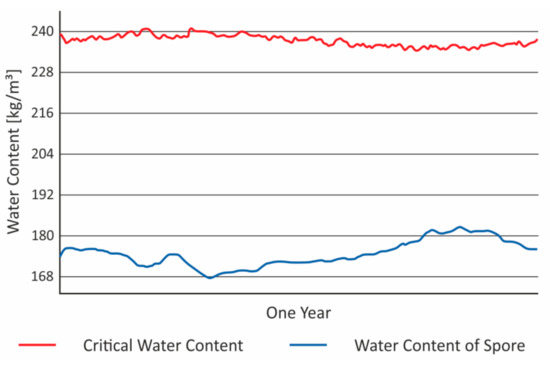
Figure 18.
Changes in water content for the envelope according to the calculations for the indoor climate, ISO 13788.
The evaluation period for the mold index as well as for the mycelium growth is one year. The evaluation period is limited to only one year, since the mold index is based on empirical data for one year [49].
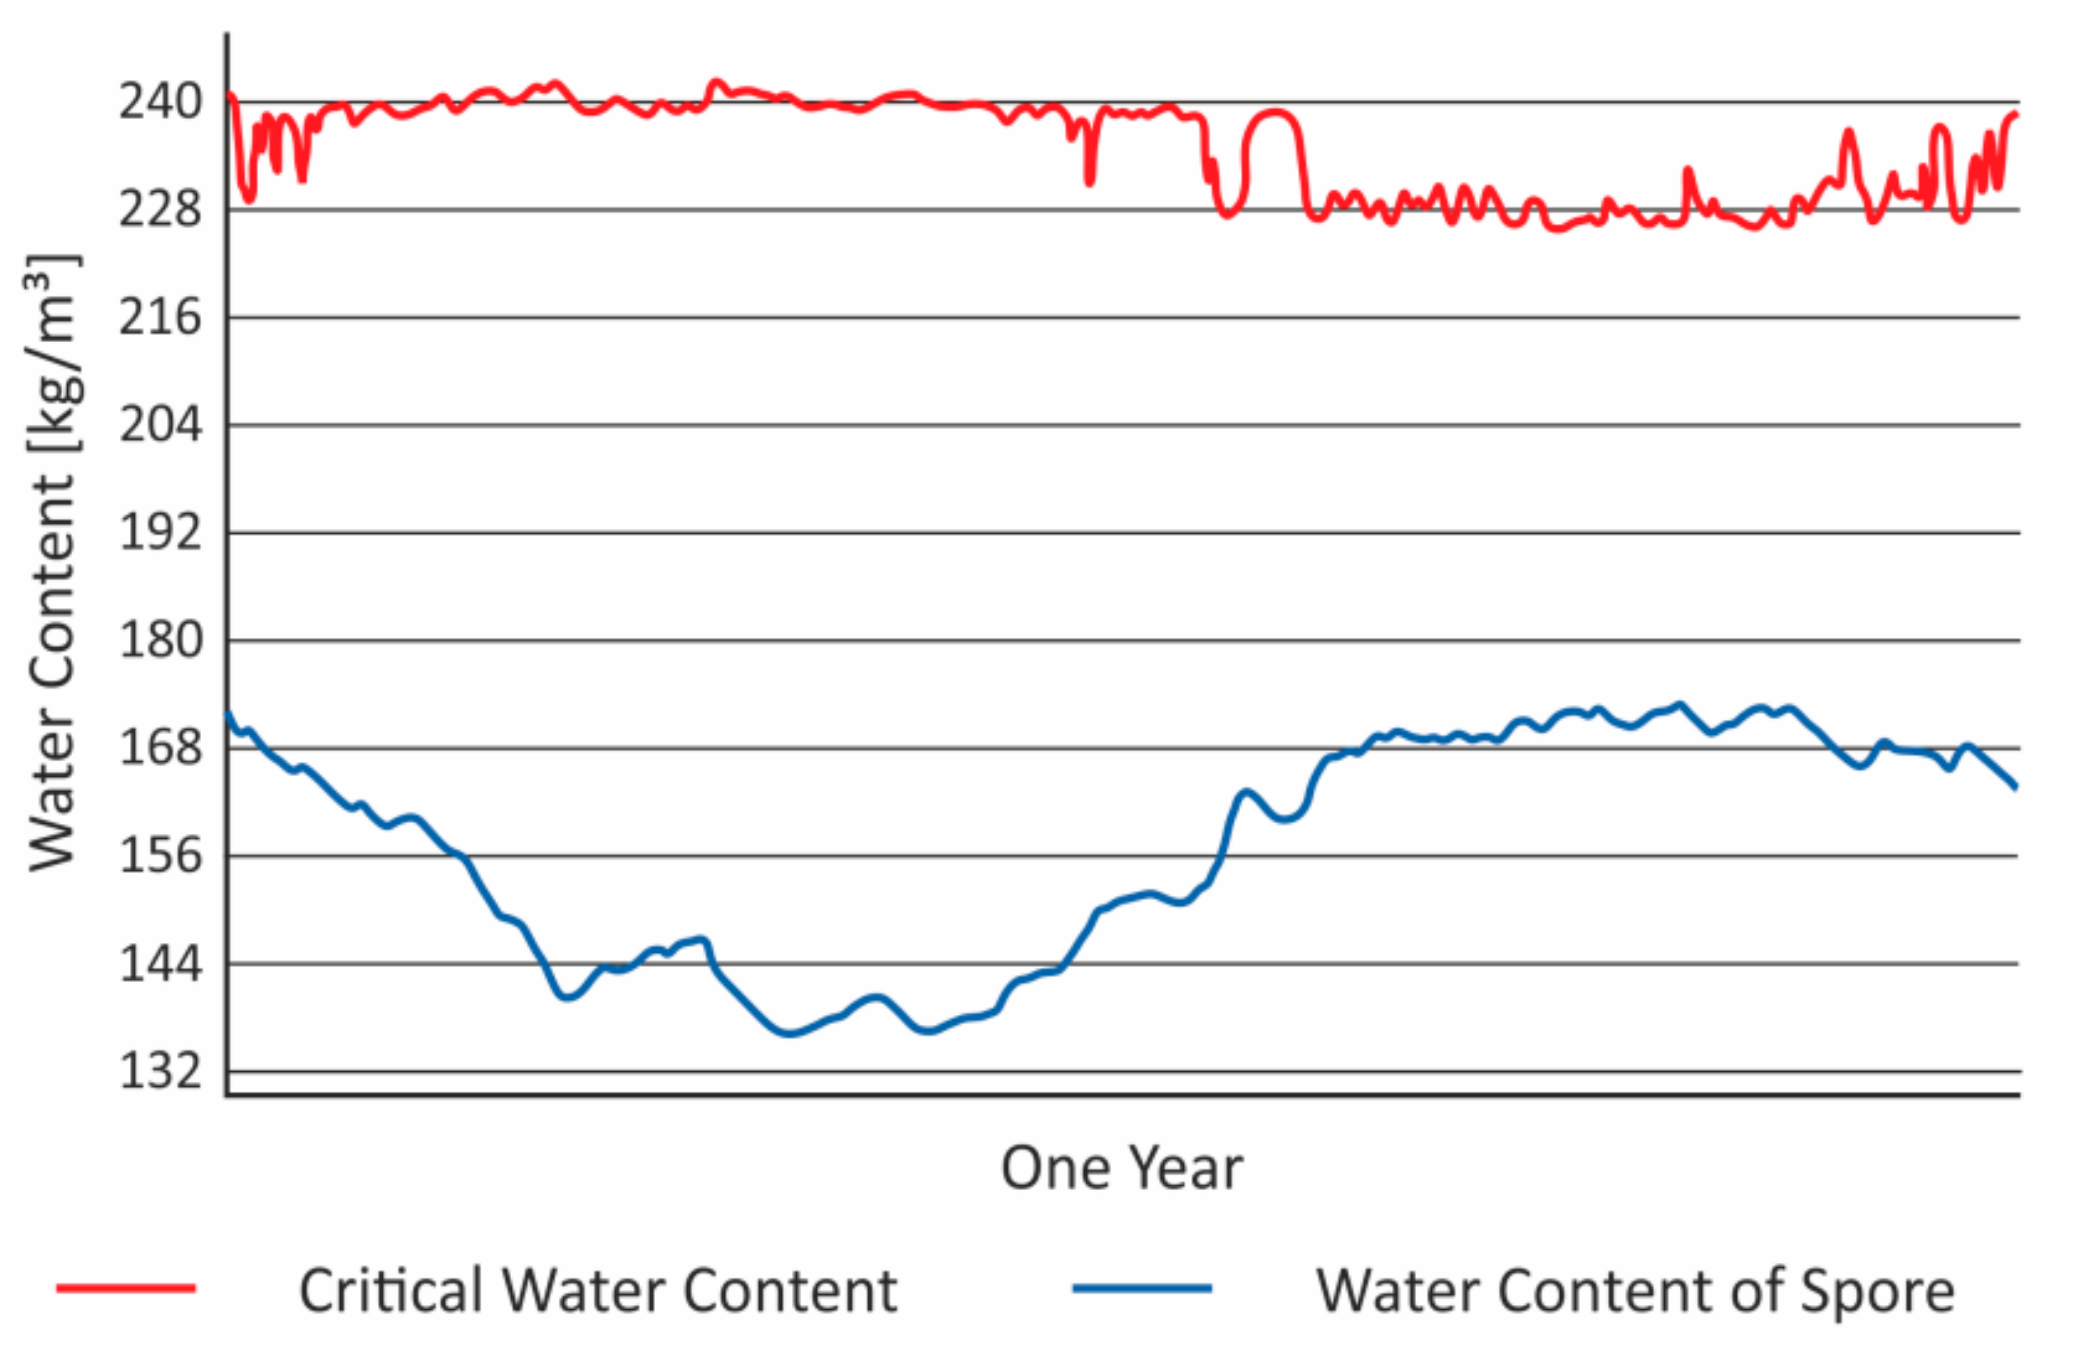
Analyzing the results of modelling for the wall using the real conditions of the room microclimate, it is clearly seen that the water content increases above the critical value (Figure 19). Mycelial growth then occurs (Figure 20). The growth of mold ranges from 50 mm a year to 200 mm a year.
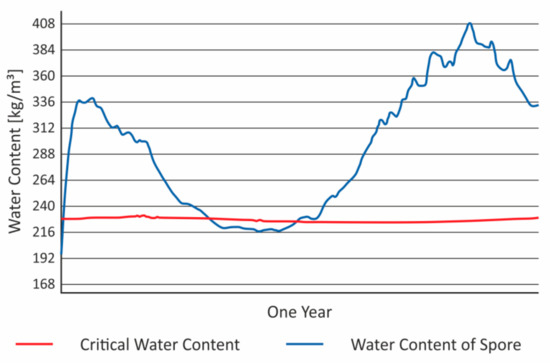
Figure 19.
Changes in water content for the envelope according to the calculations for the indoor climate from the measurements. The growth of mold is from 50 mm/year to 200 mm/year.
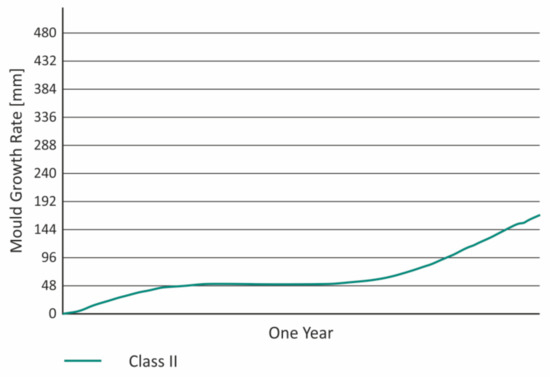
Figure 20.
The course of mold development in the assumed research period according to the calculations for the indoor climate from the measurement.
The model presented by the author and used by the WUFI-Bio program provides the amount of mold in the context of a growing mold form. However, in many cases the seven-degree scale of mold development is used, as in the so-called Viitanen model (e.g., in Scandinavian countries). The Viitanen model uses the so-called “mold index” which describes the area of surface infected by mold, Figure 21. Research presented in the works indicates that this model can also be used for other materials [1,2,40].
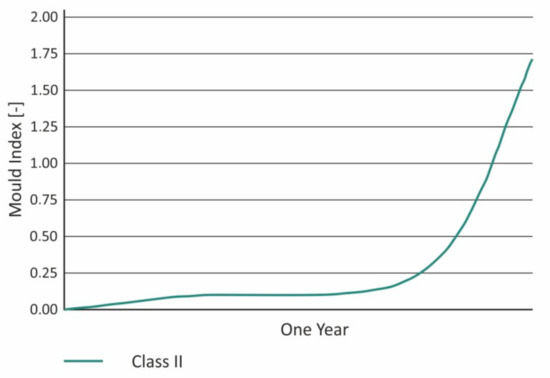
Figure 21.
Mold index.
On the surface of the envelope, with the preset boundary conditions, the growth of mold is observed (Figure 19, Figure 20 and Figure 21). It might be argued, however, that the obtained results are not adequate for the actual situation. The mold is visible with the naked eye, which is not consistent with the result obtained on the Viitanen scale—Value 1-2—Moderate growth visible under the microscope. It should be noted that these observations were carried out by the author [1,2] for wood and there might have been some inaccuracies in the obtained results.
Nonetheless, it can be indisputably stated that climate conditions adopted on the basis of literature do not allow one to predict properly the development of mold on the indoor surface of the envelopes.
4. Conclusions
Mold growth in buildings is first observed in the so-called thermal bridges or anomalies. These are places of increased heat flow and lower temperature on their surface (Tc ↓). At the same time, a significant increase in the relative humidity RHc ↑ is observed in these zones.
In the available calculation models, taking into account these conditions (RHc ↑ Tc ↓) is not possible directly, e.g., ISO 13 788 standard recommends taking other thermal resistance—Rsi for the corner equal to 0.25 [m2K/W], which seems insufficient (Table 2 and Table 3). The available numerical models (WUFIBio—Biohygrothermal model) conduct the analysis only for a flat wall surface.
Therefore, the factors that determine the correct estimation of mold risk development for 2D or 3D elements are climate and geometry. Based on these observations (assumptions), the author introduced the concept of a geometric climate. The aim of further research will be to determine the mutual relations between the microclimate in the room and the microclimate in the boundary layer of the corner.
The result will be the development of new values of thermal resistance coefficients—other than those used so far for the flat wall surface. In addition, the length of the edge (r1, Figure 2) for which these values will apply will be determined.
Funding
This research received no external funding.
Conflicts of Interest
The authors declare no conflict of interest.
References
- Viitanen, H.; Ojanen, T.; Peuhkuri, R. Mould growth modelling to evaluate durability of materials. In Proceedings of the 12DBMC—International Conference on Durability of Building Materials and Components, Porto, Portugal, 12–15 April 2011. [Google Scholar]
- Viitanen, H.; Vinha, J.; Salminen, K.; Ojanen, T.; Peuhkuri, R.; Paajanen, L.; Lähdesmäki, K. Moisture and bio-deterioration risk of building materials and structures. J. Build. Phys. 2010, 33, 2010. [Google Scholar] [CrossRef]
- Orlik-Kożdoń, B. Interior insulation of masonry walls—Selected problems in the design. Energies 2019, 12, 3875. [Google Scholar] [CrossRef] [Green Version]
- Mudarri, D.; Fisk, W.J. Public health and economic impact of dampness and mold. Indoor Air 2007, 17, 226–235. [Google Scholar] [CrossRef] [Green Version]
- Orlik-Kożdoń, B.; Rubin, J. Mould-based biodeterioration of human residential microenvironments. Izolacje 2019, 10, 52–55. [Google Scholar]
- Platt, S.D.; Martin, C.J.; Hunt, S.M.; Lewis, C.W. Damp housing, mould growth, and symptomatic health state. Br. Med J. 1989, 298, 1673–1678. [Google Scholar] [CrossRef] [Green Version]
- Piecková, E.; Jesenská, Z. Microscopic fungi in dwellings and their health implications in humans. Ann. Agric. Environ. Med. 1999, 6, 1–11. [Google Scholar]
- Howden-Chapman, P.; Saville-Smith, K.; Crane, J.; Wilson, N. Risk factors for mold in housing: A national survey. Indoor Air 2005, 15, 469. [Google Scholar] [CrossRef]
- Radziszewska-Zielina, E.; Czerski, P.; Grześkowiak, W.; Kwaśniewska, P. Comfort of Use Assessment in Buildings with Interior Wall Insulation based on Silicate and Lime System in the Context of the Elimination of Mould Growth. Arch. Civ. Eng. 2020, 66, 89–104. [Google Scholar]
- Jaakkola, M.S.; Jaakkola, J.J.K. Indoor molds and asthma in adults. Adv. Appl. Microbiol. 2004, 55, 309–338. [Google Scholar] [CrossRef]
- Adan, O.; Samson, R. Fundamentals of Mould Growth in Indoor Environmens and Strategies for a Healthy Living; Wageningen Press Publisher: Wageningen, The Netherlands, 2011. [Google Scholar]
- Gradeci, K.; Labonnote, N.; Köhler, J.; Time, B. Mould Models Applicable to Wood-Based Materials—A Generic Framework. Energy Procedia 2017, 132, 177–182. [Google Scholar] [CrossRef]
- Szymanowska-Gwiżdż, A.; Orlik-Kożdoń, B.; Steidl, T. Selected problems involving the preservation of historical frame buildings in silesia in the context of their future thermo-renewal. ACEE Archit. Civ. Eng. Environ. 2019, 12. [Google Scholar] [CrossRef] [Green Version]
- Orlik-Kożdoń, B.; Steidl, T. Impact of internal insulation on the hygrothermal performance of brick wall. J. Build. Phys. 2017, 41, 120–134. [Google Scholar] [CrossRef]
- Orlik-Kożdoń, B.; Szymanowska-Gwiżdż, A. Impact of envelope structure on the solutions of thermal insulation from the insi de. ACEE Archit. Civ. Eng. Environ. 2018, 11. [Google Scholar] [CrossRef] [Green Version]
- Vereecken, E.; Vanoirbeek, K.; Roels, S. Towards a more thoughtful use of mould prediction models: A critical view on experimental mould growth research. J. Build. Phys. 2015, 39, 102–123. [Google Scholar] [CrossRef]
- Vereecken, E.; Saelens, D.; Roels, S. A comparison of different mould prediction models. In Proceedings of the Building Simulation 2011: 12th Conference of International Building Performance Simulation Association, Sydney, Australia, 14–16 November 2011. [Google Scholar]
- Vereecken, E.; Roels, S. Review of mould prediction models and their influence on mould risk evaluation. Build. Environ. 2012, 51, 296–310. [Google Scholar] [CrossRef] [Green Version]
- Gradeci, K.; Labonnote, N.; Time, B.; Köhler, J. Mould growth criteria and design avoidance approaches in wood-based materials—A systematic review. Constr. Build. Mater. 2017, 150, 77–88. [Google Scholar] [CrossRef]
- Sedlbauer, K. Prediction of Mould Fungus Formation on the Surface of and Inside Building Components; Fraunhofer Institute: Stuttgart, Germany, 2001. [Google Scholar]
- ISO 13788:2012. Hygrothermal Performance of building components and building elements—Internal surface temperature to avoid critical surface humidity and interstitial condensation—Calculation methods. EN ISO 2019, 46. [Google Scholar]
- Johansson, S.; Wadsö, L.; Sandin, K. Estimation of mould growth levels on rendered façades based on surface relative humidity and surface temperature measurements. Build. Environ. 2010, 45, 1153–1160. [Google Scholar] [CrossRef] [Green Version]
- Adan, O. On the Fungal Defacement of Interior Finishes. Ph.D. Thesis, University of Technology, Eindhoven, The Netherlands, 1994. [Google Scholar]
- Hukka, A.; Viitanen, H.A. A mathematical model of mould growth on wooden material. Wood Sci. Technol. 1999, 33, 475–485. [Google Scholar] [CrossRef]
- Ayerst, G. The effects of moisture and temperature on growth and spore germination in some fungi. J. Stored Prod. Res. 1969, 5, 127–141. [Google Scholar] [CrossRef]
- Smith, S.L.; Hill, S. Influence of temperature and water activity on germination and growth of Aspergillus restrictus and A. versicolor. Trans. Br. Mycol. Soc. 1982, 79, 558–560. [Google Scholar] [CrossRef]
- Clarke, J.; Johnstone, C.; Kelly, N.J.; McLean, R.; Anderson, J.; Rowan, N.J.; Smith, J. A technique for the prediction of the conditions leading to mould growth in buildings. Build. Environ. 1999, 34, 515–521. [Google Scholar] [CrossRef]
- Hens, H.L.S.C. Fungal Defacement in Buildings: A Performance Related Approach. HVAC&R Res. 1999, 5, 265–280. [Google Scholar]
- WUFI. PC-Program for Calculating the Coupled Heat and Moisture Transfer in Building Components Fraunhofer Institute for Building Physics. Available online: www.wufi-pro.com (accessed on 26 August 2020).
- Senkpiel, K.; Ohgke, H. Beurteilung der “Schimmelpilz”-Sporen- konzentration in der Innenraumluft und ihre gesundheitlichen Auswirkungen. Festleg. eines Erfahr. Gesundh. 1992, 113, 42–45. [Google Scholar]
- Schwantes, H.O. Biologie der Pilze; Eugen Ulmer-Verlag: Stuttgart, Germany, 1996. [Google Scholar]
- Grant, C.; Hunter, C.; Flannigan, B.; Bravery, A. The moisture requirements of moulds isolated from domestic dwellings. Int. Biodeterior. 1989, 25, 259–284. [Google Scholar] [CrossRef]
- Hunter, C.; Grant, C.; Flannigan, B.; Bravery, A. Mould in buildings: The air spora of domestic dwellings. Int. Biodeterior. 1988, 24, 81–101. [Google Scholar] [CrossRef]
- Block, S.S. Humidity Requirements for Mold Growth. Appl. Microbiol. 1953, 1, 287–293. [Google Scholar] [CrossRef] [Green Version]
- Coppock, J.B.M.; Cookson, E.D. The effect of humidity on mould growth on constructional materials. J. Sci. Food Agric. 1951, 2, 534–537. [Google Scholar] [CrossRef]
- Pasanen, A.-L.; Juutinen, T.; Jantunen, M.; Kalliokoski, P. Occurrence and moisture requirements of microbial growth in building materials. Int. Biodeterior. Biodegrad. 1992, 30, 273–283. [Google Scholar] [CrossRef]
- Gobakken, L.R.; Høibø, O.A.; Solheim, H. Factors influencing surface mould growth on wooden claddings exposed outdoors. Wood Mater. Sci. Eng. 2010, 5, 1–12. [Google Scholar] [CrossRef]
- Reiß, J.; Erhorn, H. Instationäre Bauphysikalische Randbedingungen zum Einsetzen des Schimmelpilzwachstums auf Bauteiloberflächen; IBP-Bericht WB 78/1994 des Fraunhofer-Instituts für Bauphysik: Stuttgart, Germany, 1994. [Google Scholar]
- Bieberstein, H. Schimmelpilze in Wohnräumen—Was Ist Zu Tun? Alpha & Omega-Verlag: Stuttgart, Germany, 1995. [Google Scholar]
- Ritschkoff, A.C.; Viitanen, H.; Koskela, K. The response of building materials to the mould exposure at different humidity and temperature conditions. In Proceedings of the Healthy Buildings 2000, Espoo, Finland, 6–10 August 2000; pp. 317–322. [Google Scholar]
- Gertis, K.; Erhorn, H.; Reiß, J. Klimawirkungen und Schimmelpilzbildung Bei Sanierten Gebäuden. In Proceedings of Bauphysik Kongreß; DFG-Forschungsschwerpunkt: Berlin, Germany, 1999; pp. 241–253. Available online: http://publica.fraunhofer.de/dokumente/PX-20556.html (accessed on 26 August 2020).
- Verdier, T.; Coutand, M.; Bertron, A.; Roques, C. A review of indoor microbial growth across building materials and sampling and analysis methods. Build. Environ. 2014, 80, 136–149. [Google Scholar] [CrossRef] [Green Version]
- Zöld, A. Mindestluftwechsel im praktischen Test. HLH—Heiz. Lüftung Haustech. 1990, 41, 620–622. [Google Scholar]
- Cziesielski, E.; Schimmelpilz—Ein komplexes Thema. Wo liegen die Fehler? Wksb—Zeit-schrift für Wärmeschutz—Kälteschutz—Schallschutz—Brandschutz 44 (1999), H. 43, S. 25–28. Available online: http://scholar.google.com/scholar_lookup?title=Schimmelpilz%20%E2%80%93%20ein%20komplexes%20Thema.%20Wo%20liegen%20die%20Fehler%3F&author=E..%20Cziesielski&journal=wksb%20%E2%80%93%20Zeitschrift%20f%C3%BCr%20W%C3%A4rmeschutz%20%E2%80%93%20K%C3%A4lteschutz%20%E2%80%93%20Schallschutz%20%E2%80%93%20Brandschutz&volume=44&issue=43&pages=25-28&publication_year=1999 (accessed on 26 August 2020).
- Richter, W. Verhinderung der Schimmelpilzbildung—Welche Möglichkeiten bietet die Fensterlüftung. Vortr. -Manuskr. Rosenh. Fenstertage 1999, 14, 15. [Google Scholar]
- Deacon, J.W. Modern Mycology, 3rd ed.; Wiley: Hoboken, NJ, USA, 1997. [Google Scholar]
- Goesten, A.J.P.M. Hygrothermal Simulation Model: Damage as a Result of Insulating Historical Buildings. Master’s Thesis, Technische Universiteit Eindhoven, Eindhoven, The Netherlands, 2016. [Google Scholar]
- EN 15026-2007. Hygrothermal Performance of Building Components and Building Elements. Assessment of Moisture Transfer by Numerical Simulation. Available online: https://shop.bsigroup.com/ProductDetail?pid=000000000030124008 (accessed on 26 August 2020).
- Krus, M.; Sedlbauer, K.; Seidler, C.M. Übertragung des Mould-Indexes auf das biohygrothermische Modell zur Schimmelpilzvorhersage. GI-Gesundh. Ing. 2011, 132, 32. [Google Scholar]


© 2020 by the author. Licensee MDPI, Basel, Switzerland. This article is an open access article distributed under the terms and conditions of the Creative Commons Attribution (CC BY) license (http://creativecommons.org/licenses/by/4.0/).