Feasibility Study on Strain-Based Seismic Design Criteria for Nuclear Components

Abstract
1. Introduction
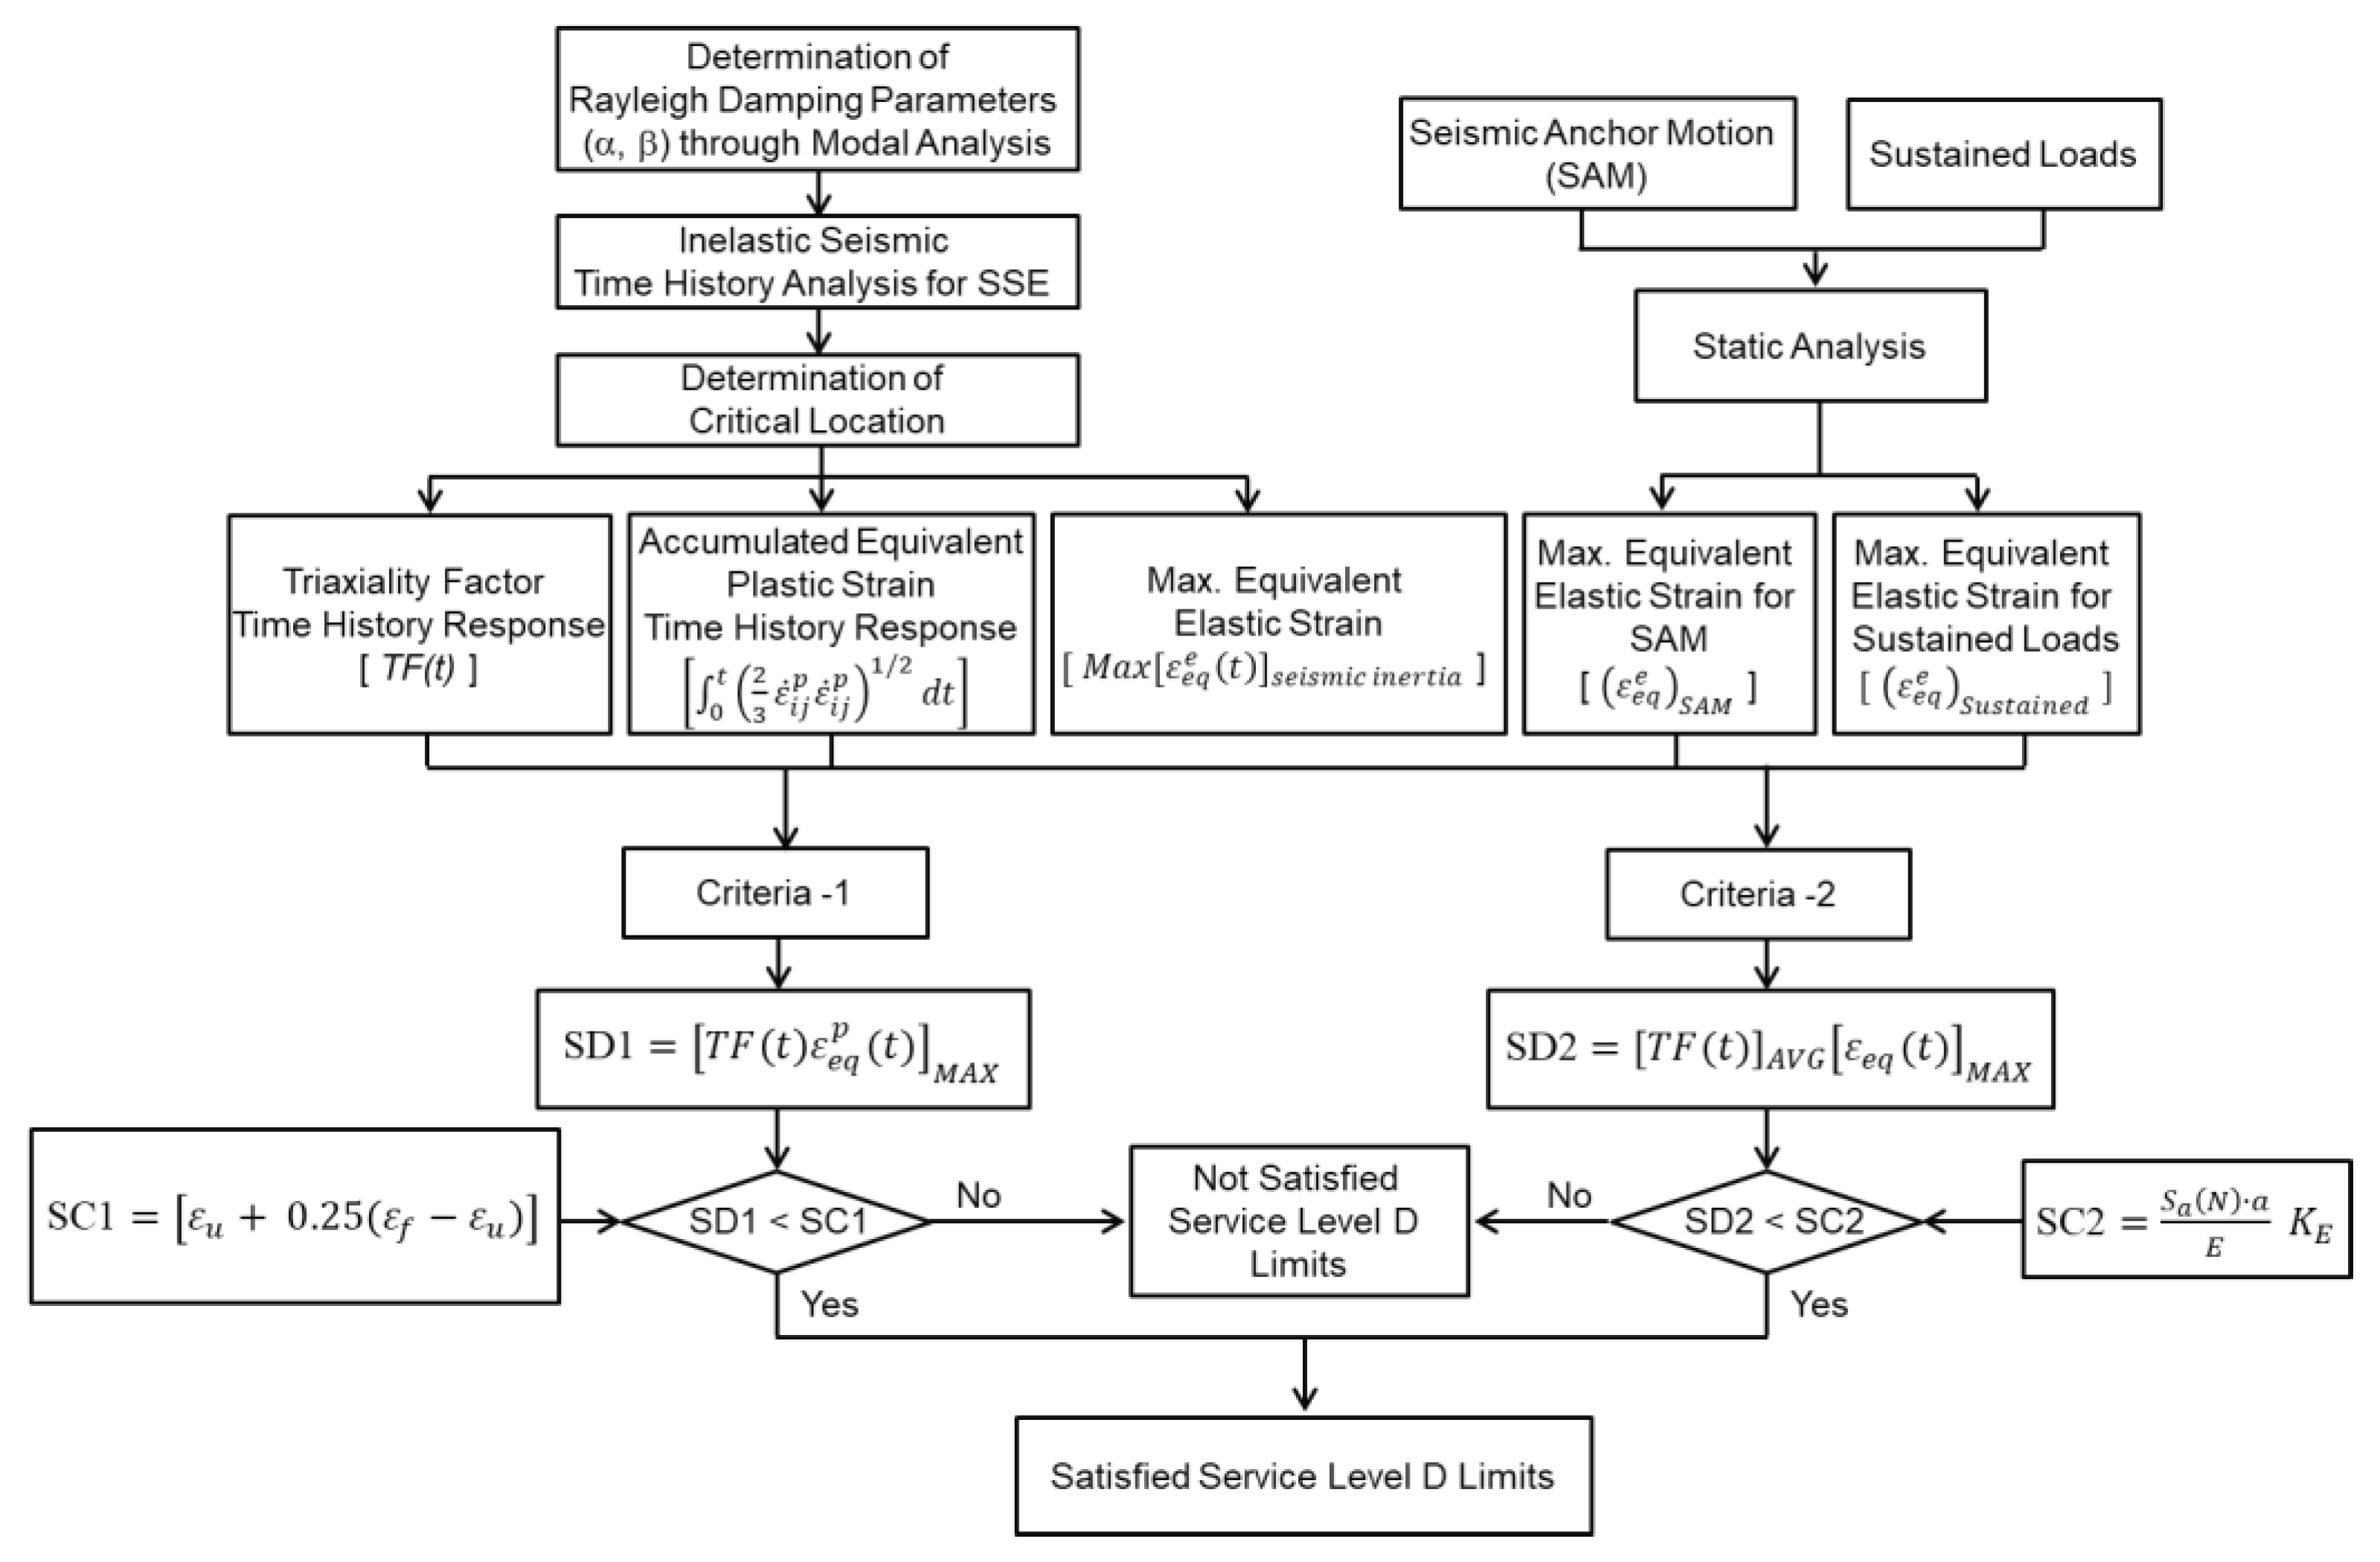
2. Strain-Based Acceptance Criteria
2.1. Acceptance Criteria-1: Ductile Fracture Failure
2.2. Acceptance Criteria-2: Fatigue-Induced Failure
2.3. Triaxiality Factor
3. Examples of Application
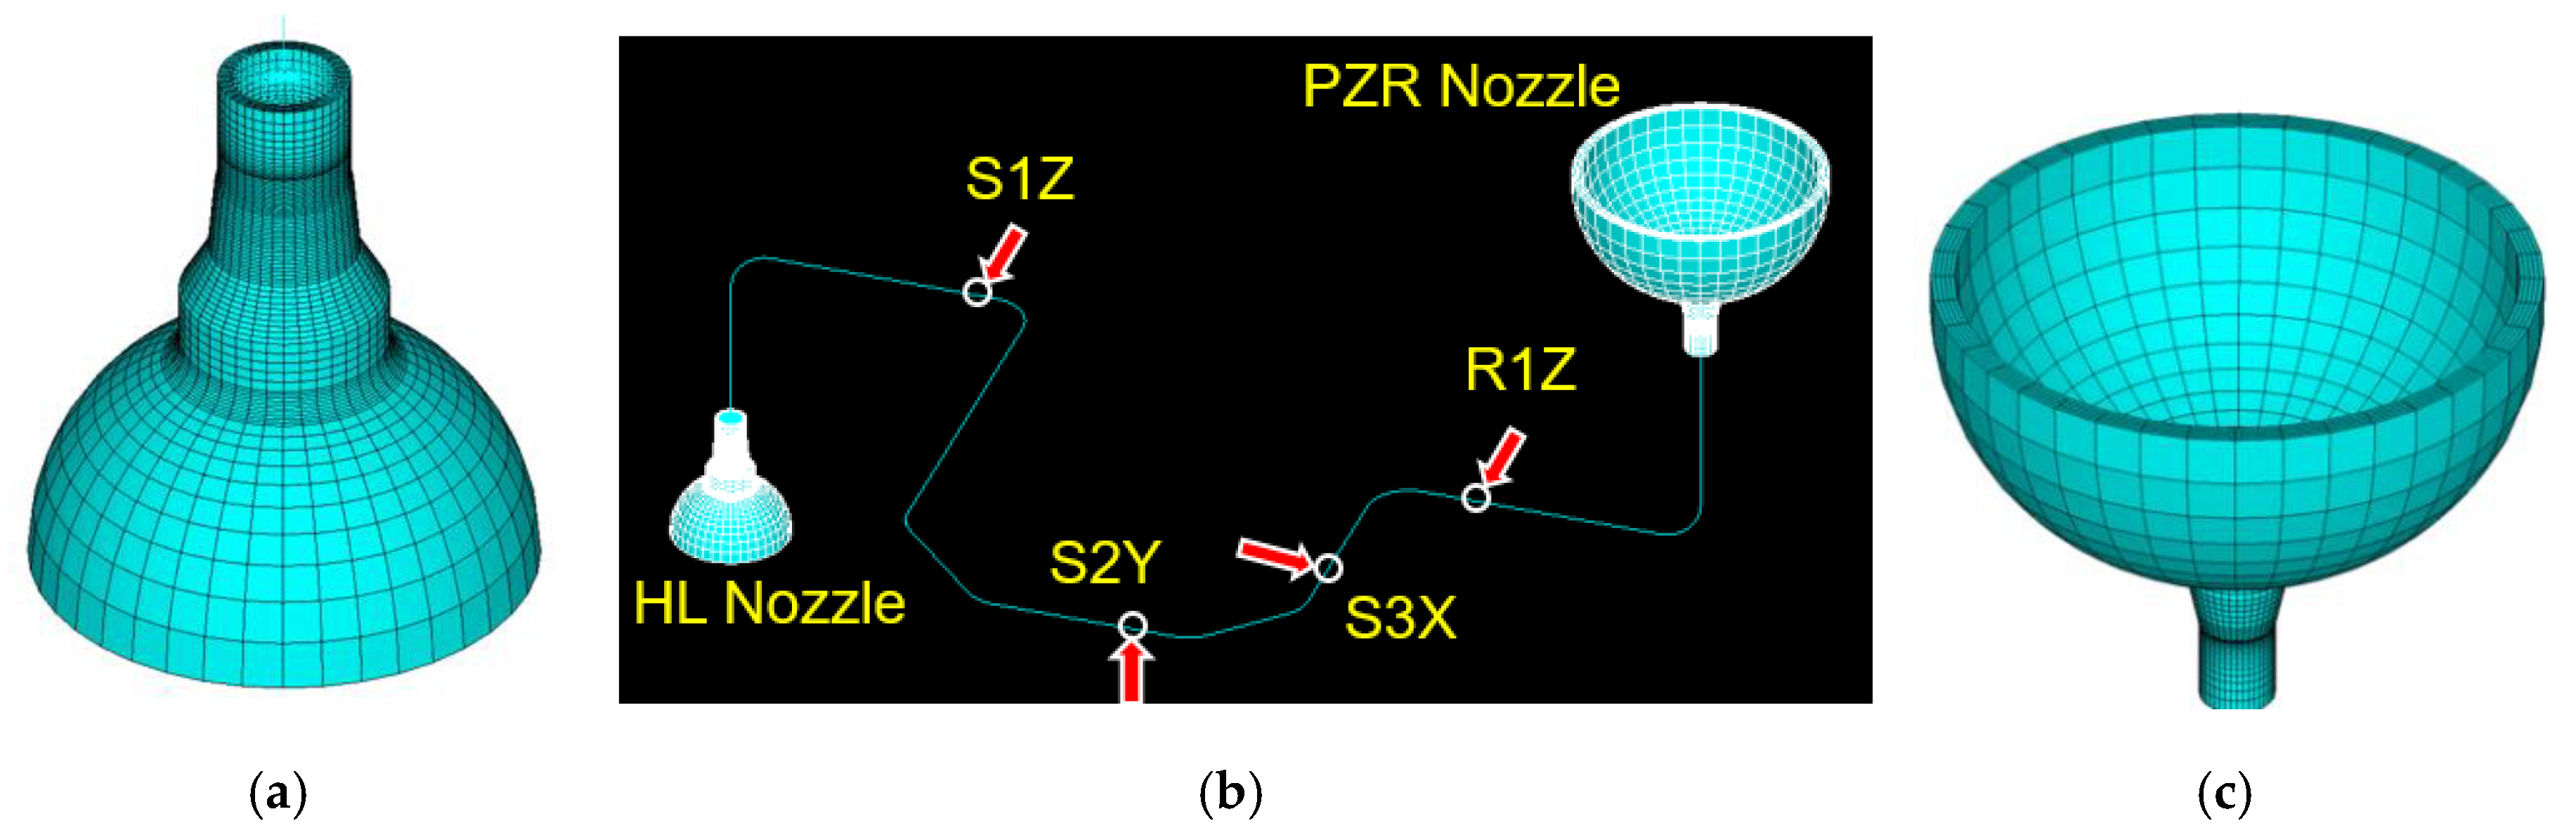
3.1. Description of Example Problem
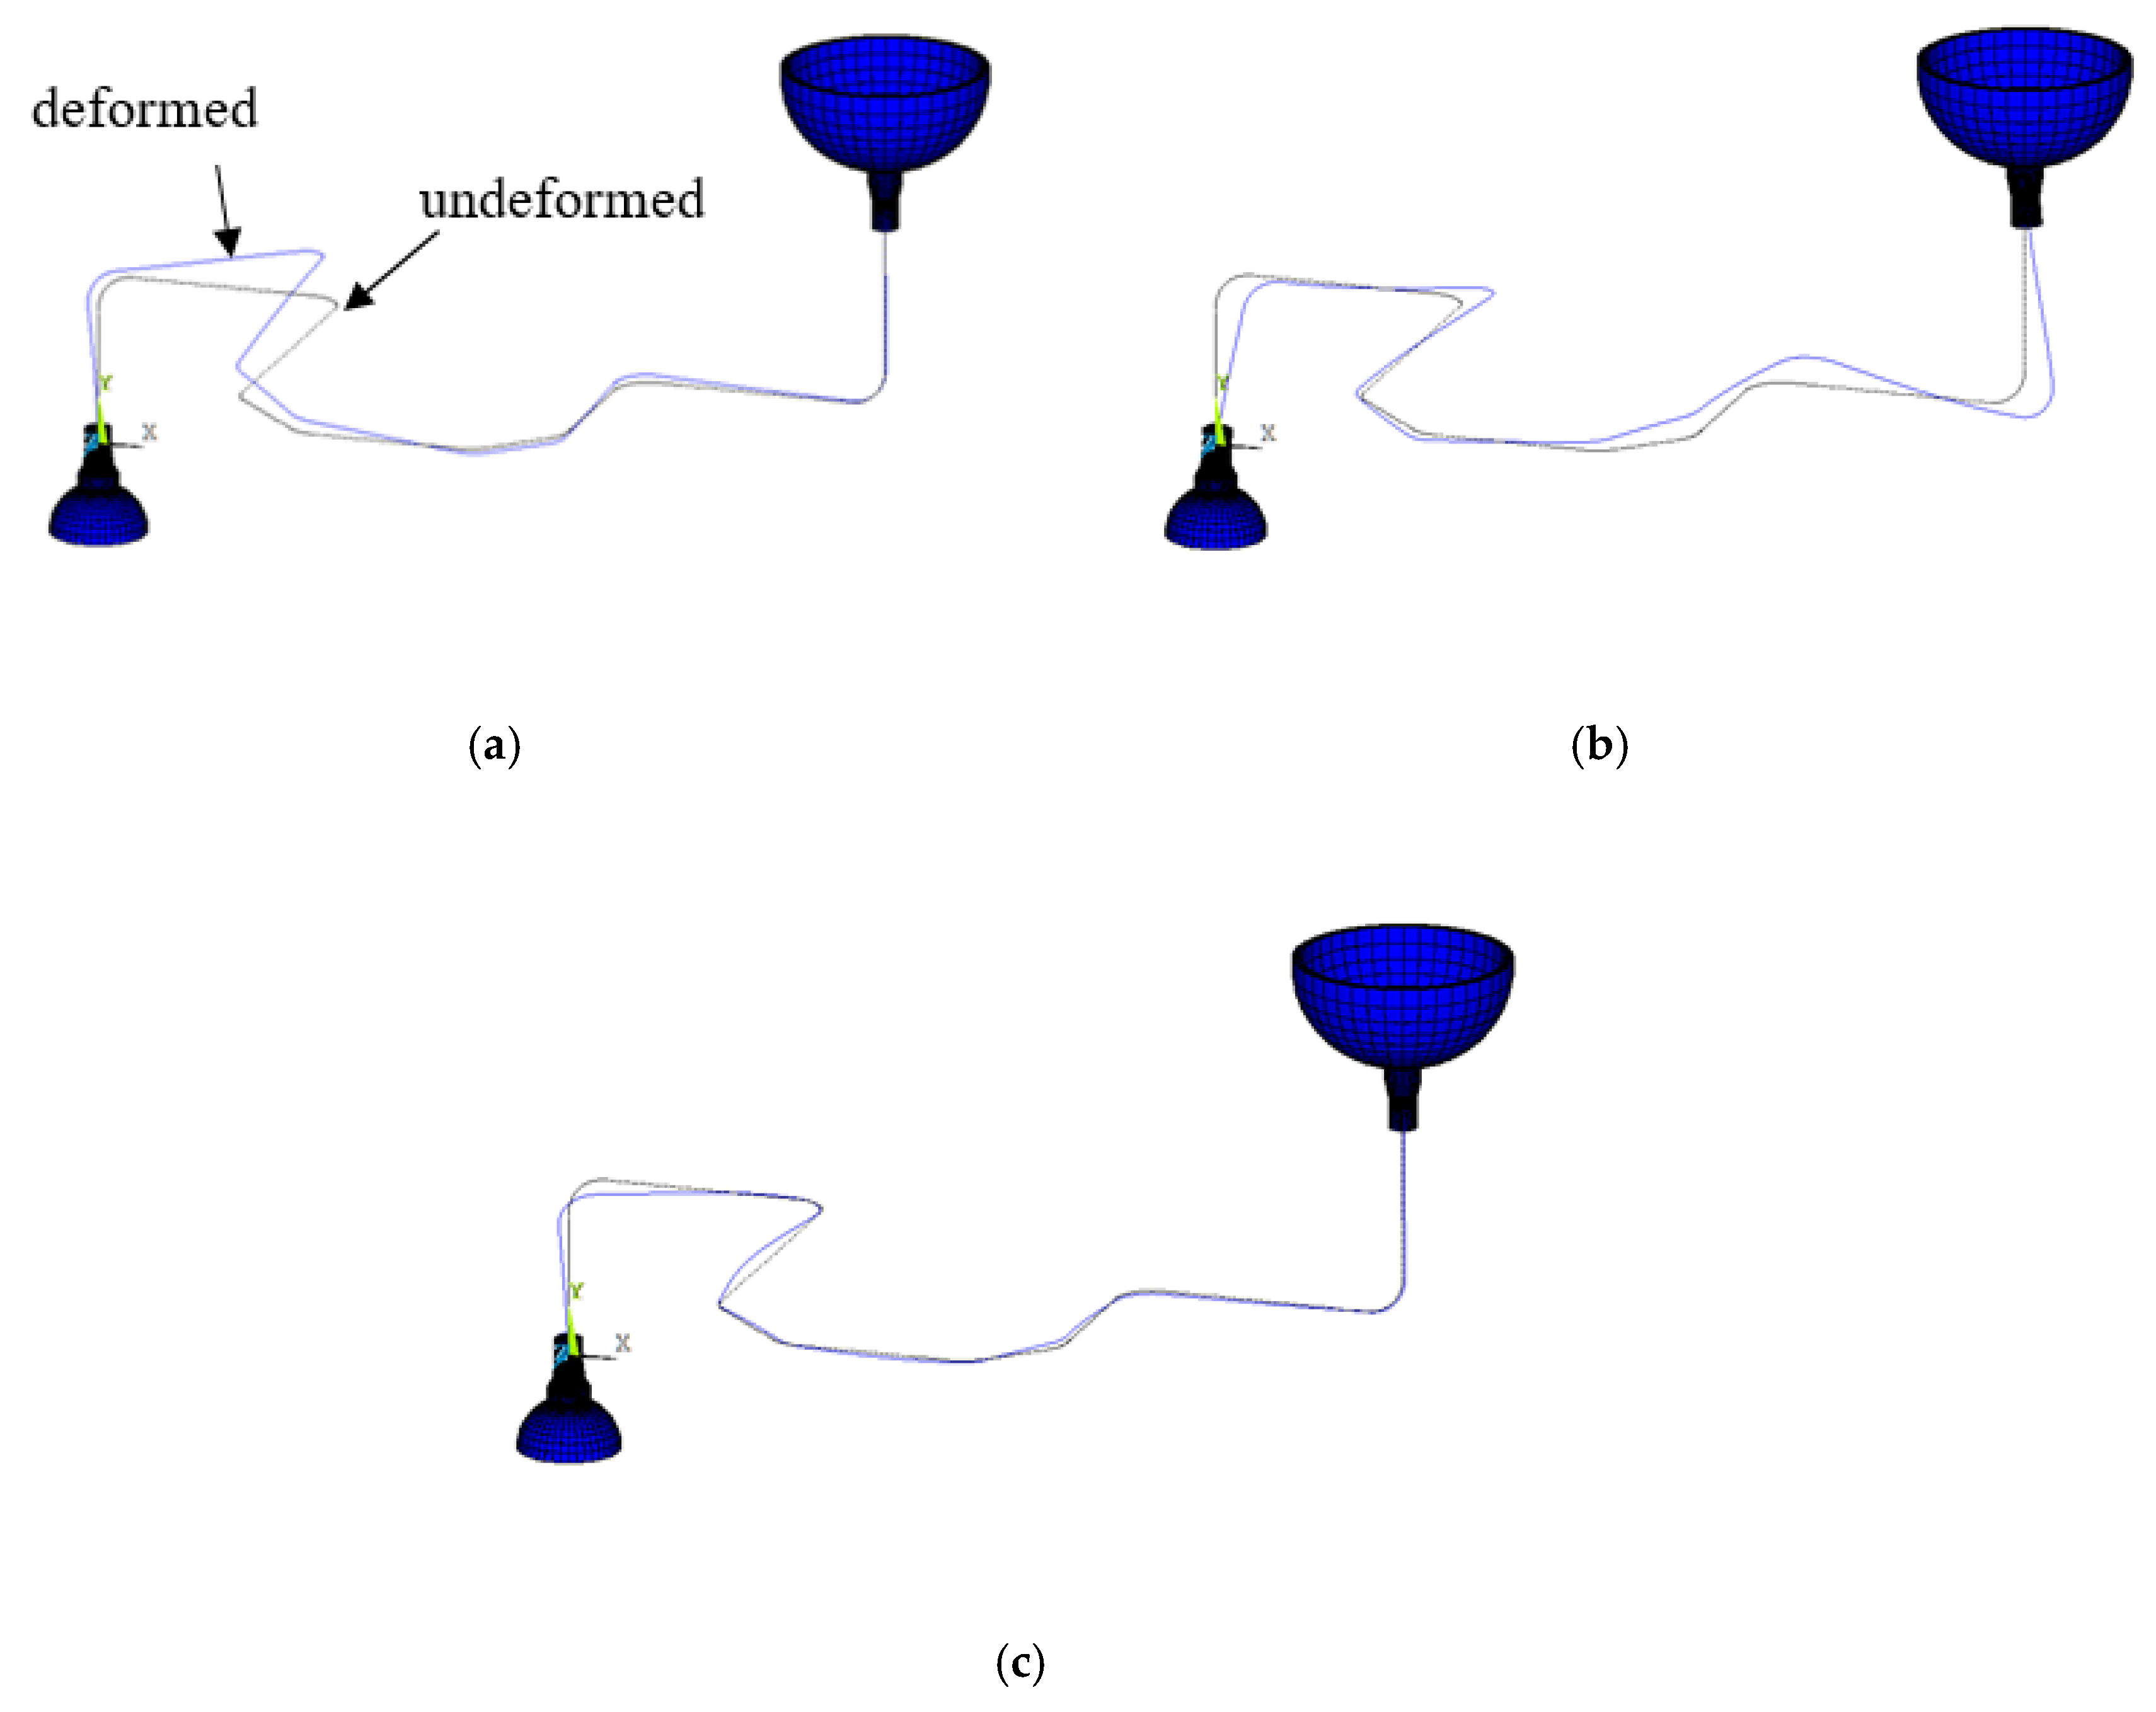
3.1.1. Coupled Finite Element Model and Boundary Conditions
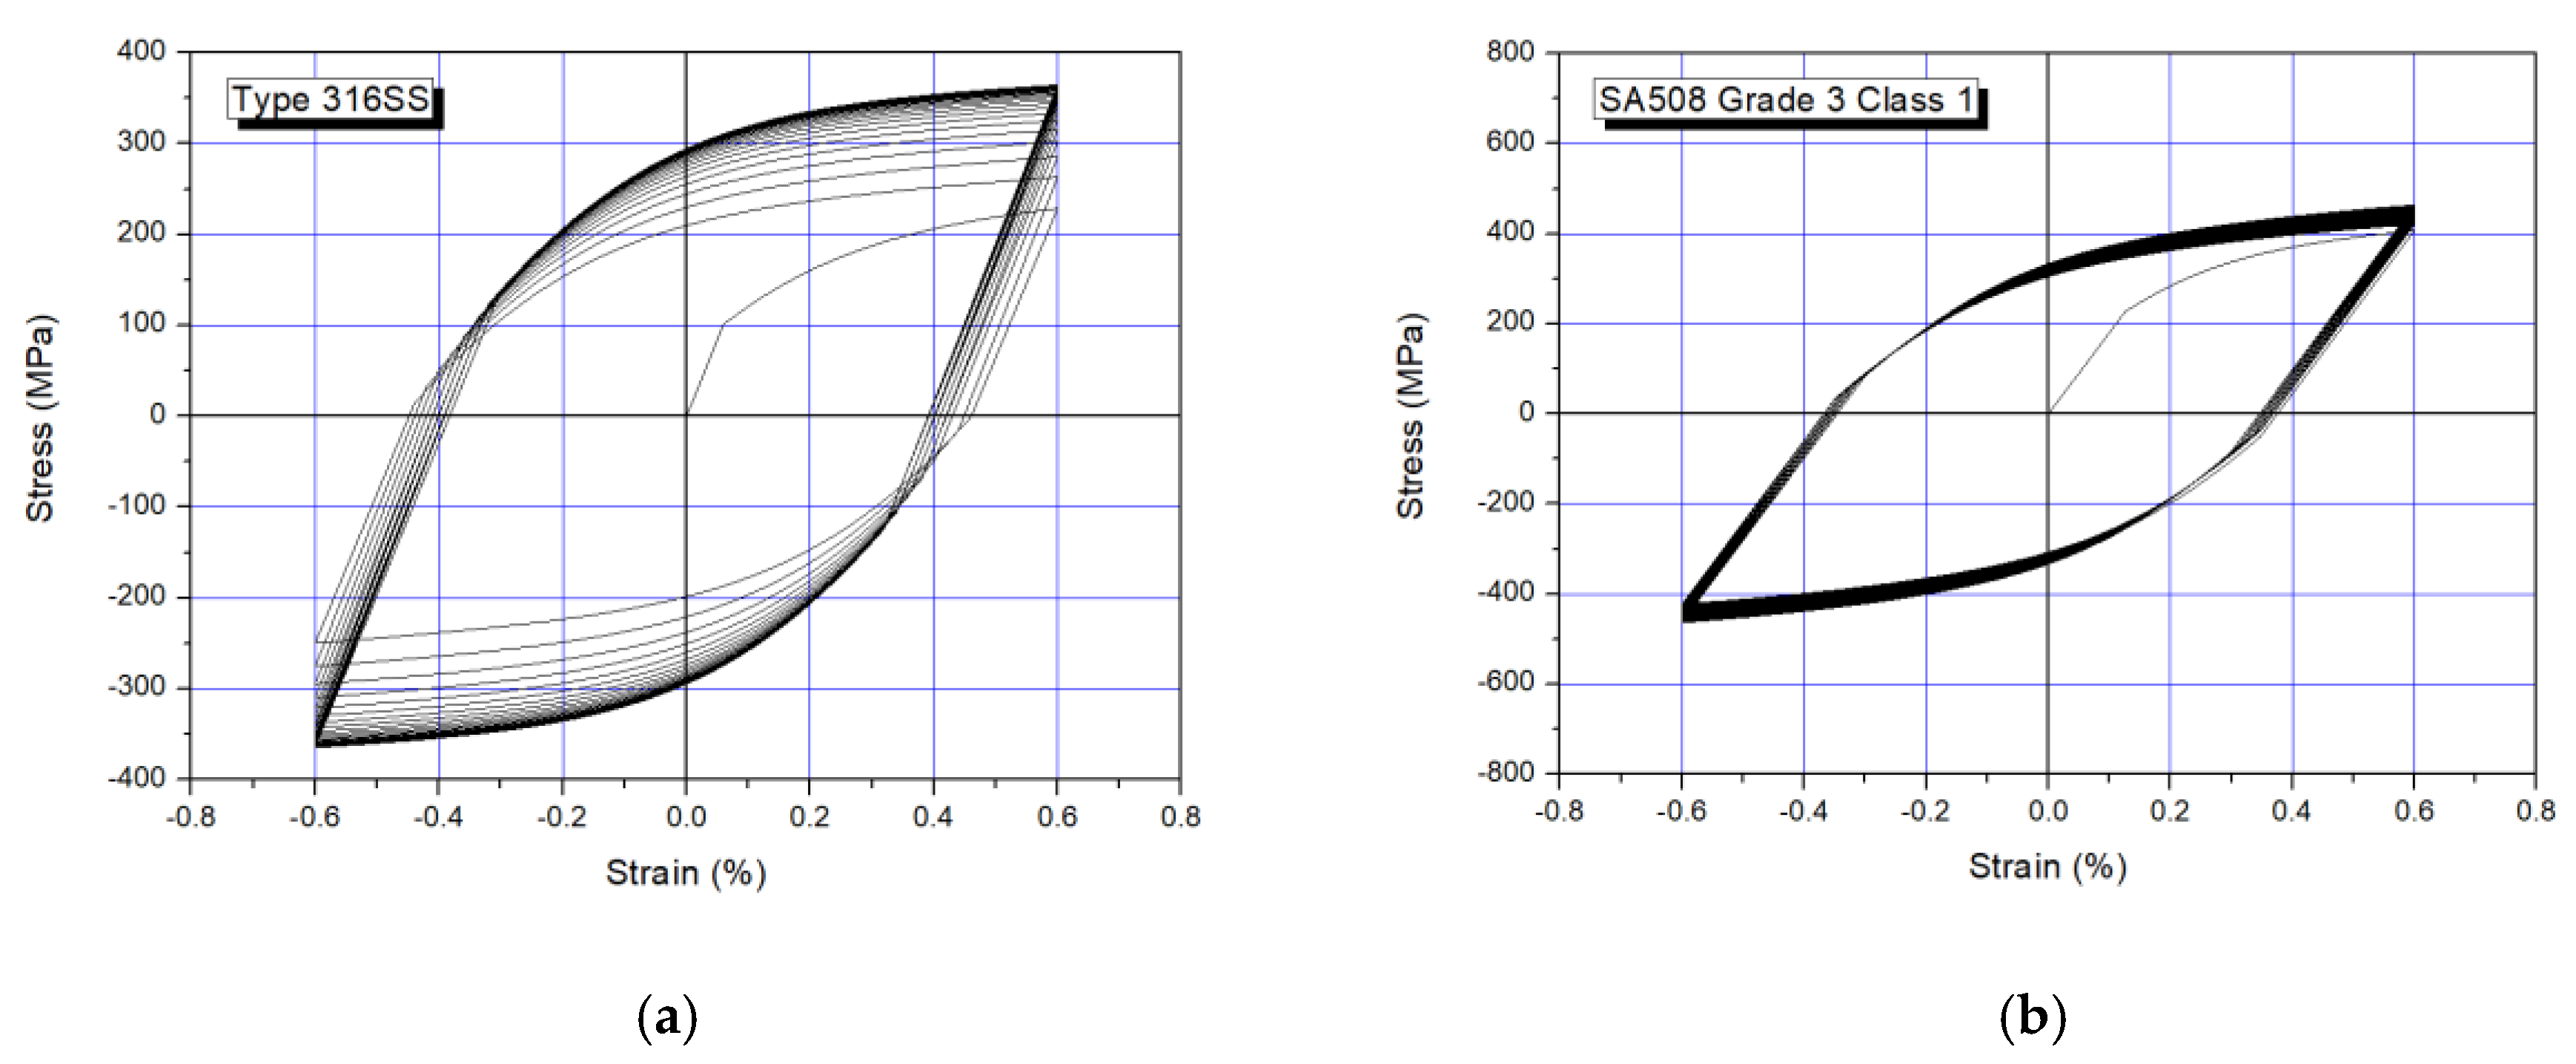
3.1.2. Material Properties
3.1.3. Inelastic Material Models
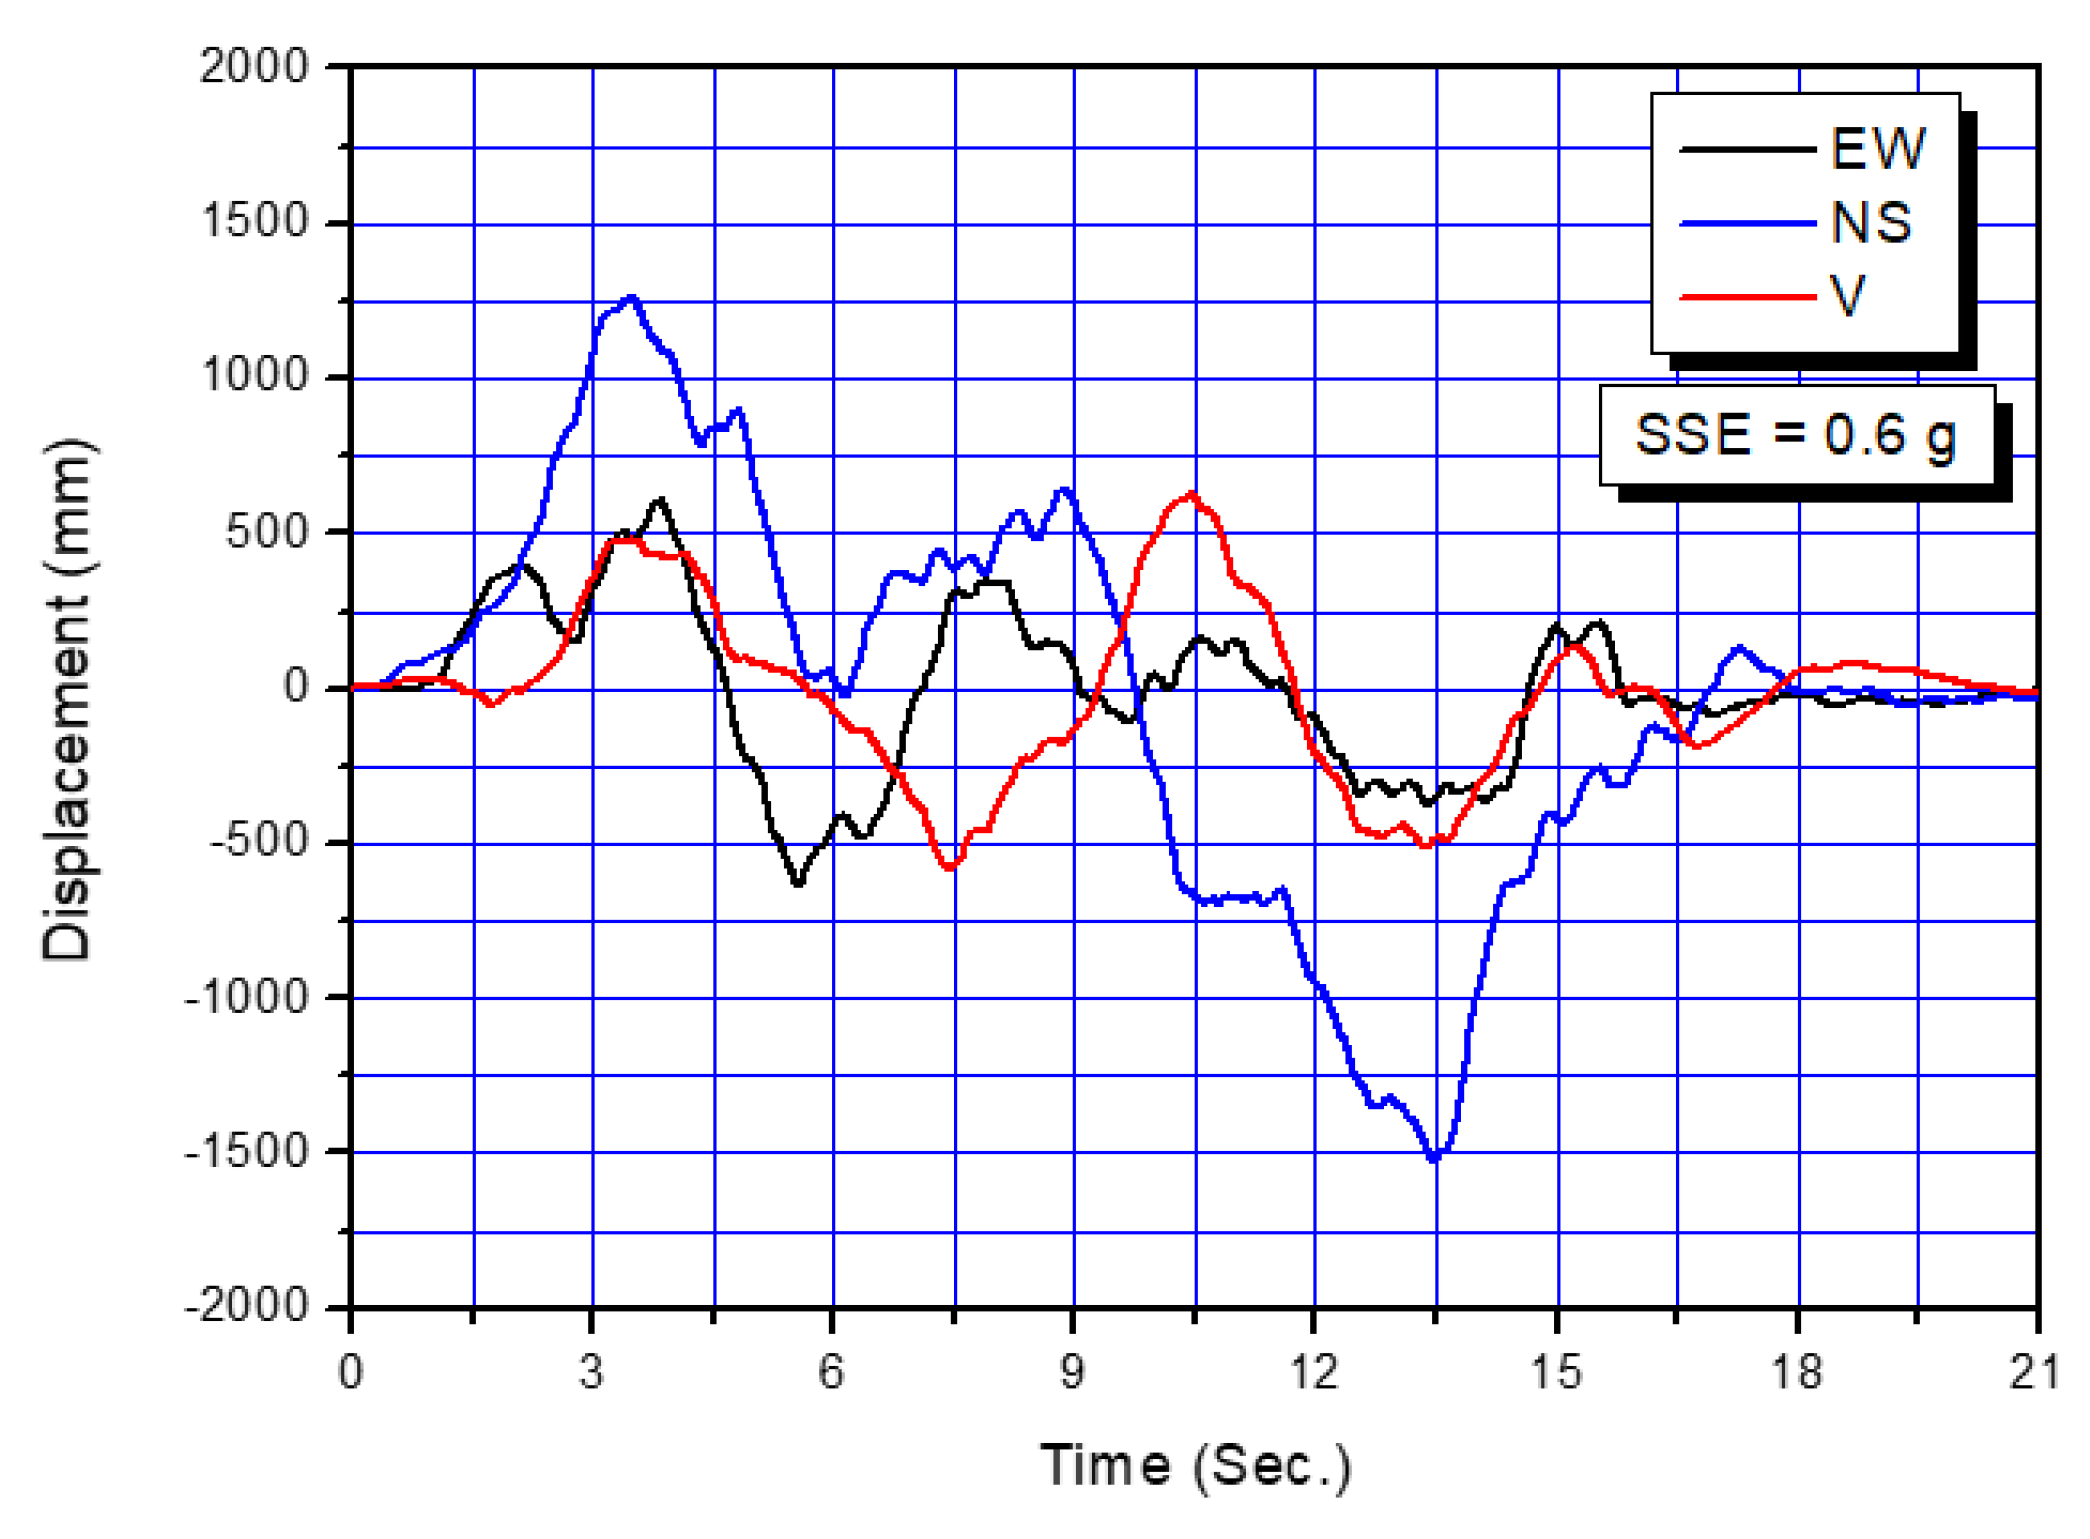
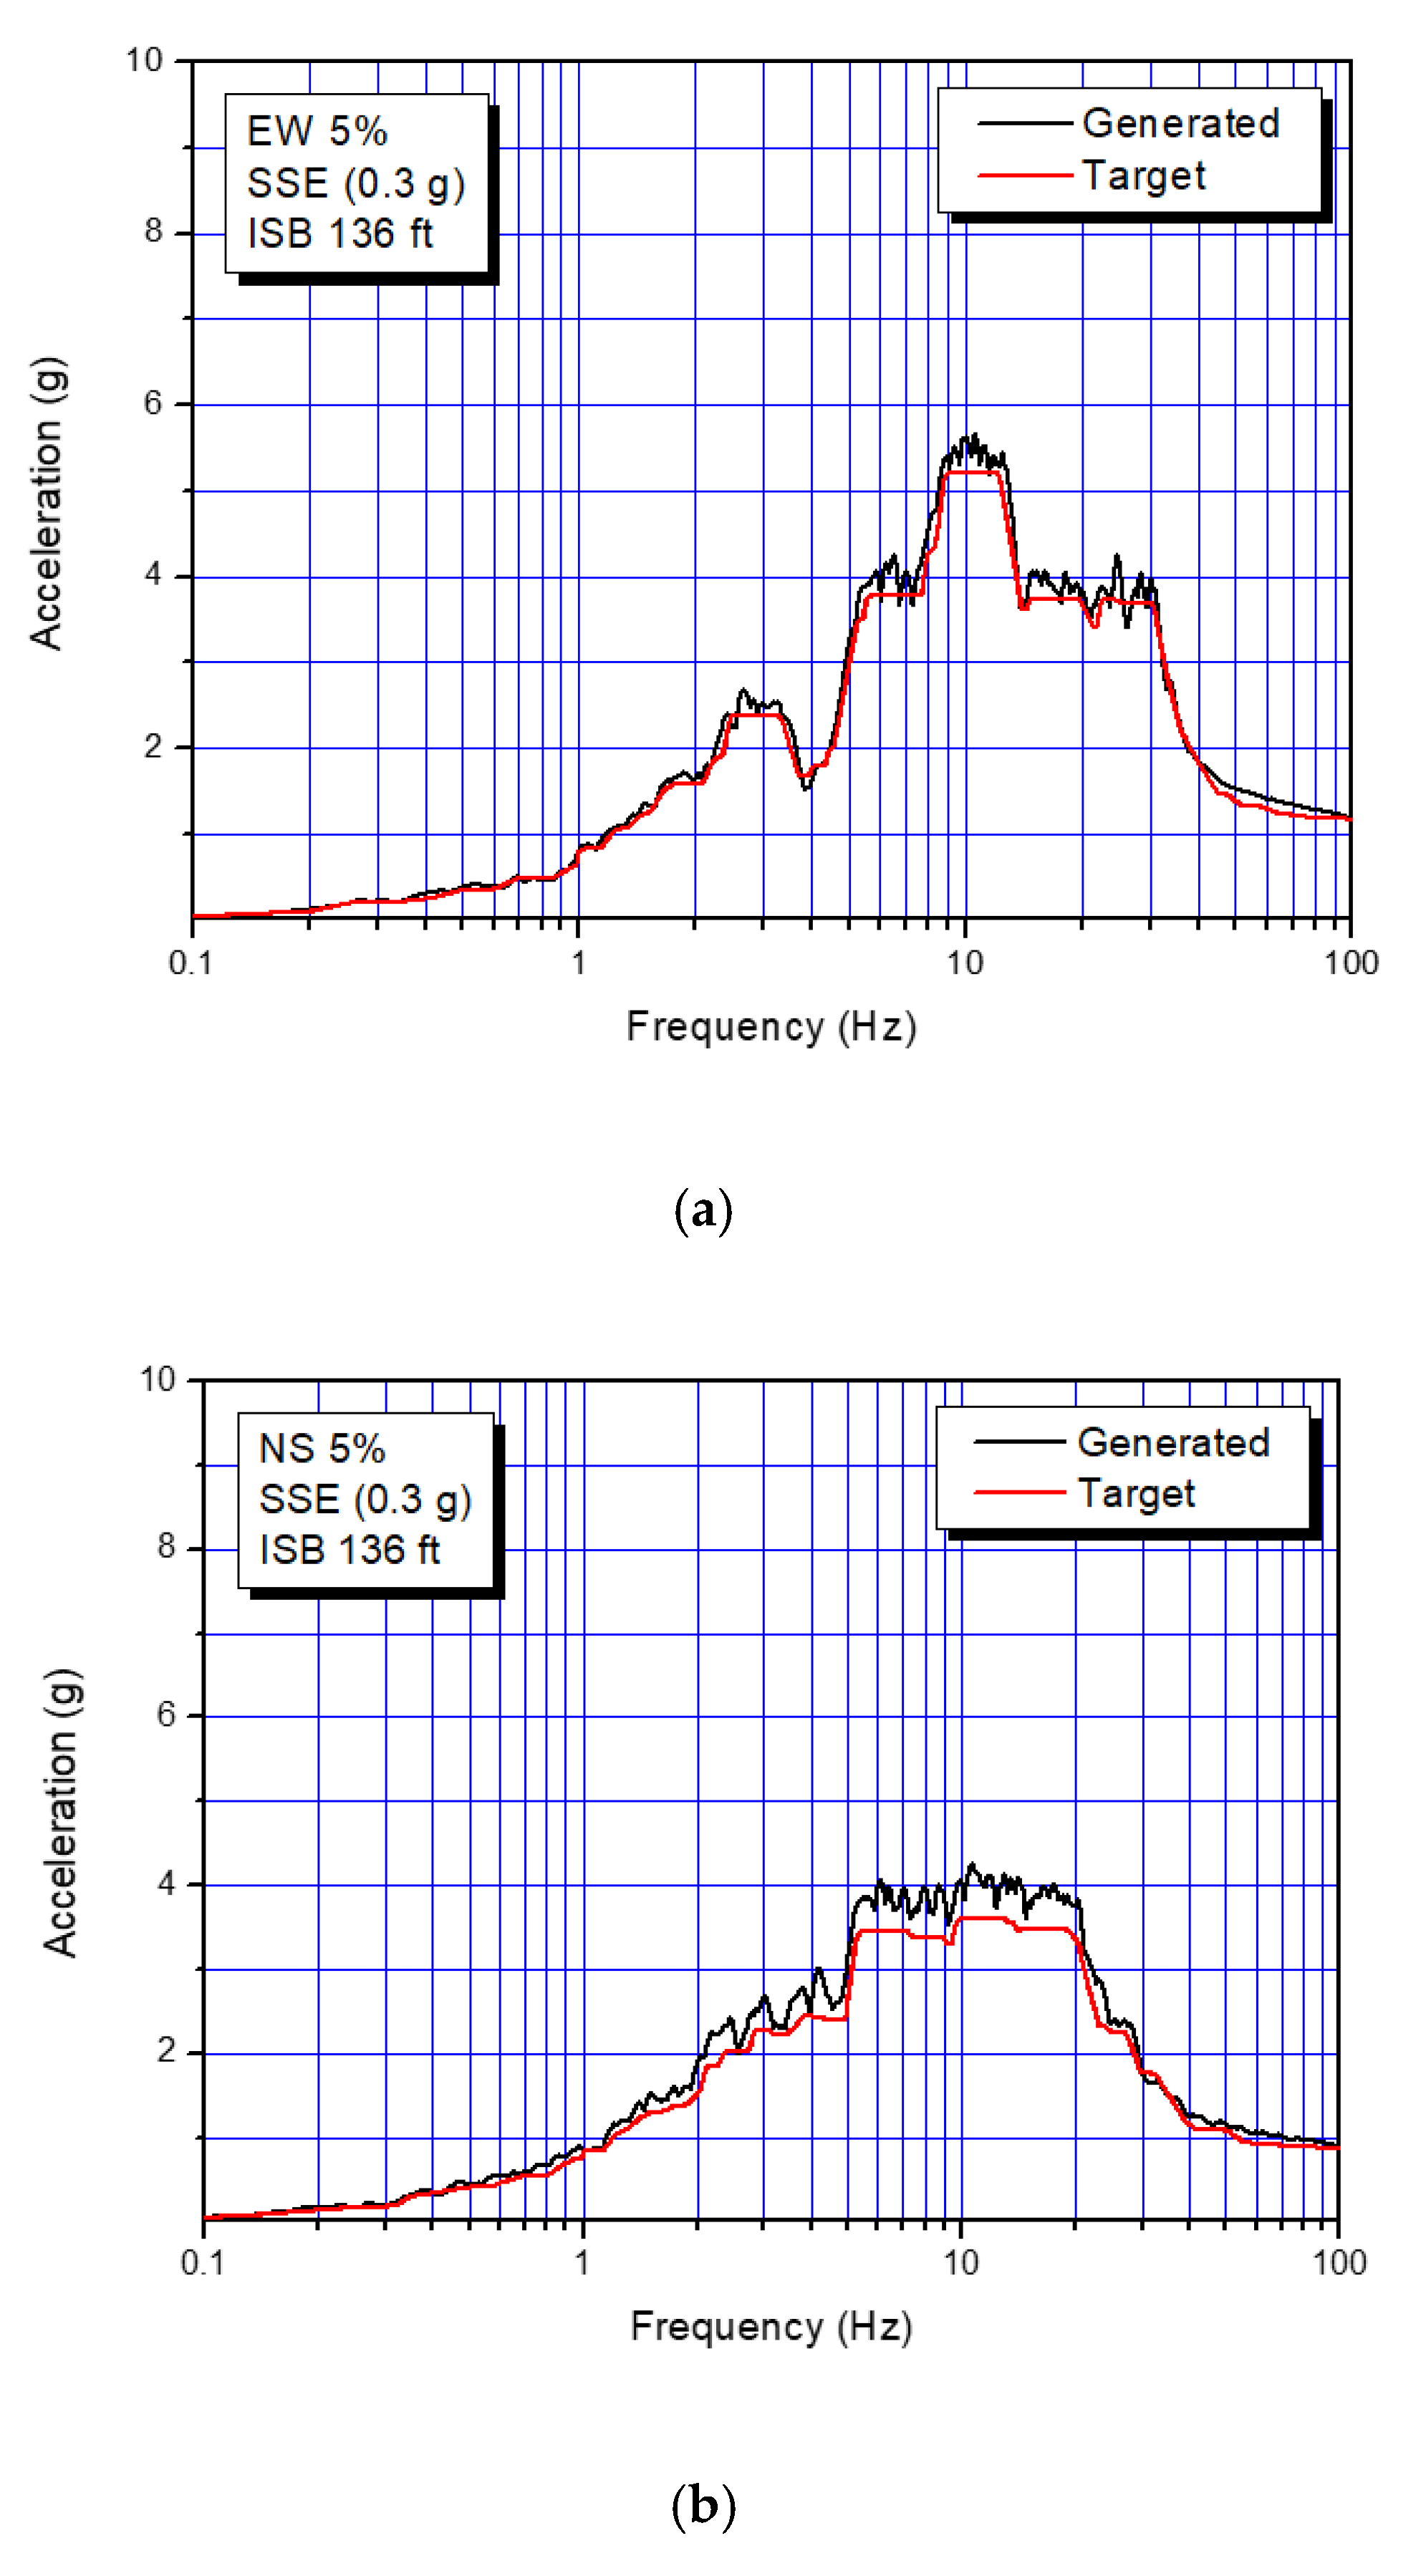
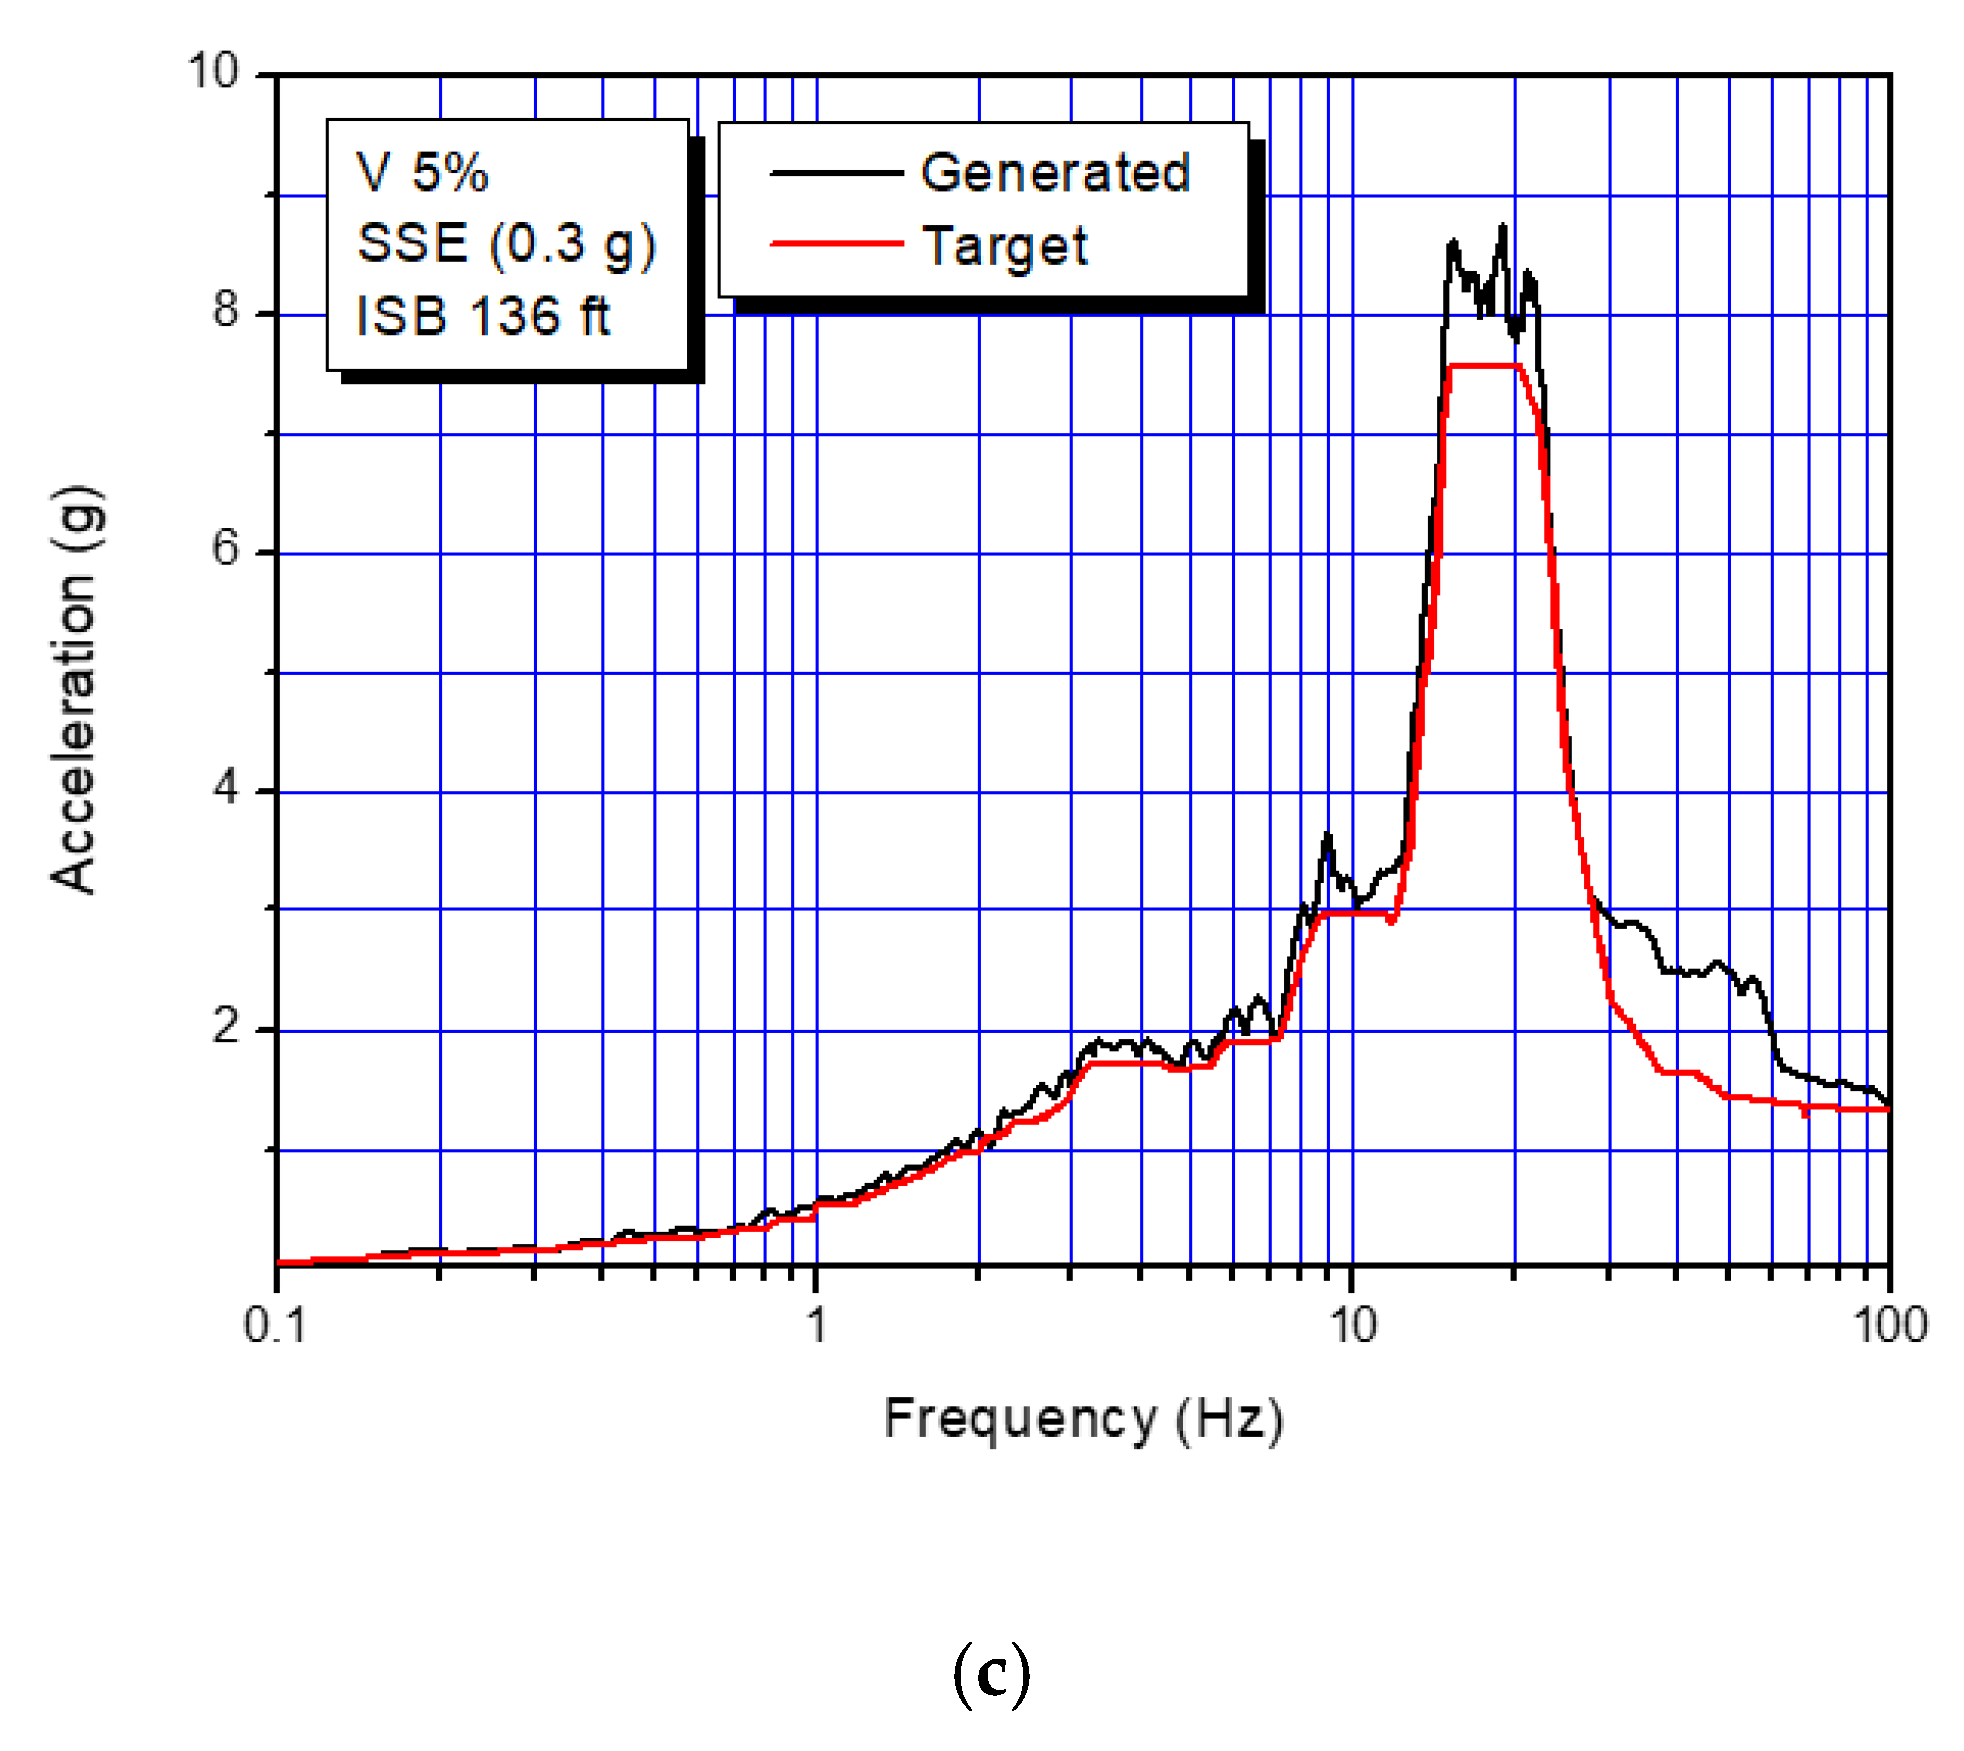
3.1.4. Seismic Input Motions
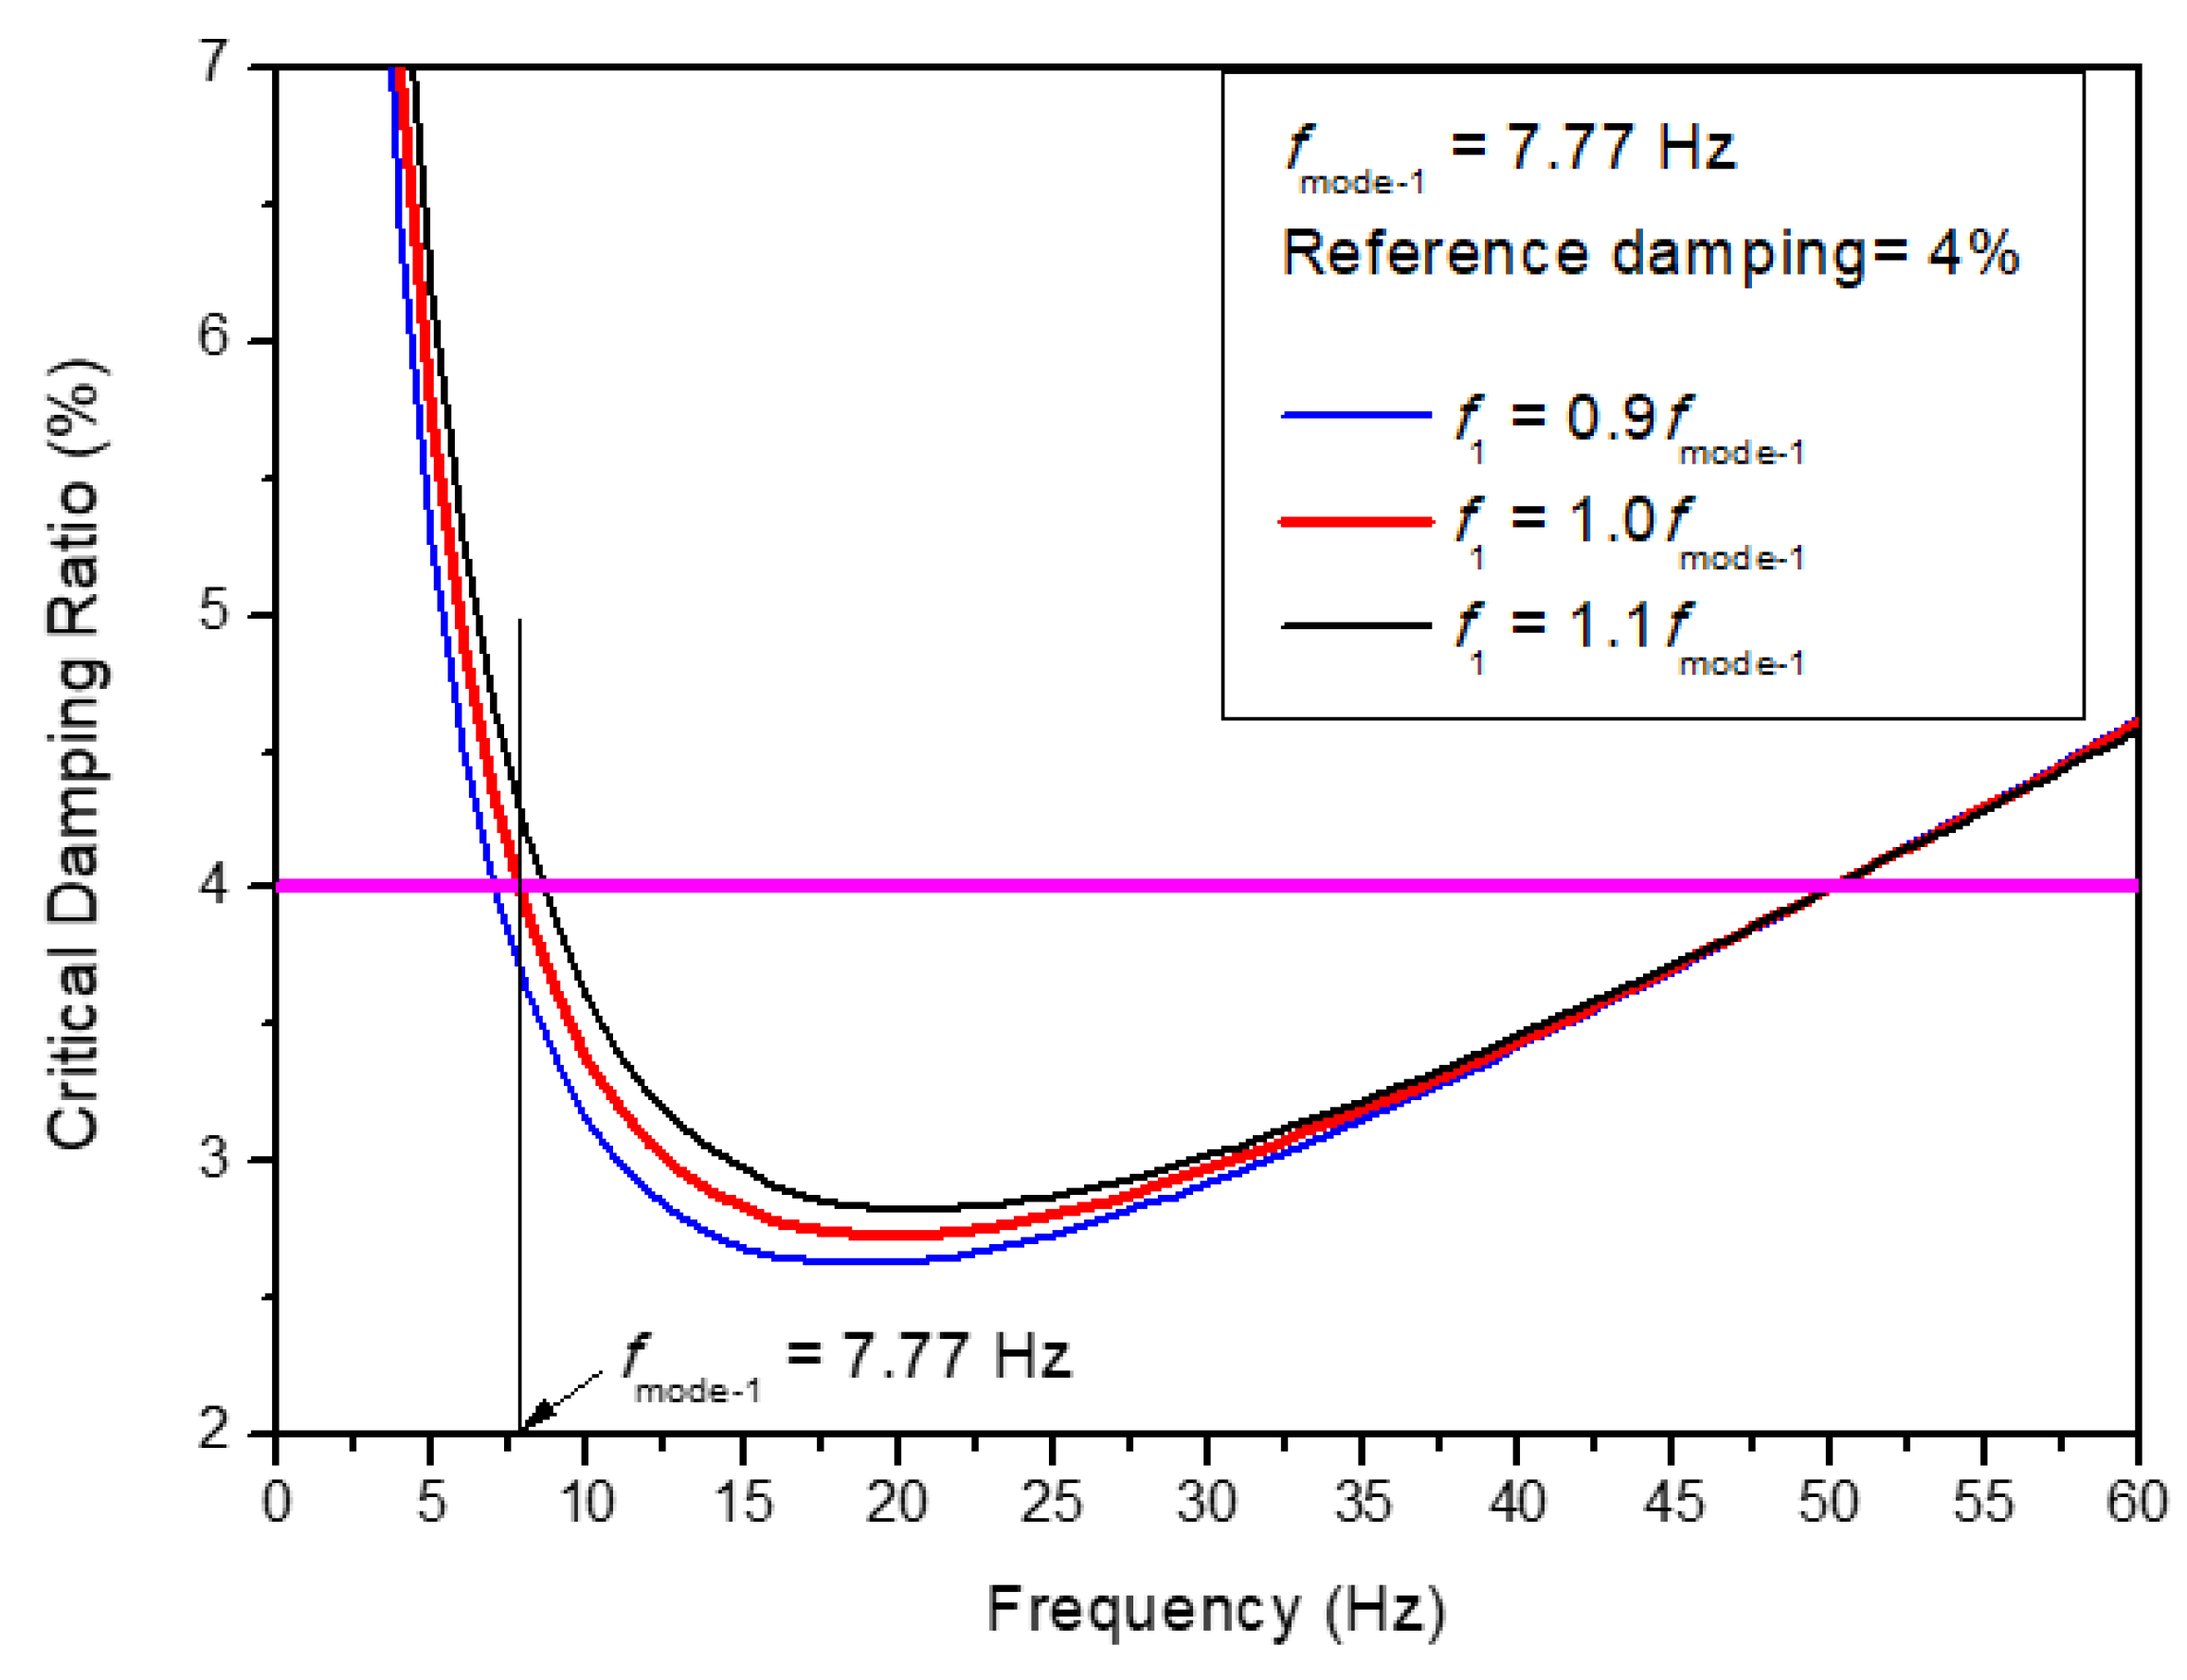
3.1.5. Modal Analysis and Damping
3.2. Strain-Based Acceptance Criteria-1
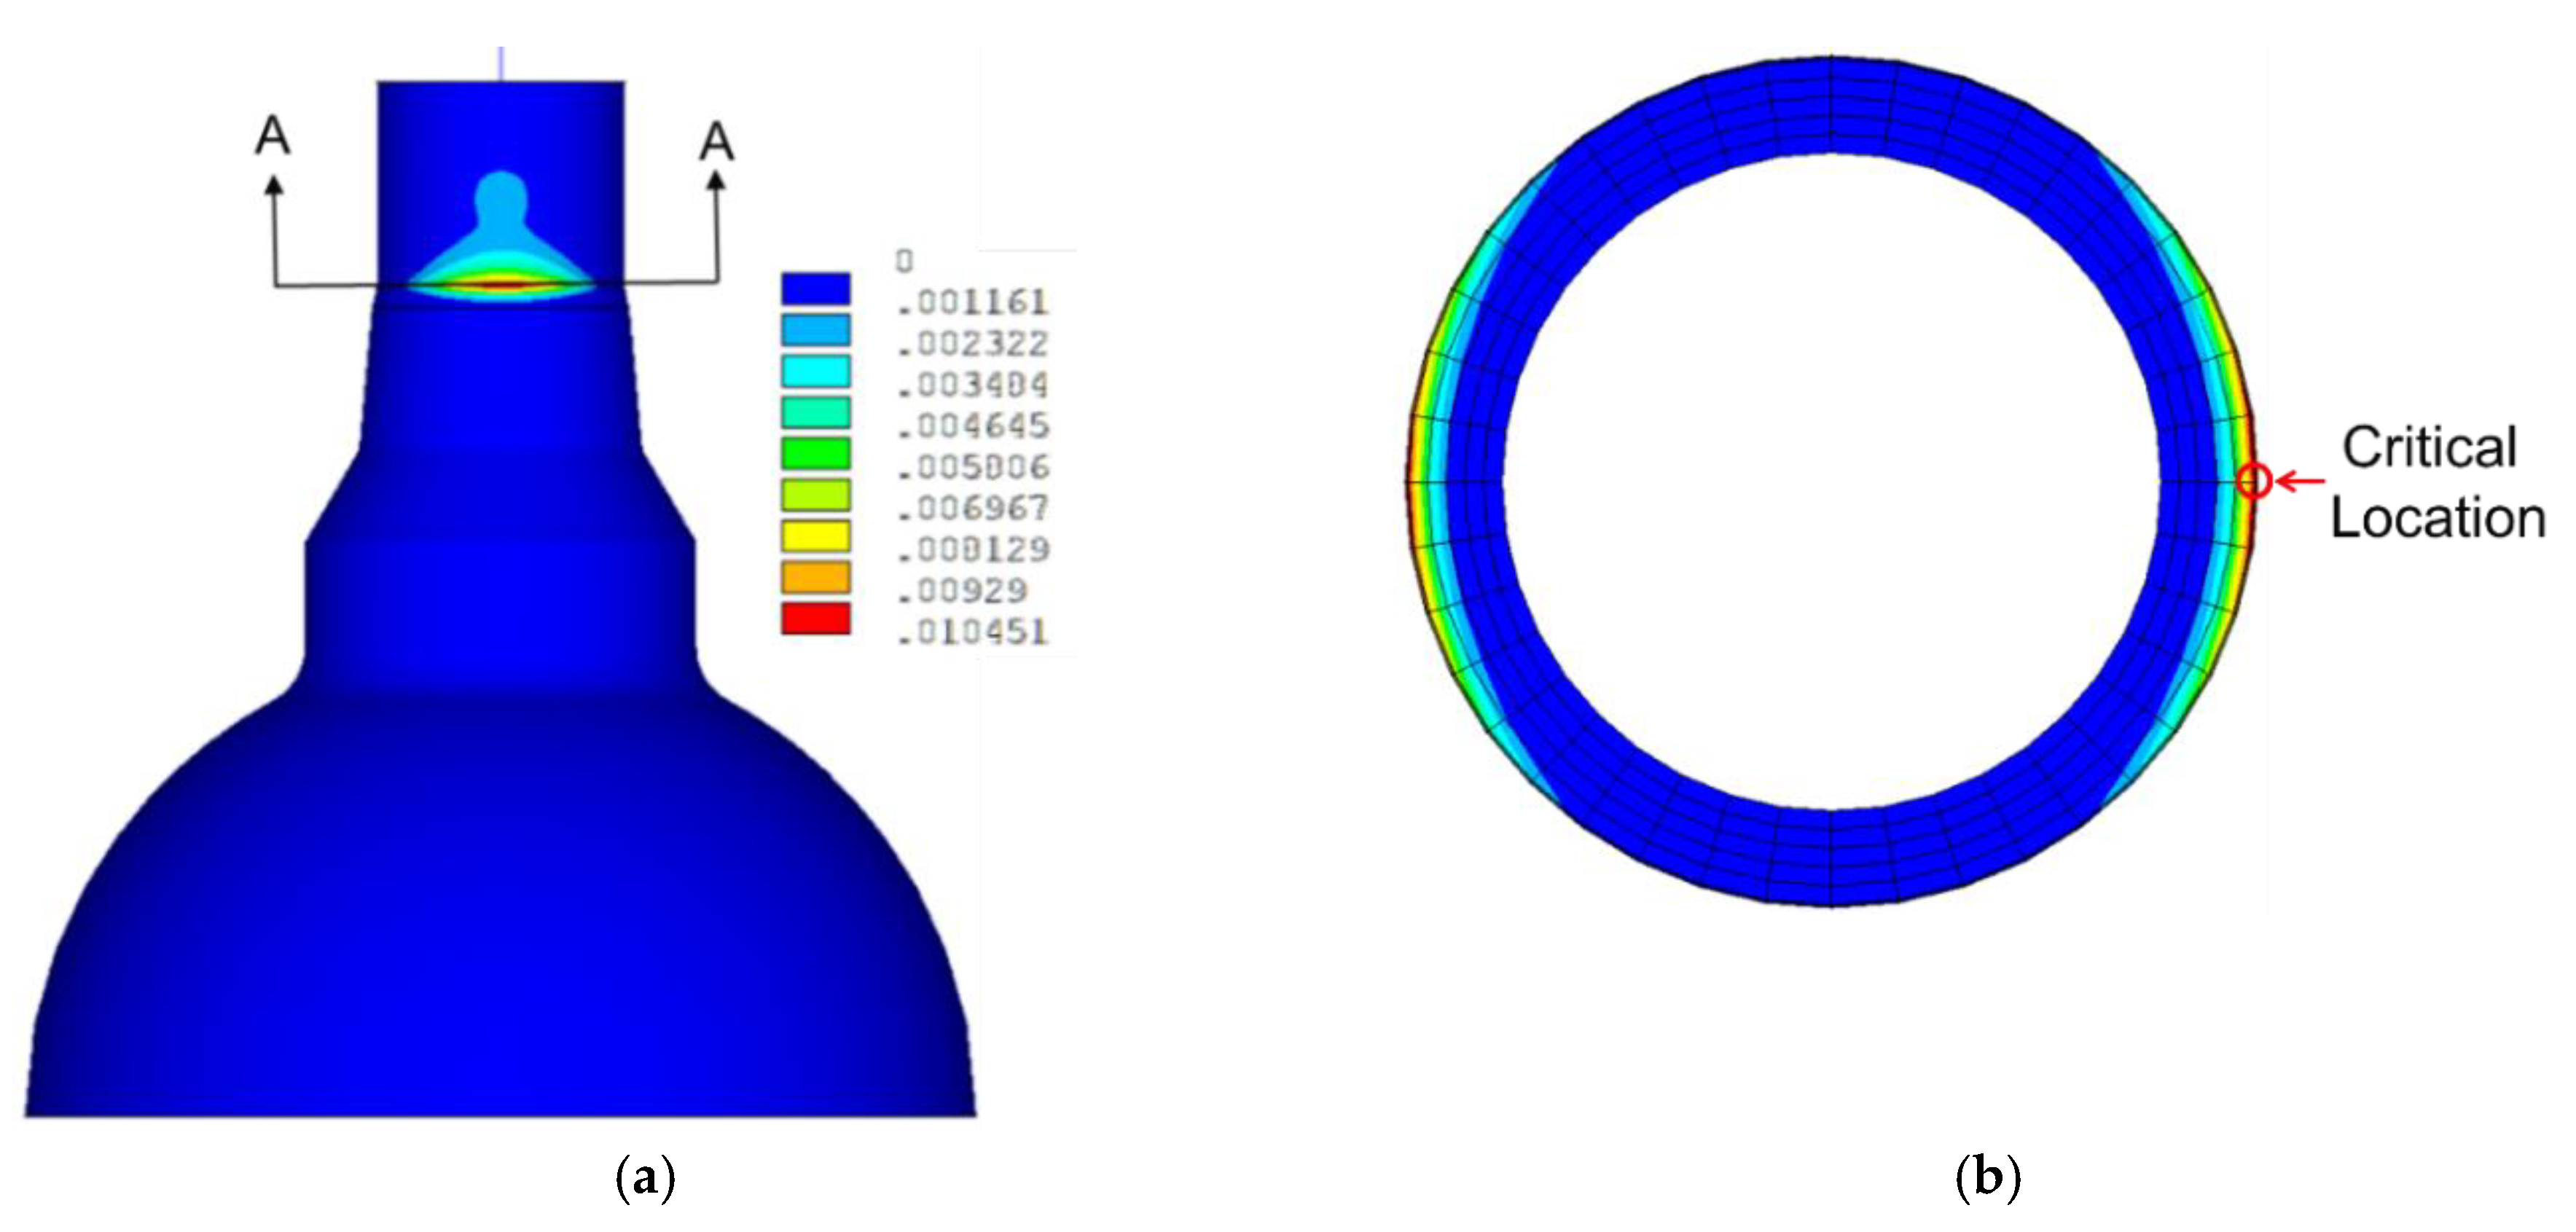
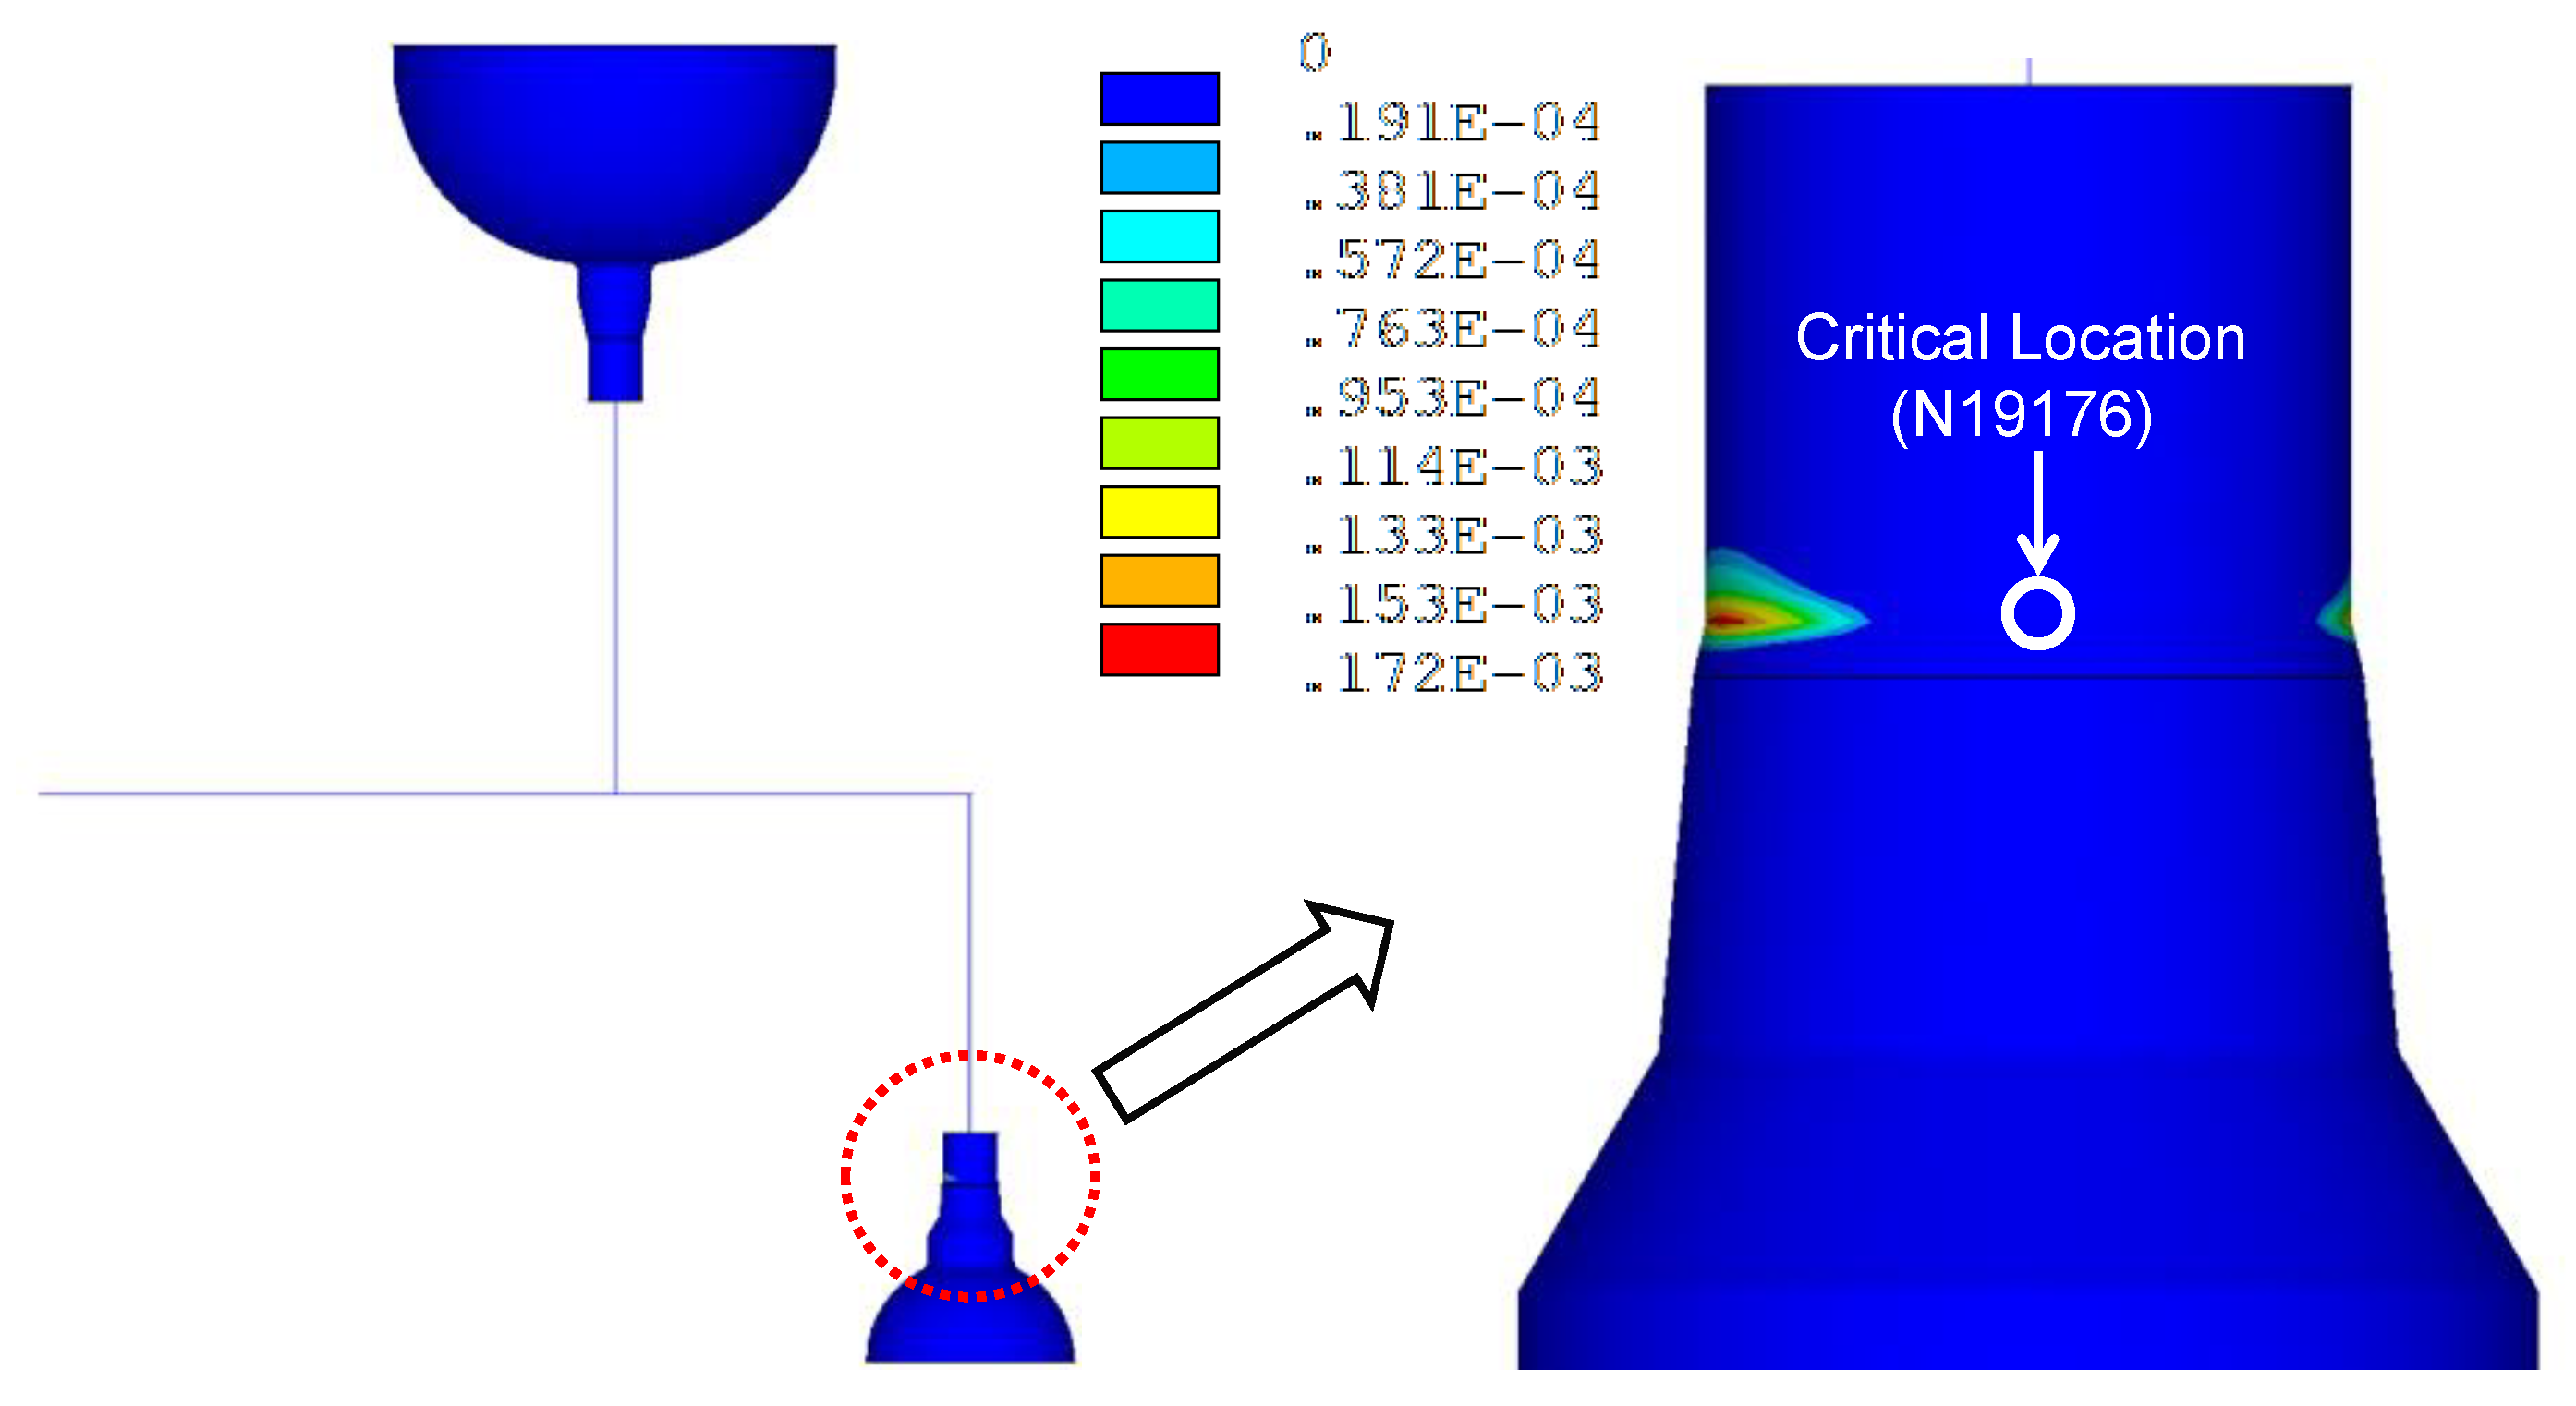
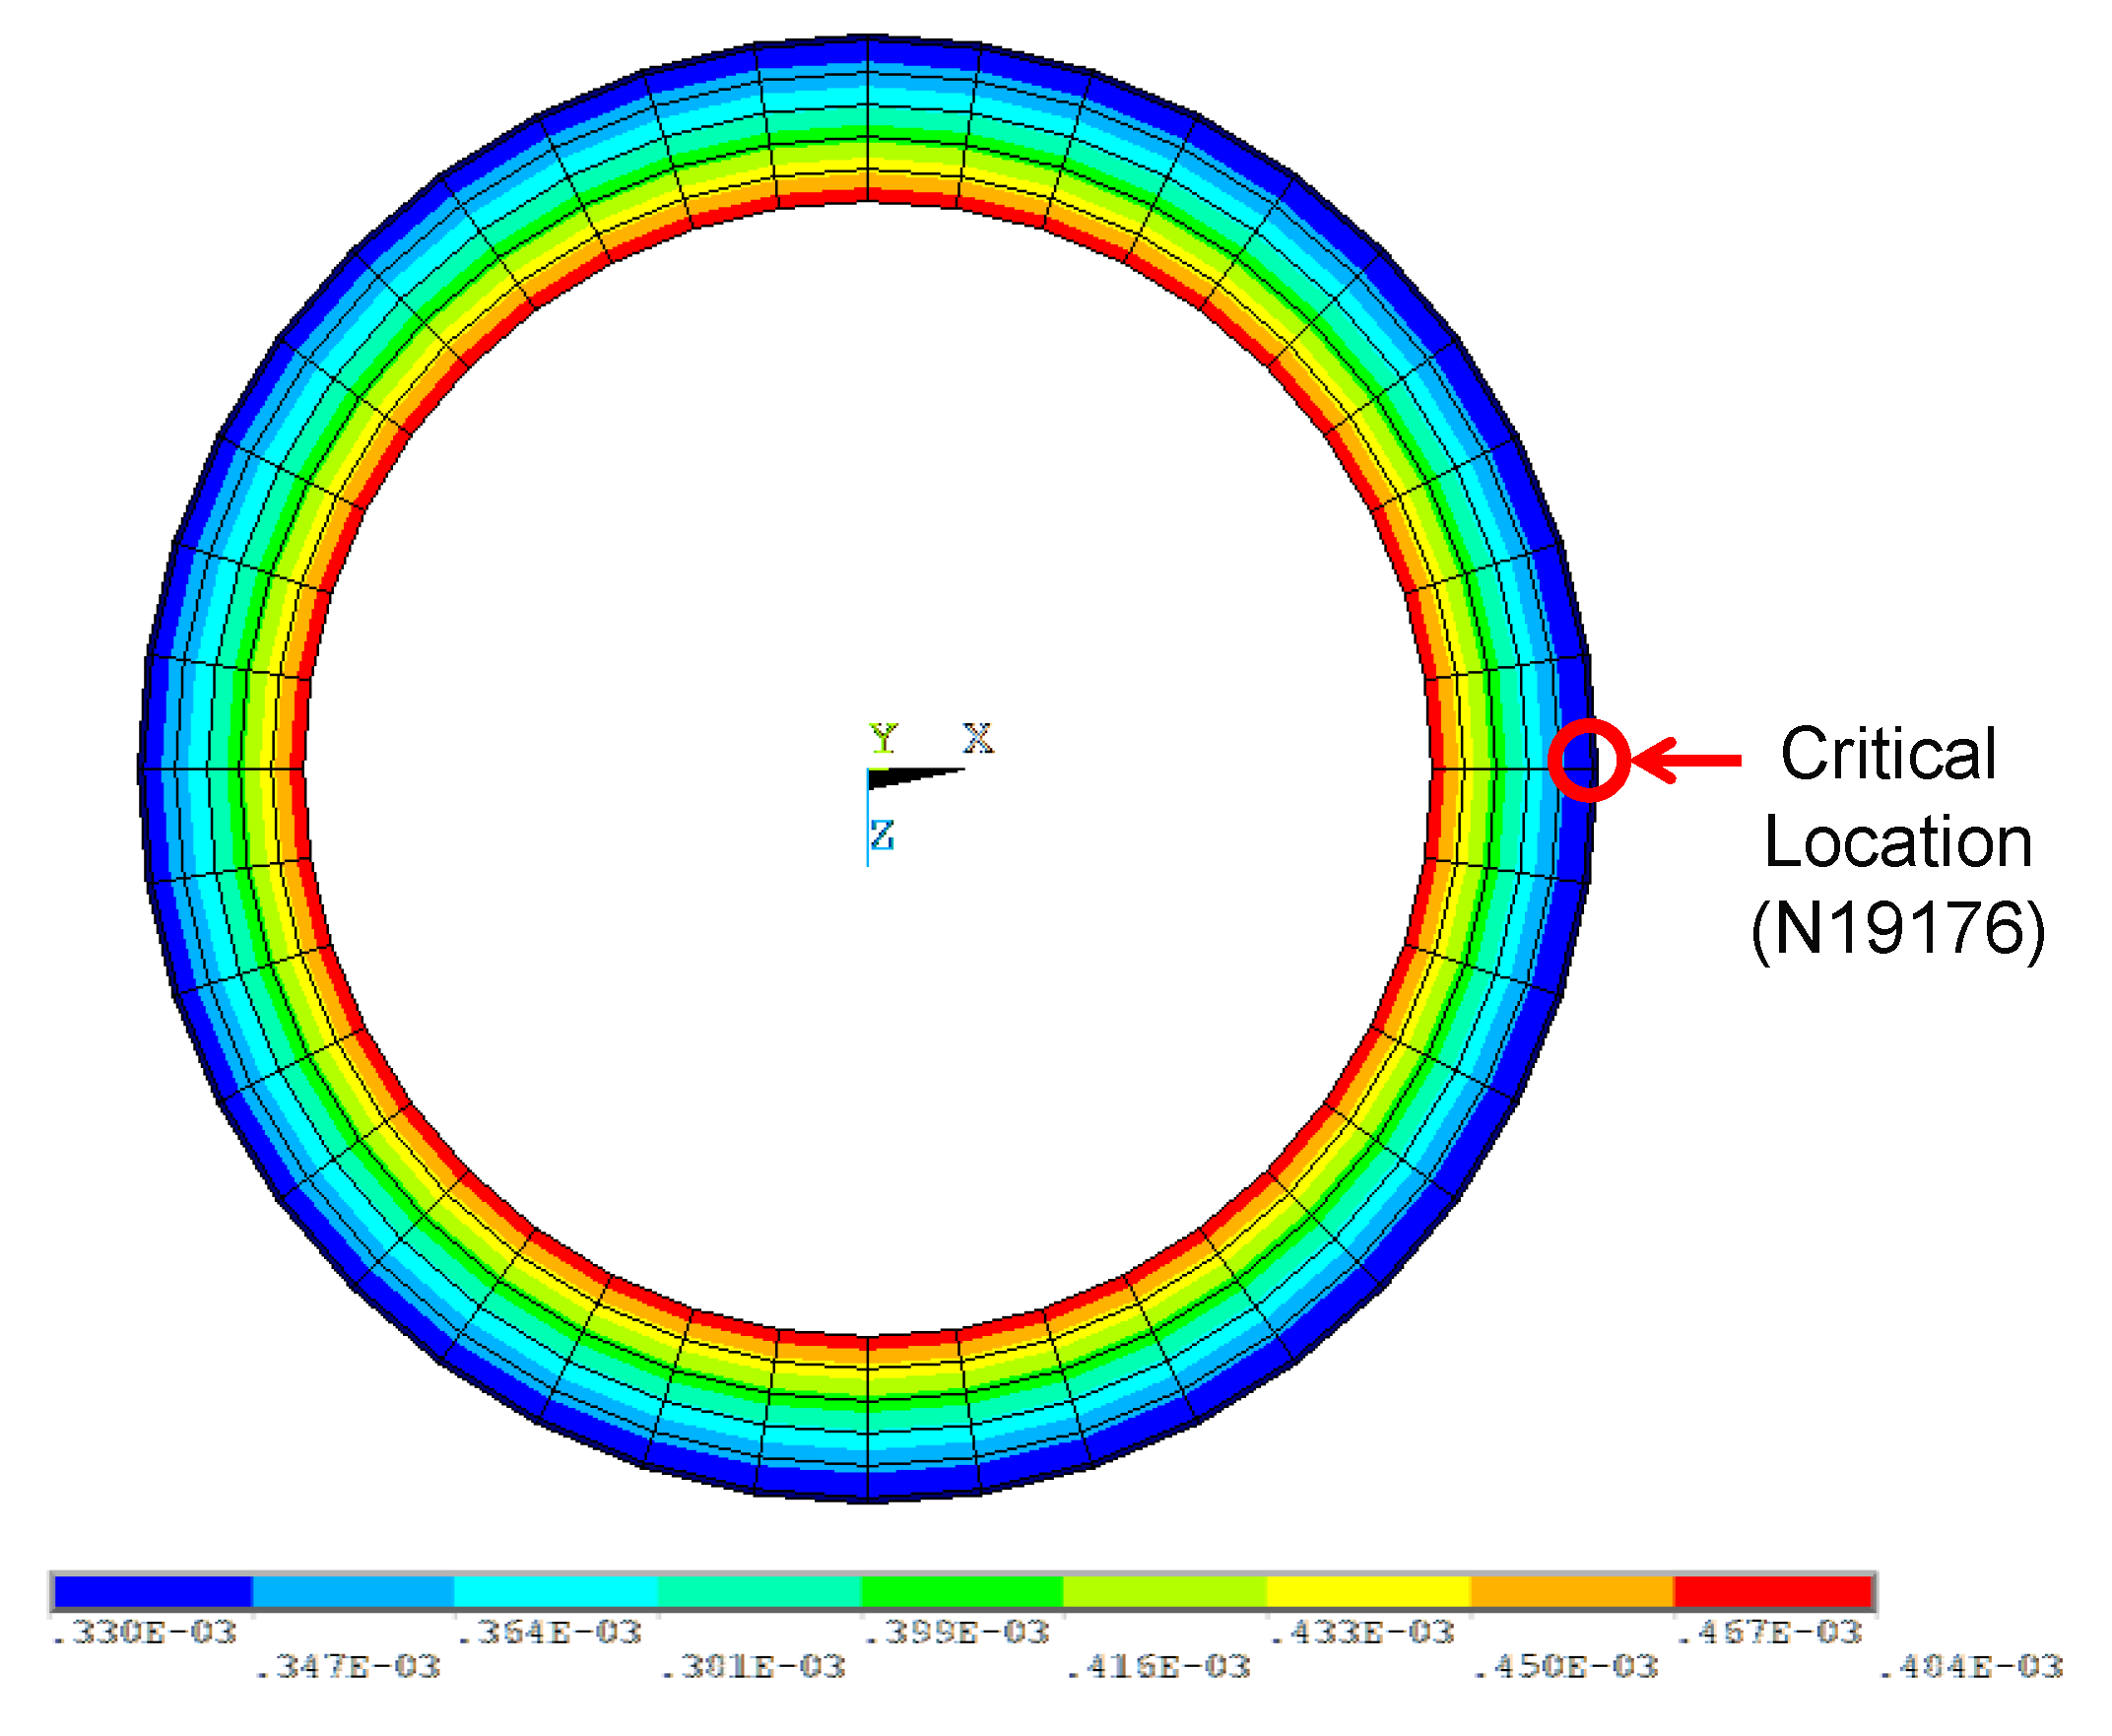
3.2.1. Critical Location for Evaluation
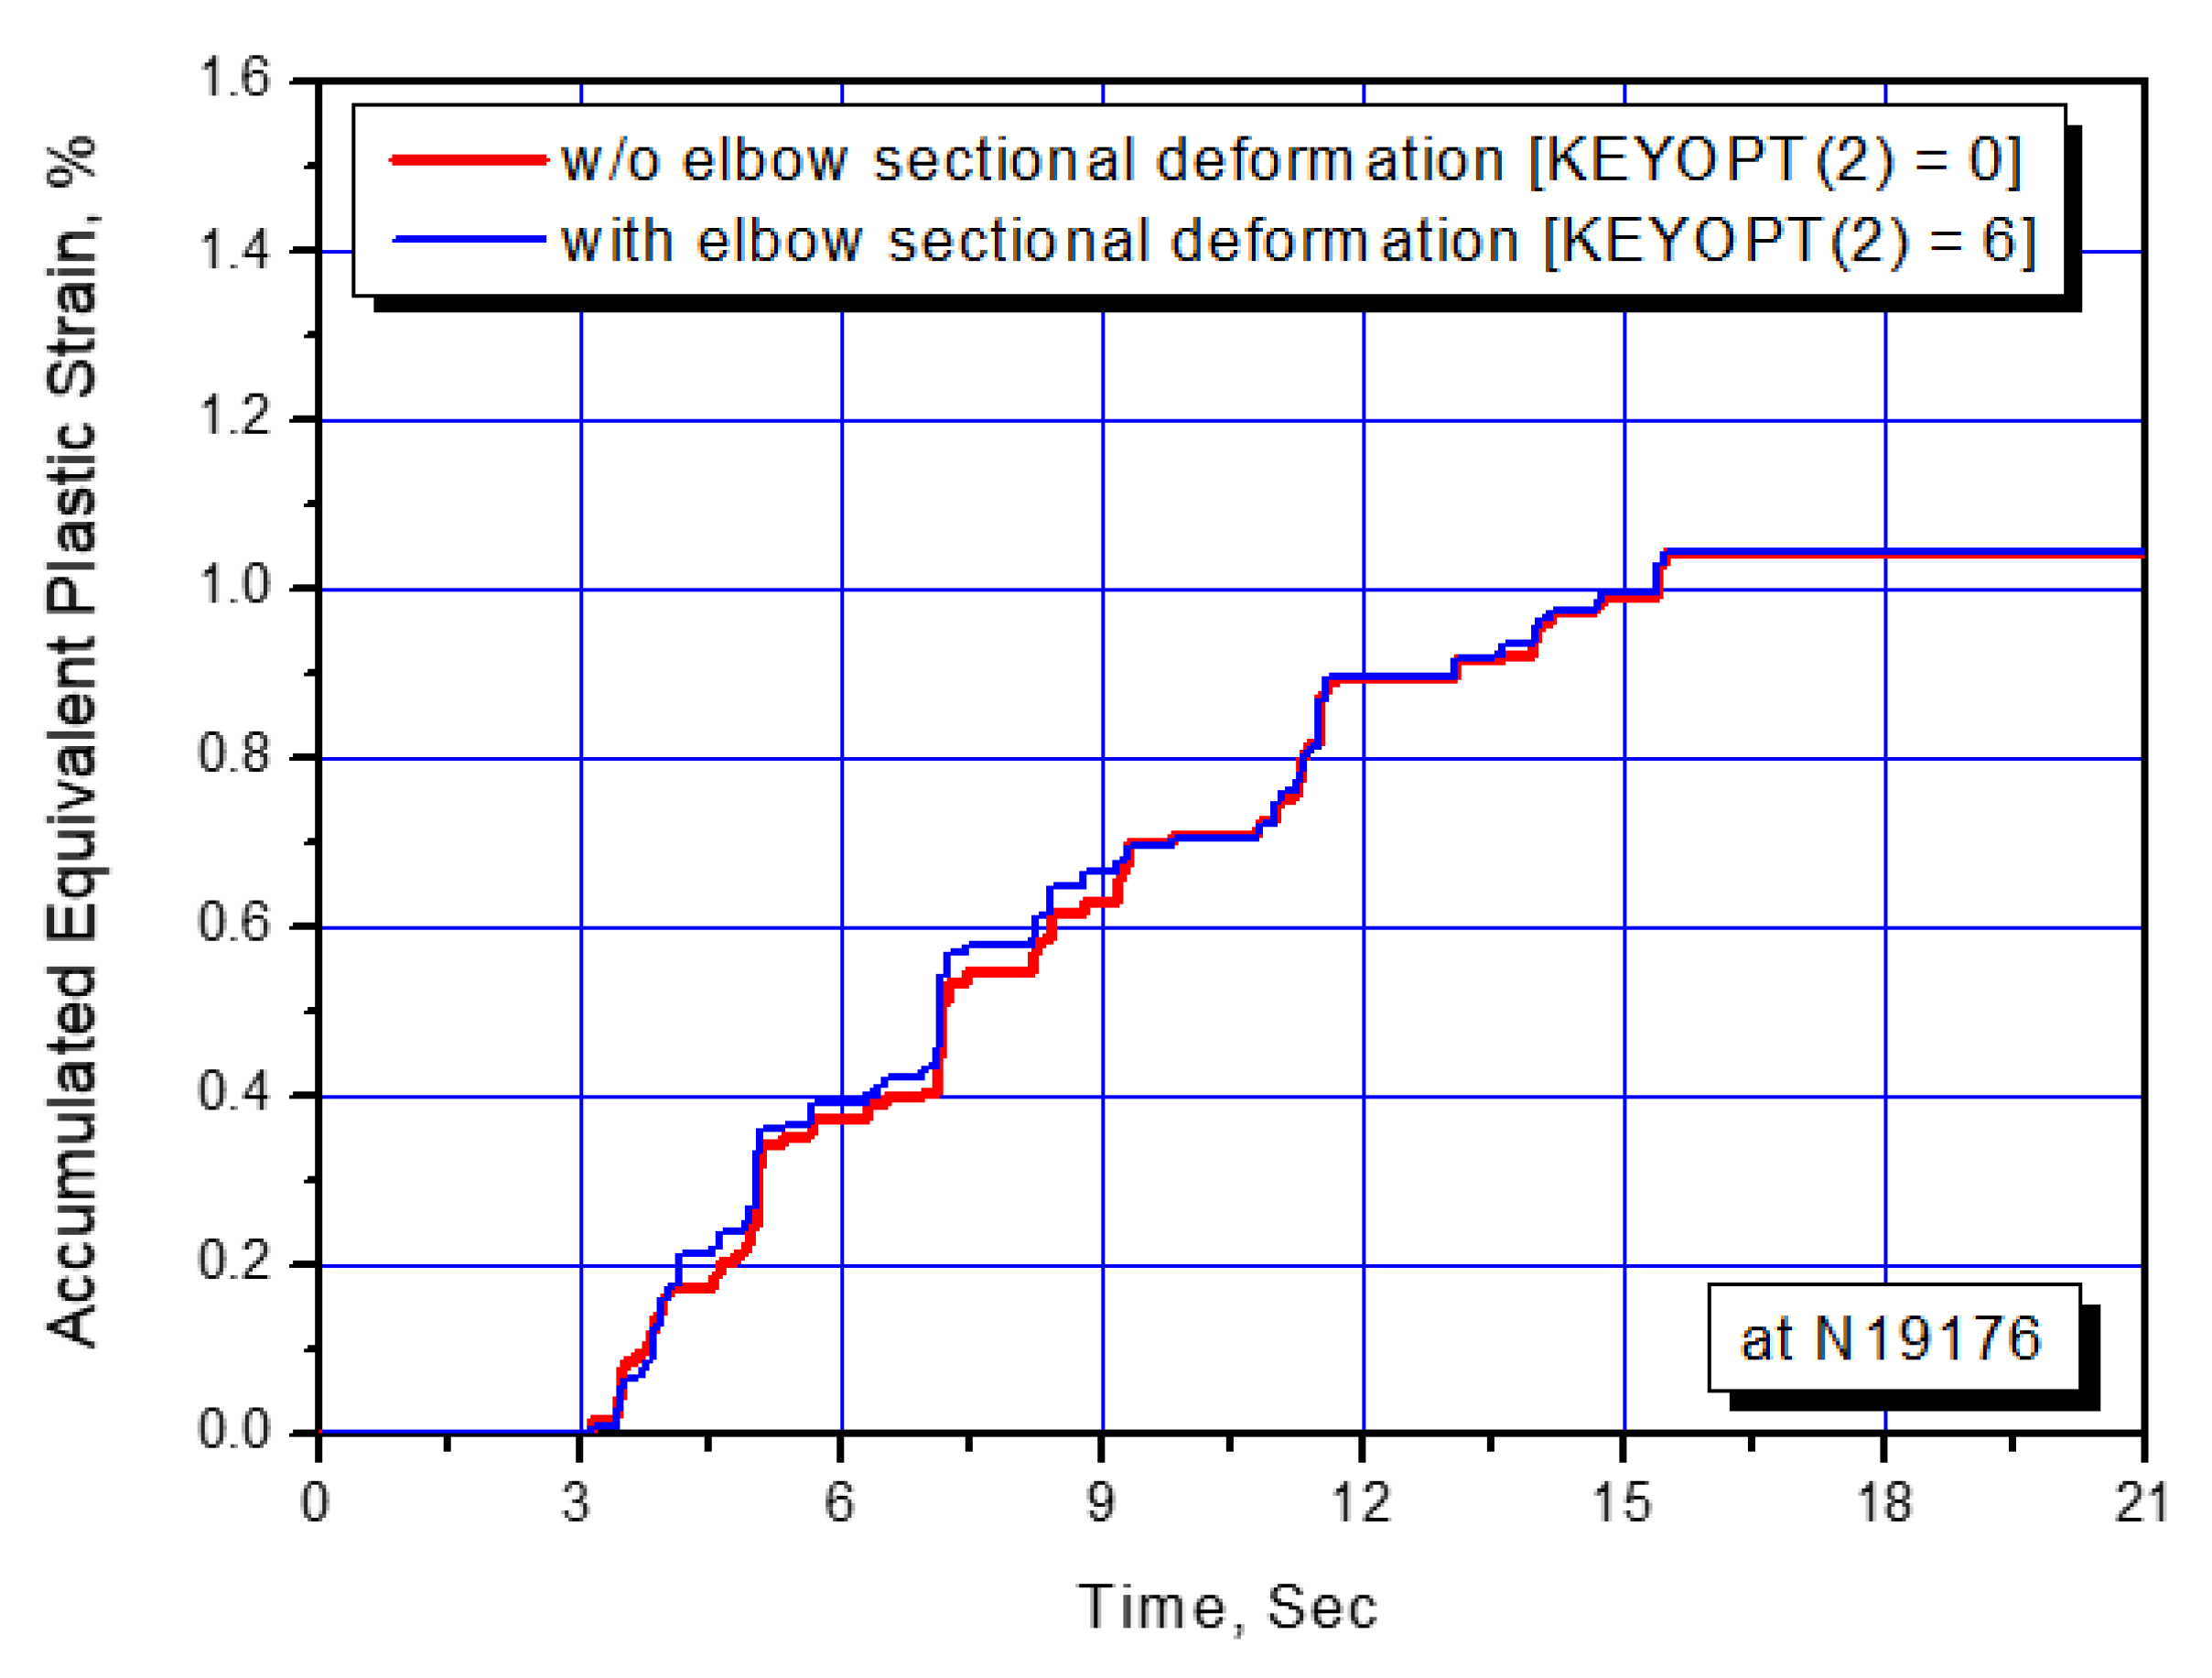
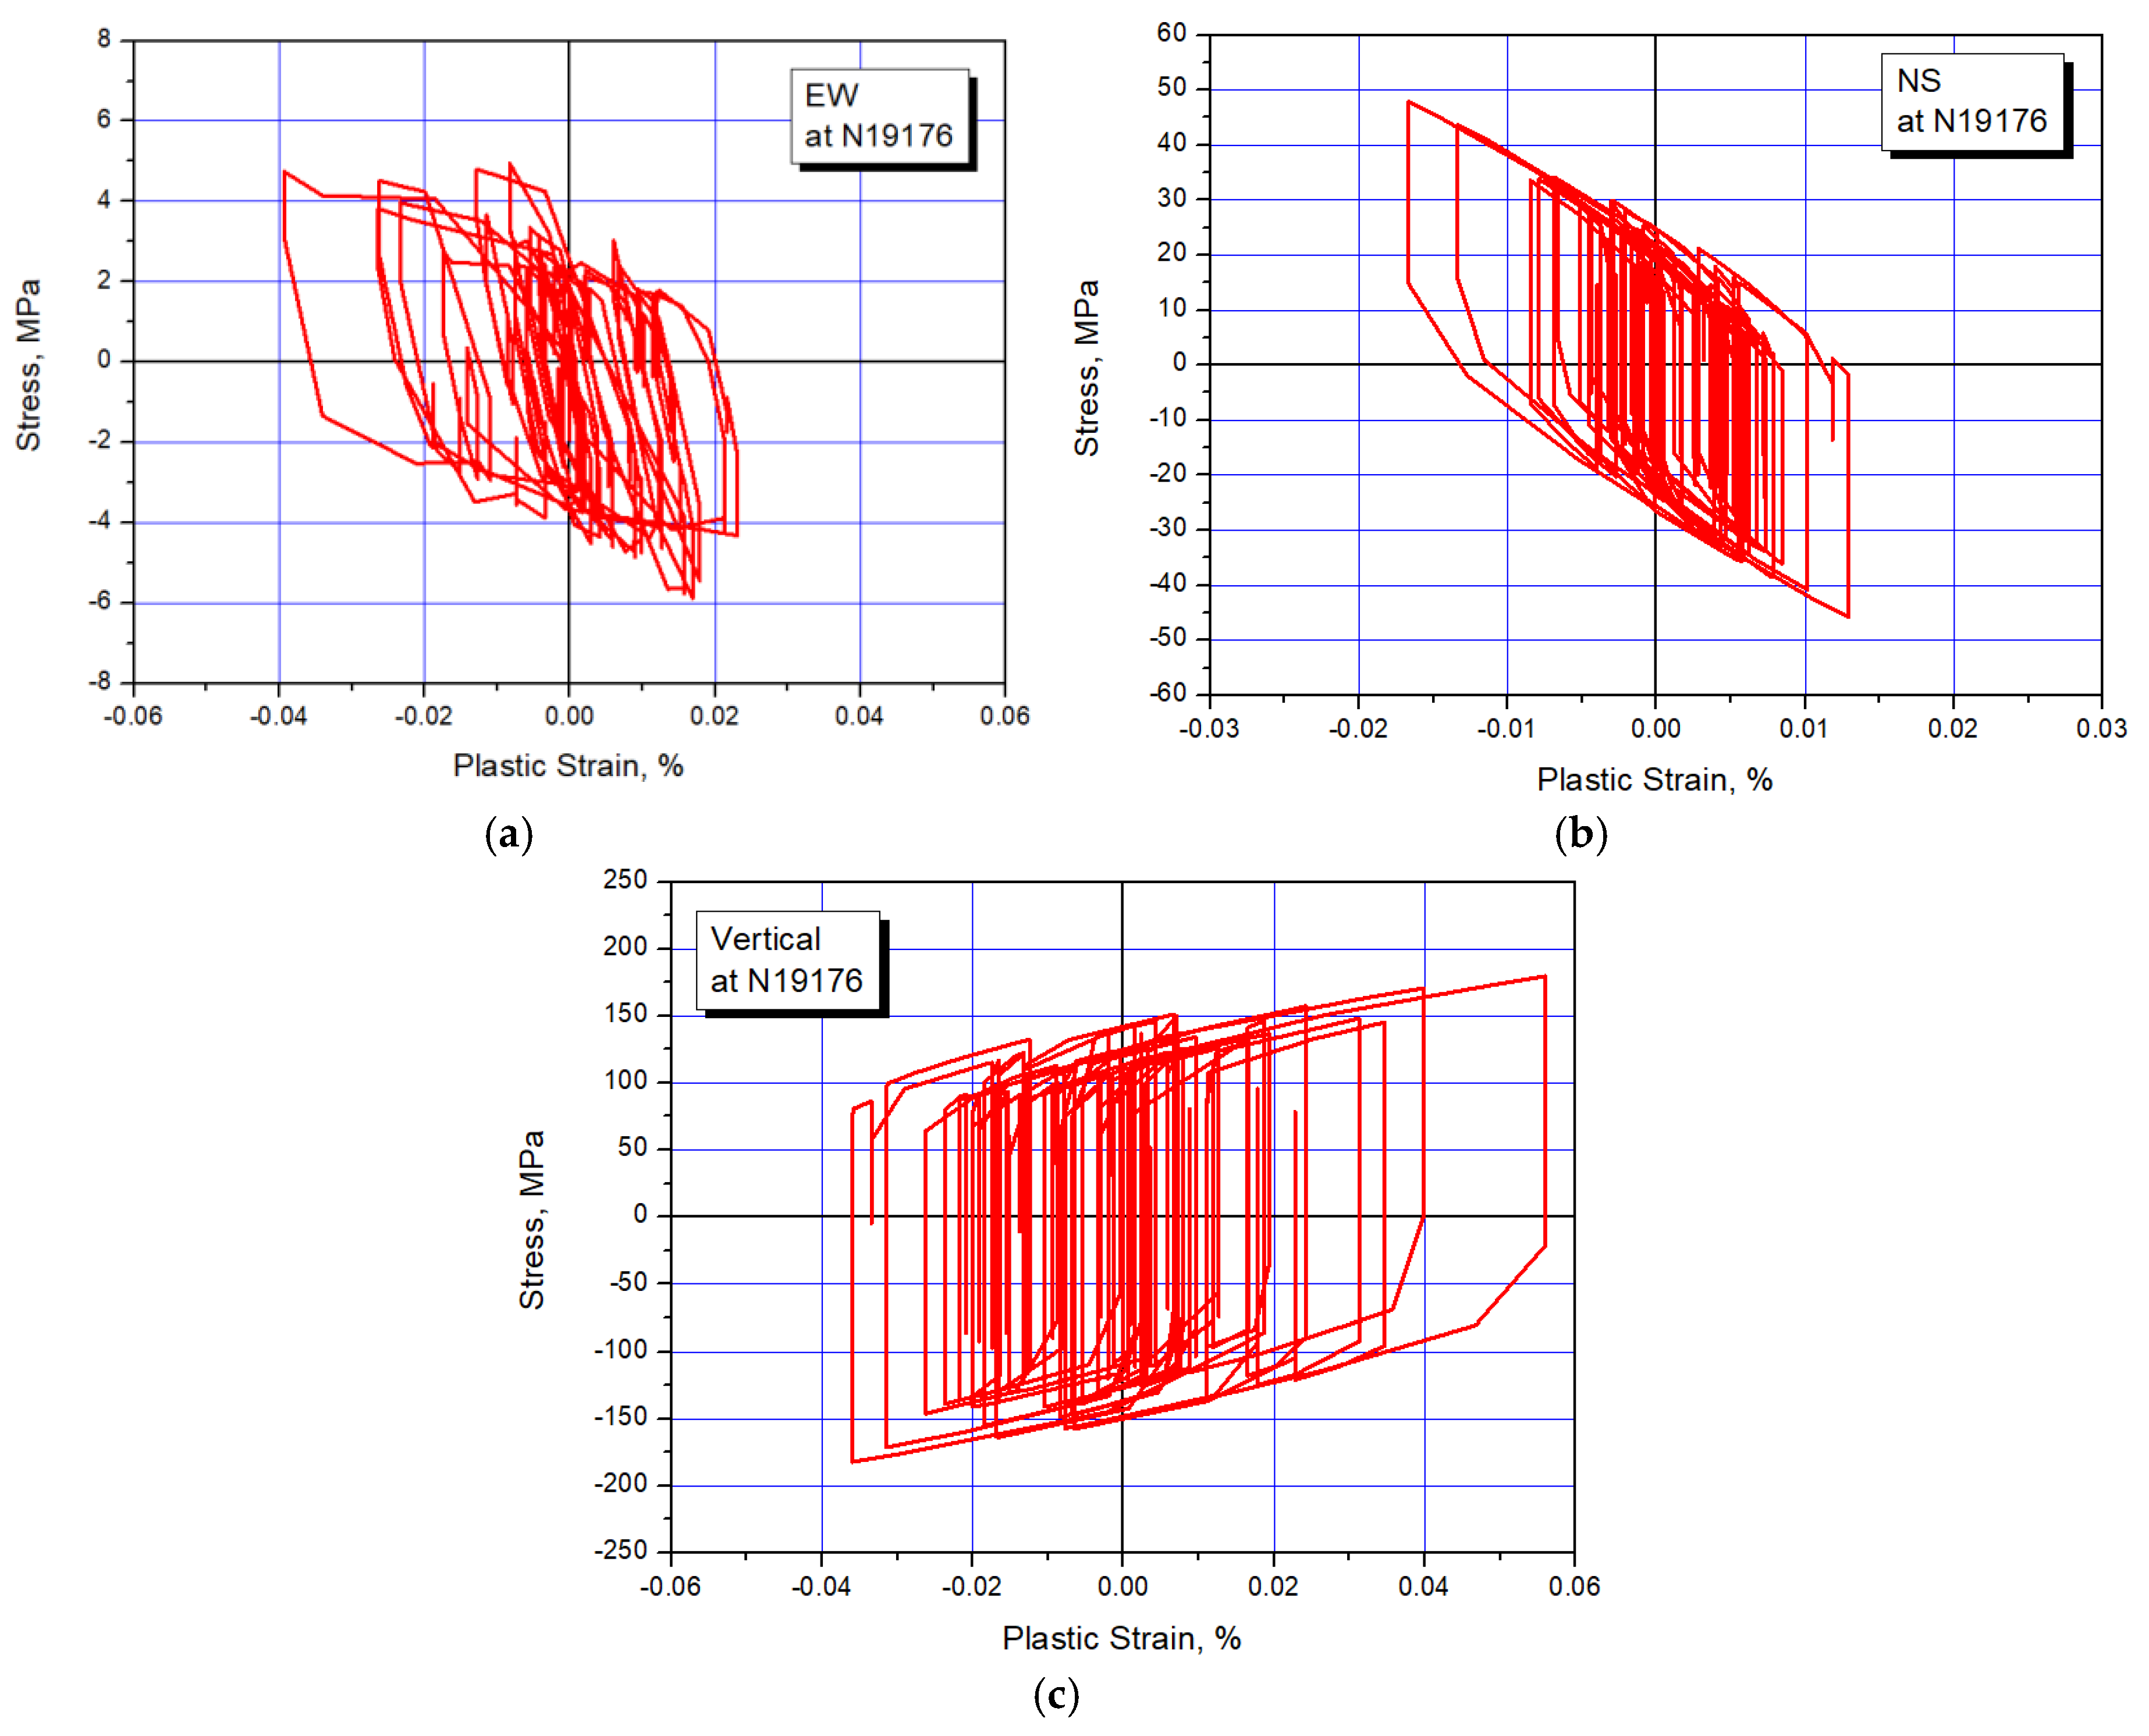
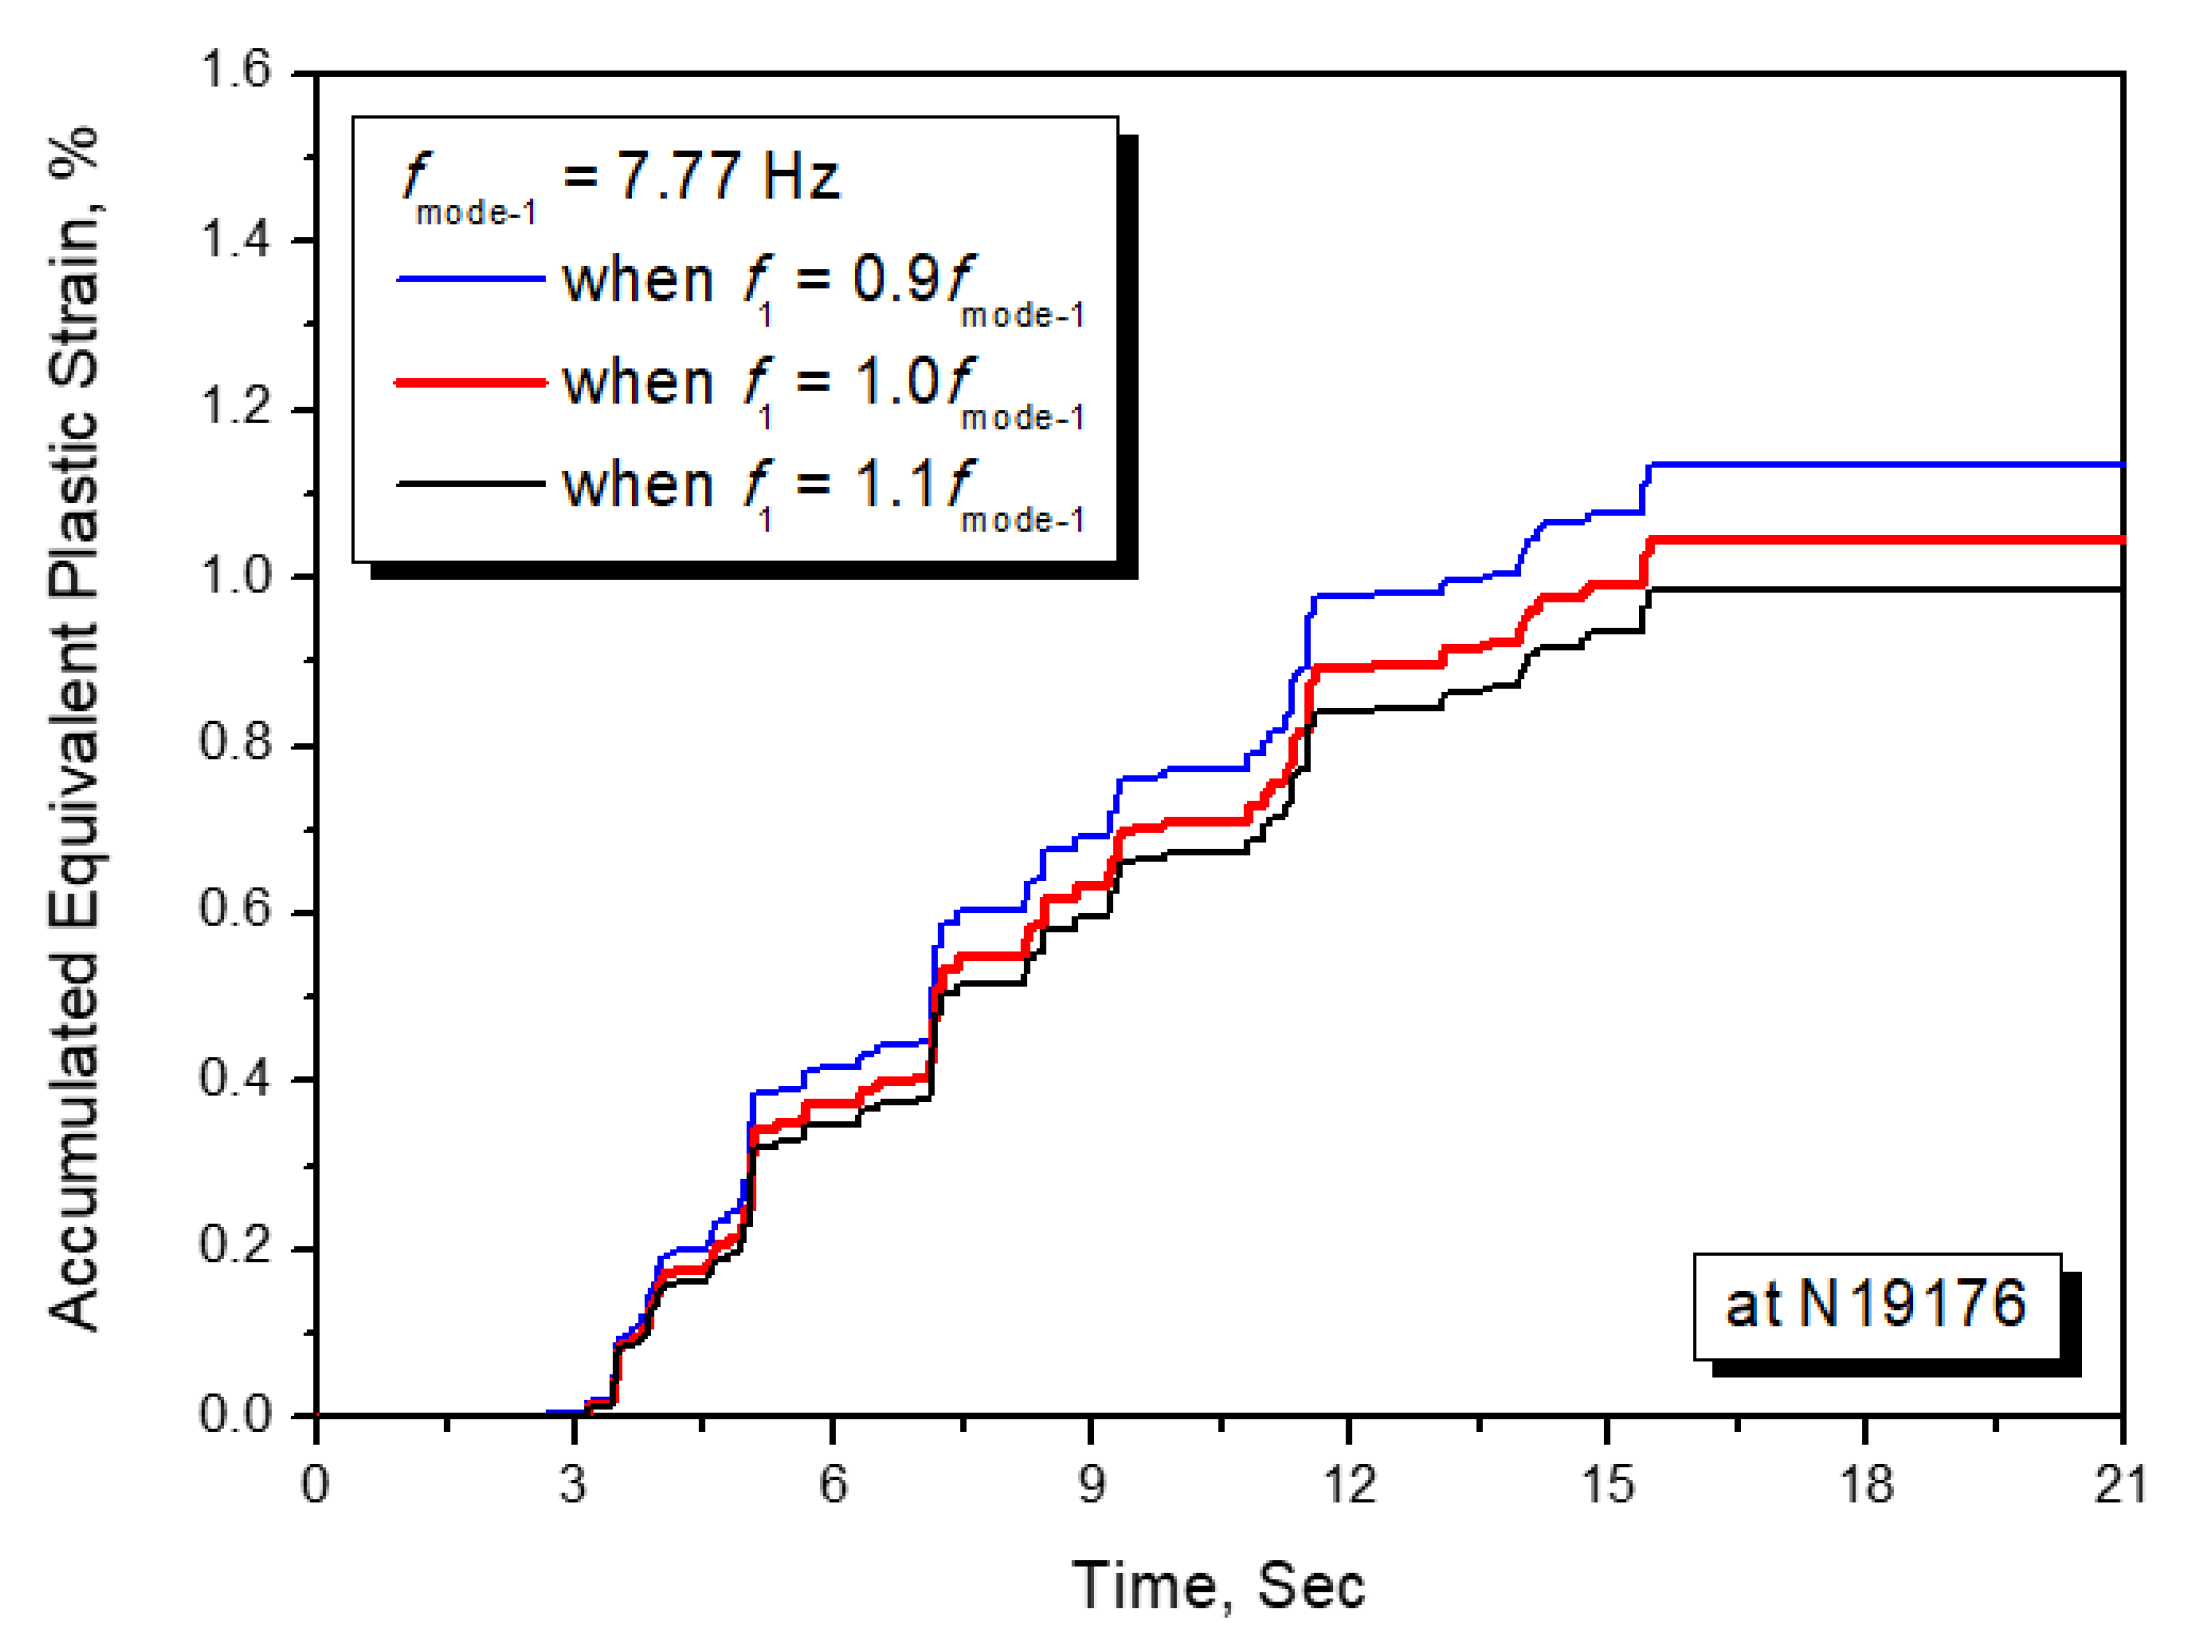
3.2.2. Accumulated Equivalent Plastic Strain
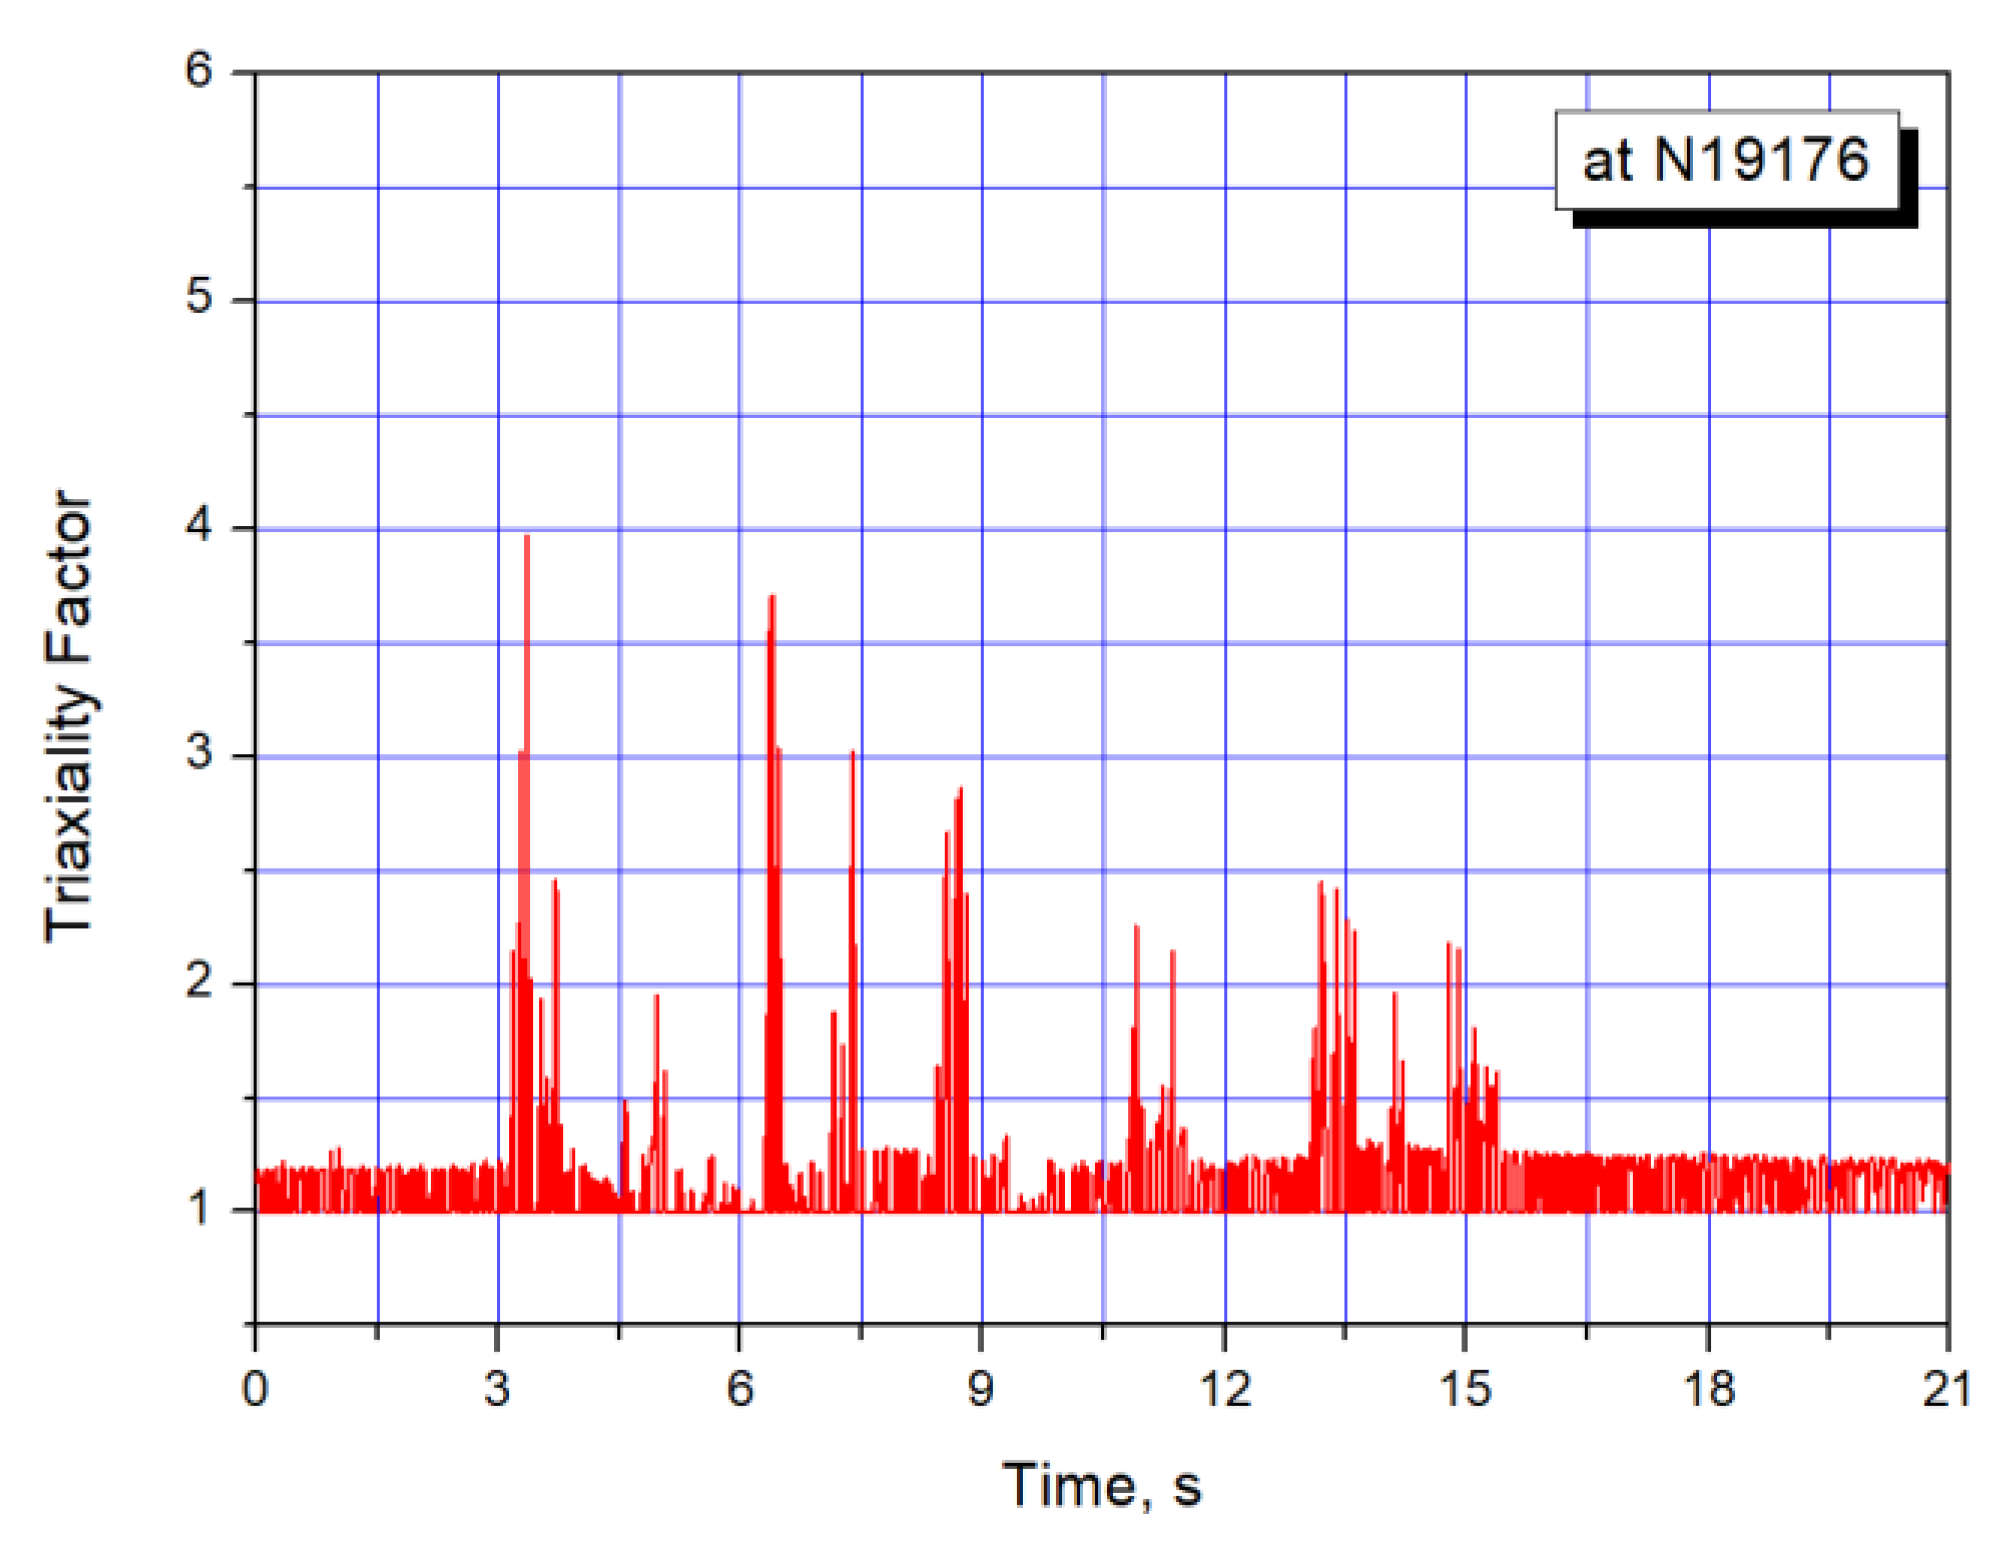
3.2.3. Triaxiality Factor
3.2.4. Results of Seismic Design Evaluation
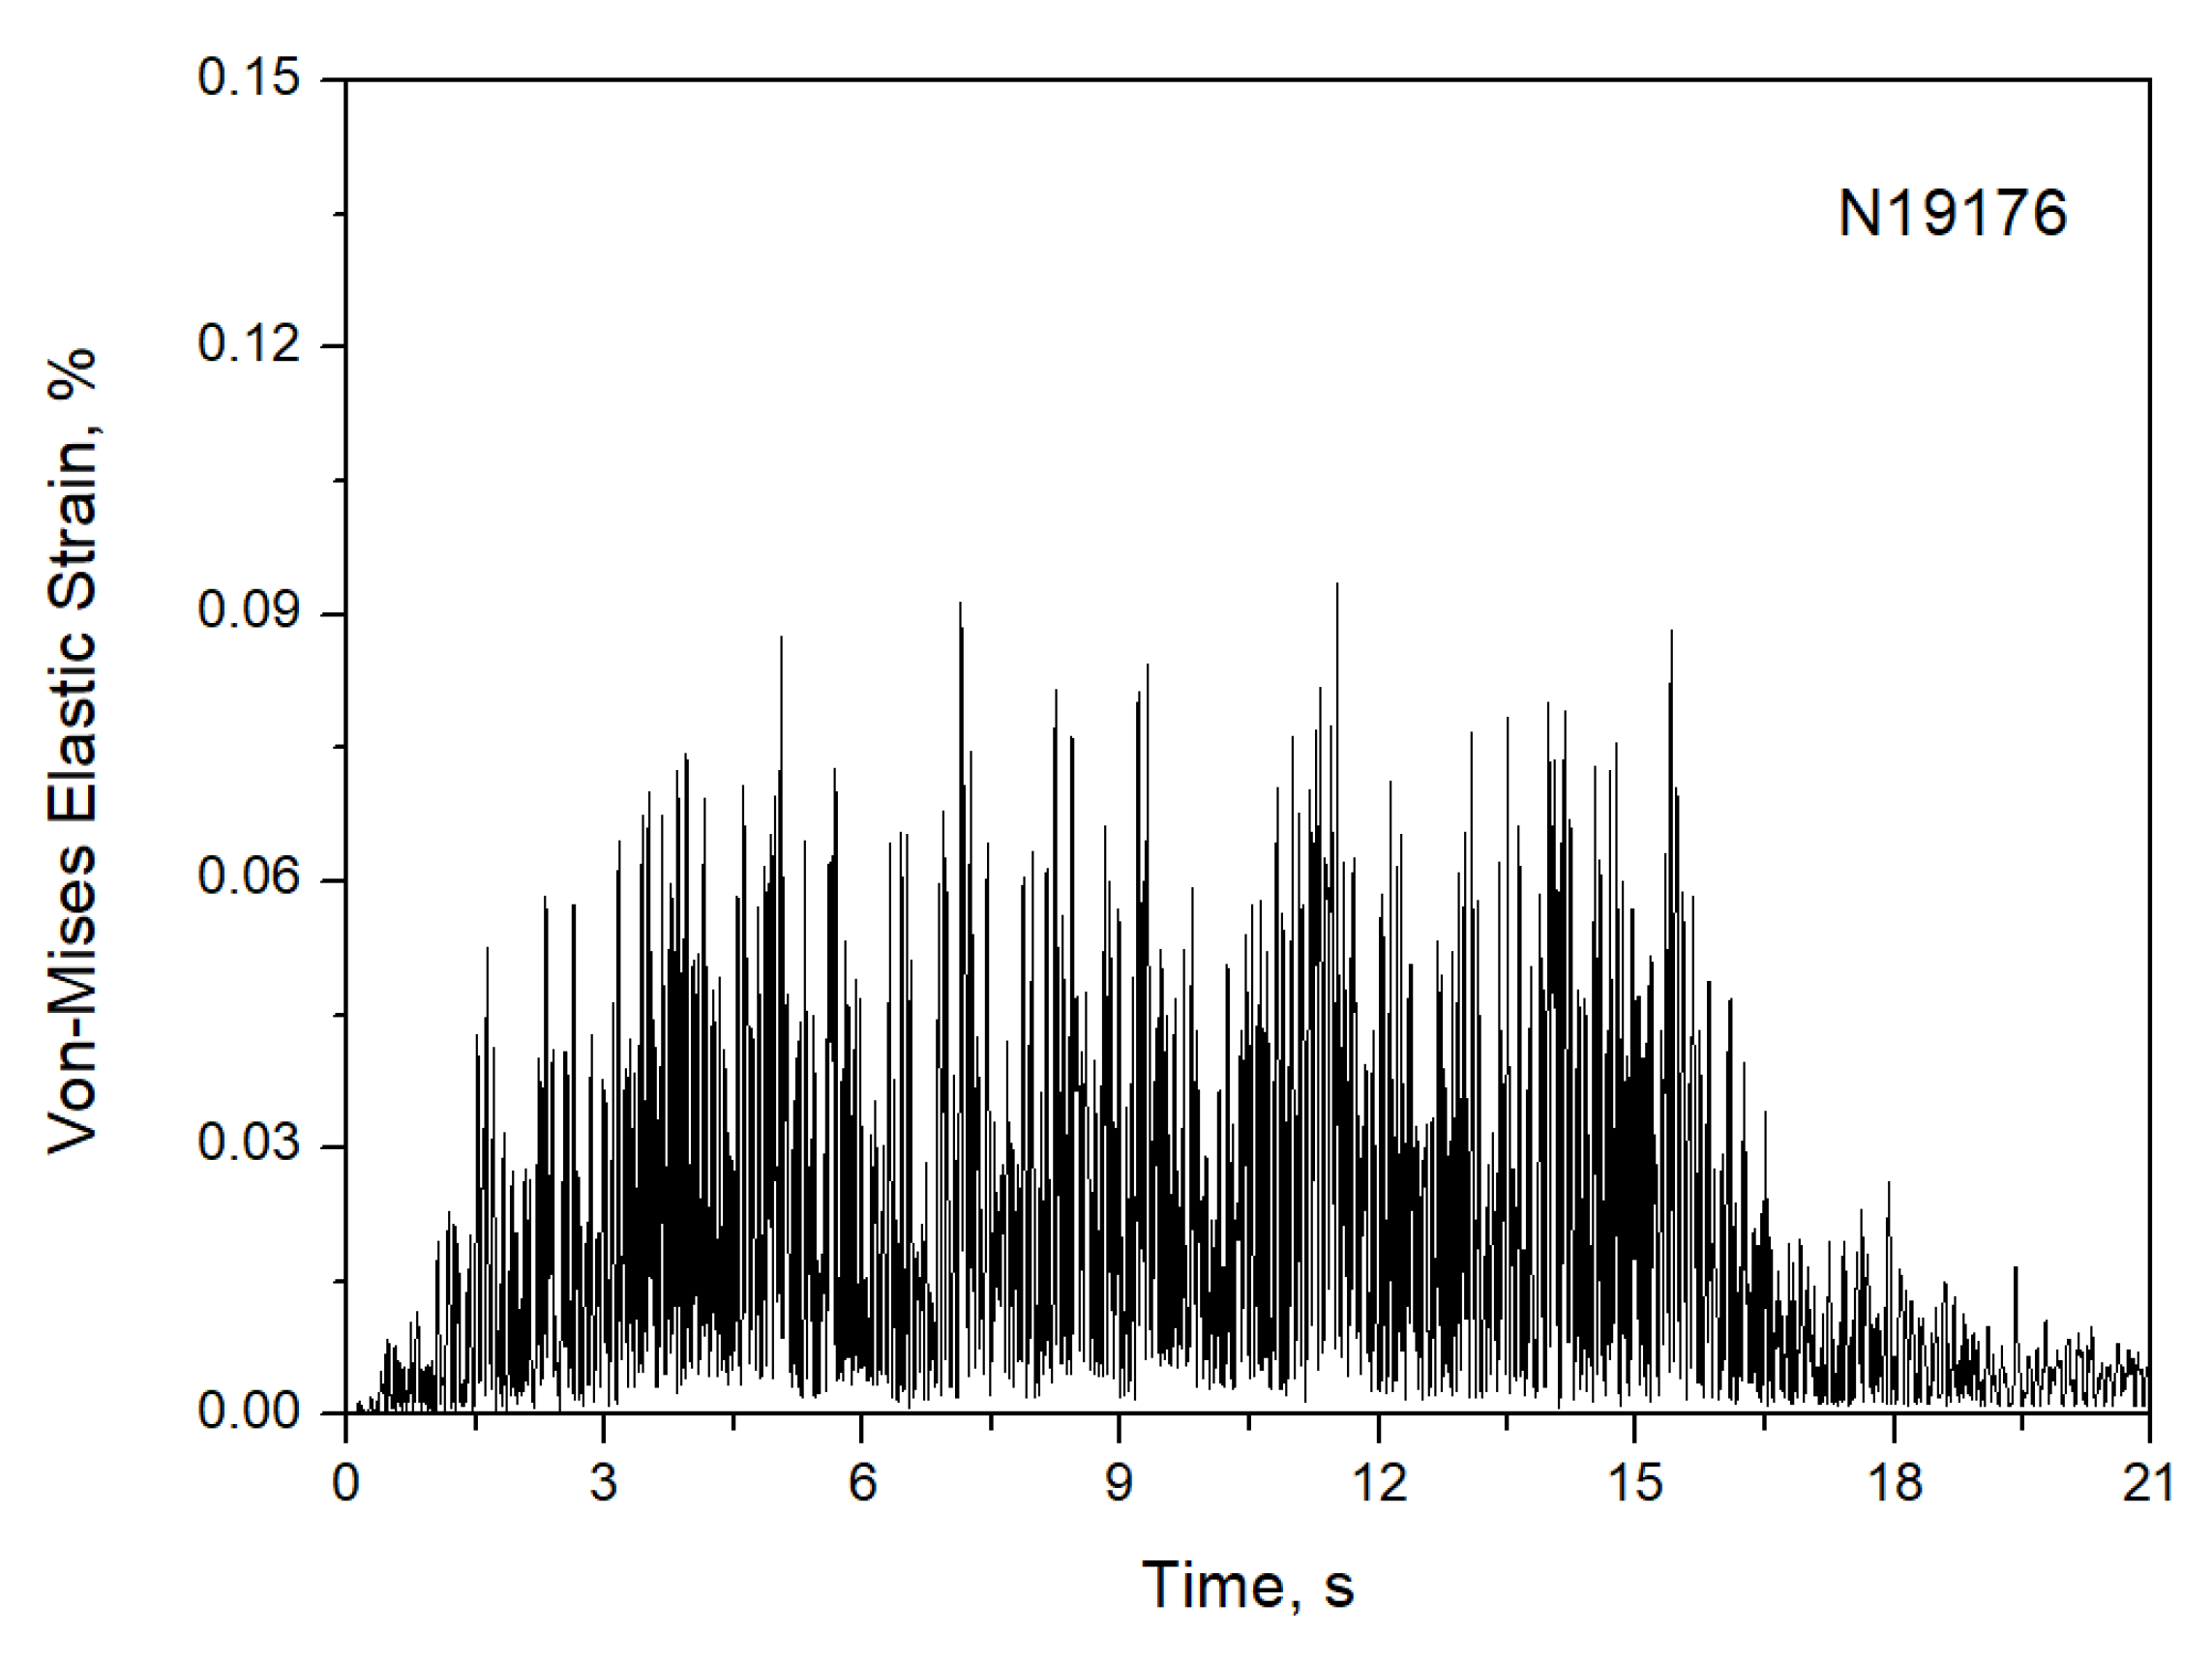
3.3. Strain-Based Acceptance Criteria-2
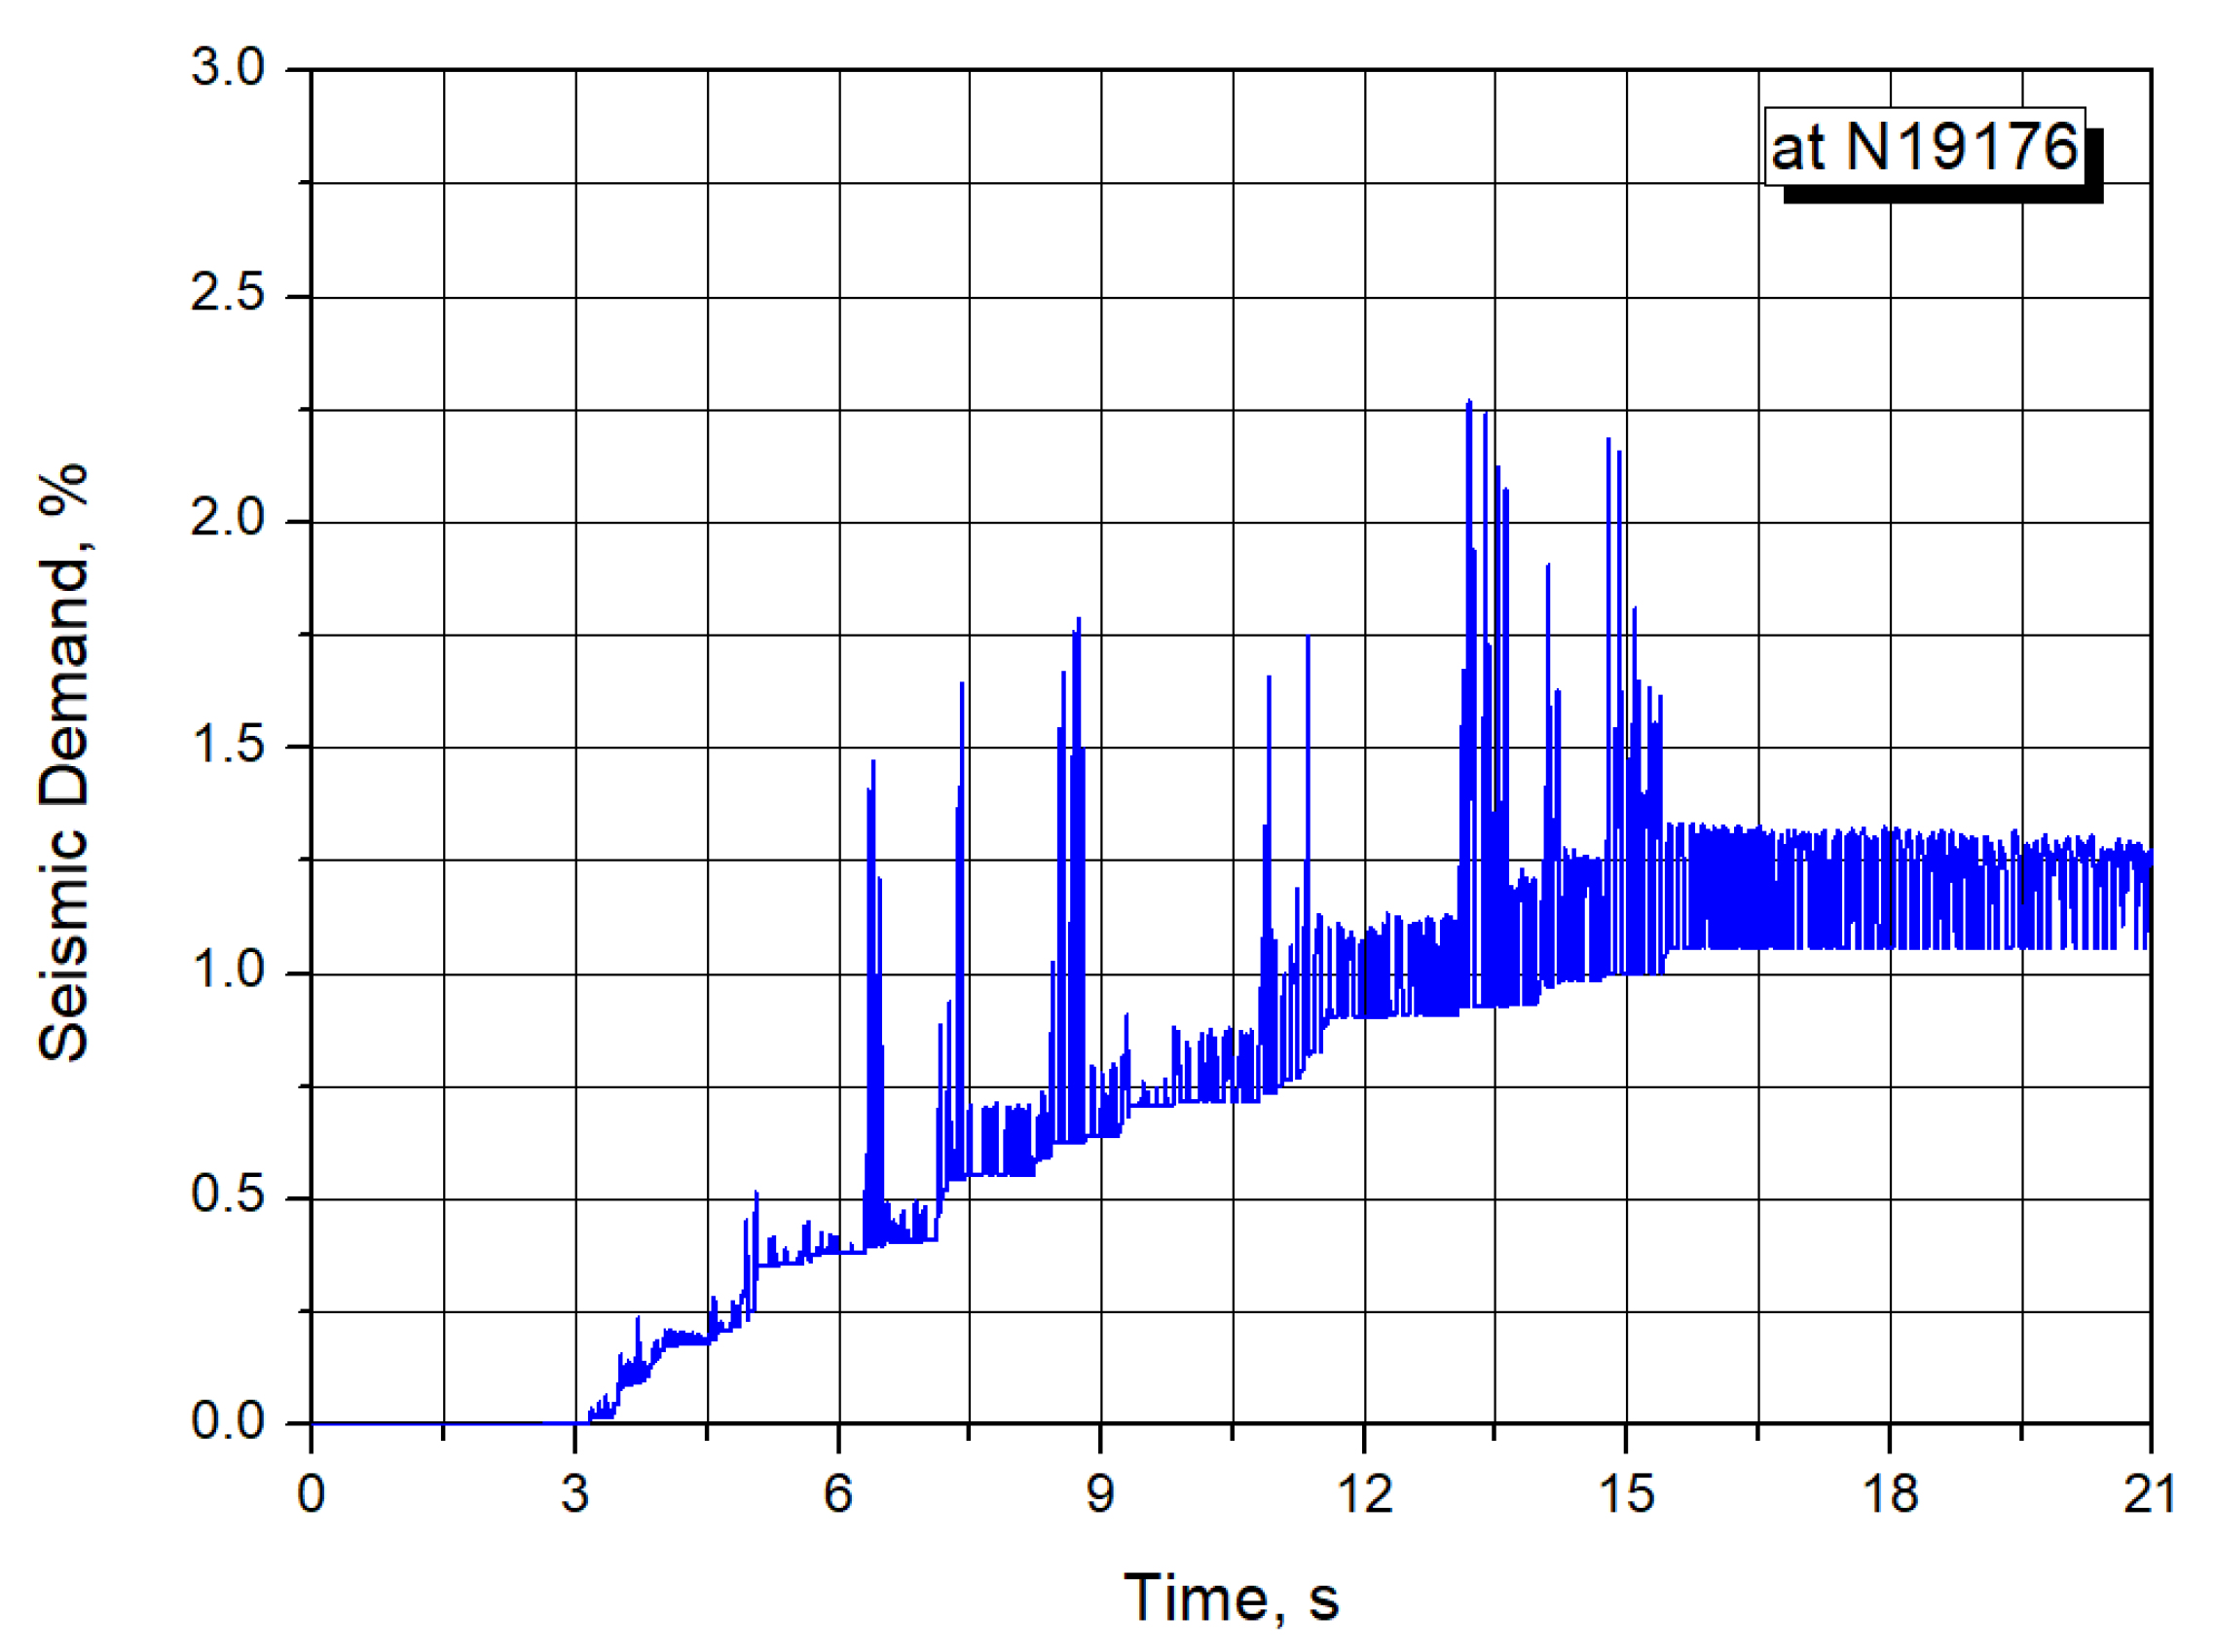
3.3.1. Maximum Total Equivalent Strain
3.3.2. Average TF Value
3.3.3. Results of Seismic Design Evaluation
3.4. Comparison With Stress-Based Criteria
4. Conclusions
- appropriate coupled finite element model, both with piping and nozzles, to be able to assure the stabilized seismic response at critical location;
- inelastic material constitutive equations to be able to consider the kinematic hardening and isotopic hardening behavior;
- determination of frequency range for Rayleigh damping;
- validation of the TF effects on ductile failure and fatigue-induced failure;
- determination of true uniform and fracture strain limits by quasi-static tensile tests;
- determination of the number of cycles, N, for an allowable strain limit value from design fatigue curve
Author Contributions
Funding
Acknowledgments
Conflicts of Interest
References
- ASME BPVC Section III Appendices. Nonmandatory Appendix EE: Strain-Based Acceptance Criteria Definitions and Background Information; ASME: New York, NY, USA, 2019. [Google Scholar]
- ASME BPVC Section III Appendices. Nonmandatory Appendix FF: Strain-Based Acceptance Criteria for Energy-Limited Events; ASME: New York, NY, USA, 2019. [Google Scholar]
- ASME BPVC Section III Appendices. Mandatory Appendix XXVII: Design by Analysis for Service Level D; ASME: New York, NY, USA, 2019. [Google Scholar]
- Alternative Rules for Level D Service Limits of Class 1, 2, and 3 Piping Systems, Section III, Division 1; ASME Code Case (Record No. 13-1438); ASME: New York, NY, USA.
- Masaki, M.; Akihiro, O.; Tomoyoshi, W.; Izumi, N.; Tadahiro, S.; Masaki, S. Seismic qualification of piping systems by detailed inelastic response analysis: Part 1—A code case for piping seismic evaluation based on detailed inelastic response analyses. In Proceedings of the ASME 2017 PVP Conference, Waikoloa, HI, USA, 16–20 July 2017; Volume 8. [Google Scholar]
- IEEE Std 344-1987. IEEE Recommended Practice for Seismic Qualification of Class 1E Equipment for Nuclear Power Generating Stations; IEEE, Inc.: Piscataway, NJ, USA, 1987. [Google Scholar]
- Algarni, M.; Bai, Y.; Zwawi, M.; Ghazali, S. Damage Evaluation Due to Extremely Low-Cycle Fatigue for Inconel 718 Alloy. Metals 2019, 9, 1109. [Google Scholar] [CrossRef]
- ASME BPVC Section III Appendices. Mandatory Appendix I: Design Fatigue Curve; ASME: New York, NY, USA, 2019. [Google Scholar]
- Cooper, W.E. Rational for a Standard on the Requalification of Nuclear Class 1 Pressure-Boundary Components; NP-1921, Research Project 1756-1; Electric Power Research Institute: Washington, DC, USA, 1981. [Google Scholar]
- Davis, E.A.; Connelly, F.M. Stress Distribution and Plastic Deformation in Rotating Cylinders of Strain-Hardening Material. J. Appl. Mech. 1959, 26, 25–30. [Google Scholar]
- Design and Development Guide for NNSA Type B Packages; National Nuclear Security Administration, SG-100 Rev. 2, Appendix M: Washington, DC, USA, 2005.
- Damping Values for Seismic Design of Nuclear Power Plants; Regulatory Guide 1.61; US NRC: North Bethesda, MD, USA, 2007.
- Seismic Analysis of Safety-Related Nuclear Structures; ASCE/SEI Standard 4-16; ASCE: Reston, VA, USA, 2017.
- ANSYS Mechanical APDL Release 15.0; ANSYS, Inc.: Canonsburg, PA, USA, 2013.
- Koo, G.H.; Kwon, J.H. Development of Inelastic Material Parameters for Modified 9Cr-1Mo Steel Applicable to the Plastic and Viscoplastic Constitutive Equations. Int. J. PVP 2011, 88, 26–33. [Google Scholar]
- Zhang, X.; Xu, C.; Wang, L.; Chen, Y. iRadMat: A Thermo-Mechanical Testing System for In Situ High-Energy X-ray Characterization of Raioactive Specimens. Rev. Sci. Instrum. 2017, 88, 015111. [Google Scholar] [CrossRef] [PubMed]


| Material | Type 316 Stainless Steel (SS) | SA 508, Grade 3, Class 1 |
|---|---|---|
| Elastic Modulus (GPa) | 174.4 | 184.1 |
| Density (kg/m3) | 8030 | 7750 |
| Poisson’s Ratio | 0.31 | 0.3 |
| Temp (°C) | σyo × 106 (Pa) | E × 109 (Pa) | C1 × 109 | C2 × 109 | C3 × 109 | γ1 × 10³ | γ2 × 10³ | γ3 | b | Q × 106 |
|---|---|---|---|---|---|---|---|---|---|---|
| Type 316 SS | 135 | 190 | 120 | 20.20 | 10.670 | 1.0 | 1.00 | 1.0 | 45.0 | 85 |
| SA 508, Gr3, Cl 1 | 86 | 170 | 80 | 14.02 | 3.333 | 0.9 | 1.50 | 1.0 | 12.0 | 165 |
| Components | EW (mm) | NS (mm) | V (mm) |
|---|---|---|---|
| (1) PZR Skirt | ±6.92 | ±12.46 | ±0.72 |
| (2) Snubbers | ±5.98 | ±11.16 | ±0.66 |
| (3) Hot leg | ±8.54 | ±11.16 | ±1.22 |
| Mode No. | Frequencies (Hz) | Modal Participation Factors | Effective Mass | ||||
|---|---|---|---|---|---|---|---|
| EW | NS | V | EW | NS | V | ||
| 1 | 7.77 | −16.881 | −2.4 | 47.077 | 284.959 | 5.76001 | 2216.26 |
| 2 | 10.87 | −10.877 | 0.29597 | 22.478 | 118.319 | 0.0875959 | 505.268 |
| 3 | 12.17 | 12.749 | 3.2211 | 22.52 | 162.536 | 10.3753 | 507.171 |
| 4 | 17.85 | 31.204 | 3.655 | −6.2142 | 973.706 | 13.3593 | 38.6166 |
| 5 | 20.36 | 47.947 | 1.2343 | 18.653 | 2298.95 | 1.52341 | 347.939 |
| 6 | 23.63 | 4.0189 | −13.124 | 1.5349 | 16.152 | 172.235 | 2.35597 |
| 7 | 26.12 | −3.7155 | 24.182 | 2.3428 | 13.8048 | 584.784 | 5.48885 |
| 8 | 30.81 | 32.866 | 1.0947 | −0.39209 | 1080.18 | 1.19836 | 0.153732 |
| 9 | 38.64 | −5.5452 | −7.9283 | 5.9351 | 30.7495 | 62.8585 | 35.2249 |
| 10 | 48.01 | 7.8717 | 43.964 | 3.2687 | 61.9641 | 1932.84 | 10.6847 |
| 11 | 55.40 | −13.889 | 34.954 | 11.613 | 192.905 | 1221.81 | 134.872 |
| 12 | 56.55 | −9.6375 | 29.84 | −17.409 | 92.8811 | 890.407 | 303.067 |
| 13 | 67.12 | 13.682 | 10.783 | 0.45063 | 187.184 | 116.265 | 0.20307 |
| Acceptance Criteria | SD (%) | Allowable Value (%) | Design Margin (Allowable Value/SD) | |
|---|---|---|---|---|
| Strain-Based Criteria-1 | 2.268 | 32.500 | 14.330 | |
| Strain-Based Criteria-2 | N = 20 | 1.541 | 2.977 | 1.932 |
| N = 10 | 1.541 | 4.153 | 2.695 | |
| Acceptance Criteria | Pm (Allowable) (MPa) | (Pm + Pb) (Allowable) (MPa) | PSI (Allowable) (MPa) | Design Margin Min (Allowable/SD) |
|---|---|---|---|---|
| Stress-Based Criteria by Elastic Time History Analysis | 245.9 (281.0) | 343.7 (421.5) | − | 1.142 |
| Stress-Based Criteria by Plastic Time History Analysis | 232.6 (339.5) | − | 307.9 (436.5) | 1.418 |
© 2020 by the authors. Licensee MDPI, Basel, Switzerland. This article is an open access article distributed under the terms and conditions of the Creative Commons Attribution (CC BY) license (http://creativecommons.org/licenses/by/4.0/).
Share and Cite
Koo, G.-H.; Kim, J.-S.; Kim, Y.-J. Feasibility Study on Strain-Based Seismic Design Criteria for Nuclear Components. Energies 2020, 13, 4435. https://doi.org/10.3390/en13174435
Koo G-H, Kim J-S, Kim Y-J. Feasibility Study on Strain-Based Seismic Design Criteria for Nuclear Components. Energies. 2020; 13(17):4435. https://doi.org/10.3390/en13174435
Chicago/Turabian StyleKoo, Gyeong-Hoi, Jong-Sung Kim, and Yun-Jae Kim. 2020. "Feasibility Study on Strain-Based Seismic Design Criteria for Nuclear Components" Energies 13, no. 17: 4435. https://doi.org/10.3390/en13174435
APA StyleKoo, G.-H., Kim, J.-S., & Kim, Y.-J. (2020). Feasibility Study on Strain-Based Seismic Design Criteria for Nuclear Components. Energies, 13(17), 4435. https://doi.org/10.3390/en13174435