Article

Regional Integrated Energy Site Layout Optimization Based on Improved Artificial Immune Algorithm

State Key Laboratory of Alternate Electrical Power System with Renewable Energy Sources, North China Electric Power University (Baoding), Baoding 071003, China
*
Author to whom correspondence should be addressed.
Energies 2020, 13(17), 4381; https://doi.org/10.3390/en13174381
Submission received: 1 July 2020 / Revised: 19 August 2020 / Accepted: 20 August 2020 / Published: 25 August 2020
(This article belongs to the Special Issue Integrated Energy Systems and Transportation Electrification)

Abstract

:
Regional integrated energy site layout optimization involves multi-energy coupling, multi-data processing and multi-objective decision making, among other things. It is essentially a kind of non-convex multi-objective nonlinear programming problem, which is very difficult to solve by traditional methods. This paper proposes a decentralized optimization and comprehensive decision-making planning strategy and preprocesses the data information, so as to reduce the difficulty of solving the problem and improve operational efficiency. Three objective functions, namely the number of energy stations to be built, the coverage rate and the transmission load capacity of pipeline network, are constructed, normalized by linear weighting method, and solved by the improved p-median model to obtain the optimal value of comprehensive benefits. The artificial immune algorithm was improved from the three aspects of the initial population screening mechanism, population updating and bidirectional crossover-mutation, and its performance was preliminarily verified by test function. Finally, an improved artificial immune algorithm is used to solve and optimize the regional integrated energy site layout model. The results show that the strategies, models and methods presented in this paper are feasible and can meet the interest needs and planning objectives of different decision-makers.

1. Introduction

A regional integrated energy system (RIES) [1,2] includes many types of energy supply such as cold, heat and electricity. Integrated energy stations and pipelines are important links in the production and transmission of energy. How to optimize its location, quantity and layout through reasonable strategies, models and methods in the planning and design stage [3,4] to obtain better comprehensive benefits is the starting point of this paper.
At present, relevant research in the field of regional integrated energy site selection and layout optimization is just starting, and usually only focuses on one aspect of strategy, model or method. An optimal location identification method based on network constraints for the voltage stability parameters of integrated renewable energy systems was proposed in [5], but did not specifically combine relevant data for simulation verification. In order to balance the volatility and network loss caused by large-scale photovoltaic grid-connection, only the site selection and capacity determination of cogeneration units in the integrated energy system was conducted in [6]. The influence of photovoltaic access to an integrated energy system on site selection and capacity determination is analyzed from the perspective of economic operation. The planning and operation of distribution lines and gas pipelines are considered in [7], and the cold–hot-power unit is used as the hub of electrical coupling. Multi-stage planning and multi-scenario analysis are carried out with the optimization goal of the lowest total investment and operating cost of the integrated energy system. A topology description model of energy system based on energy flow balance constraints and heat network characteristics was established in [8], and then a layout planning model of energy stations and energy supply pipelines was established. The basic framework of the equipment capacity of the regional integrated energy system with economic and environmental protection as the binocular target was established in [9], but did not optimize the design of its quantity and location. A site selection layout planning strategy that considers the collaborative optimization of electrical and thermal loads was proposed in [10,11], and the enumeration method was used to solve the problem, so as to reduce the operating cost of energy stations and pipe networks. However, this method is only suitable for small scale siting problem, once the number of data increases, the computational efficiency of this method will decrease sharply.
The siting and layout of a regional integrated energy system is essentially a class of multi-objective nonlinear programming problems that are difficult to solve by conventional algorithms. As a new intelligent algorithm, the artificial immune algorithm can effectively deal with such large-scale and multi-peak problems by virtue of its diversity generation and maintenance mechanism, which has been verified in other fields. Based on the artificial immune algorithm, internal faults of power transformers were identified in [12] with high detection accuracy. A small current grounding fault line selection method based on the artificial immune algorithm was proposed in [13]. The characteristic components of current fault were taken as antigens and the memory set was obtained through training samples. The line selection results combined with them presented good robustness. In [14], the artificial immune algorithm is adopted to optimize filter parameters, so as to minimize the investment cost of the whole network filter on the premise that the voltage quality of each node in the network conforms to harmonic standards and the filter operates safely and reliably.
However, the artificial immune algorithm has a high dependency on the fitness of a randomly generated population. If the quality of the solution is not good, the algorithm may fall into local optimal and slow down the convergence rate. Therefore, its performance needs to be improved. The artificial immune algorithm and chaos optimization algorithm were combined in [15], to improve its convergence speed and global searchability, which can provide ideas for the economic load distribution of complex power systems. The artificial immune algorithm was improved in two aspects in [16]: The first is mutation self-adaptation, the second is to use the vector distance with threshold limit to calculate the affinity function, which can effectively improve the speed and accuracy of the algorithm in the location of medium-scale logistics distribution.
Aiming at the problems existing in the above references, the artificial immune algorithm is improved in this paper in three aspects: initial population screening mechanism, population renewal and bidirectional crossover-mutation, and its performance is verified through test function. At the same time, an integrated energy site layout planning strategy with decentralized optimization and comprehensive decision making is proposed, and an improved p-median model with multiple objective functions including the number of energy stations to be built, coverage rate and pipeline transmission load capacity is constructed in this paper. Finally, the improved artificial immune algorithm is used for simulation verification, which can provide some ideas and methods for regional energy planning.

2. Site Selection Layout Planning and Design of Regional Integrated Energy System

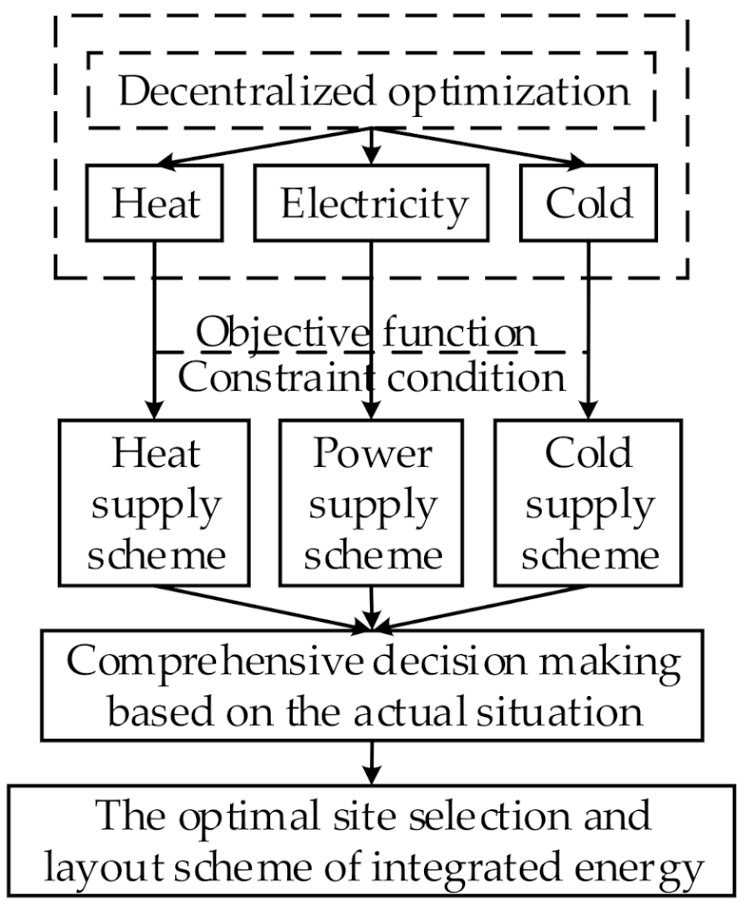
2.1. Site Selection Layout Strategy

The site selection and layout model of the regional integrated energy system not only considers the coordinate distribution of energy stations and demand points, but also takes into account the difference of cold, heat and electric load of each demand point, so its solution process is relatively complex. At the same time, in order to coordinate the comprehensive interests of investors and users, it is often necessary to consider multiple objective functions for optimization, so as to select an optimal compromise scheme for planning and construction. This paper proposes a decentralized optimization and comprehensive decision making (DO-CDM) planning strategy for different types of energy. Meanwhile, vertex, edge and weight matrices are constructed to preprocess the data set for subsequent optimization. The schematic diagram of site layout optimization for regional integrated energy stations is shown in Figure 1.
In Figure 1, according to the objective function and constraint conditions, the site selection and layout of cold, hot and electric loads were optimized respectively to obtain their respective energy supply schemes. Secondly, according to the characteristics (reliability, economy, user coverage, etc.) of integrated energy station and pipe network layout, combined with local topography, climate and other conditions, the decision-makers comprehensively consider and normalize the three schemes as the final optimal site layout scheme of integrated energy.

2.2. Data Preprocessing

Before establishing the mathematical model of integrated energy site selection layout, relevant data shall be preprocessed and the following matrix shall be established:

2.2.1. Vertex Matrix

The candidate integrated energy station and demand point coordinates are coded and the following vertex matrix is established.
P s = ( x s 1 , y s 1 ) ( x s 2 , y s 2 ) ( x s M , y s M ) ,
P d = ( x d 1 , y d 1 ) ( x d 2 , y d 2 ) ( x d N , y d N ) ,
where Ps and Pd are coordinate matrices of candidate integrated energy stations and demand points: (xsi,ysi) is the horizontal and vertical coordinates of the ith candidate integrated energy station, i = 1, 2, …, M; (xdj,ydj) is the horizontal and vertical coordinates of the jth demand point, j = 1, 2, …, N; M and N are the total numbers of candidate energy stations and demand points respectively.

2.2.2. Edge Matrix

According to the vertex matrix, the edge matrix can be formed by calculating the Euclidean distance between each point.
L = d 11 d 12 d 1 N d 21 d 22 d 2 N d M 1 d M 2 d M N ,
d i j = ( x s i x d j ) 2 + ( y s i y d j ) 2 , i M , j N ,
where L is the edge matrix: dij is the distance between the ith candidate energy station and the jth demand point.

2.2.3. Weight Matrix

After constructing the edge matrix, each element is compared with the set threshold value respectively to judge whether the distance between the candidate energy station and the demand point exceeds the allowed range. If so, the corresponding weight is 0.
E = e 11 e 12 e 1 N e 21 e 22 e 2 N e M 1 e M 2 e M N ,
e i j = 1 ,   d i j Q 0 ,   d i j > Q ,
where E is the weight matrix: Q is the threshold value, indicating the upper limit of the distance between the candidate energy station and the demand point served by it; eij is the weight of the ith candidate energy station to the jth demand point. When the distance between them is less than or equal to Q, its value is 1; otherwise, its value is 0.

3. Site Selection Layout Planning Model

In essence, the site selection layout of integrated energy stations is a nonlinear programming (NP) problem with complex constraints and the rational mathematical model is needed to solve the decision variables. p-median model [10] is a commonly used mathematical model in the field of site selection/allocation. Its idea is to select no more than p sites from a number of candidate sites for construction, and make the objective function optimal on the premise of meeting the requirements of each supply point. Therefore, the conventional p-median model can be improved in this paper, so as to be suitable for site selection and layout optimization of integrated energy stations.

3.1. Assumptions

Firstly, in view of the particularity of integrated energy site selection layout optimization problem, the following assumptions are made:
  • The site selection and layout of integrated energy stations are greatly affected by climate, terrain and other environments. This paper conducts a reasonable primary election for the data points, and the subsequent calculation process does not consider the influence of the external environment.
  • It is assumed that the scale and capacity of the integrated energy station can always meet the needs of different types of loads at each demand point.
  • Considering its high initial cost, each integrated energy station needs to meet at least two types of load demands simultaneously. Each energy station can simultaneously supply different types of energy to different demand points.
  • The same type of energy at a demand point can only be supplied by one energy station at most. Different types of energy can be supplied by the same energy station or by different energy stations.

3.2. The Objective Function

In order to optimize the comprehensive benefits of investors and users, this paper optimizes the number of integrated energy stations to be built, coverage rate and transmission load capacity of the pipe network, and normalizes the three objective functions by linear weighting method to establish the total objective function F.

3.2.1. The Number of Integrated Energy Stations to Be Built

The integrated energy station involves many types of energy suppling, its construction cost is high. Therefore, the number of construction should be reduced as much as possible, and the objective function f1 should be set as follows:
f 1 = M M p M ,
where, f1 is the proportion of unbuilt energy stations in the candidate energy stations, so as to keep consistent with the subsequent objective function (namely to obtain the maximum value of the function); M is the number of candidate energy stations; Mp is the actual number of energy stations to be built.

3.2.2. Integrated Energy Station Coverage Rate

Coverage rate is the ratio of the number of demand points covered by energy stations to the total number of demand points, which is used to judge the supply situation of energy stations built to demand points. If the distance between the candidate energy station i and the demand point j is less than the threshold value Q, it is denoted that the demand point j is covered by the energy station i. The coverage of demand point j by energy station i is as follows:
f 2 = i = 1 M j = 1 N e i j N ,
where, f2 represents the coverage rate; eij is 0–1 variable, and its specific meaning is shown in Equation (6).

3.2.3. Transmission Load Capacity of Pipe Network

The pipe network transmission load capacity represents the pipeline transmission load per unit distance under a certain distance between the energy station and the demand point. The larger the value is, the better the economic benefit will be. At the same time, with a certain amount of load, the distance should be as short as possible. The objective function f3 is constructed as follows:
f 3 = 1 i = 1 M j = 1 N d i j H j Z i j ,
where, Hj is a certain type of load corresponding to a single demand point, and the unit is MW; Zij is 0–1 variable, indicating the service demand distribution relationship between the demand point and the energy station. When it is 1, it means that the load demand of the demand point j is supplied by the energy station i, otherwise, Zij = 0; and the premise that Zij = 1 is eij = 1, that is, to choose from the energy stations that meet the threshold constraints; The meanings of other variables are the same as Equations (1)–(4).
The three objective functions are multiplied by their respective weight factors, and the function f3 is normalized to remove dimensionality, and the total objective function F is obtained as follows.
max F = ω 1 f 1 + ω 2 f 2 + ω 3 f 3 f 3 min f 3 max f 3 min ,
where, ω1, ω2 and ω3 are respectively the weights of the three objective functions, and ω1 + ω2 + ω3 = 1 is satisfied.

3.3. The Constraint

i M Z i j 1 , j N ,
Z i j h i , j N , i M ,
i M h i p ,
Z i j , h i { 0 , 1 } , i M , j N ,
where hi is 0–1 variable, when its value is 1, indicating that the candidate energy station i is selected as the site for construction, and conversely, hi = 0; p is the upper limit value of the energy station to be built.

4. Improved Artificial Immune Algorithm

4.1. Improvements

Artificial immune algorithm (AIA) is an emerging intelligent optimization algorithm proposed by Farmer et al. in 1986 based on relevant theories of immunology. Compared with other intelligent algorithms, AIA adopts swarm search strategy and operator mechanism such as mutation and crossover, which keeps the diversity of feasible solutions during iteration and makes it less likely to cause “premature” problems. However, as the algorithm itself needs to deal with more random variables, the convergence rate of AIA as a whole is slow, and the quality of the initial solution has a great influence on the convergence result of AIA. In order to further accelerate the convergence speed and improve the convergence accuracy, this paper improves AIA from the following three aspects:

4.1.1. Initial Population Screening Mechanism

When AIA algorithm generates the initial population, if there is no pre-stored data in the antibody library, it will generate the initial population by random number in default, and then enter the main loop iteration process of the algorithm. However, this approach will not only prolong the iteration time greatly, but also make the initial solution of the algorithm contain a large number of infeasible solutions, which is not conducive to the optimization of the algorithm. The improved artificial immune algorithm (IAIA) proposed in this paper increases the corresponding screening mechanism after the initial population is generated. That is, IAIA performs the primary selection of the random solution through the affinity function of antigen antibody and antibody concentration function, and better solutions are unpacked to the main cycle iteration process, while the rest solutions are abandoned.

4.1.2. Population Renewal Mechanism

The AIA algorithm, after recording the best individuals and the average fitness of the population, then forms the parent group and updates the memory bank. This updating mechanism only allows the population to be compared in each generation, and cannot be compared with the optimal values of other generations, which is one of the reasons for the slow convergence rate of AIA. At the same time, there are a lot of local optimal solutions in the memory bank, which makes the algorithm easy to fall into the local optimal. The IAIA proposed in this paper has been improved to some extent in population regeneration mechanism. Before updating the memory bank, the optimal individual in the current population is compared with the historical optimal solution. If the former is superior to the latter, the memory bank is updated; otherwise, it jumps to the next cycle.

4.1.3. Bidirectional Crossover and Mutation

The analysis of AIA shows that the population’s regeneration mainly depends on crossover and mutation. For example, the higher the probability of cross mutation, the faster the new individuals will be born, and the more obvious the diversity of the population will be. However, if the probability is too high, the previously inherited good genes will be vulnerable to damage, which will directly cause the whole population to become a random search; in addition, the probability is too small, which is not conducive to the generation of new individuals, so that all individuals fall into the local optimal.
To this end, this paper proposes the idea of bidirectional crossover and mutation, and the specific implementation method is as follows: Firstly, the average affinity function of the population is calculated. For individuals whose affinity is greater than the average affinity, a lower probability of crossover and mutation is adopted to make their good genes be transmitted to the next generation with a higher probability. For individuals whose affinity is lower than the average affinity, a high probability of crossover and mutation is adopted, so that they can be eliminated as soon as possible and new individuals can be generated, so that the population has diversity.

4.2. Test Function

In order to compare the performance differences between AIA and IAIA, five test functions are set to compare the optimal function value, convergence algebra and convergence time of the algorithm.
F 1 ( x ) = i = 1 n x i 2 ,
F 2 ( x , y ) = 0.5 sin 2 x 2 + y 2 0.5 [ 1 + 0.001 ( x 2 + y 2 ) ] 2 ,
F 3 ( x , y ) = x 2 + y 2 0.3 cos ( 3 π x ) + 0.3 cos ( 4 π y ) + 0.3 ,
F 4 ( x , y ) = ( x 2 + y 2 ) 0.25 [ sin 2 ( 50 ( x 2 + y 2 ) 0.1 ) + 1 ] ,
F 5 ( x ) = i = 1 n ( x i 2 10 cos ( 2 π x i ) + 10 ) ,
The minimum value of the function F1 is 0. The maximum value of function F2 is 1, and there are many local extreme points near the global optimal solution, which are easy to fall into the local optimal. Function F3 is a multi-peak function and its optimal value is −0.24. The global minimum value of function F4 is 0, and there are multiple extremum points. The function F5 is the same as F4.

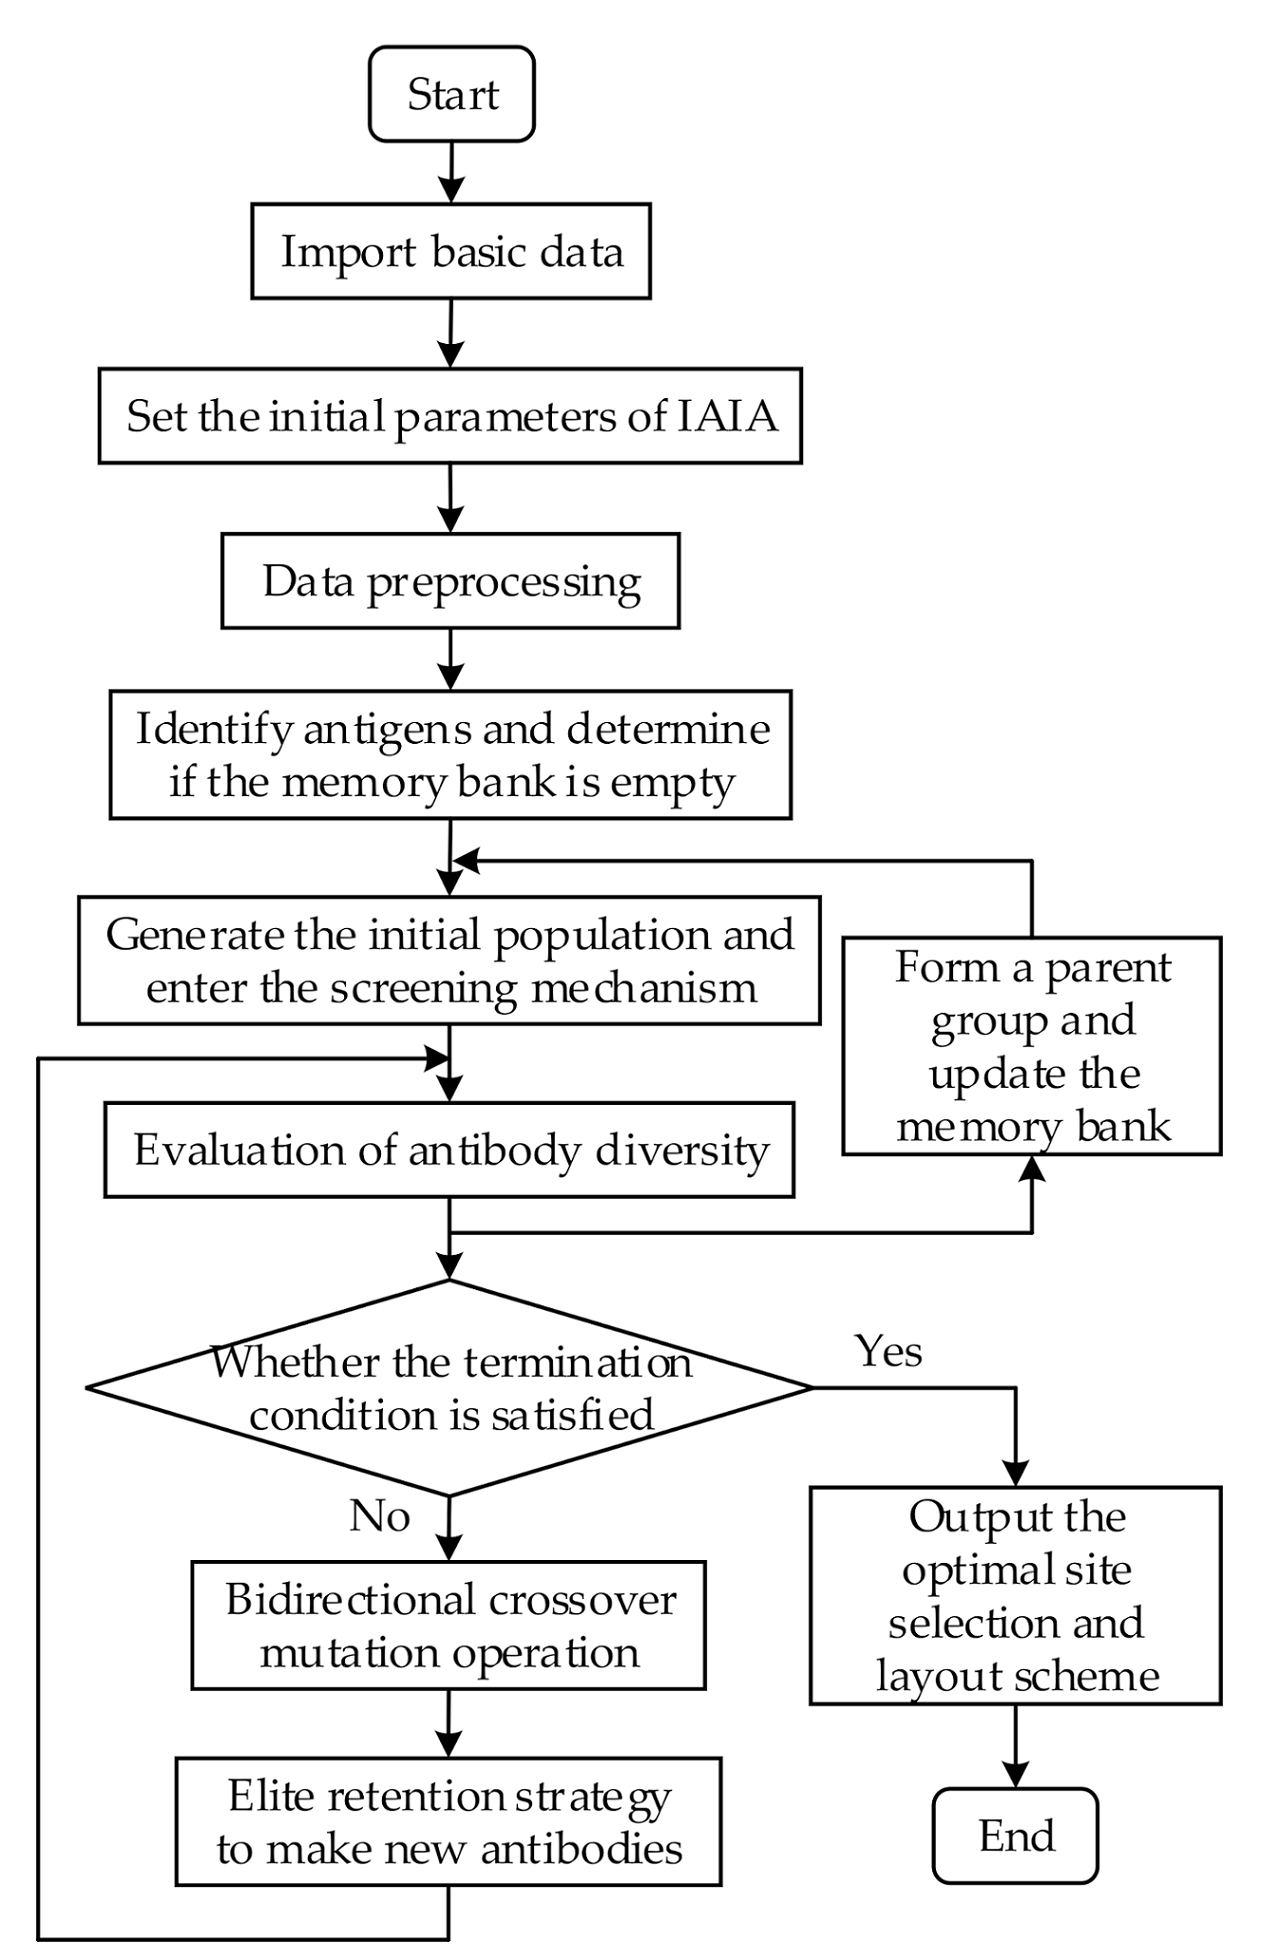
4.3. Optimization Process of Regional Integrated Energy Site Selection Layout Based on IAIA

This paper solves and optimizes the integrated energy site selection layout problem based on the IAIA algorithm to test the improvement effect of this algorithm. The IAIA algorithm uses the linear weighting method to convert the three sub-objective functions into the total objective function. Through iterative optimization, the optimal distribution of integrated energy site and pipe network can be calculated and obtained when the value of the total objective function reaches the maximum. At the same time, by setting different weights, the proportional relations of different sub-functions can be conveniently adjusted, so as to meet the needs of decision-makers for different energy planning schemes. The flow diagram of the program is shown in Figure 2. The specific steps are as follows:
  • Import basic data
The coordinates of candidate energy stations and demand points as well as different types of load of demand points are loaded onto MATLAB platform.
2.
Set algorithm parameters
The population number, maximum iteration number, probability of mutation and crossover operator, dimension, objective function weight factor, distance threshold, etc. of the IAIA algorithm were set.
3.
Data preprocessing
The data are encoded, and the vertex matrix, edge matrix and weight matrix are generated successively in accordance with Equations (1)–(6) for subsequent optimization of the algorithm.
4.
Generate the initial population
Since the number of individuals stored in the initial memory bank is 0, 2m + 2n initial populations are randomly generated through the rand function, and fitness value of the objective function is calculated according to Equations (7)–(10). m + n individuals with good fitness are selected and transferred to step 5.
5.
Main loop iteration process
The diversity of each antibody in the population was evaluated and the antibody numbers corresponding to the optimal and average fitness values were recorded. In each iteration process, the contemporary optimal individual is compared with the historical optimal individual, and the population is updated.
6.
To form the parent generation group and update the memory bank
The updated population was arranged in descending order according to the desired reproductive rate. The first m individuals were selected and stored in the memory bank for the next iteration process to generate the initial population, and the first n individuals were formed into the parent population.
7.
Program termination judgment
Judge whether the algorithm satisfies the termination condition, if so, output the optimal energy station coordinate distribution and pipe network layout, and end the program; otherwise, go to step 8.
8.
Create new populations
According to the calculation results of step 6, bidirectional crossover and mutation were performed on the antibody population, and the new individuals with good fitness values were mixed with the elite individuals extracted from the memory bank as the next generation population.
9.
Perform step 5.

5. Results and Discussion
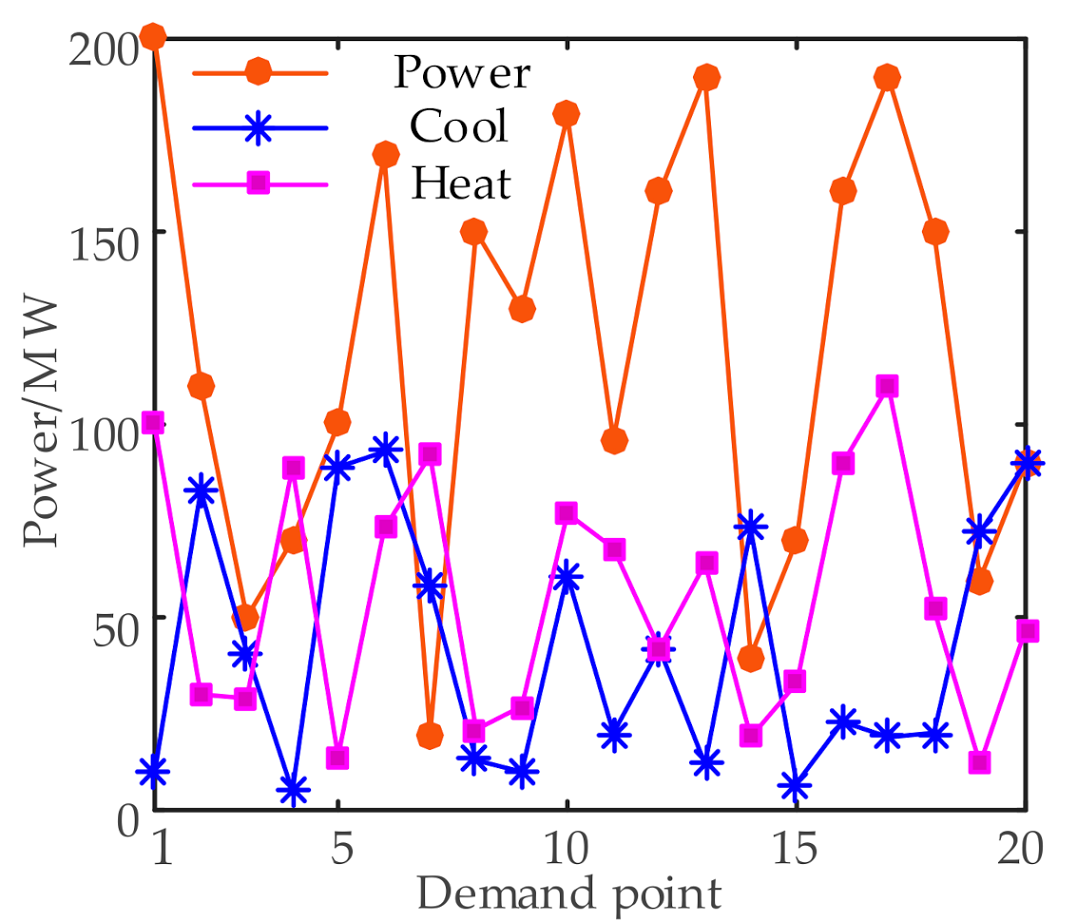
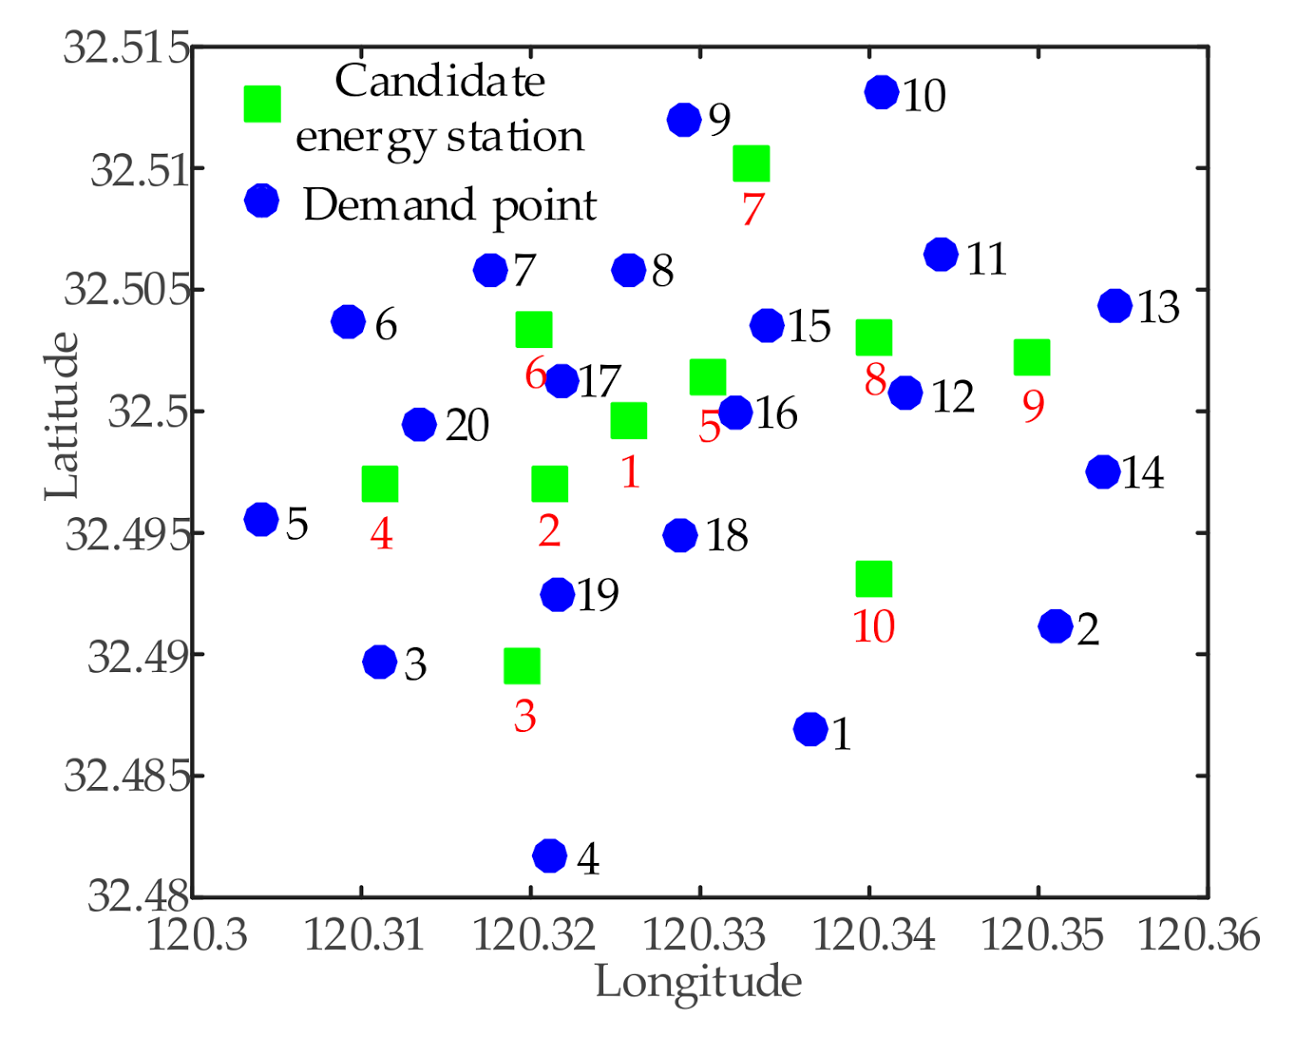
5.1. Basic Data

In this paper, the coordinates of relevant integrated energy stations and demand points, and different types of load capacity of demand points are all derived from actual engineering project data. Among them, there are 10 candidate energy stations and 20 demand points. The coordinate distribution of each point is drawn with the two-dimensional drawing tool of MATLAB, as shown in Figure 3, and different types of load capacity are shown in Figure 4.
In Figure 3, blue dots represent the coordinate distribution of demand points and green squares represent the coordinate distribution of candidate energy stations. The red number is the energy station code and the black number is the demand point code. Horizontal and vertical coordinates are expressed by longitude and latitude respectively. Figure 4 shows the cooling, heating and electric loads at different demand points, which are optimized respectively in this paper and finally made a unified decision.
The parameters setting of IAIA are as follows: The population size is 50; the memory bank capacity is 10; the maximum iteration number is 100; the crossover probability of high affinity is 0.1; the crossover probability of low affinity is 0.4; the mutation probability of high affinity is 0.3; the mutation probability of low affinity is 0.9; the diversity evaluation parameter is 0.95; the distance threshold is 1.2; the initial weight operators are ω1 = 0.2, ω2 = 0.4, ω3 = 0.4.

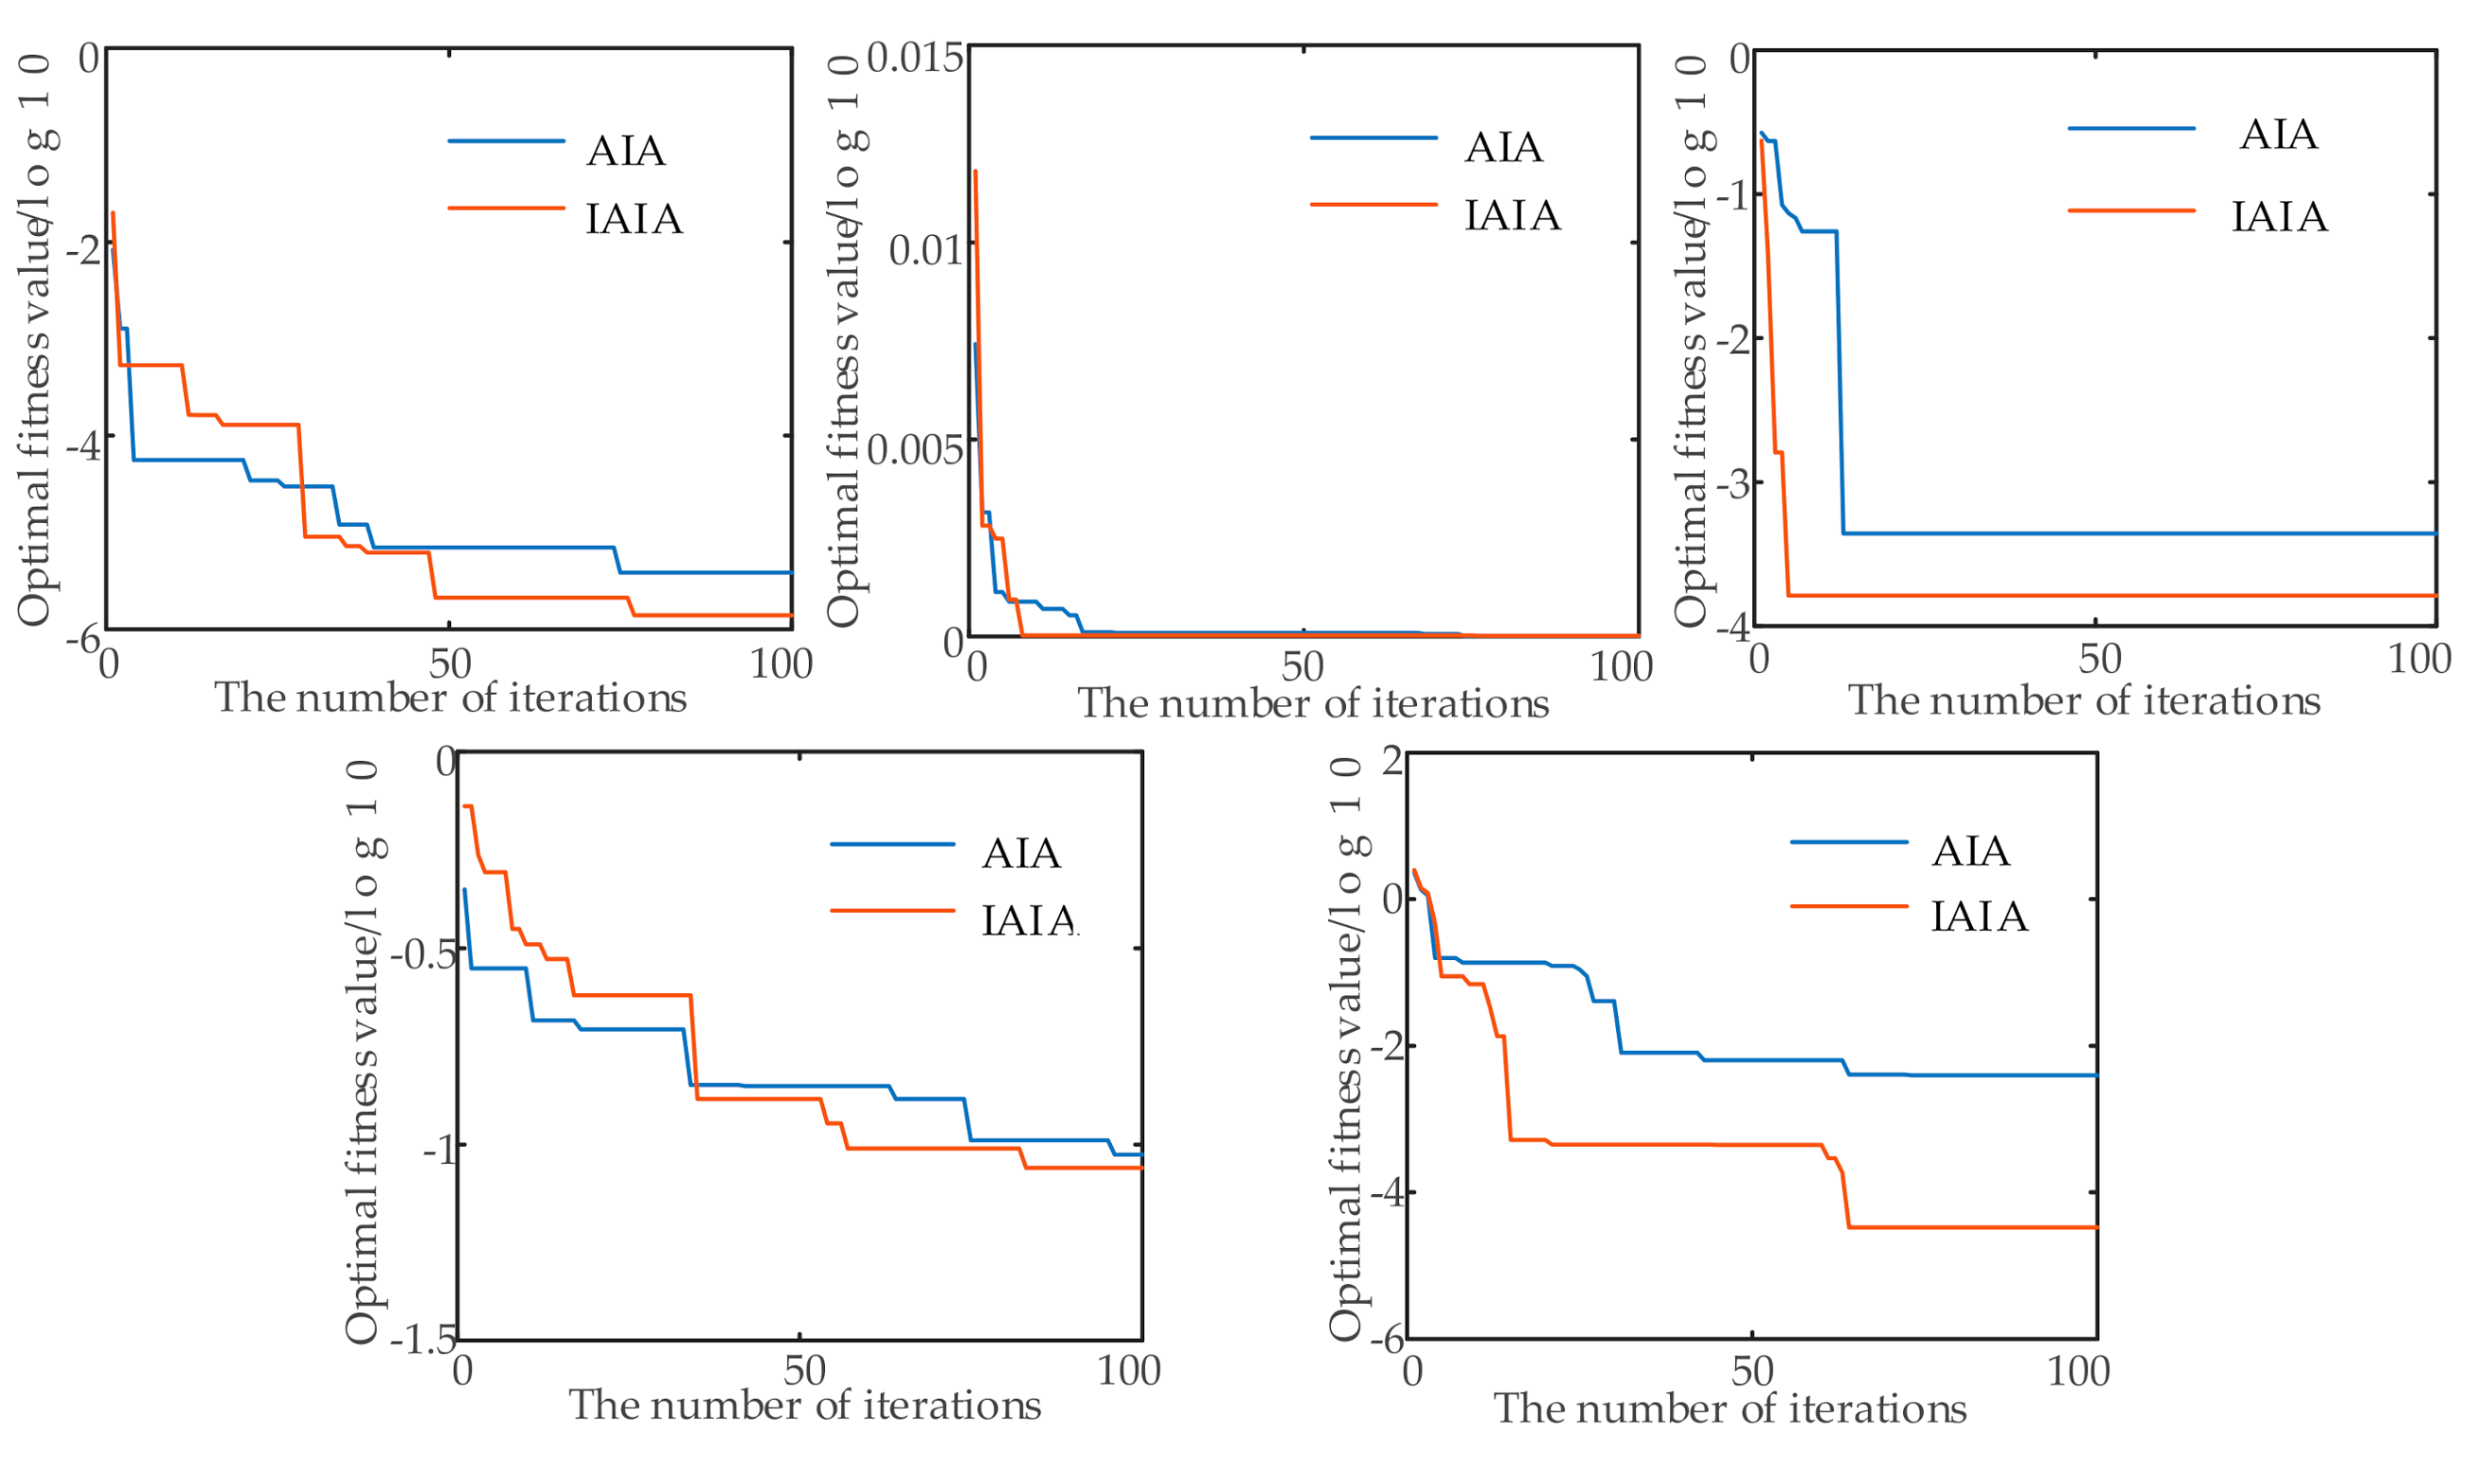
5.2. Test Function Verification

In order to preliminarily test the performance superiority of the improved algorithm proposed in this paper, the AIA algorithm program is compiled to compare with the IAIA algorithm, in which the AIA algorithm has the same parameters as IAIA except that the parameters of crossover and mutation operators are different from those of IAIA. Combining Equations (15)–(19), they are compared from the three aspects of optimal convergence value, convergence algebra and convergence time, as shown in Table 1 and Figure 5.
According to the analysis in Table 1 and Figure 5, compared with the AIA algorithm, the overall convergence accuracy and convergence speed of the proposed IAIA algorithm are significantly improved. In terms of the optimal value, the extreme values of five test functions optimized by the IAIA algorithm are closer to the theoretical extreme values than the AIA algorithm, which indicates that the improved strategy makes the algorithm not likely to fall into the local optimal solution. In terms of convergence algebra, except for the test function F1, the corresponding convergence algebra of other test functions, the IAIA algorithm is lower than the AIA algorithm, which indicates that the algorithm can reach the optimal solution with a faster convergence speed through improvement. The reason for the slow three generations of convergence algebra corresponding to F1 may be that the characteristics of the test function itself affect the overall optimization speed of IAIA; In terms of convergence time, the two algorithms have their own advantages, regardless of their differences.

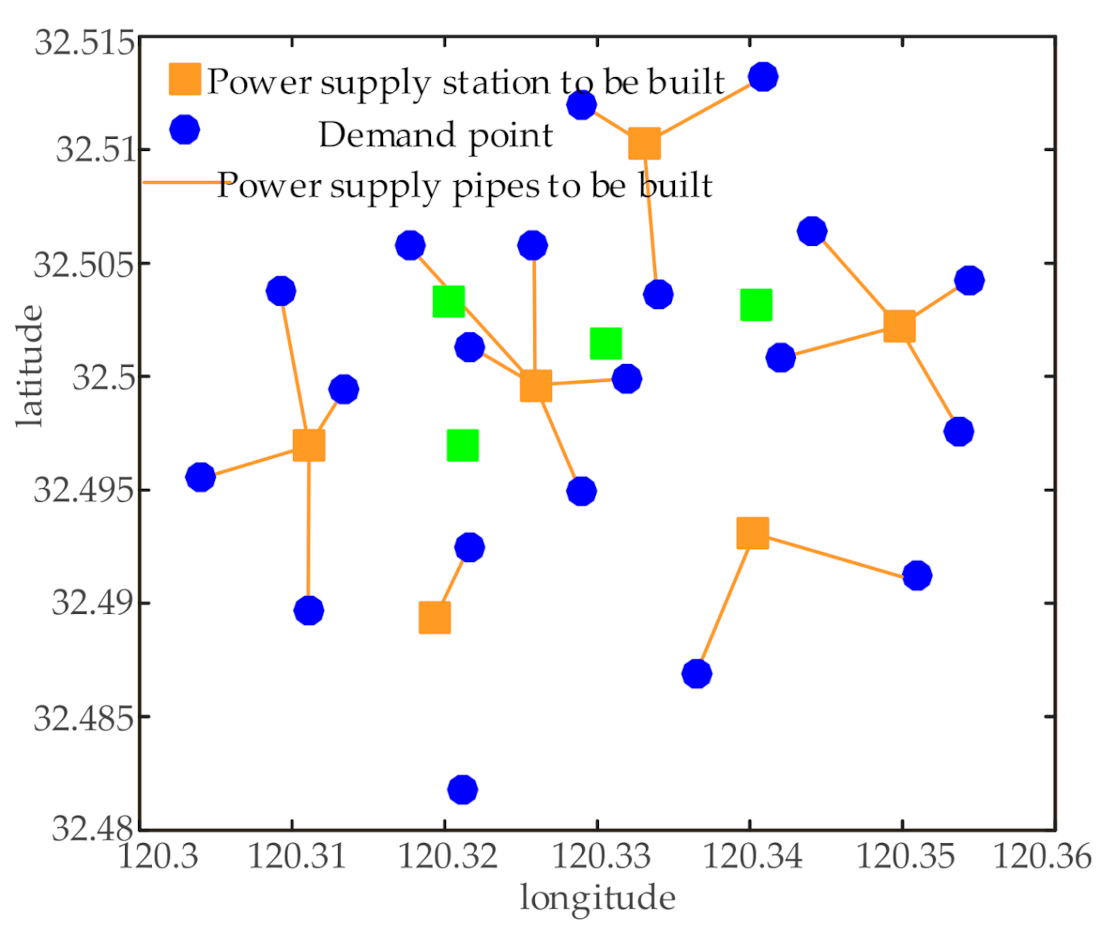
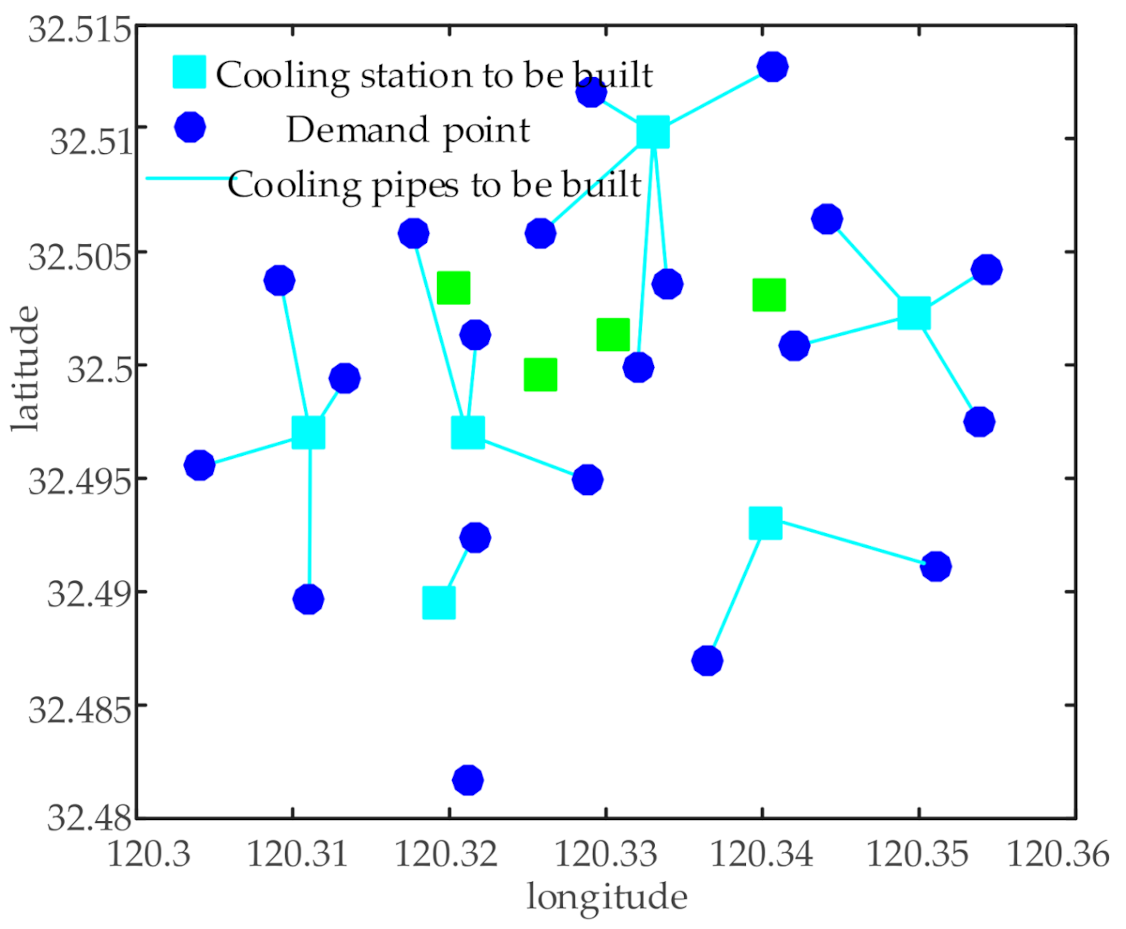
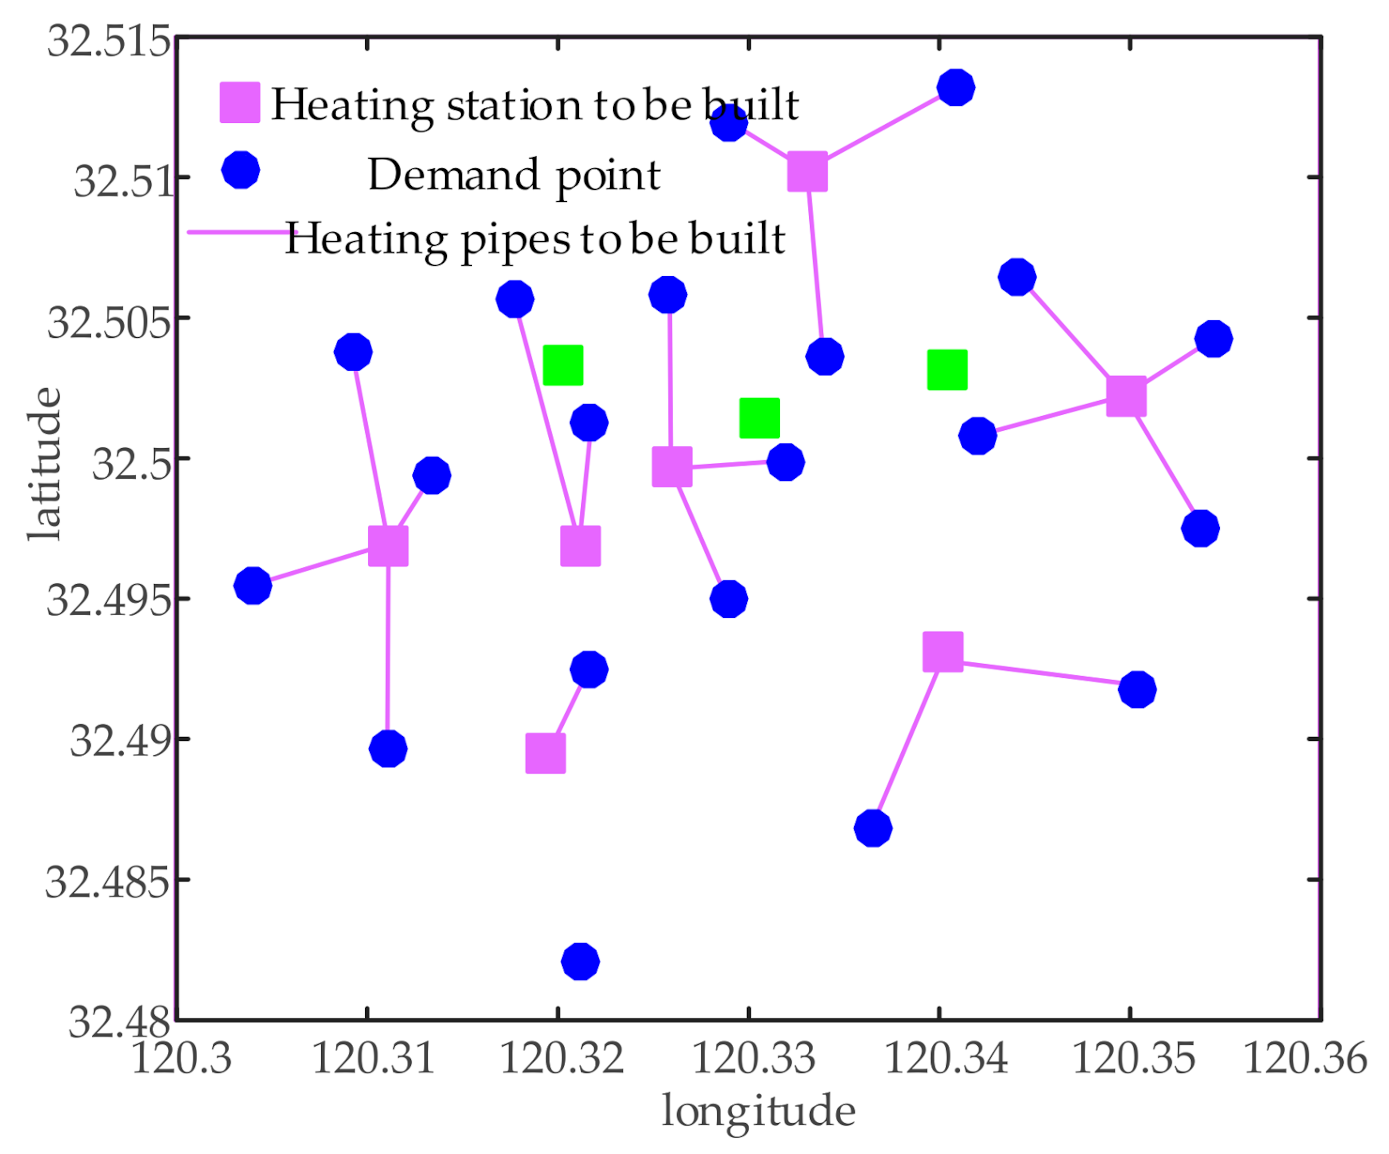
5.3. Verification of Regional Integrated Energy Site Selection Layout Optimization

In this paper, the planning strategy of decentralized optimization and comprehensive decision making is adopted. In other words, different types of energy are optimized according to the site selection and layout model, after getting the respective optimal scheme, and then the comprehensive decision is made according to the actual situation and the needs of all parties. This not only avoids the complexity of energy coupling processing, but also improves the planning efficiency. The IAIA algorithm is used for iterative optimization to obtain the optimal site selection and layout scheme of cold, hot and electrical loads, as shown in Figure 6, Figure 7 and Figure 8.
As can be seen from Figure 6, through the solution and optimization of IAIA, six integrated energy stations are selected in this paper as the cooling stations to be built to meet the cooling demand of each point, and each demand point corresponds to a unique energy station. The specific supply situation of each energy station and pipe network is as follows: 4# energy station supplies 3, 5, 6, 20; 3# energy station supplies 19; 2# energy station supplies 7, 17, 18; 7# energy station supplies 8, 9, 10, 15, 16; 9# energy station supplies 11, 12, 13, 14; 10# energy station supplies 1, 2.
As can be seen from Figure 7, six integrated energy stations are selected as power stations to be built to meet the electricity demand of each point, and each demand point corresponds to a unique energy station. The specific supply situation is as follows: 3#, 4#, 9# and 10# energy stations are the same as the cooling stations, which will not be repeated here. 7# energy station will be changed for supplying 9, 10 and 15, while 2# energy station will be replaced by 1# energy station, supplying 7, 8, 16, 17 and 18.
As can be seen from Figure 8, through algorithm optimization, seven integrated energy stations are selected in this paper as the heating stations to be built to meet the heat demand of each point, and each demand point corresponds to a unique energy station. The specific supply situation is as follows: 3#, 4#, 7#, 9# and 10# energy stations are the same as power supply stations, which will not be repeated here. 1# energy station supplies 8, 16 and 18, 2# energy station supplies 7, 17.
By analyzing the above Figure 6, Figure 7 and Figure 8, it can be concluded that: firstly, the difference between different types of loads capacity significantly affects the site selection and layout planning scheme of each energy source, so it is necessary to carry out decentralized optimization. Secondly, under the premise of ensuring the energy supply–demand of neighboring points, the energy stations to be built tend to be close to demand points with large loads, which can significantly reduce the laying cost of pipelines.
In this paper, heating, cooling and power supply are decomposed into three small-scale MINLP sub-problems. In order to test the correctness of the solution results of the algorithm proposed in this paper, CPLEX solver is used for comparison, as shown in Table 2.
It can be seen from Table 2 that the calculation results of CPLEX and IAIA are completely consistent, and the power supply, heating and cooling schemes are also completely consistent, which verifies the effectiveness of the algorithm proposed in this paper in dealing with such planning problems. At the same time, because there is no need to call the solver, the computation time of the former is shorter than that of the latter, and it can converge to the optimum faster.
After the decentralized optimization of various schemes, the comprehensive decision-making stage is then entered. It can be found from Figure 6, Figure 7 and Figure 8 that under the three energy supply schemes, the locations of most of the energy supply stations are the same, and the energy supply pipelines also overlap a lot. If they are planned and invested according to their own schemes, it will cause great waste of manpower, materials and finances. In this paper, on the premise of satisfying various constraints, the construction of an integrated energy supply station is considered. Different energy sources can be integrated into the same site through cold, heat, power connection and other energy coupling equipment. At the same time, considering that cool and hot air not only have similar time scale and energy characteristics but also are in different supply seasons and not mutually exclusive, the unified construction of composite pipelines can be adopted, so as to reduce the expenditure of various economic costs and improve the comprehensive utilization rate of energy. Among them, the integrated energy station number is the same as that of the heat supply station, and the laying of pipelines shall be carried out in accordance with the laying of power pipelines separately and the composite laying of cold and hot pipelines. Since this paper focuses on site selection optimization, the configuration of specific equipment capacity will not be described. In order to further explain the difference between the comprehensive decision planning scheme and the conventional decentralized planning scheme, the relevant parameters are calculated, as shown in Table 3.
As can be seen from Table 3, through comprehensive decision making, the numbers of energy supply stations and pipelines are reduced by 12 and 16 compared with traditional decentralized schemes, thus effectively reducing economic costs such as investment, operation and maintenance. At the same time, due to the adoption of co-production and co-supply and composite transmission, the coverage rate of the energy supply station and the pipeline transmission load capacity can be effectively improved, thus further illustrating the effectiveness of the decentralized optimization and comprehensive decision-making method proposed in this paper.
In this paper, by adjusting the proportion of each weight factor, the change trend of its influence on the objective function can be studied, so as to provide decision-makers with different site selection layout planning schemes. Different weight allocation schemes are shown in Table 4.
It can be seen from Table 4 that the value of each objective function under different weight ratios is different. The weight factor ω1 has the greatest influence on the total objective function value, and the higher the ratio is, the worse the comprehensive benefit will be. The reason is that although the number of energy stations and investment costs are reduced, they can no longer meet the energy demands of each point, and more and longer pipelines need to be laid for energy transmission, which greatly increases the laying cost and transmission loss maintenance cost. The influence of weight factors ω2 and ω3 on the total objective function value is approximate, and the higher the ratio is, the better the comprehensive benefit will be. Although the initial energy station construction cost is relatively high, from a long-term perspective, it is more in line with the sustainable development and user-centered business philosophy.

6. Conclusions

Aiming at the optimization problem of regional integrated energy (including electricity, heat and cold) site selection layout, this paper proposes a planning strategy of decentralized optimization and comprehensive decision making to reduce the solving complexity of multi-energy coupling and improve the operation speed of the algorithm. Based on certain assumptions and constraints, the three-objective functions of the number of integrated energy stations to be built, coverage rate and network transmission load capacity are established, and the linear weighting method is used to normalize multiple objective functions. In this paper, AIA is improved in three aspects of population initialization, population renewal and bidirectional crossover and mutation, and the convergence performance of IAIA is tested through five test functions and actual engineering data. The simulation results show that IAIA has better convergence precision and convergence speed than AIA. The method, model and strategy proposed in this paper can significantly reduce the economic cost of the integrated energy siting layout process and improve the load transmission capacity. By adjusting the proportion of weights, the requirements of decision-makers for different energy supply planning schemes can be effectively satisfied. The future research work of this paper mainly focuses on the following aspects: considering the influence of different terrain conditions and pipeline transmission loss on energy station site selection layout, how to optimize the distribution of energy flow at energy coupling nodes, and others.

Author Contributions

Conceptualization, J.Z. and Y.X.; methodology, J.Z.; software, J.Z.; validation, Y.X.; formal analysis, J.Z. and Y.X.; investigation, J.Z.; resources, Y.X.; data curation, J.Z.; writing—original draft preparation, J.Z.; writing—review and editing, J.Z.; visualization, Y.X.; supervision, Y.X.; project administration, Y.X.; funding acquisition, Y.X. All authors have read and agreed to the published version of the manuscript.

Funding

This research was funded by “National Natural Science Foundation Fund of China, grant number 51807064” and “National Key Research & Development Program of China, grant number 2016YFB0900203”.

Conflicts of Interest

The authors declare no conflict of interest.

References

  1. Liu, L.; Wang, D.; Hou, K.; Jia, H.J.; Li, S.Y. Region model and application of regional integrated energy system security analysis. Appl. Energy 2020, 260, 114268. [Google Scholar] [CrossRef]
  2. Jia, H.; Wang, D.; Xu, X.; Yu, X.D. Research on some key problems related to integrated energy systems. Autom. Electr. Power Syst. 2015, 39, 198–207. [Google Scholar]
  3. Tian, Y.; Liao, Q.; Liu, D.; Zhu, Z.; Peng, S.; Xu, Y. Planning of urban distribution network considering the integrated energy supply-side reform. Power Syst. Technol. 2016, 40, 2924–2934. [Google Scholar]
  4. Li, L.; Jiajia, H.; Huazhen, C.; Chong, G.; Xu, Z.; Junxi, Z.; Wei, C. Distribution network planning strategy based on integrated energy collaborative optimization. Power Syst. Technol. 2018, 42, 1393–1400. [Google Scholar]
  5. Ranjan, S.; Abhyankar, A.R. An approach for site selection to integrate renewable energy sources based on power system parameters. In Proceedings of the 2019 North American Power Symposium (NAPS), Wichita, KS, USA, 13–15 October 2019; pp. 1–6. [Google Scholar]
  6. Drauz, S.R.; Spalthoff, C.; Würtenberg, M.; Kneikse, T.M.; Braun, M. A modular approach for co-simulations of integrated multi-energy systems: Coupling multi-energy grids in existing environments of grid planning & operation tools. In Proceedings of the 2018 Workshop on Modeling and Simulation of Cyber-Physical Energy Systems (MSCPES), Porto, Portugal, 10–14 April 2018; pp. 1–6. [Google Scholar]
  7. Chao, Q.; Dong, X.; Jiang, T. Optimization planning of integrated electricity-gas community energy system based on coupled CCHP. Power Syst. Technol. 2018, 42, 2456–2466. [Google Scholar]
  8. Xu, C.S.; Dong, S.F.; Wu, J.C.; Han, R.J.; Shou, T.; Li, J.B. Planning of energy station and pipeline considering topological characteristics of regional integrated energy system. Autom. Electr. Power Syst. 2020, 44, 74–86. [Google Scholar]
  9. Guan, L.; Cheng, P.; Tang, Z.; Chen, X.; Jiang, Z. Integrated energy station design considering cold and heat storage. Power Syst. Technol. 2016, 40, 2934–2943. [Google Scholar]
  10. Wang, X.; Sun, J.; Yi, W. P-median model based optimization of energy supply station sites and pipelines layout for integrated energy system. In Proceedings of the 2nd IEEE Conference on Energy Internet and Energy System Integration (EI2), Beijing, China, 20–22 October 2018; pp. 1–6. [Google Scholar]
  11. Yi, W.; Yu, Y.; Zhang, Y.; Li, Z.; Huang, Y. P-median model based optimal planning of energy station for regional integrated energy systems. Autom. Electr. Power Syst. 2019, 43, 107–113. [Google Scholar]
  12. Zhou, A.H.; Zhang, B.D.; Zhang, H.X. Power transformer fault diagnosis by using the artificial immune classification algorithm. High Volt. Eng. 2007, 33, 77–80. [Google Scholar]
  13. Pang, Q.L.; Sun, T.J.; Liao, L.; Qin, W.G. Artificial immune algorithm based faulty line detection method for indirectly grounding power system. Power Syst. Prot. Control 2009, 37, 27–31. [Google Scholar]
  14. Li, X.W.; Zhao, H.W.; Li, N.; Shen, X.D.; Wang, L.P. Optimal filter configuration for distribution network based on artificial immune algorithm. Power Syst. Technol. 2010, 34, 104–108. [Google Scholar]
  15. Meng, W.C.; Qiu, J.J.; Bian, X.M. Artificial immune algorithm integrated with chaotic optimization for economic dispatch of power system. Power Syst. Technol. 2006, 23, 41–44. [Google Scholar]
  16. Ping, H.; Song, C.; Jiang, J.Q. Application of self-adaptive mutation immune algorithm in logistics distribution. J. Inn. Mong. Univ. Natl. Nat. Sci. 2017, 32, 406–411. [Google Scholar]
Figure 1. Schematic diagram of regional integrated energy site layout optimization.
Energies 13 04381 g001
Figure 2. Regional integrated energy site layout optimization flow chart based on the improved artificial immune algorithm (IAIA).
Energies 13 04381 g002
Figure 3. Coordinate distribution map.
Energies 13 04381 g003
Figure 4. Cold, hot and electric load.
Energies 13 04381 g004
Figure 5. The test functions iterative convergence diagram of IAIA and AIA.
Energies 13 04381 g005
Figure 6. Optimal cool supply site selection and layout scheme.
Energies 13 04381 g006
Figure 7. Optimal power supply site selection and layout scheme.
Energies 13 04381 g007
Figure 8. Optimal heat supply site selection and layout scheme.
Energies 13 04381 g008
Table 1. IAIA and artificial immune algorithm (AIA) performance tests.
Test FunctionsAlgorithmOptimal ValueConvergence AlgebraConvergence Time/s
F1IAIA1.402 × 10−6781.957
AIA3.847 × 10−6752.070
F2IAIA1101.508
AIA1211.366
F3IAIA−0.236171.437
AIA−0.1584151.431
F4IAIA0.08712821.373
AIA0.09428971.566
F5IAIA3.354 × 10−5641.338
AIA0.00396641.519
Table 2. Comparison of IAIA and CPLEX results.
Performance IndicatorsIAIACPLEX
Total objective function0.84160.8416
Computation time/s123.36169.81
Convergence algebra79
Table 3. Comparison of parameters under two schemes.
Related ParametersComprehensive Decision PlanningConventional Decentralized Planning
Number of energy supply stations 719
Number of energy supply pipes4157
Investment costs/ten thousand RMB897.8471662.326
Operation and maintenance cost/ten thousand RMB·year−1139.947184.354
Site and pipe coverage120%95%
Transmission load capacity of pipe network/MW·km18,110.4514,708.05
Table 4. Function values under different weights.
Proportion of Weightsf1f2f3F
(0.8, 0.1, 0.1)0.90.350.33530.7885
(0.1, 0.8, 0.1)0.40.950.95390.8954
(0.1, 0.1, 0.8)0.40.950.95390.8981
(0.33, 0.34, 0.33)0.40.900.92460.7431

