Taxonomic Analysis of the Diversity in the Level of Wind Energy Development in European Union Countries


Abstract
1. Introduction
2. Literature Review
3. Materials and Methods
3.1. Data Sources
3.2. Taxonomic Methods
3.2.1. Ward’s Method
3.2.2. The Wroclaw Taxonomic Methods
3.3. Ranking Methods—TOPSIS Method
- It is assumed that all diagnostic variables will be treated as stimulants or de-stimulants. The values of features that are nominative are transformed into the corresponding stimulant values by means of transformation:where —value of the j-th denominator observed for the j-th object; —the nominal value of the j-th variable.
- Determination of the normalized data matrix using the standardization procedure according to the formula:where is the mean value of j-th primary variable, while is the deviation of the standard j-th variable.
- Determining the coordinate values for the standard vector (ideal solution) for the optimal values of diagnostic variables and coordinates of the anti-template vector a ^—(anti-ideal solution) for the worst values of diagnostic variables according to the formulas:where is a set of stimulants, and is a set of de-stimulants.
- Calculation of the distance of the i-th examined object from the and anti-pattern . The Generalized Distance Measure (GDM) was used in the calculations:where is the index (number) of the pattern object, and is the index (number) of the anti-pattern object.
- Determination of the aggregate measure (ranking factor) determining the degree of similarity of the examined objects to the ideal solution in accordance with the formula:For i = 1, …, m, where .
- Determination of the final ranking for the examined objects (EU countries) depending on the value of the measure . The higher the values of the calculated synthetic index, the higher the ranking country in the ranking.
4. Research Results
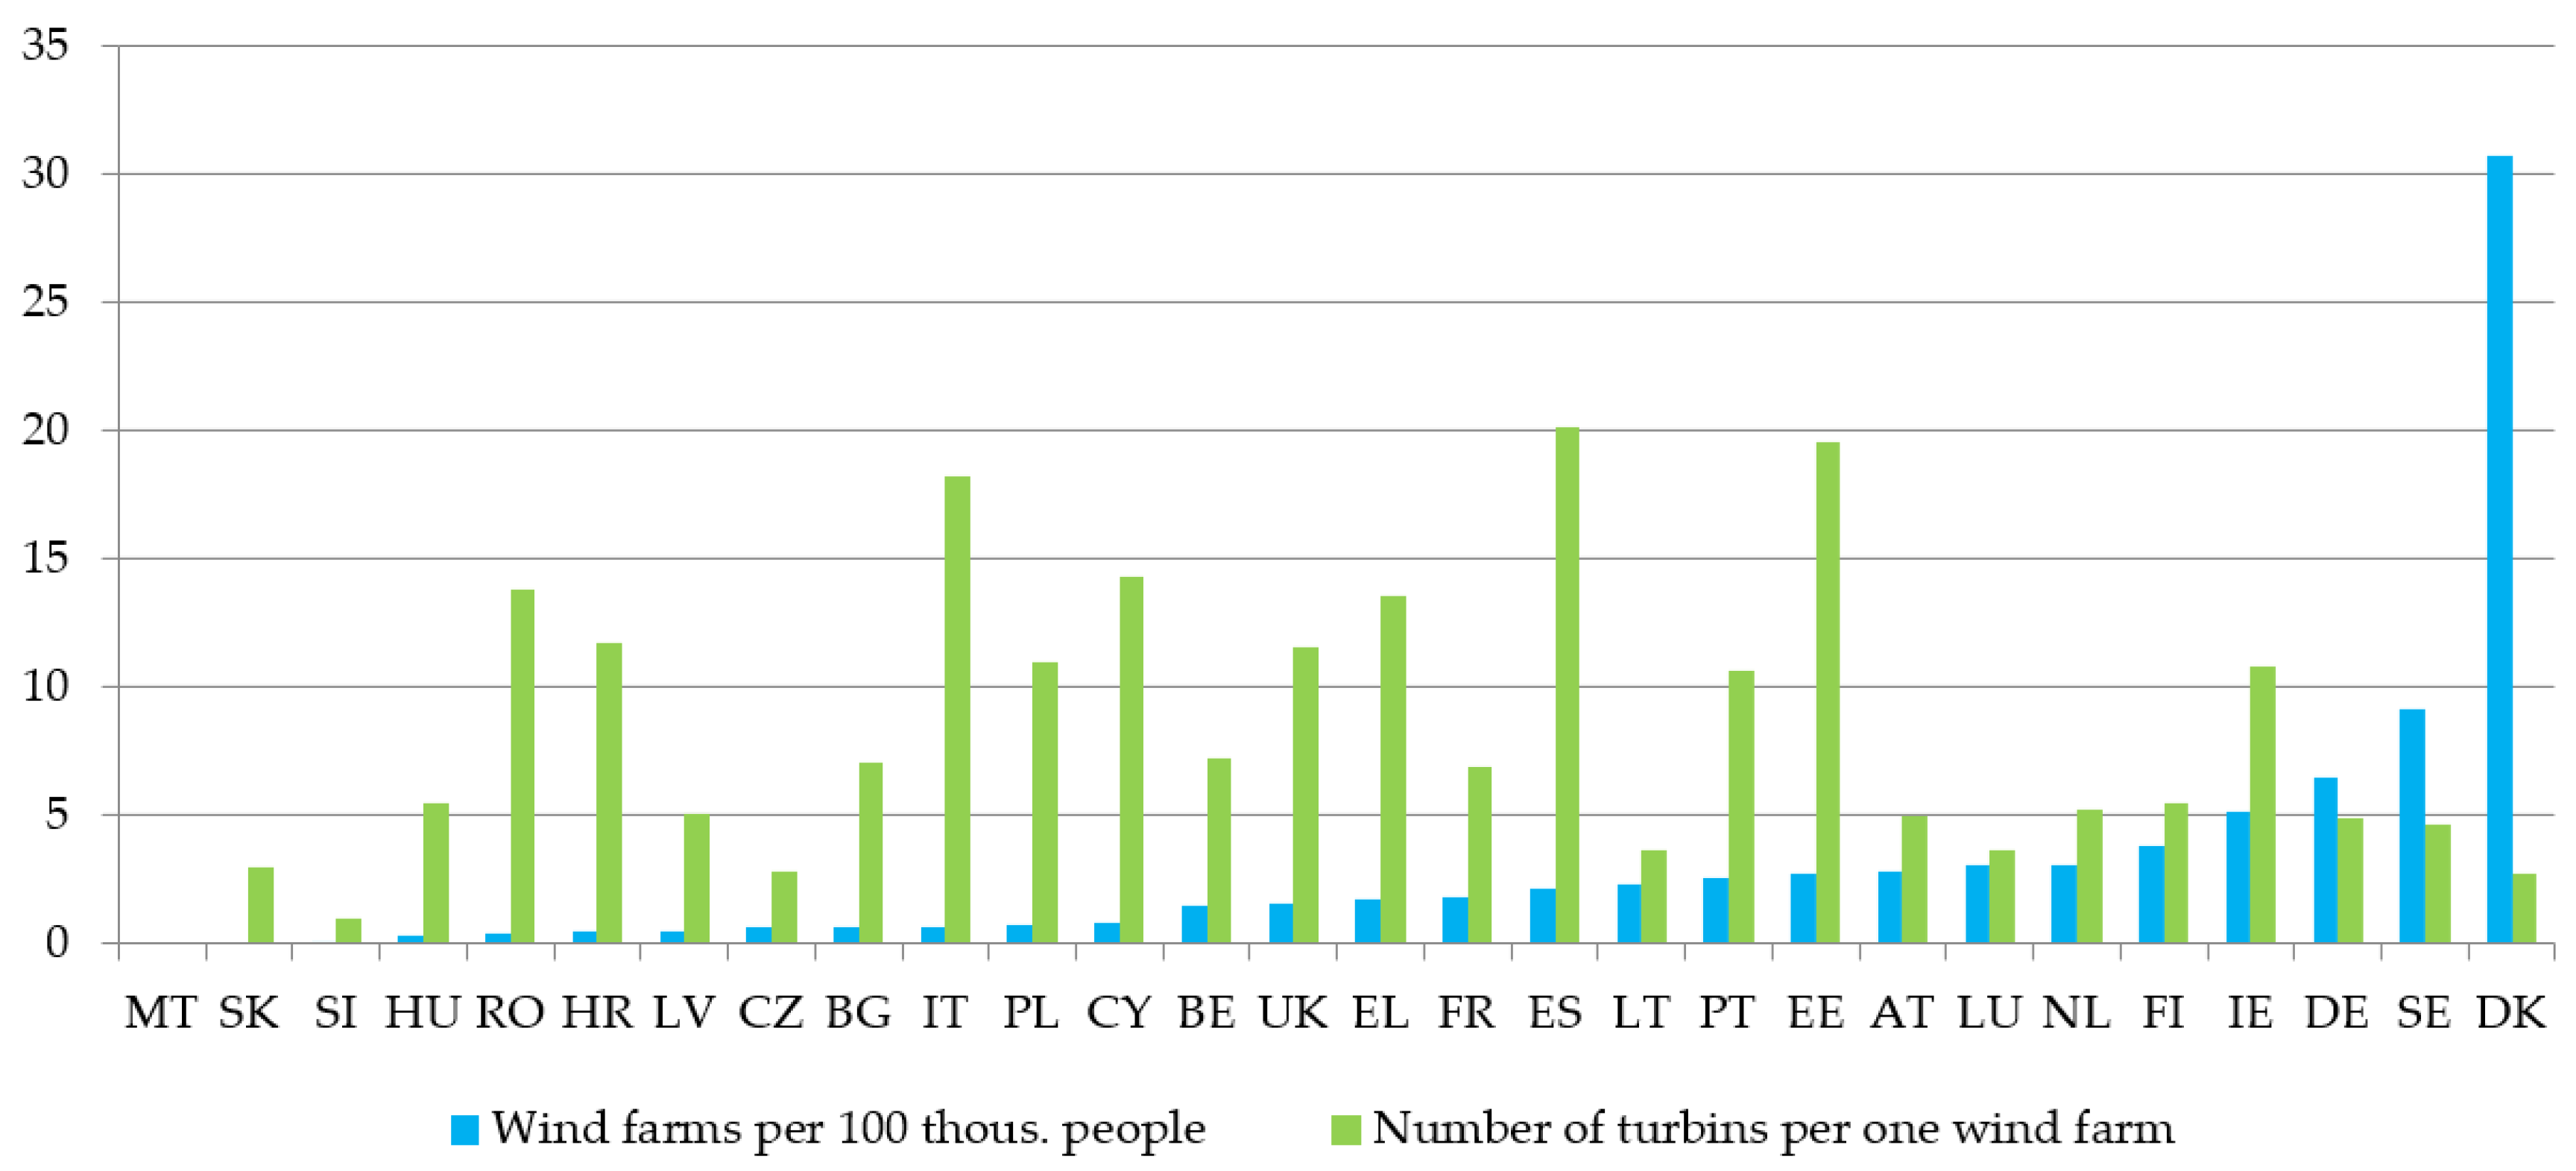
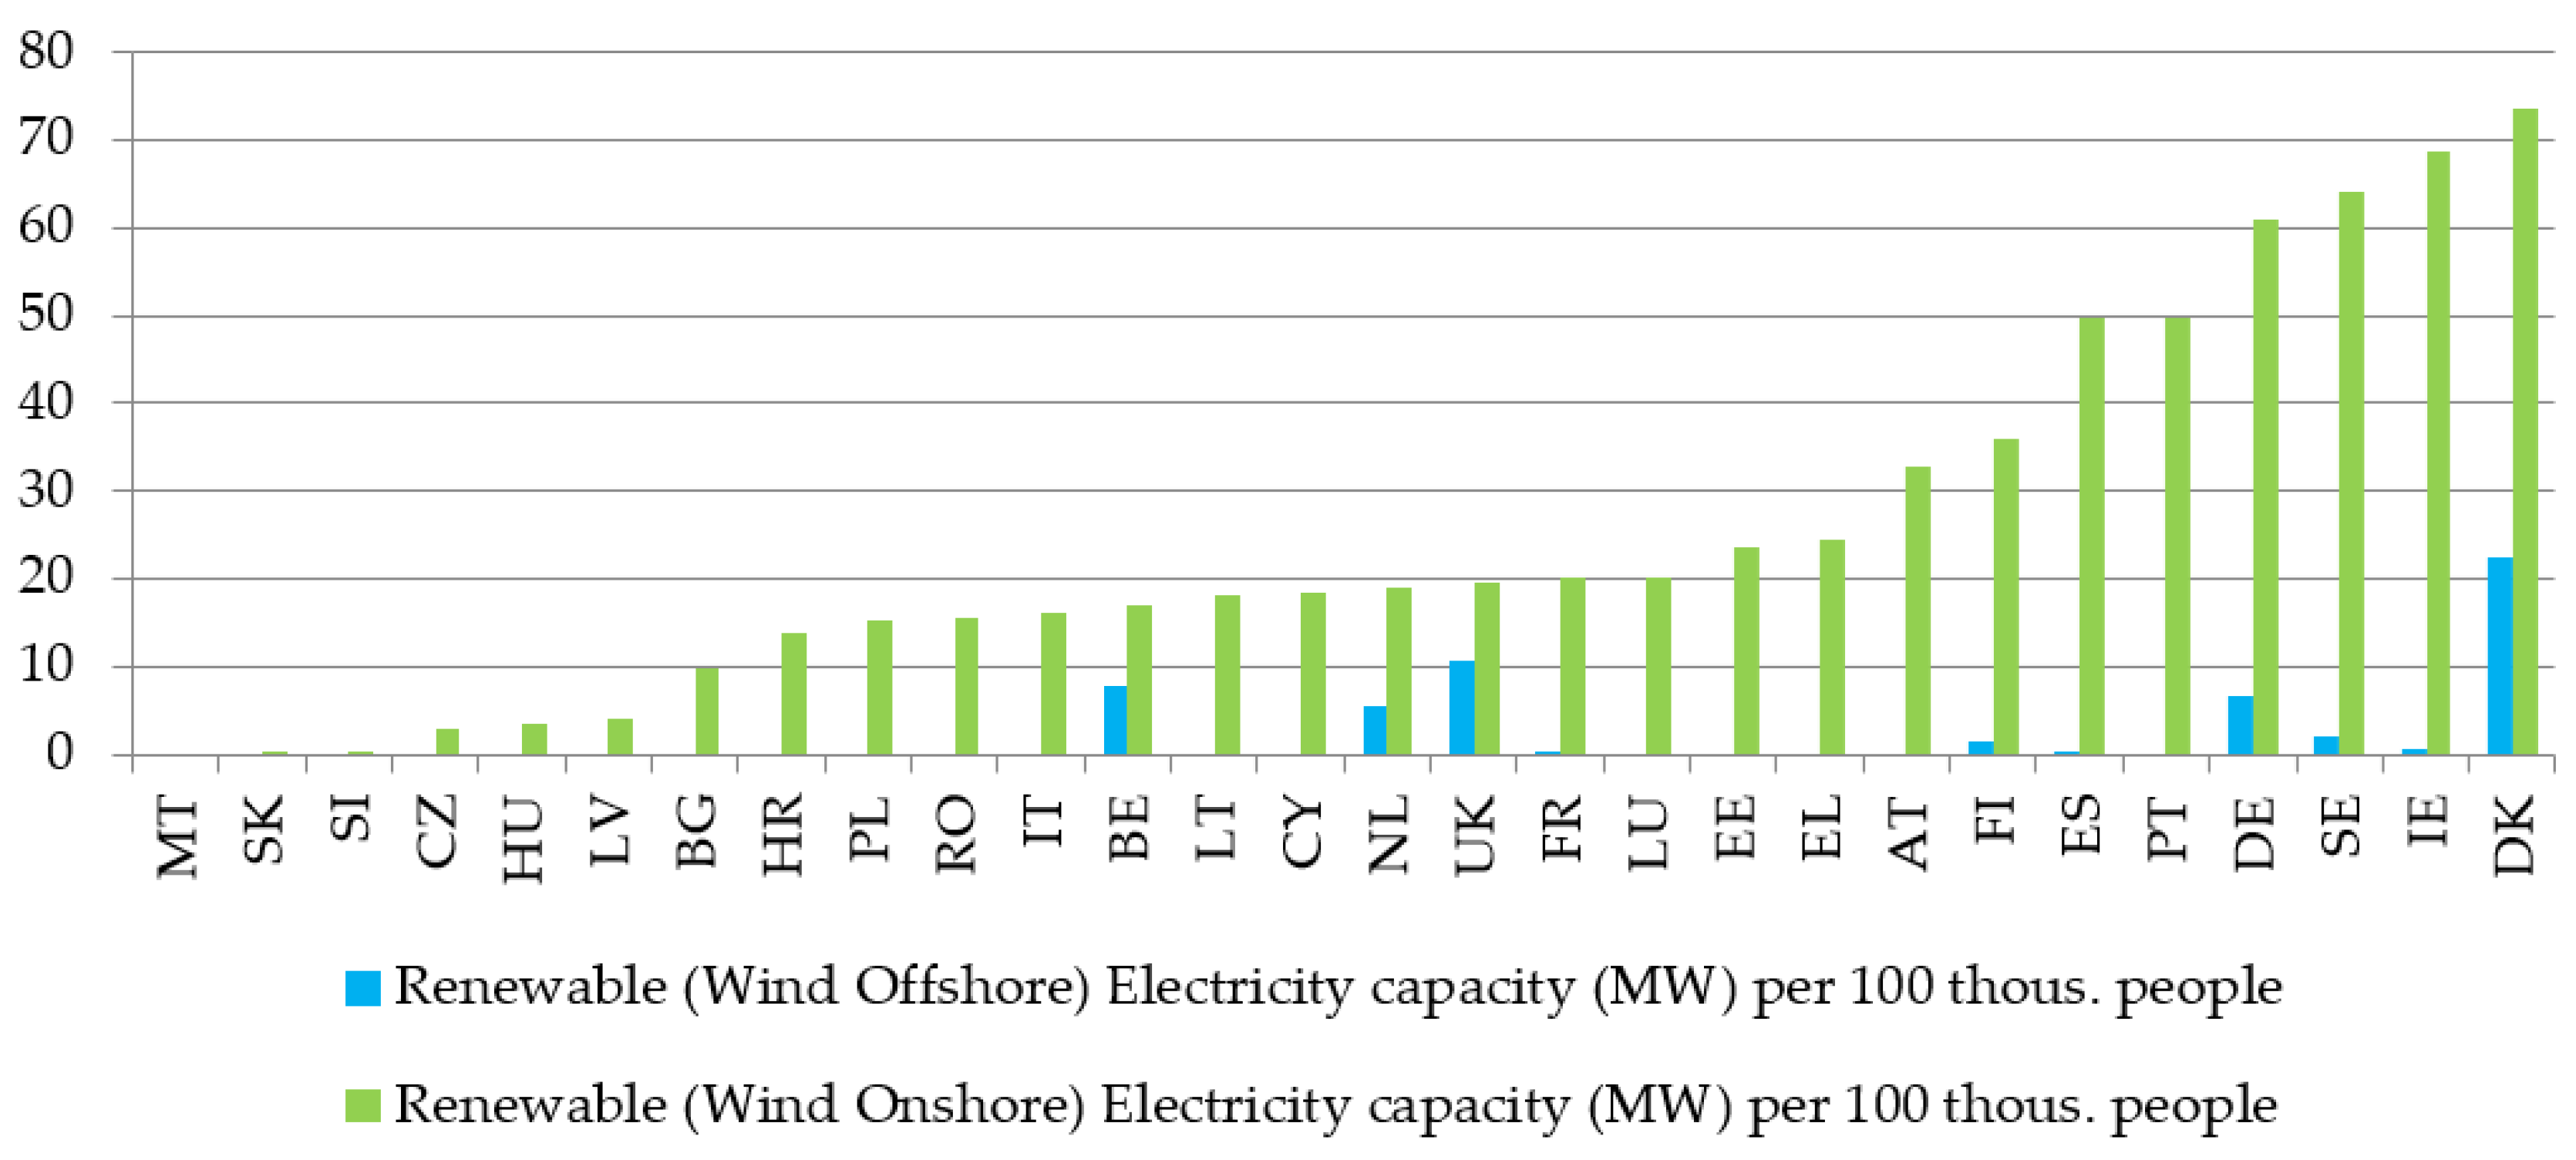
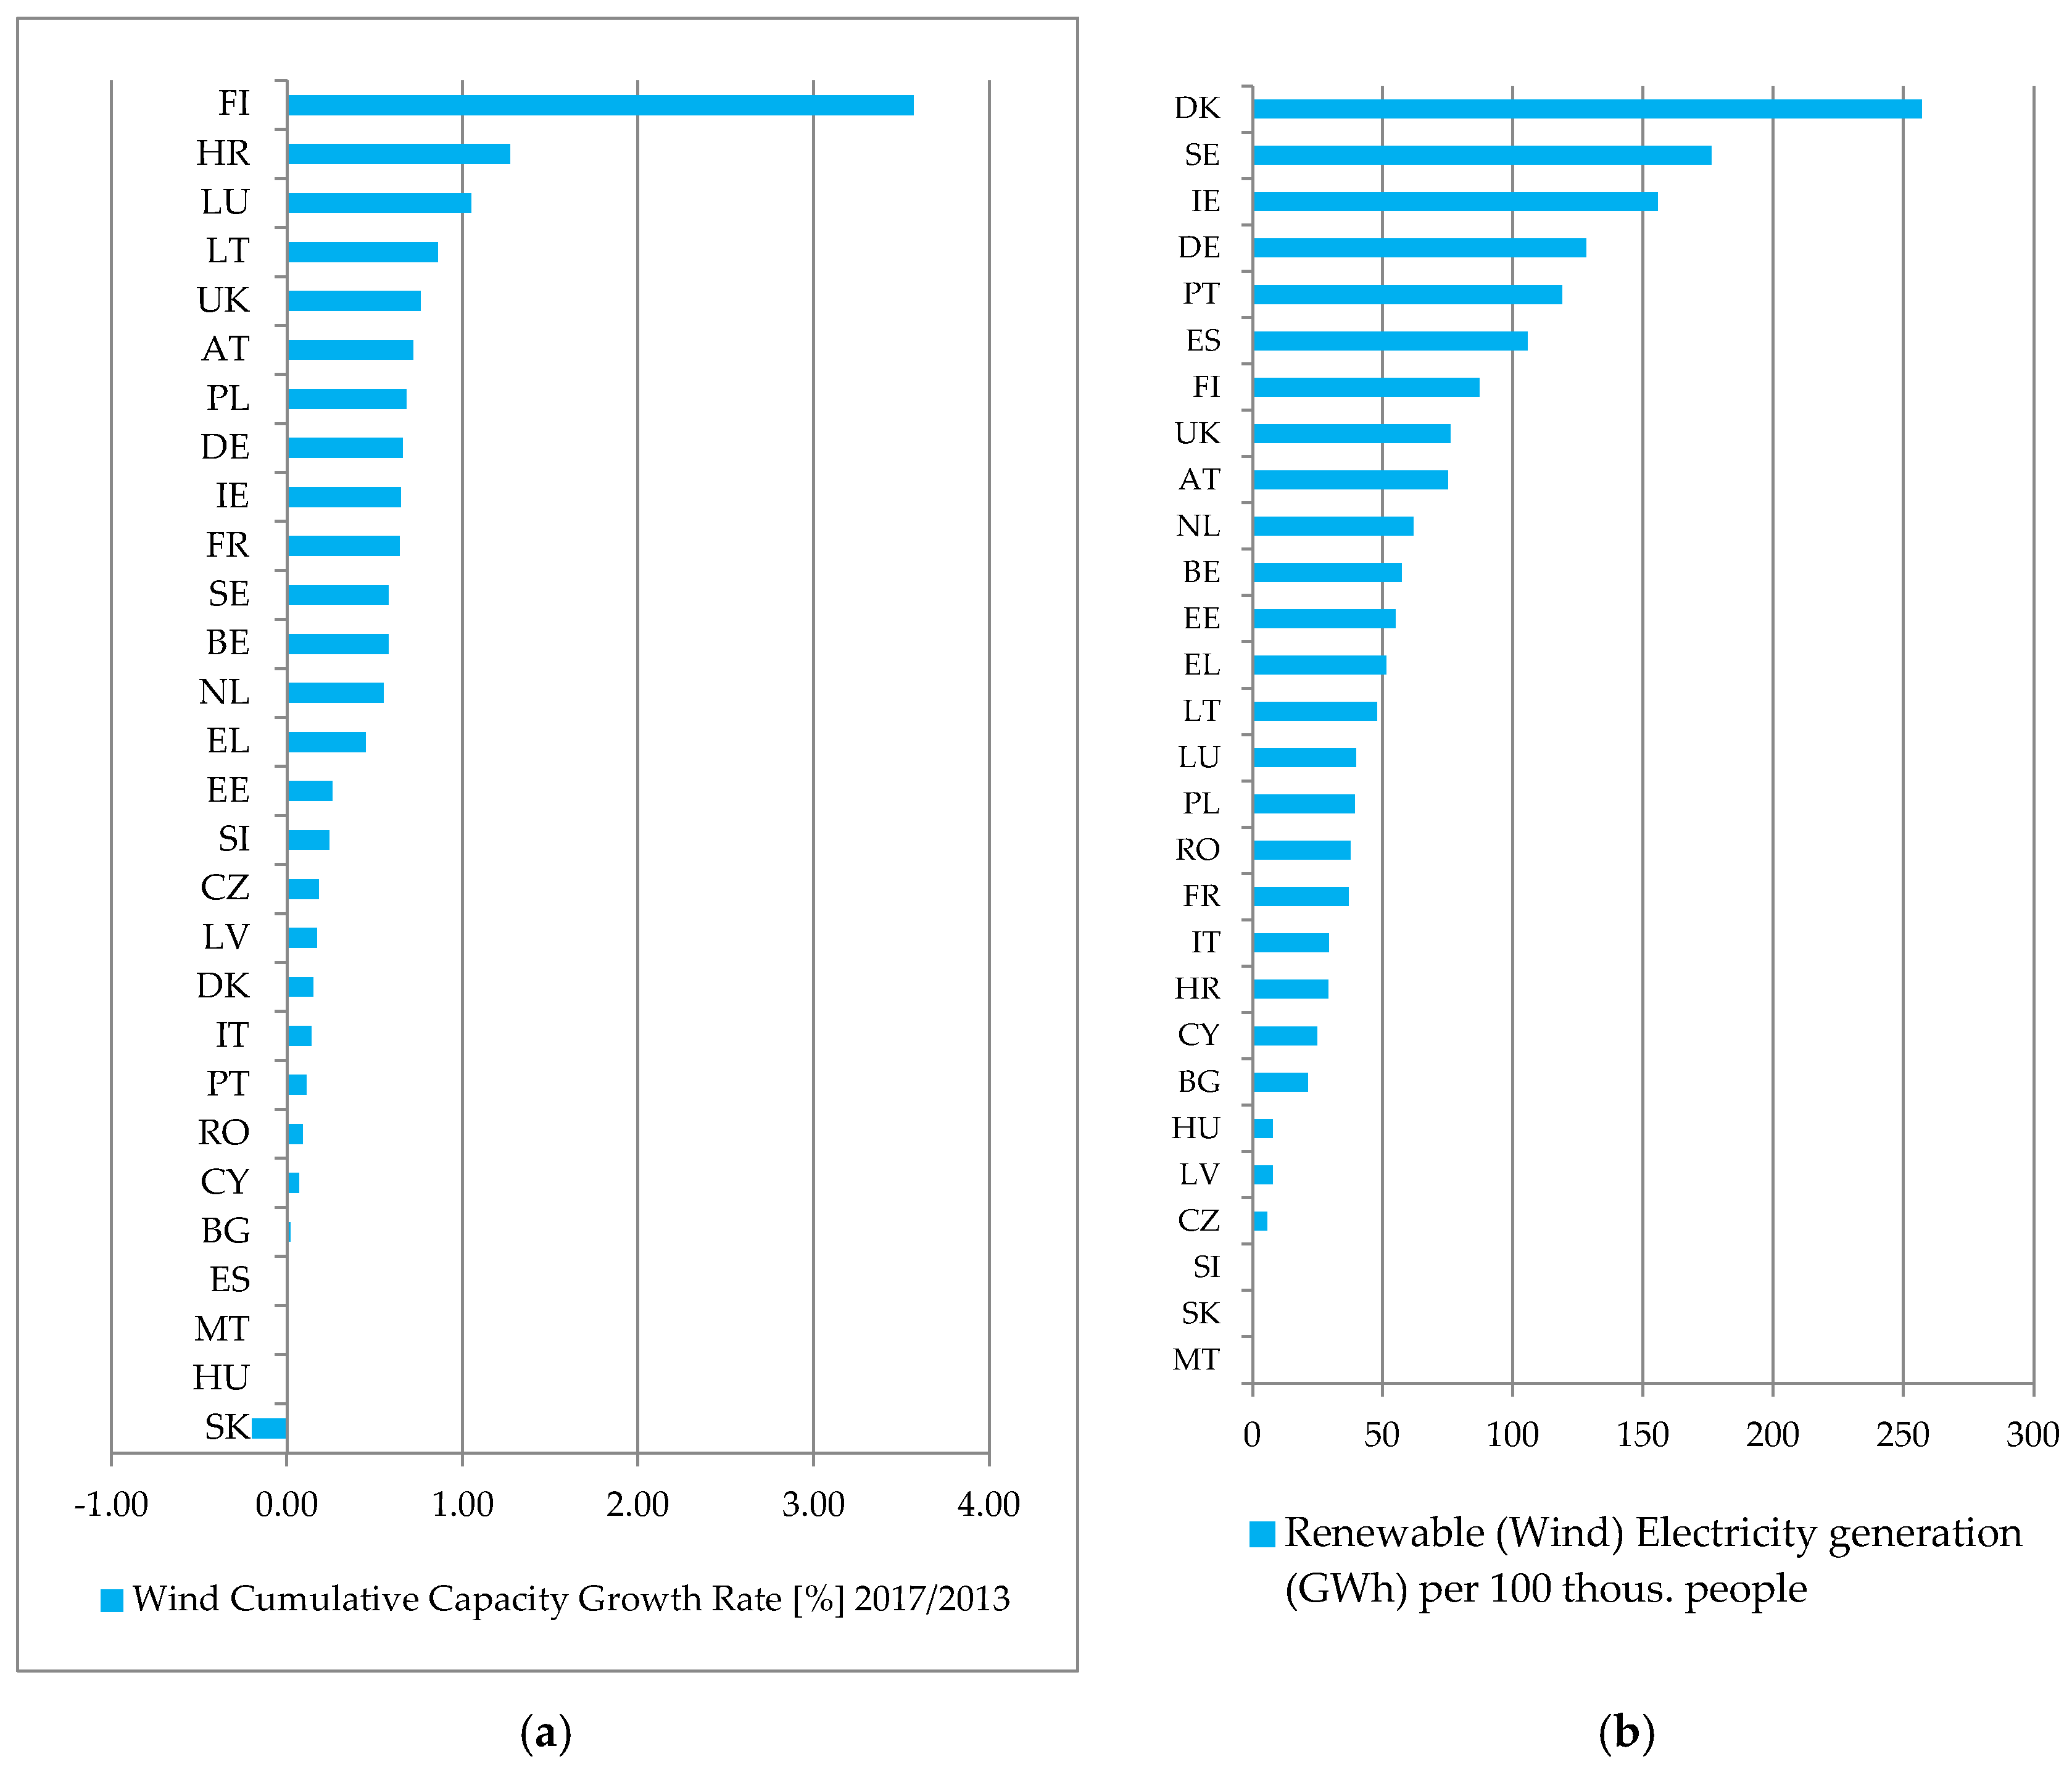
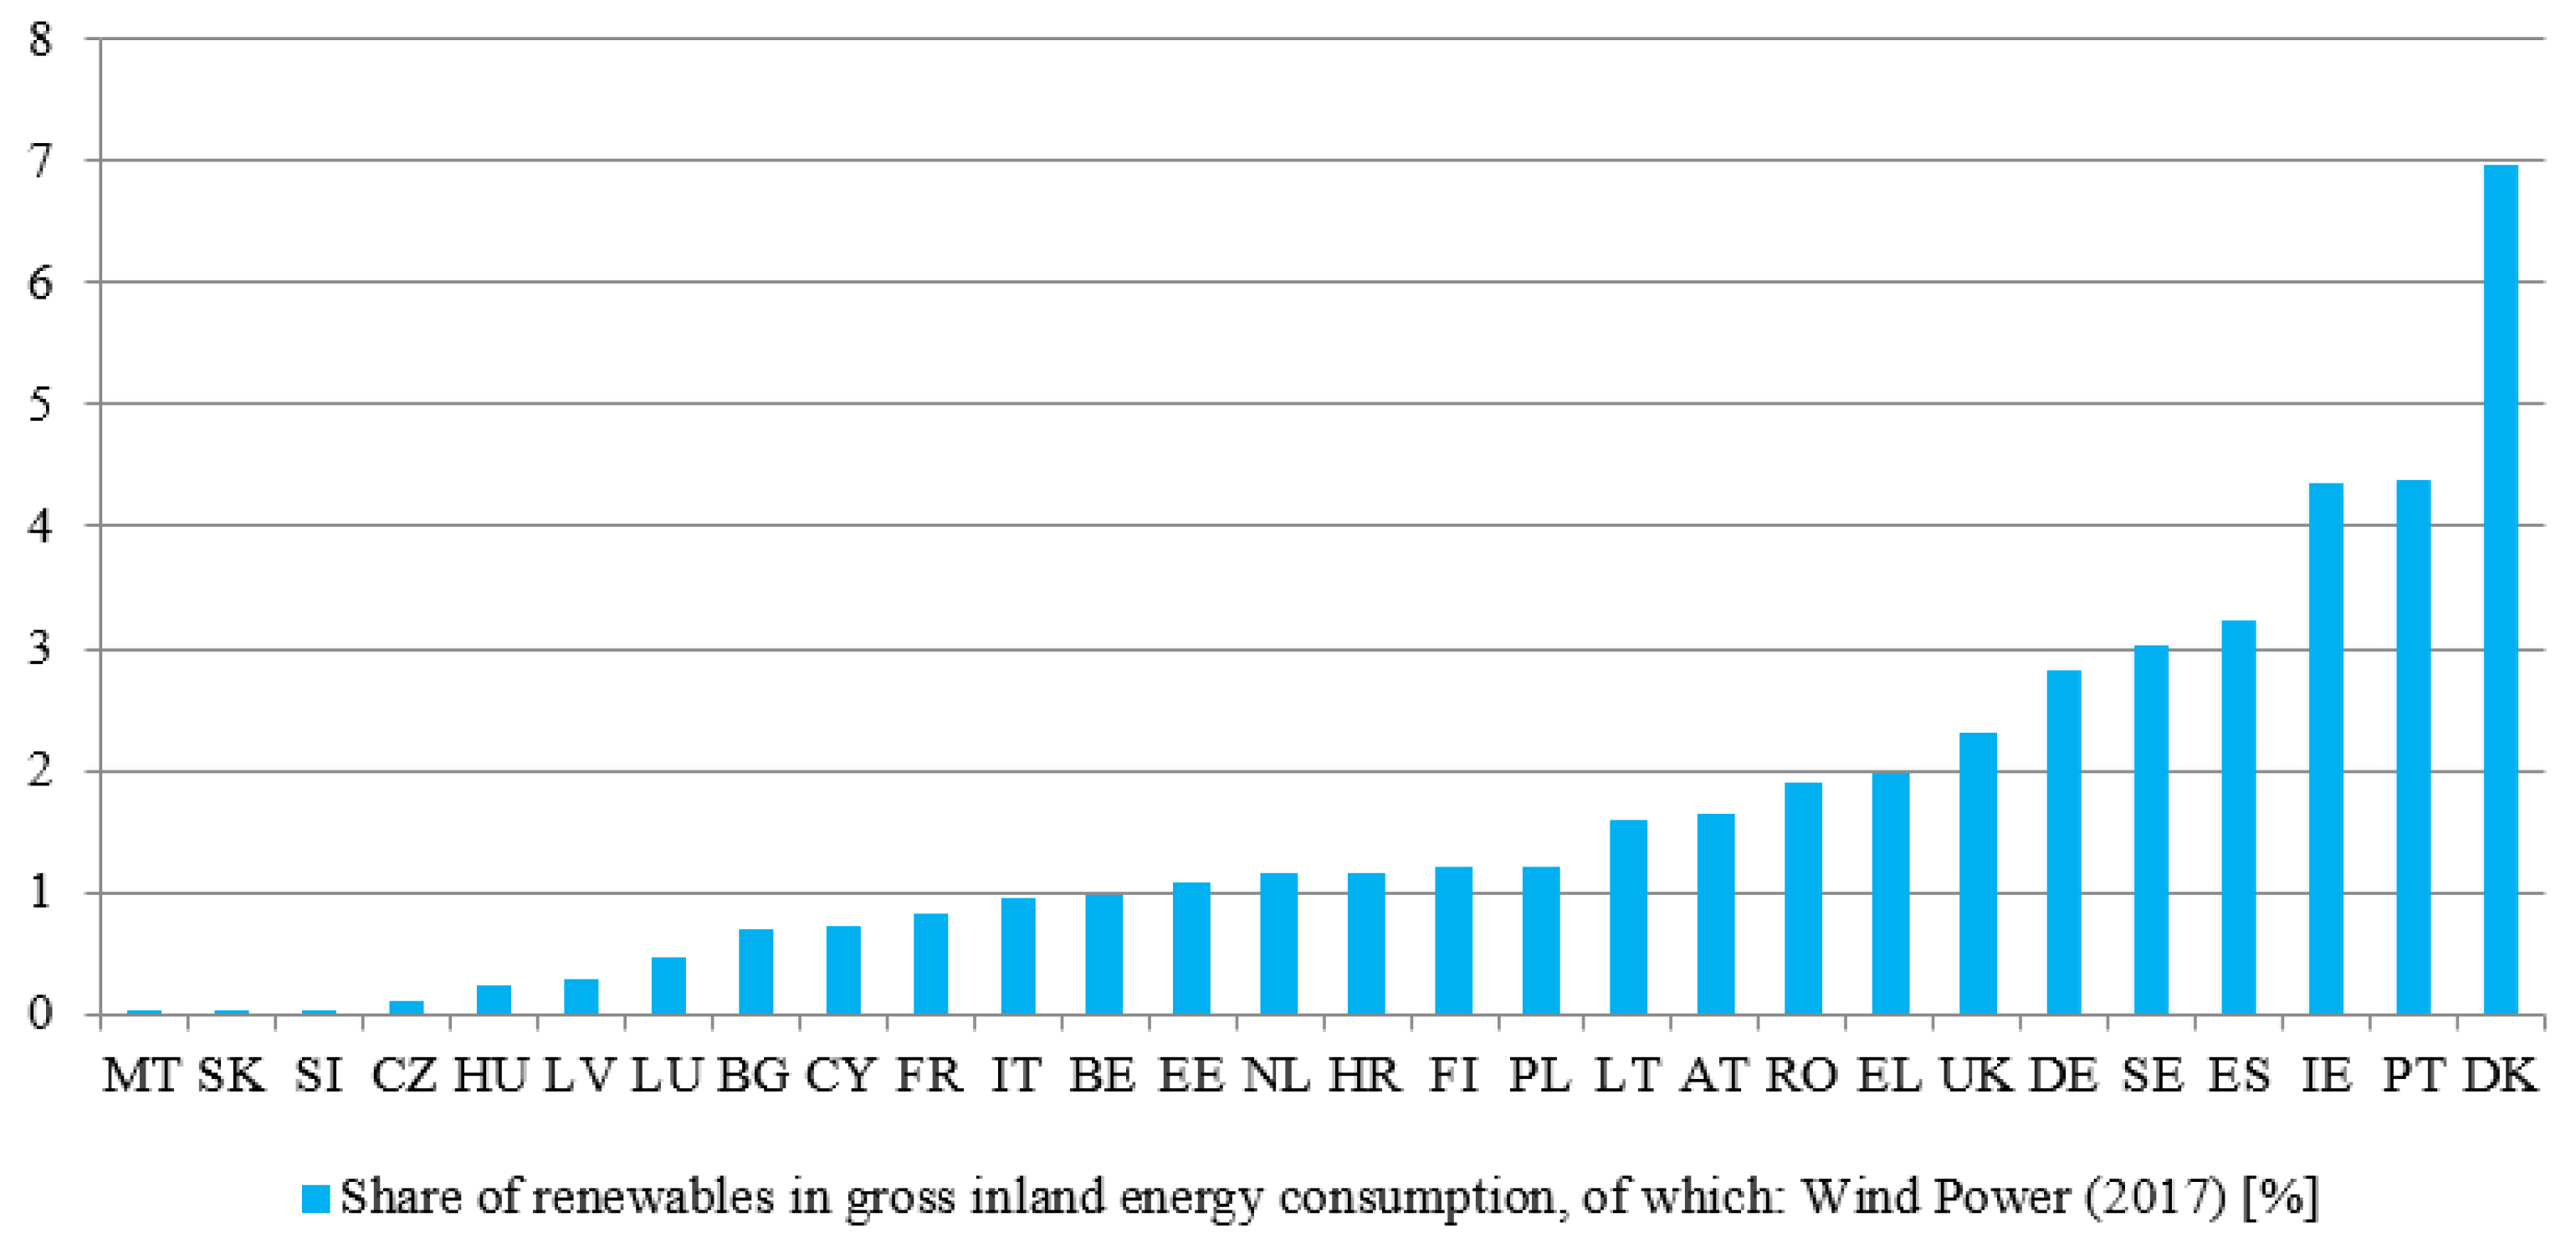
4.1. Diagnostic Variables Used—Determinants of the Wind Energy Sector Development
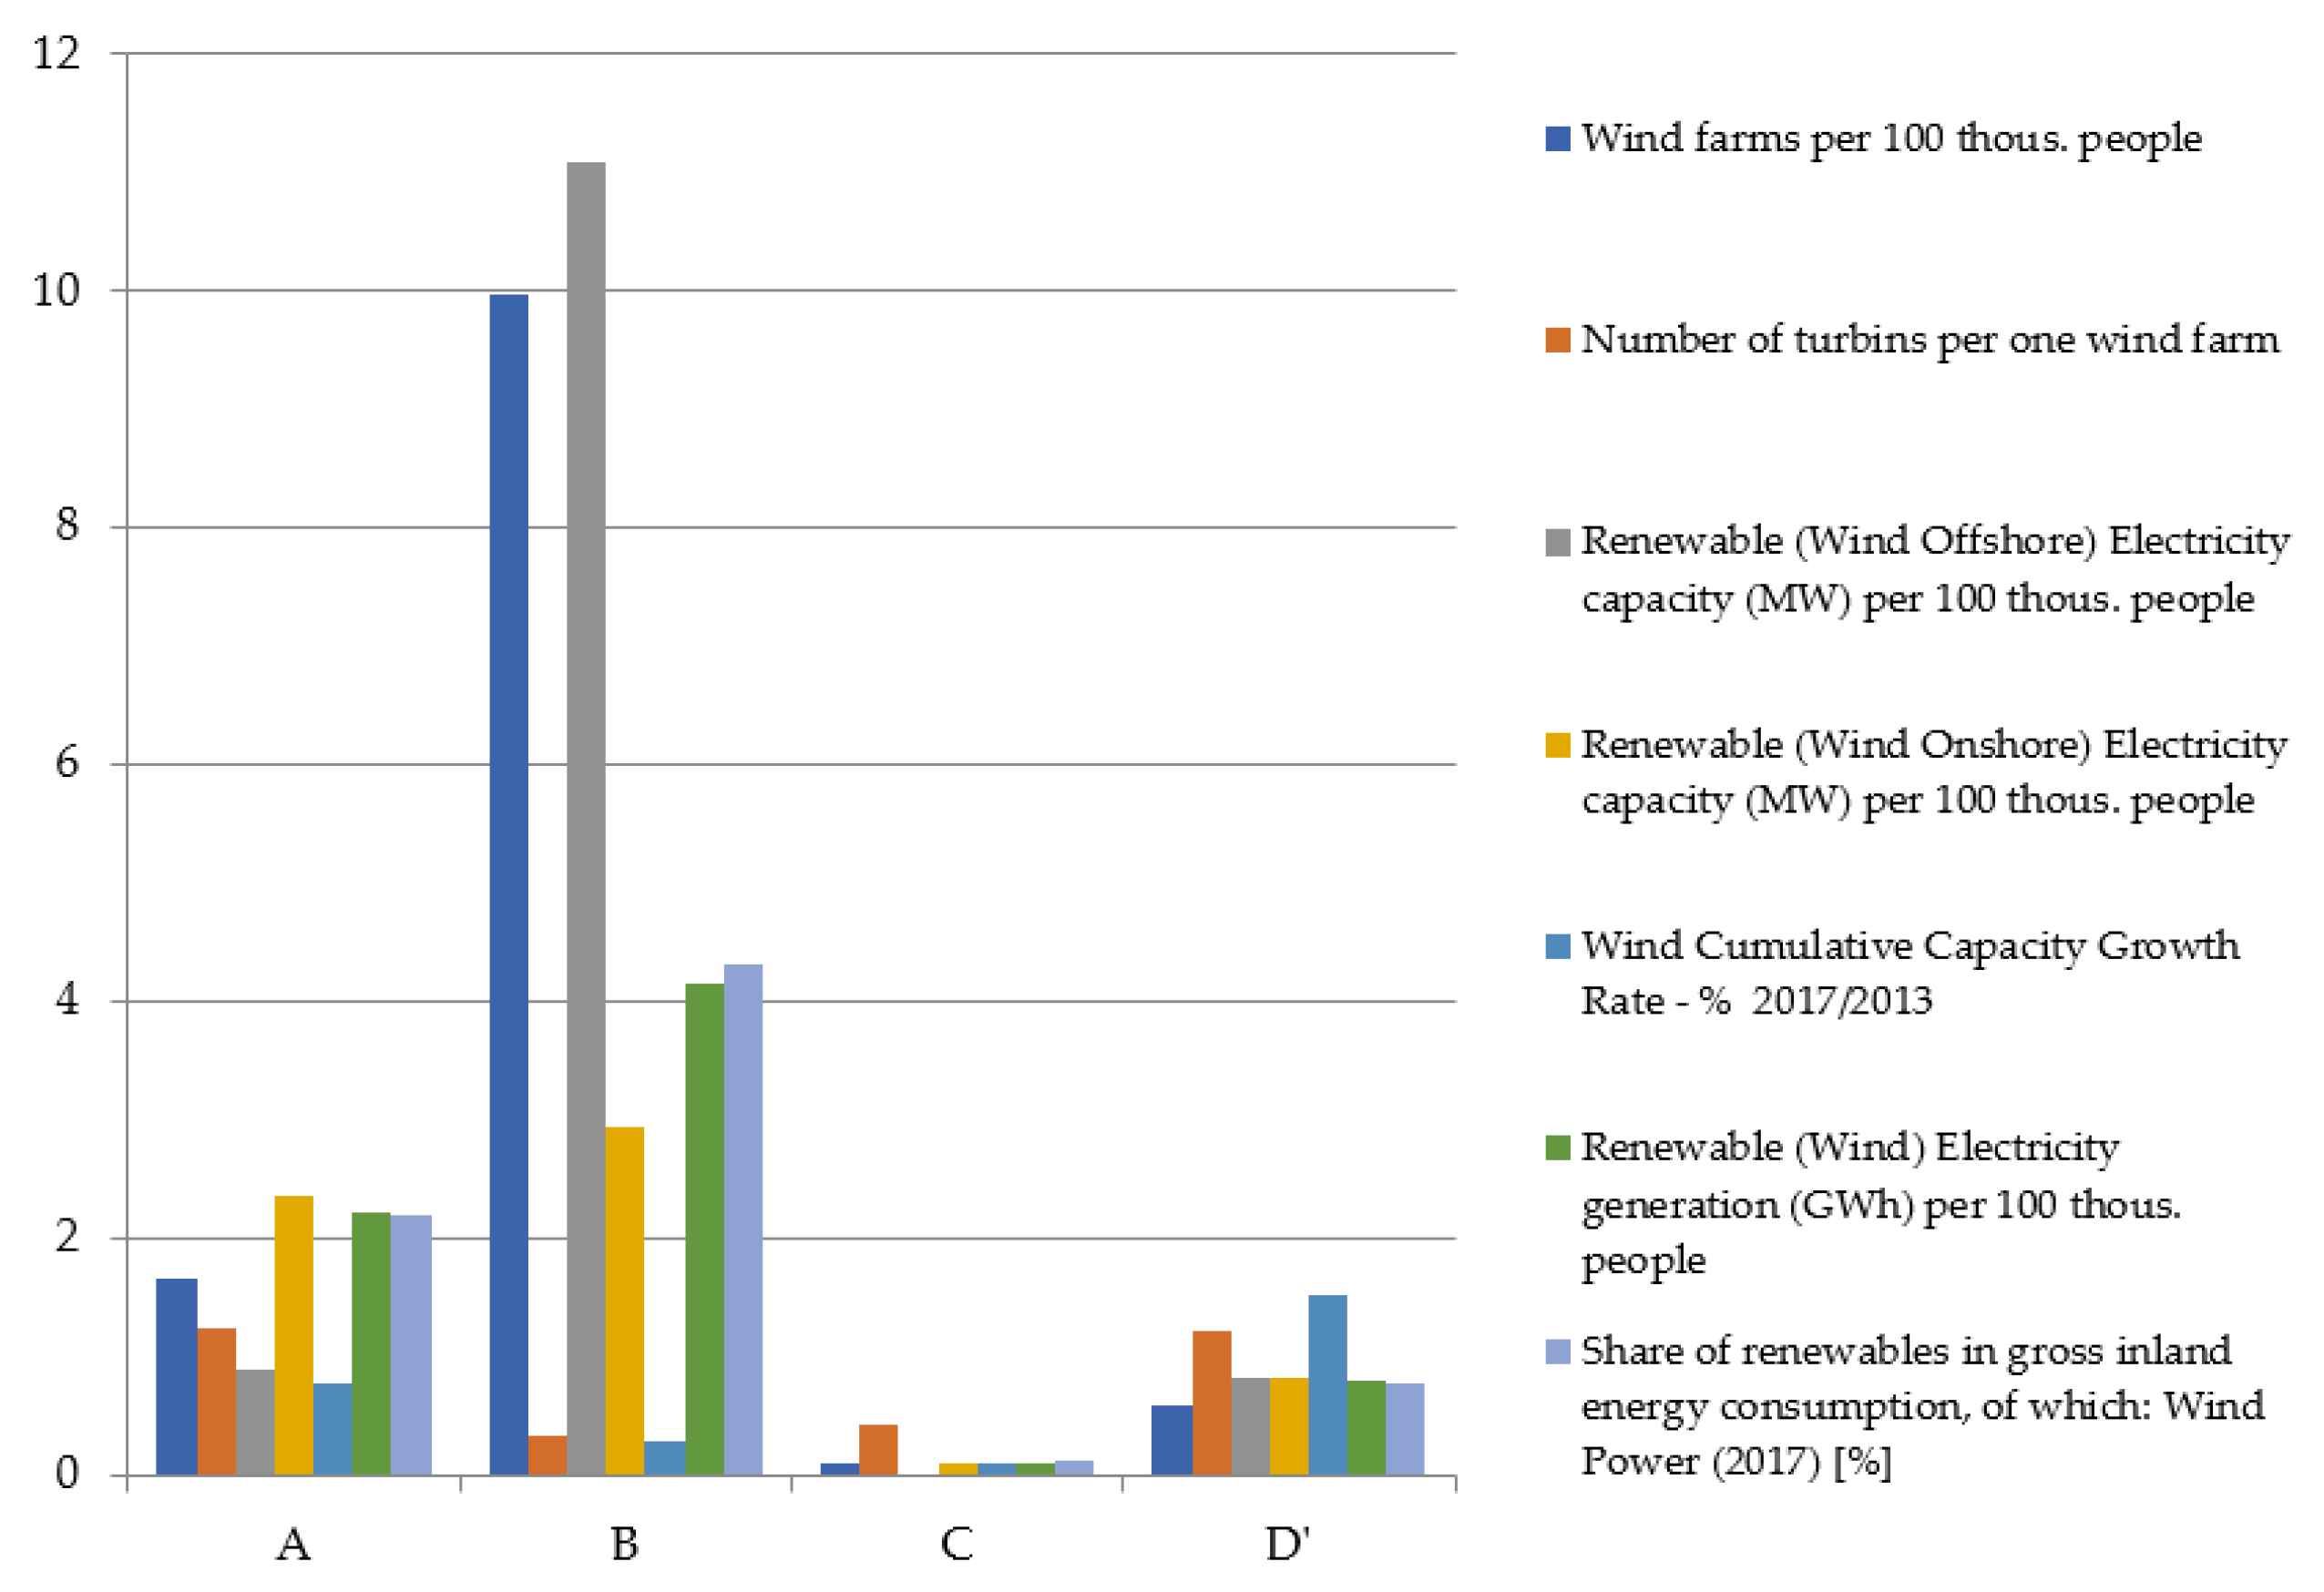
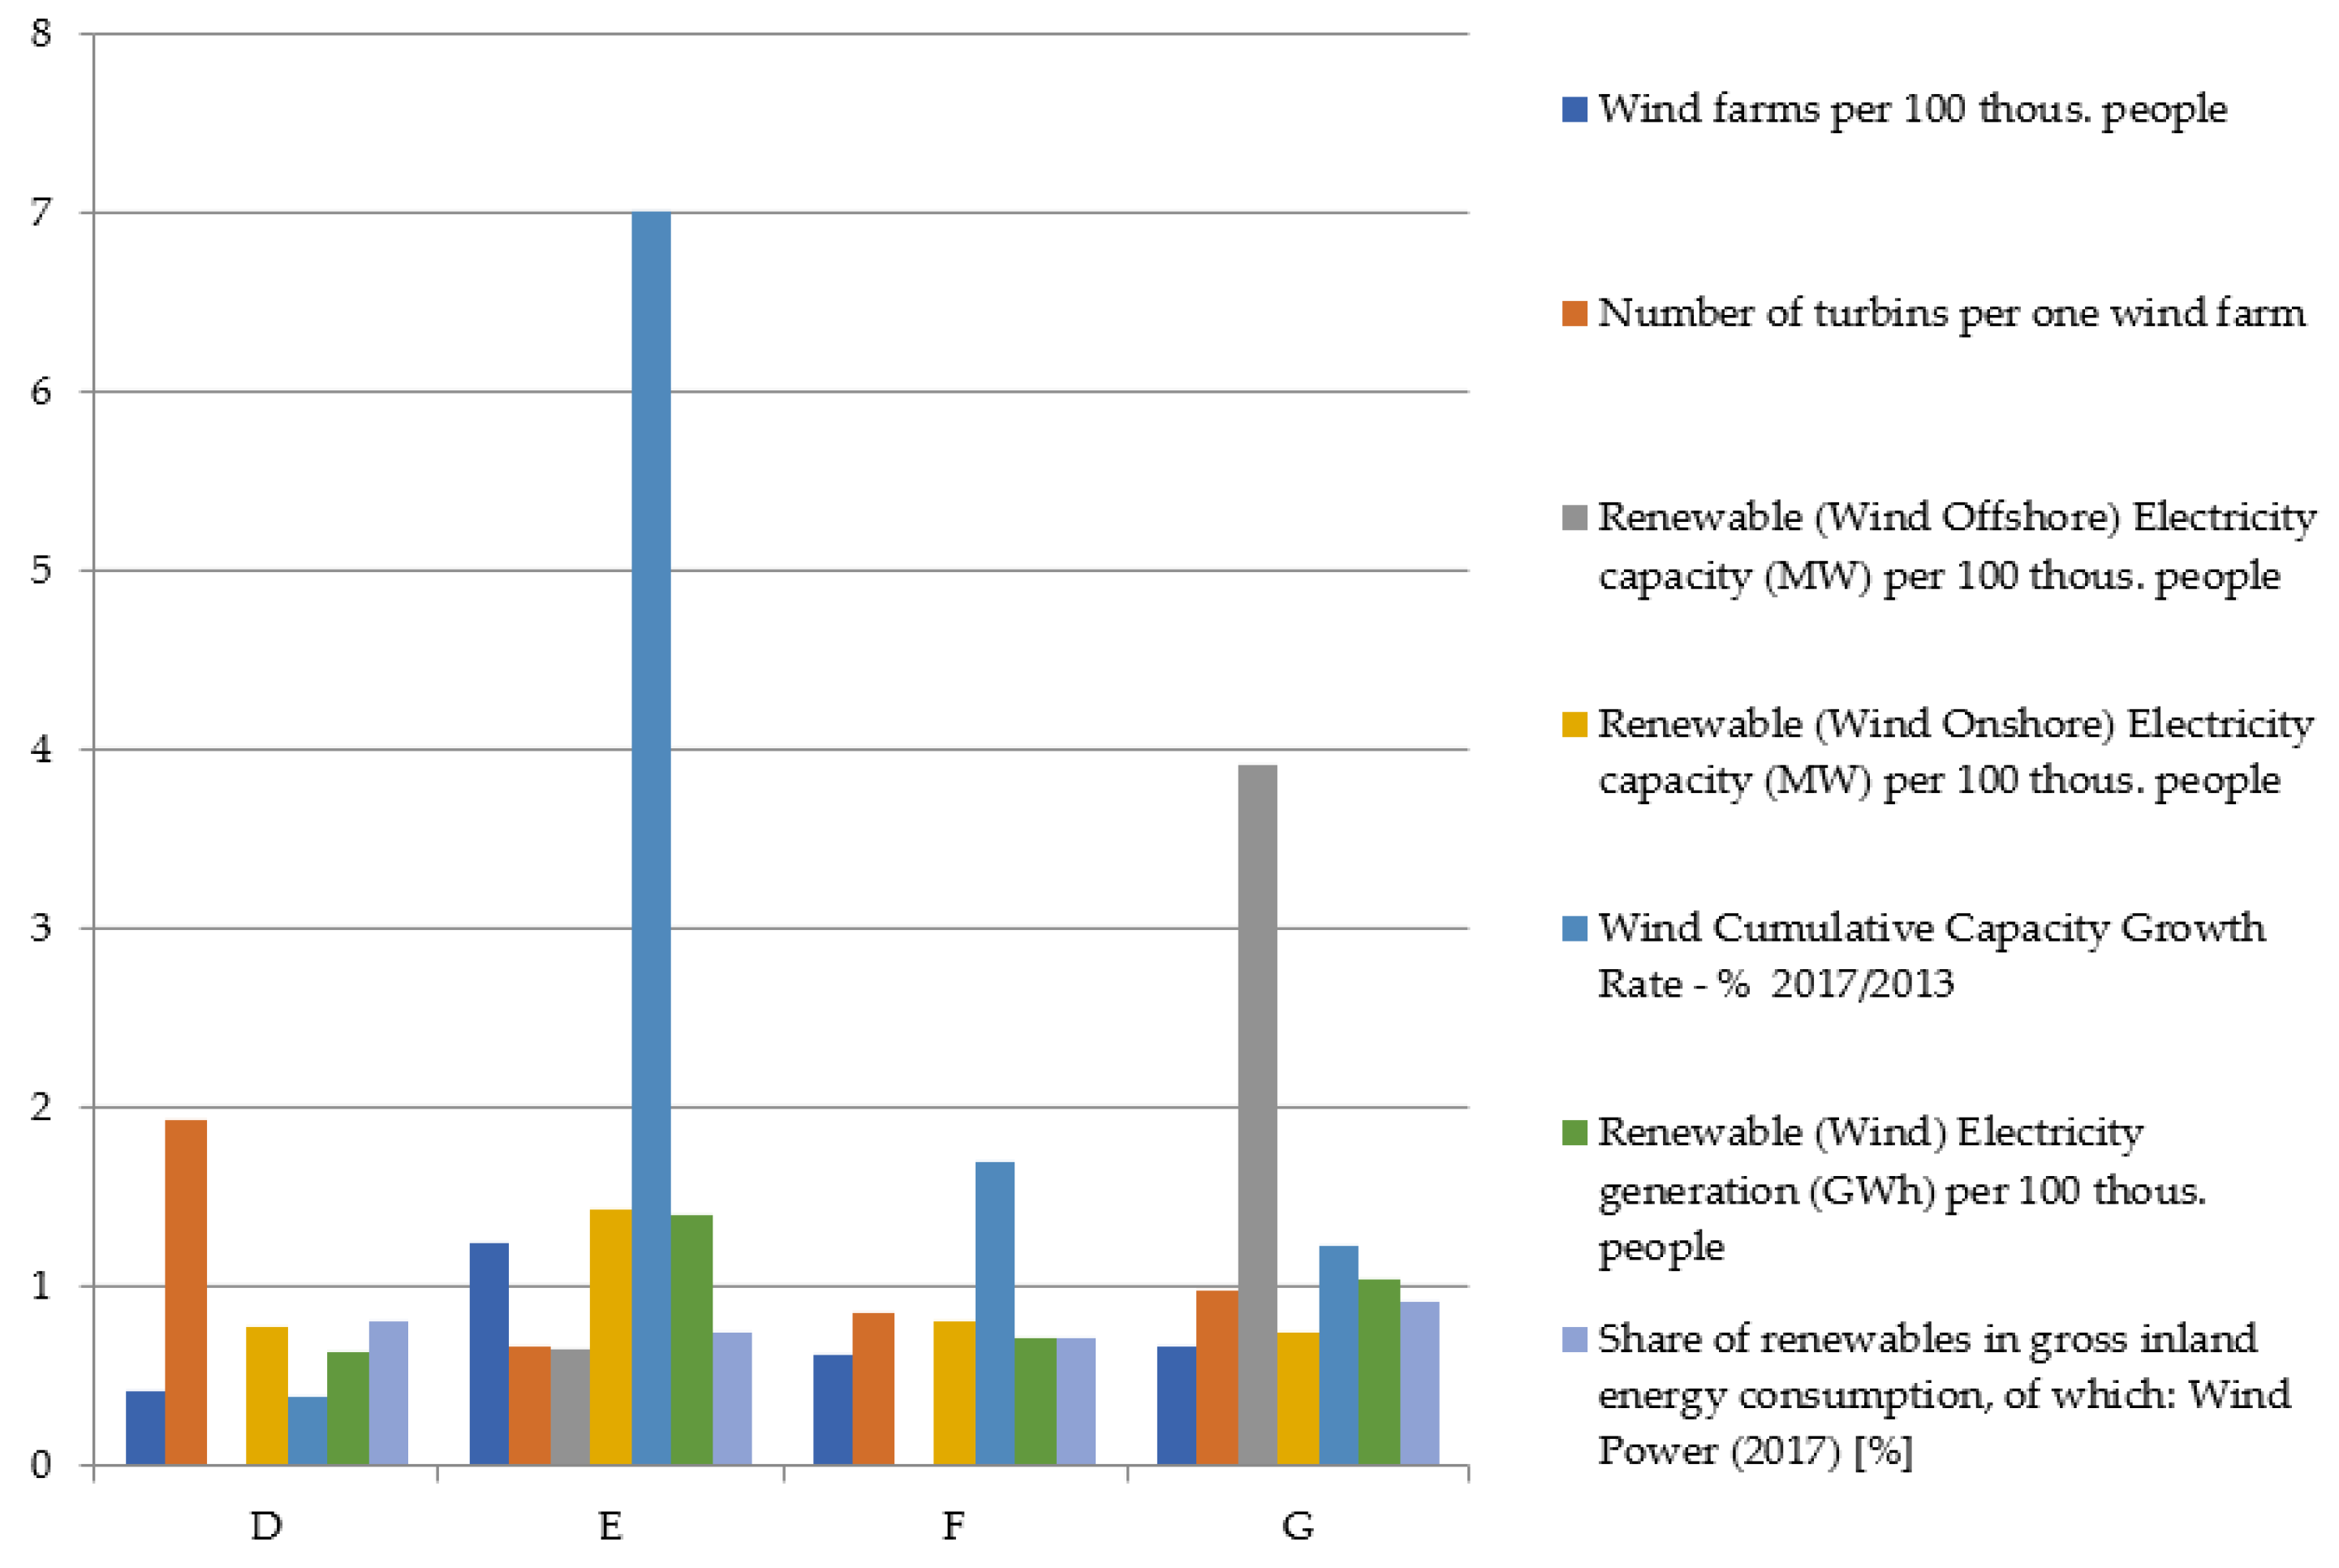
- X1—Wind farms per 100 thous. people;
- X2—Number of turbines per one wind farm;
- X3—Renewable (wind offshore) electricity capacity (MW) per 100 thous. people;
- X4—Renewable (wind onshore) electricity capacity (MW) per 100 thous. people;
- X5—Wind cumulative capacity growth rate—% 2017/2013;
- X6—Renewable (wind) electricity generation (GWh) per 100 thous. people;
- X7—Share of renewables in gross inland energy consumption of which: wind power (2017) [%].
4.2. Grouping Results Using the Wroclaw and Ward’s Taxonomy Methods
4.3. Ranking of EU Countries Using Linear Ordering Methods
5. Discussion
6. Conclusions
Author Contributions
Funding
Conflicts of Interest
References
- European Union. The EU in the World, 2018 ed.; Publications Office of the European Union: Luxembourg, 2018. [Google Scholar] [CrossRef]
- Energy Production and Imports 2019. Available online: https://ec.europa.eu/eurostat/statistics-explained/index.php/Energy_production_and_imports (accessed on 13 March 2020).
- BP Statistical Review of World Energy, June 2019. Available online: https://www.bp.com/en/global/corporate/energy-economics/statistical-review-of-world-energy.html (accessed on 11 March 2020).
- Renewable Energy Statistics. Available online: https://ec.europa.eu/eurostat/statistics-explained/index.php?title=Renewable_energy_statistics (accessed on 13 March 2020).
- Jastrzębska, G. Odnawialne Źródła Energii i Pojazdy Proekologiczne; WNT: Warsaw, Poland, 2009. [Google Scholar]
- Global Wind Atlas. Available online: https://irena.masdar.ac.ae/GIS/?&tool=dtu:gwa&map=103 (accessed on 11 March 2020).
- Eurostat Database. Complete Energy Balances (nrg_bal). Available online: https://appsso.eurostat.ec.europa.eu/nui/show.do?dataset=nrg_bal_c&lang=en (accessed on 10 October 2019).
- Majchrzak, H. Europejskie sieci przesyłowe na morzu. Czysta Energ. 2012, 11, 11–12. [Google Scholar]
- Tryon, R. Cluster Analysis; McGraw-Hill: New York, NY, USA, 1939. [Google Scholar]
- Cattell, R.A. Note on correlation clusters and cluster search methods. Psychonometrica 1944, 9, 169–184. [Google Scholar] [CrossRef]
- Perkal, J. Taksonomia wrocławska. Przegląd Antropol. 1953, 19, 209–219. [Google Scholar]
- Silvio-Pomenta, J.F. (Universidad Central de Venezuela). Typological Study Using the Wroclaw Taxonomic Method (a Study of Regional Disparities in Venezuela). 1973. Available online: https://www.istat.it/it/files/2014/06/Silvio-Pomenta.pdf (accessed on 10 May 2020).
- Hwang, C.-L.; Yoon, K. Multiple Attribute Decision Making; Springer: Berlin, Germany, 1981; pp. 128–132. [Google Scholar]
- Brożyna, J.; Mentel, G.; Ivanová, E.; Sorokin, G. Classification of Renewable Sources of Electricity in the Context of Sustainable Development of the New EU Member States. Energies 2019, 12, 2271. [Google Scholar] [CrossRef]
- Percesila, M.; Burcea, S.G.; Colesca, S.E. Analysis of renewable energies in European Union. Renew. Sustain. Energy Rev. 2016, 56, 156–170. [Google Scholar] [CrossRef]
- Grigoras, G.; Scarlatache, F. An assessment of the renewable energy potential using a clustering based data mining method. Case study in Romania. Energy 2015, 81, 416–429. [Google Scholar] [CrossRef]
- Martins, F. PV sector in the European Union countries—Clusters and efficiency. Renew. Sustain. Energy Rev. 2017, 74, 173–177. [Google Scholar] [CrossRef]
- International Renewable Energy Agency statistics. Available online: https://www.irena.org/statistics (accessed on 10 October 2019).
- Wind Europe Statistics. Available online: https://windeurope.org/data-and-analysis/ (accessed on 10 October 2019).
- TheWindPower Statistics. Available online: https://www.thewindpower.net/online_access_en.php (accessed on 10 October 2019).
- Eurostat Database. Available online: https://ec.europa.eu/eurostat/data/database (accessed on 10 October 2019).
- Fouquet, D.; Johansson, T.B. European renewable energy policy at crossroads—Focus on electricity support mechanisms. Energy Policy 2008, 36, 4079–4092. [Google Scholar] [CrossRef]
- Klessmann, C.; Held, A.; Rathmann, M.; Ragwitz, M. Status and perspectives of renewable energy policy and deployment in the European Union—What is needed to reach the 2020 targets. Energy Policy 2011, 39, 7637–7657. [Google Scholar] [CrossRef]
- Meyer, N.I. Learning from wind energy policy in the EU: Lessons from Denmark, Sweden and Spain. Eur. Environ. 2007, 17, 347–362. [Google Scholar] [CrossRef]
- Saidur, R.; Islam, M.R.; Rahim, N.A.; Solangi, K.H. A review on global wind energy policy. Renew. Sustain. Energy Rev. 2010, 14, 1744–1762. [Google Scholar] [CrossRef]
- Amer, M.; Daim, T.U. Application of technology roadmaps for renewable energy sector. Technol. Forecast. Soc. Change 2010, 77, 1355–1370. [Google Scholar] [CrossRef]
- Harmelink, M.; Voogt, M.; Cremer, C. Analysing the effectiveness of renewable energy supporting policies in the European Union. Energy Policy 2006, 34, 343–351. [Google Scholar] [CrossRef]
- Kasperowicz, R.; Pinczyński, M.; Khabdullin, A. Modeling the power of renewable energy sources in the context of classical electricity system transformation. J. Int. Stud. 2017, 10, 264–272. [Google Scholar] [CrossRef]
- Wood, G.; Finnegan, J.J.; Allen, M.L.; Allen, M.M.C.; Cumming, D.; Johan, S.; Nicklich, M.; Endo, T.; Lim, S.; Tanaka, S. The comparative institutional analysis of energy transitions. Socio Econ. Rev. 2020, 18, 257–294. [Google Scholar] [CrossRef]
- Allen, M.L.; Allen, M.M.C.; Cumming, D.; Johan, S. Comparative Capitalisms and Energy Transitions: Renewable Energy in the European Union. Br. J. Manag. 2020, 1–19. [Google Scholar] [CrossRef]
- Evantie, M.; Hills, J.M. Renewable energy issues and implementation of European energy policy: The missing generation? Energy Policy 2012, 45, 201–216. [Google Scholar]
- Manzano-Agugliaro, F.; Alcayde, A.; Montoya, F.G.; Zapata-Sierra, A.; Gil, C. Scientific production of renewable energies worldwide: An overview. Renew. Sustain. Energy Rev. 2013, 18, 134–143. [Google Scholar] [CrossRef]
- Baris, K.; Kucukali, S. Availability of renewable energy sources in Turkey: Current situation, potential, government policies and the EU perspective. Energy Policy 2012, 42, 377–391. [Google Scholar] [CrossRef]
- Erdil, A.; Erbıyık, H. Renewable Energy Sources of Turkey and Assessment of Sustainability. Procedia Soc. Behav. Sci. 2015, 207, 669–679. [Google Scholar] [CrossRef]
- Erdogdu, E. On the wind energy in Turkey. Renew. Sustain. Energy Rev. 2009, 13, 1361–1371. [Google Scholar] [CrossRef]
- Kaplan, Y.A. Overview of wind energy in the world and assessment of current wind energy policies in Turkey. Renew. Sustain. Energy Rev. 2015, 43, 562–568. [Google Scholar] [CrossRef]
- Camadan, E. An assessment on the current status and future of wind energy in Turkish electricity industry. Renew. Sustain. Energy Rev. 2011, 15, 4994–5002. [Google Scholar] [CrossRef]
- Colesca, S.E.; Ciocoiu, C.N. An overview of the Romanian renewable energy sector. Renew. Sustain. Energy Rev. 2013, 24, 149–158. [Google Scholar] [CrossRef]
- Dragomir, G.; Șerban, A.; Năstase, G.; Brezeanu, A.I. Wind energy in Romania: A review from 2009 to 2016. Renew. Sustain. Energy Rev. 2016, 64, 129–143. [Google Scholar] [CrossRef]
- Franzitta, V.; Curto, D.; Milone, D.; Rao, D. Assessment of Renewable Sources for the Energy Consumption in Malta in the Mediterranean Sea. Energies 2016, 9, 1034. [Google Scholar] [CrossRef]
- Dvořák, P.; Martinát, S.; Van der Horst, D.; Frantál, B.; Turečková, K. Renewable energy investment and job creation; a cross-sectoral assessment for the Czech Republic with reference to EU benchmarks. Renew. Sustain. Energy Rev. 2017, 69, 360–368. [Google Scholar] [CrossRef]
- Montoya, F.G.; Aguilera, M.J.; Manzano-Agugliaro, F. Renewable energy production in Spain: A review. Renew. Sustain. Energy Rev. 2014, 33, 509–531. [Google Scholar] [CrossRef]
- Del Rio, P.; Unruh, G. Overcoming the lock-out of renewable energy technologies in Spain: The cases of wind and solar electricity. Renew. Sustain. Energy Rev. 2007, 11, 1498–1513. [Google Scholar] [CrossRef]
- Rabe, M.; Streimikiene, D.; Bilan, Y. Model of Optimization of Wind Energy Production in the Light of Legal Changes in Poland. Energies 2020, 13, 1557. [Google Scholar] [CrossRef]
- Katinas, V.; Markevicius, A. Promotional policy and perspectives of usage renewable energy in Lithuania. Energy Policy 2006, 34, 771–780. [Google Scholar] [CrossRef]
- Serri, L.; Lembo, E.; Airoldi, D.; Gelli, C.; Beccarello, M. Wind energy plants repowering potential in Italy: Technical-economic assessment. Renewable Energy 2018, 115, 382–390. [Google Scholar] [CrossRef]
- Lalic, D.; Popovski, K.; Gecevska, V.; Popovska Vasilevska, S.; Tesic, Z. Analysis of the opportunities and challenges for renewable energy market in the Western Balkan countries. Renew. Sustain. Energy Rev. 2011, 15, 3187–3195. [Google Scholar] [CrossRef]
- Ajanovic, A. Renewable fuels—A comparative assessment from economic, energetic and ecological point-of-view up to 2050 in EU-countries. Renew. Energy 2013, 60, 733–738. [Google Scholar] [CrossRef]
- Resch, G.; Held, A.; Faber, T.; Panzer, C.; Toro, F.; Haas, R. Potentials and prospects for renewable energies at global scale. Energy Policy 2008, 36, 4048–4056. [Google Scholar] [CrossRef]
- Kumar, Y.; Ringenberg, J.; Depuru, S.S.; Devabhaktuni, V.K.; Lee, J.W.; Nikolaidis, E.; Andersen, B.; Afjeh, A. Wind energy: Trends and enabling technologies. Renew. Sustain. Energy Rev. 2016, 53, 209–224. [Google Scholar] [CrossRef]
- Frantal, B.; Kunc, J. Wind Turbines in Tourism Landscapes. Czech Experience. Ann. Tour. Res. 2011, 38, 499–519. [Google Scholar] [CrossRef]
- Leung, D.Y.C.; Yang, Y. Wind energy development and its environmental impact: A review. Renew. Sustain. Energy Rev. 2012, 16, 1031–1039. [Google Scholar] [CrossRef]
- Kaldellis, J.K.; Zafirakis, D. The wind energy (r)evolution: A short review of a long history. Renew. Sustain. Energy Rev. 2011, 36, 1887–1901. [Google Scholar] [CrossRef]
- Bortolini, M.; Gamberi, M.; Graziani, A.; Manzini, R.; Pilati, F. Performance and viability analysis of small wind turbines in the European Union. Renew. Energy 2014, 62, 629–639. [Google Scholar] [CrossRef]
- Cockerill, T.T.; Kuhn, M.; van Bussel, G.J.W.; Bierbooms, W.; Harrison, R. Combined technical and economic evaluation of the Northern European offshore wind resource. J. Wind Eng. Ind. Aerodyn. 2001, 89, 689–711. [Google Scholar] [CrossRef]
- Blanco, M.I.; Rodrigues, G. Direct employment in the wind energy sector: An EU study. Energy Policy 2009, 37, 2847–2857. [Google Scholar] [CrossRef]
- Monforti, F.; Gaetani, M.; Vignati, E. How synchronous is wind energy production among European countries? Renew. Sustain. Energy Rev. 2016, 59, 1622–1638. [Google Scholar] [CrossRef]
- Kazak, J.; van Hoof, J.; Szewranski, S. Challenges in the wind turbines location process in Central Europe—The use of spatial decision support systems. Renew. Sustain. Energy Rev. 2017, 76, 425–433. [Google Scholar] [CrossRef]
- Rabe, M.; Streimikiene, D.; Bilan, Y. The Concept of Risk and Possibilities of Application of Mathematical Methods in Supporting Decision Making for Sustainable Energy Development. Sustainability 2019, 11, 1018. [Google Scholar] [CrossRef]
- Siksnelyte, I.; Zavadskas, E.K.; Streimikiene, D.; Sharma, D. An Overview of Multi-Criteria Decision-Making Methods in Dealing with Sustainable Energy Development Issues. Energies 2018, 11, 2754. [Google Scholar] [CrossRef]
- Jiang, Y.; Havrysh, V.; Klymchuk, O.; Nitsenko, V.; Balezentis, T.; Streimikiene, D. Utilization of Crop Residue for Power Generation: The Case of Ukraine. Sustainability 2019, 11, 7004. [Google Scholar] [CrossRef]
- Grabiński, T. Metody Taksonometrii; Wydawnictwo Akademii Ekonomicznej w Krakowie: Kraków, Poland, 1992; pp. 101–111. [Google Scholar]
- Korzan, B. Elementy Teorii Grafów i Sieci. Metody i Zastosowania; WNT: Warszawa, Poland, 1978. [Google Scholar]
- Ostasiewicz, W. Statystyczne Metody Analizy Danych; Wydawnictwo Akademii Ekonomicznej we Wrocławiu: Wrocław, Poland, 1999; pp. 89–91. [Google Scholar]
- Hellwig, Z. Zastosowanie metody taksonomicznej do typologicznego podziału krajów ze względu na poziom ich rozwoju oraz zasoby i strukturę wykwalifikowanych kadr. Przegląd Stat. 1968, 4, 307–326. [Google Scholar]
- Jajuga, K.; Walesiak, M.; Bąk, A. On the General Distance Measure. In Exploratory Data Analysis in Empirical Research; Schwaiger, M., Opitz, O., Eds.; Springer: Berlin, Germany, 2003; pp. 104–109. [Google Scholar]
- Teknologiens Mediehus. Available online: https://ing.dk/artikel/vindmoellebranchen-tilbage-paa-sporet-efter-krisen-176438 (accessed on 28 March 2020).


| Mean | Median | Min | Max | C25 | C75 | SD | K | ||
|---|---|---|---|---|---|---|---|---|---|
| X1 | 3.1 | 1.6 | 0.00 | 30.7 | 0.6 | 2.9 | 5.8 | 188.2 | 20.4 |
| X2 | 8.2 | 6.2 | 0.00 | 20.1 | 4.1 | 11.6 | 5.5 | 67.7 | −0.3 |
| X3 | 2.03 | 0.0 | 0.00 | 22.5 | 0.0 | 0.9 | 4.8 | 240.4 | 11.5 |
| X4 | 24.9 | 18.7 | 000 | 73.5 | 11.8 | 34.3 | 21.6 | 86.9 | 0.1 |
| X5 | 0.51 | 0.35 | −0.20 | 3.57 | 0.01 | 0.67 | 0.70 | 137.4 | 13.7 |
| X6 | 61.9 | 43.8 | 0.11 | 257.1 | 22.9 | 81.5 | 60.4 | 97.7 | 2.9 |
| X7 | 1.6 | 1.2 | 0.001 | 6.9 | 0.6 | 2.1 | 1.6 | 99.3 | 3.5 |
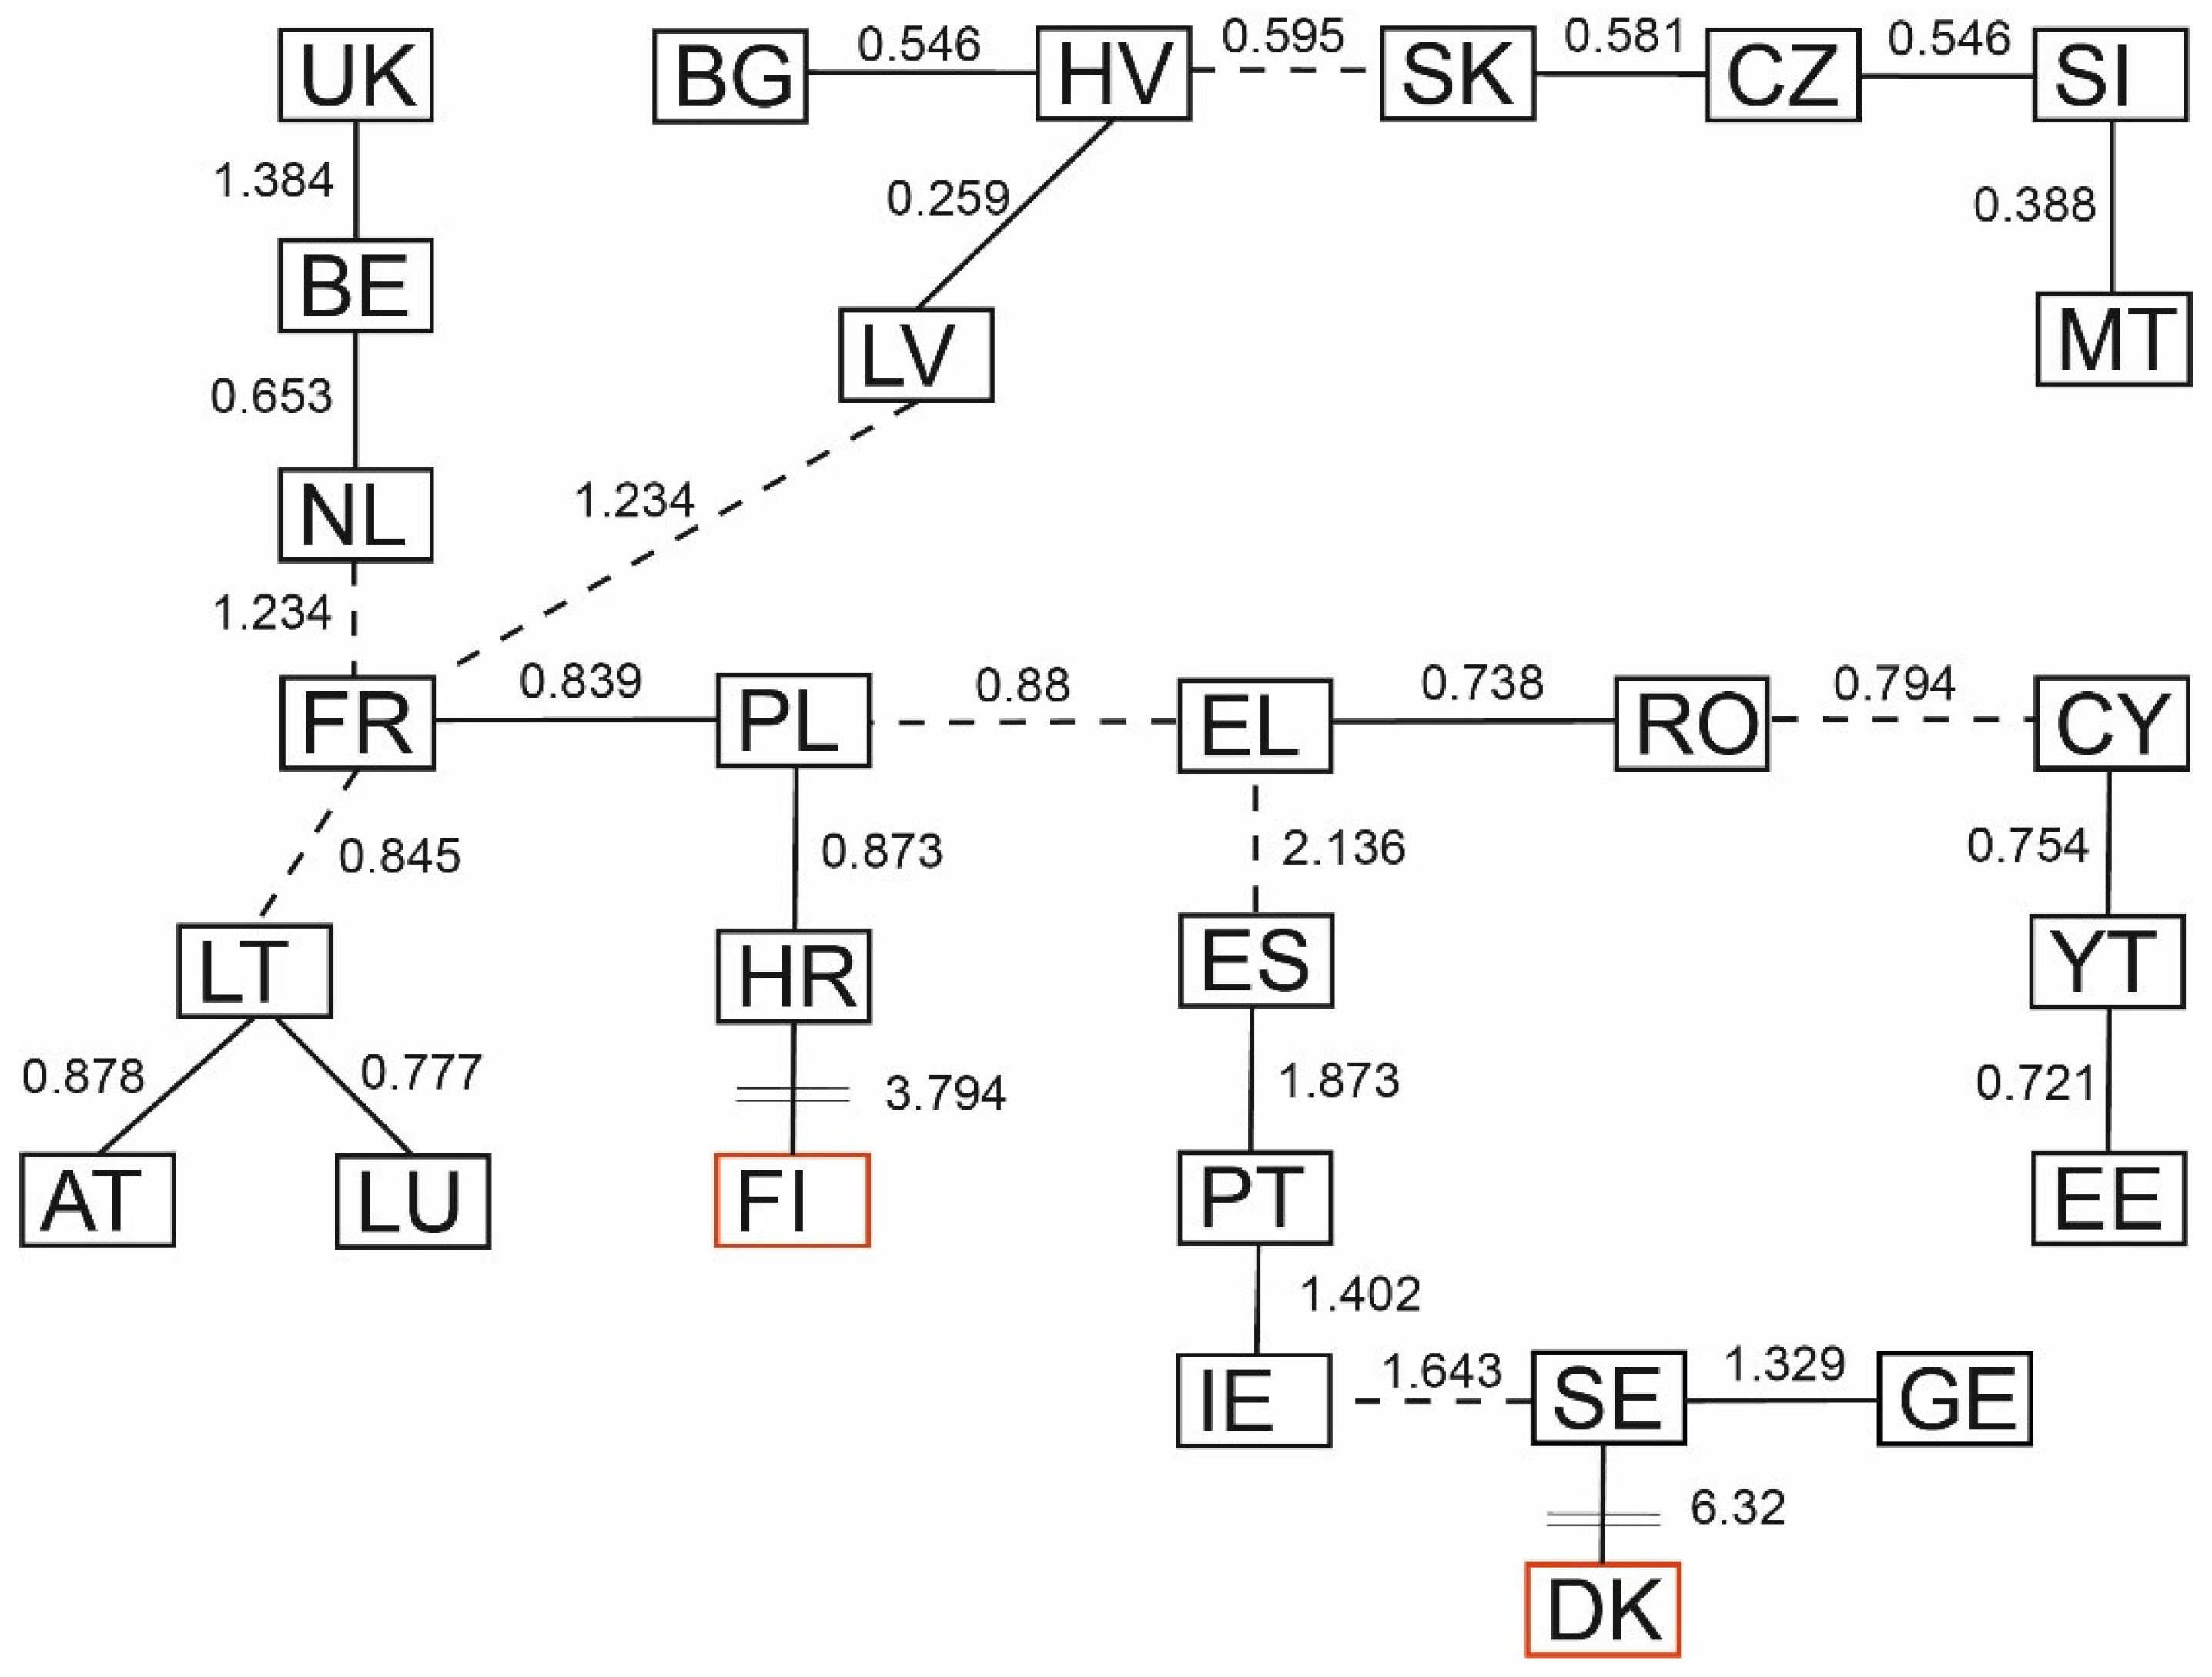
| No. | Countries | Link Length (d1) | No. | Countries | Link Length (d1) |
|---|---|---|---|---|---|
| 1 | DK-SE | 6.32 * | 19 | RO-CY | 0.79 |
| 2 | FI-HR | 3.79 * | 20 | LU-LT | 0.78 |
| 3 | ES-EL | 2.14 | 21 | LT-LU | 0.78 |
| 4 | ES-PT | 1.87 | 22 | CY-IT | 0.75 |
| 5 | SE-IE | 1.64 | 23 | RO-EL | 0.74 |
| 6 | IE-PT | 1.40 | 24 | EL-RO | 0.74 |
| 7 | PT-IE | 1.40 | 25 | EE-IT | 0.72 |
| 8 | UK-BE | 1.35 | 26 | IT-EE | 0.72 |
| 9 | DE-SE | 1.33 | 27 | BG-NL | 0.65 |
| 10 | SE-DE | 1.33 | 28 | NL-BG | 0.65 |
| 11 | NL-FR | 1.29 | 29 | HU-SK | 0.60 |
| 12 | LV-FR | 1.22 | 30 | SK-CZ | 0.58 |
| 13 | PL-EL | 0.88 | 31 | BG-HU | 0.55 |
| 14 | AT-LT | 0.88 | 32 | CZ-SI | 0.39 |
| 15 | HR-PL | 0.87 | 33 | MT-SI | 0.39 |
| 16 | FR-LT | 0.85 | 34 | SI-MT | 0.39 |
| 17 | PL-FR | 0.84 | 35 | LV-HU | 0.26 |
| 18 | FR-PL | 0.84 | 36 | HU-LV | 0.26 |
| Division into | ||
|---|---|---|
| 4 | 7 | |
| p-Value | ||
| Wind farms per 100 thous. people | 0.00000 *** | 0.00000 *** |
| Number of turbines per one wind farm | 0.02872 * | 0.001120 * |
| Renewable (Wind Offshore) Electricity capacity ([MW] per 100 thous. people) | 0.00000 *** | 0.00000 *** |
| Renewable (Wind Onshore) Electricity capacity ([MW] per 100 thous. people) | 0.00000 *** | 0.00000 *** |
| Wind Cumulative Capacity Growth Rate [%] (2017/2013) | 0.13327 | 0.00000 *** |
| Renewable (Wind) Electricity generation ([GWh] per 100 thous. people) | 0.00000 *** | 0.00000 *** |
| Share of renewables in gross inland energy consumption, of which: Wind Power (2017) [%] | 0.00000 *** | 0.00000 *** |
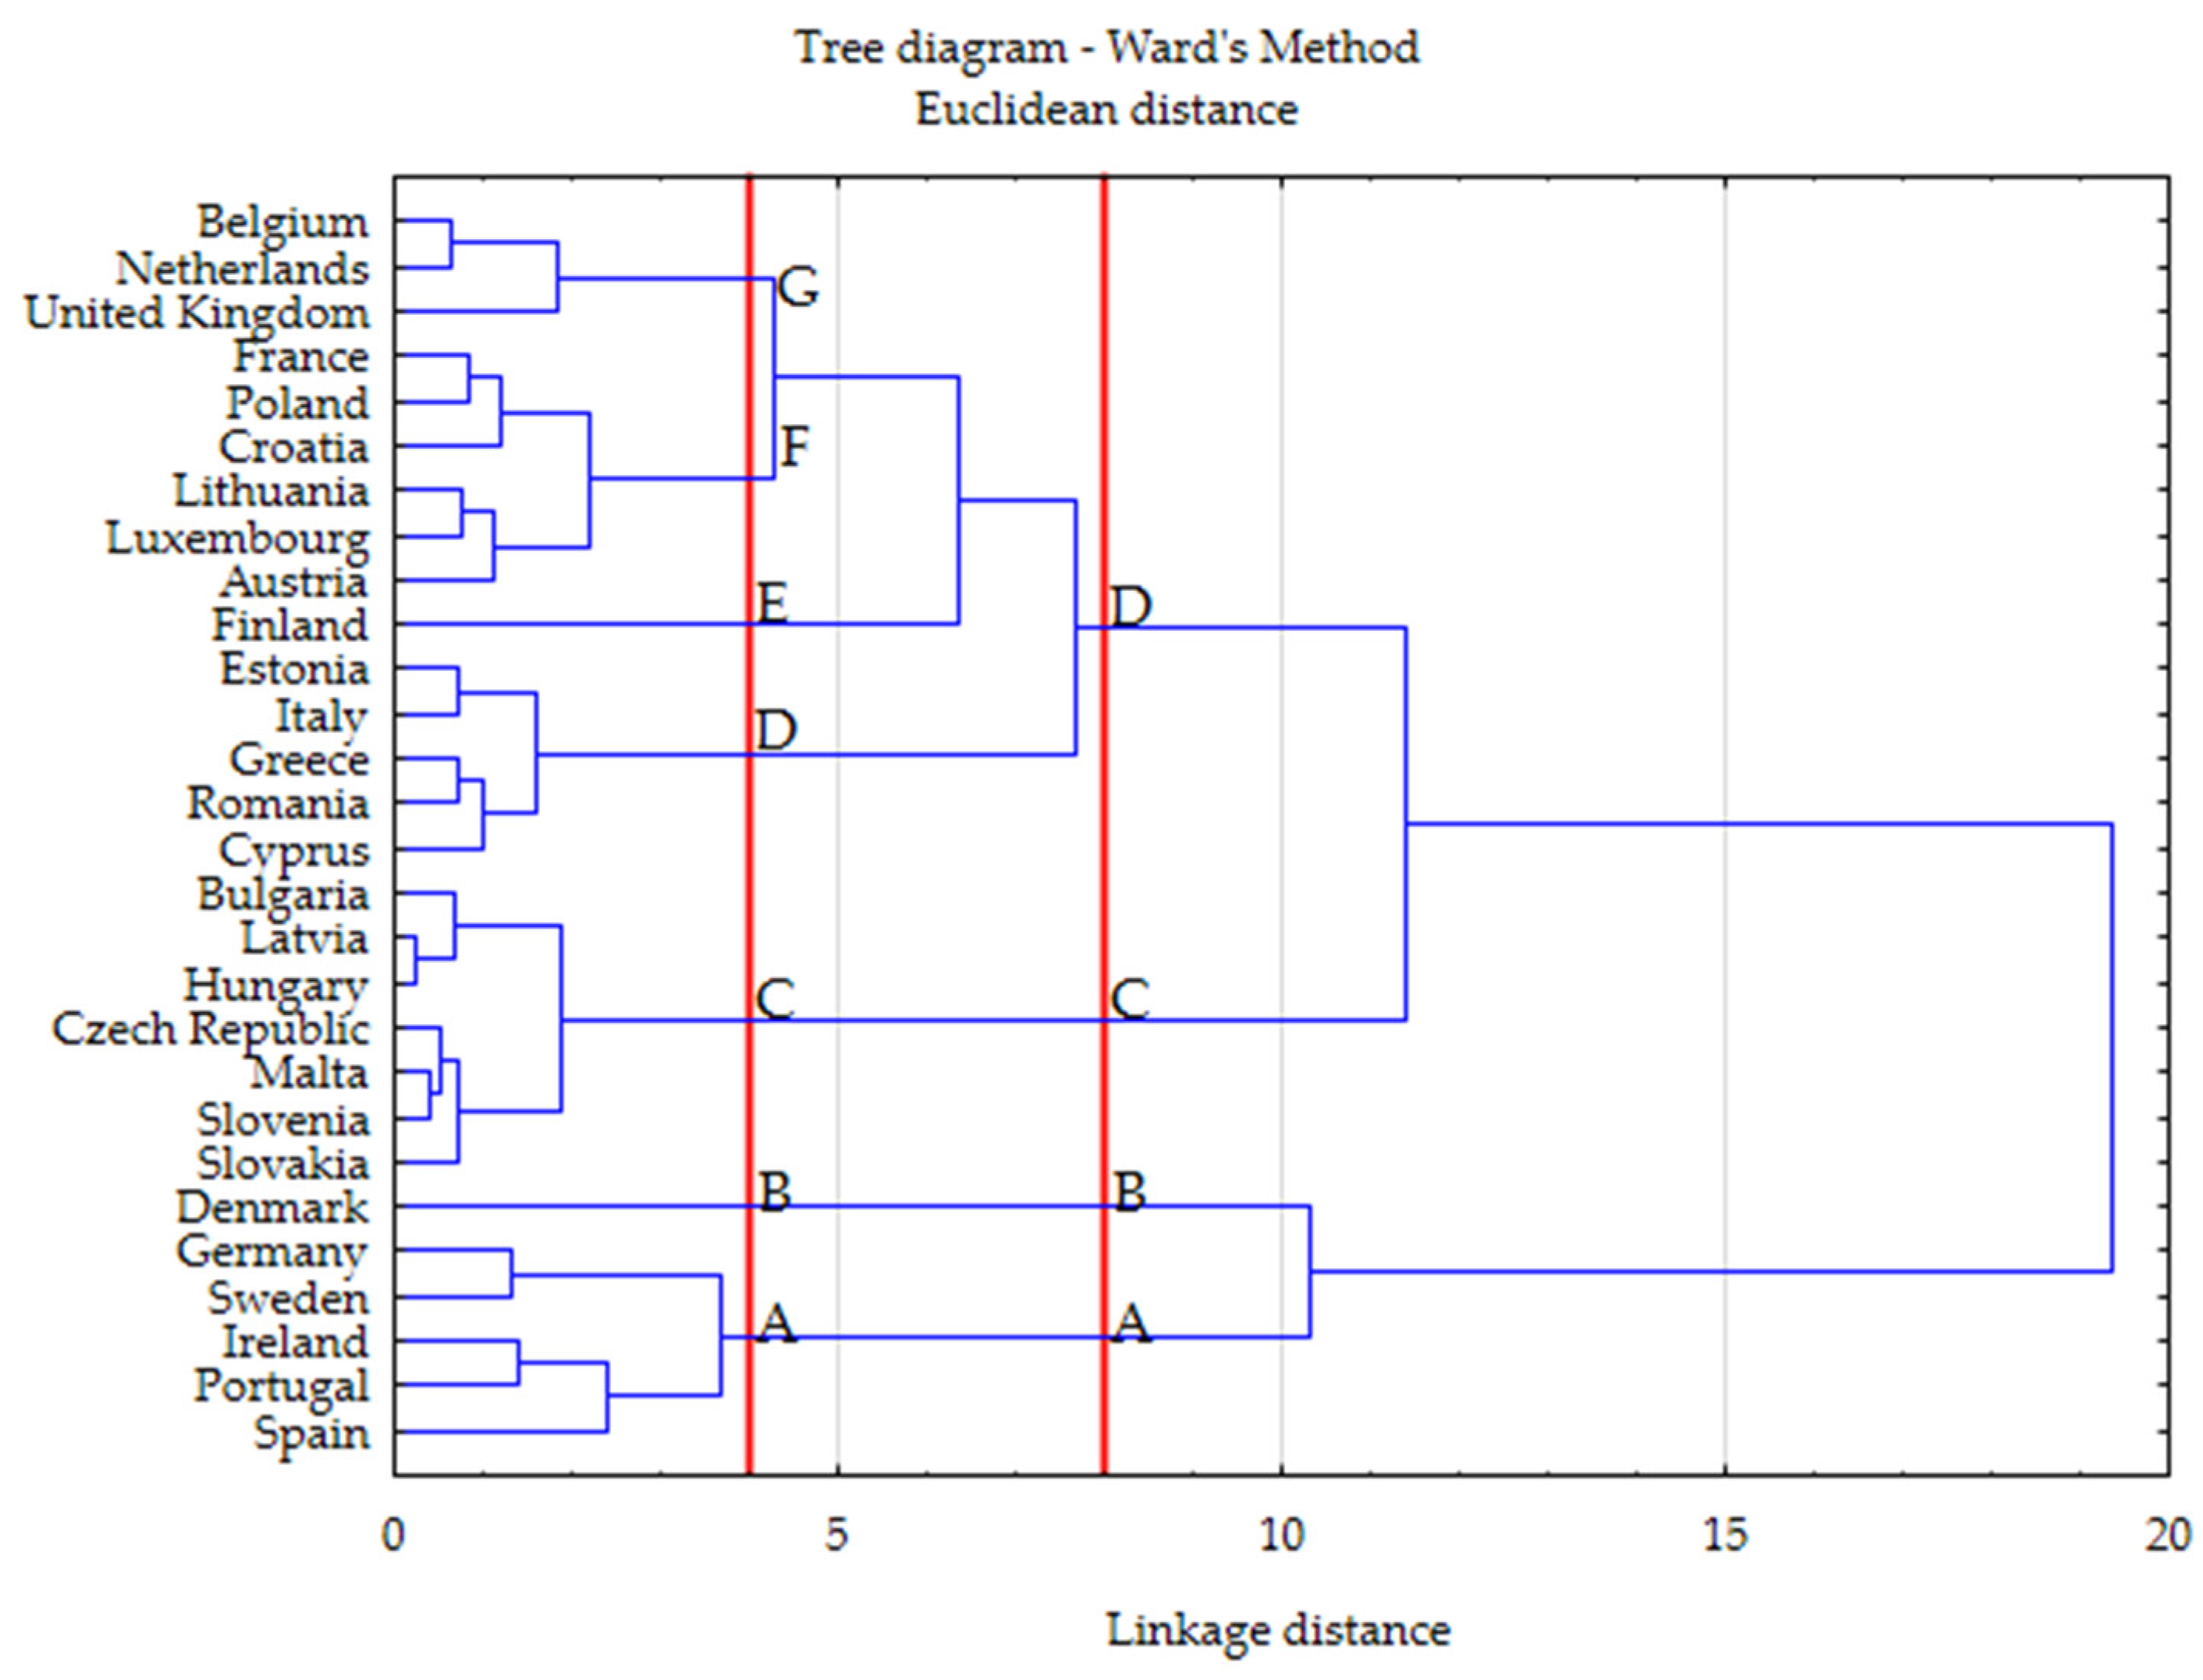
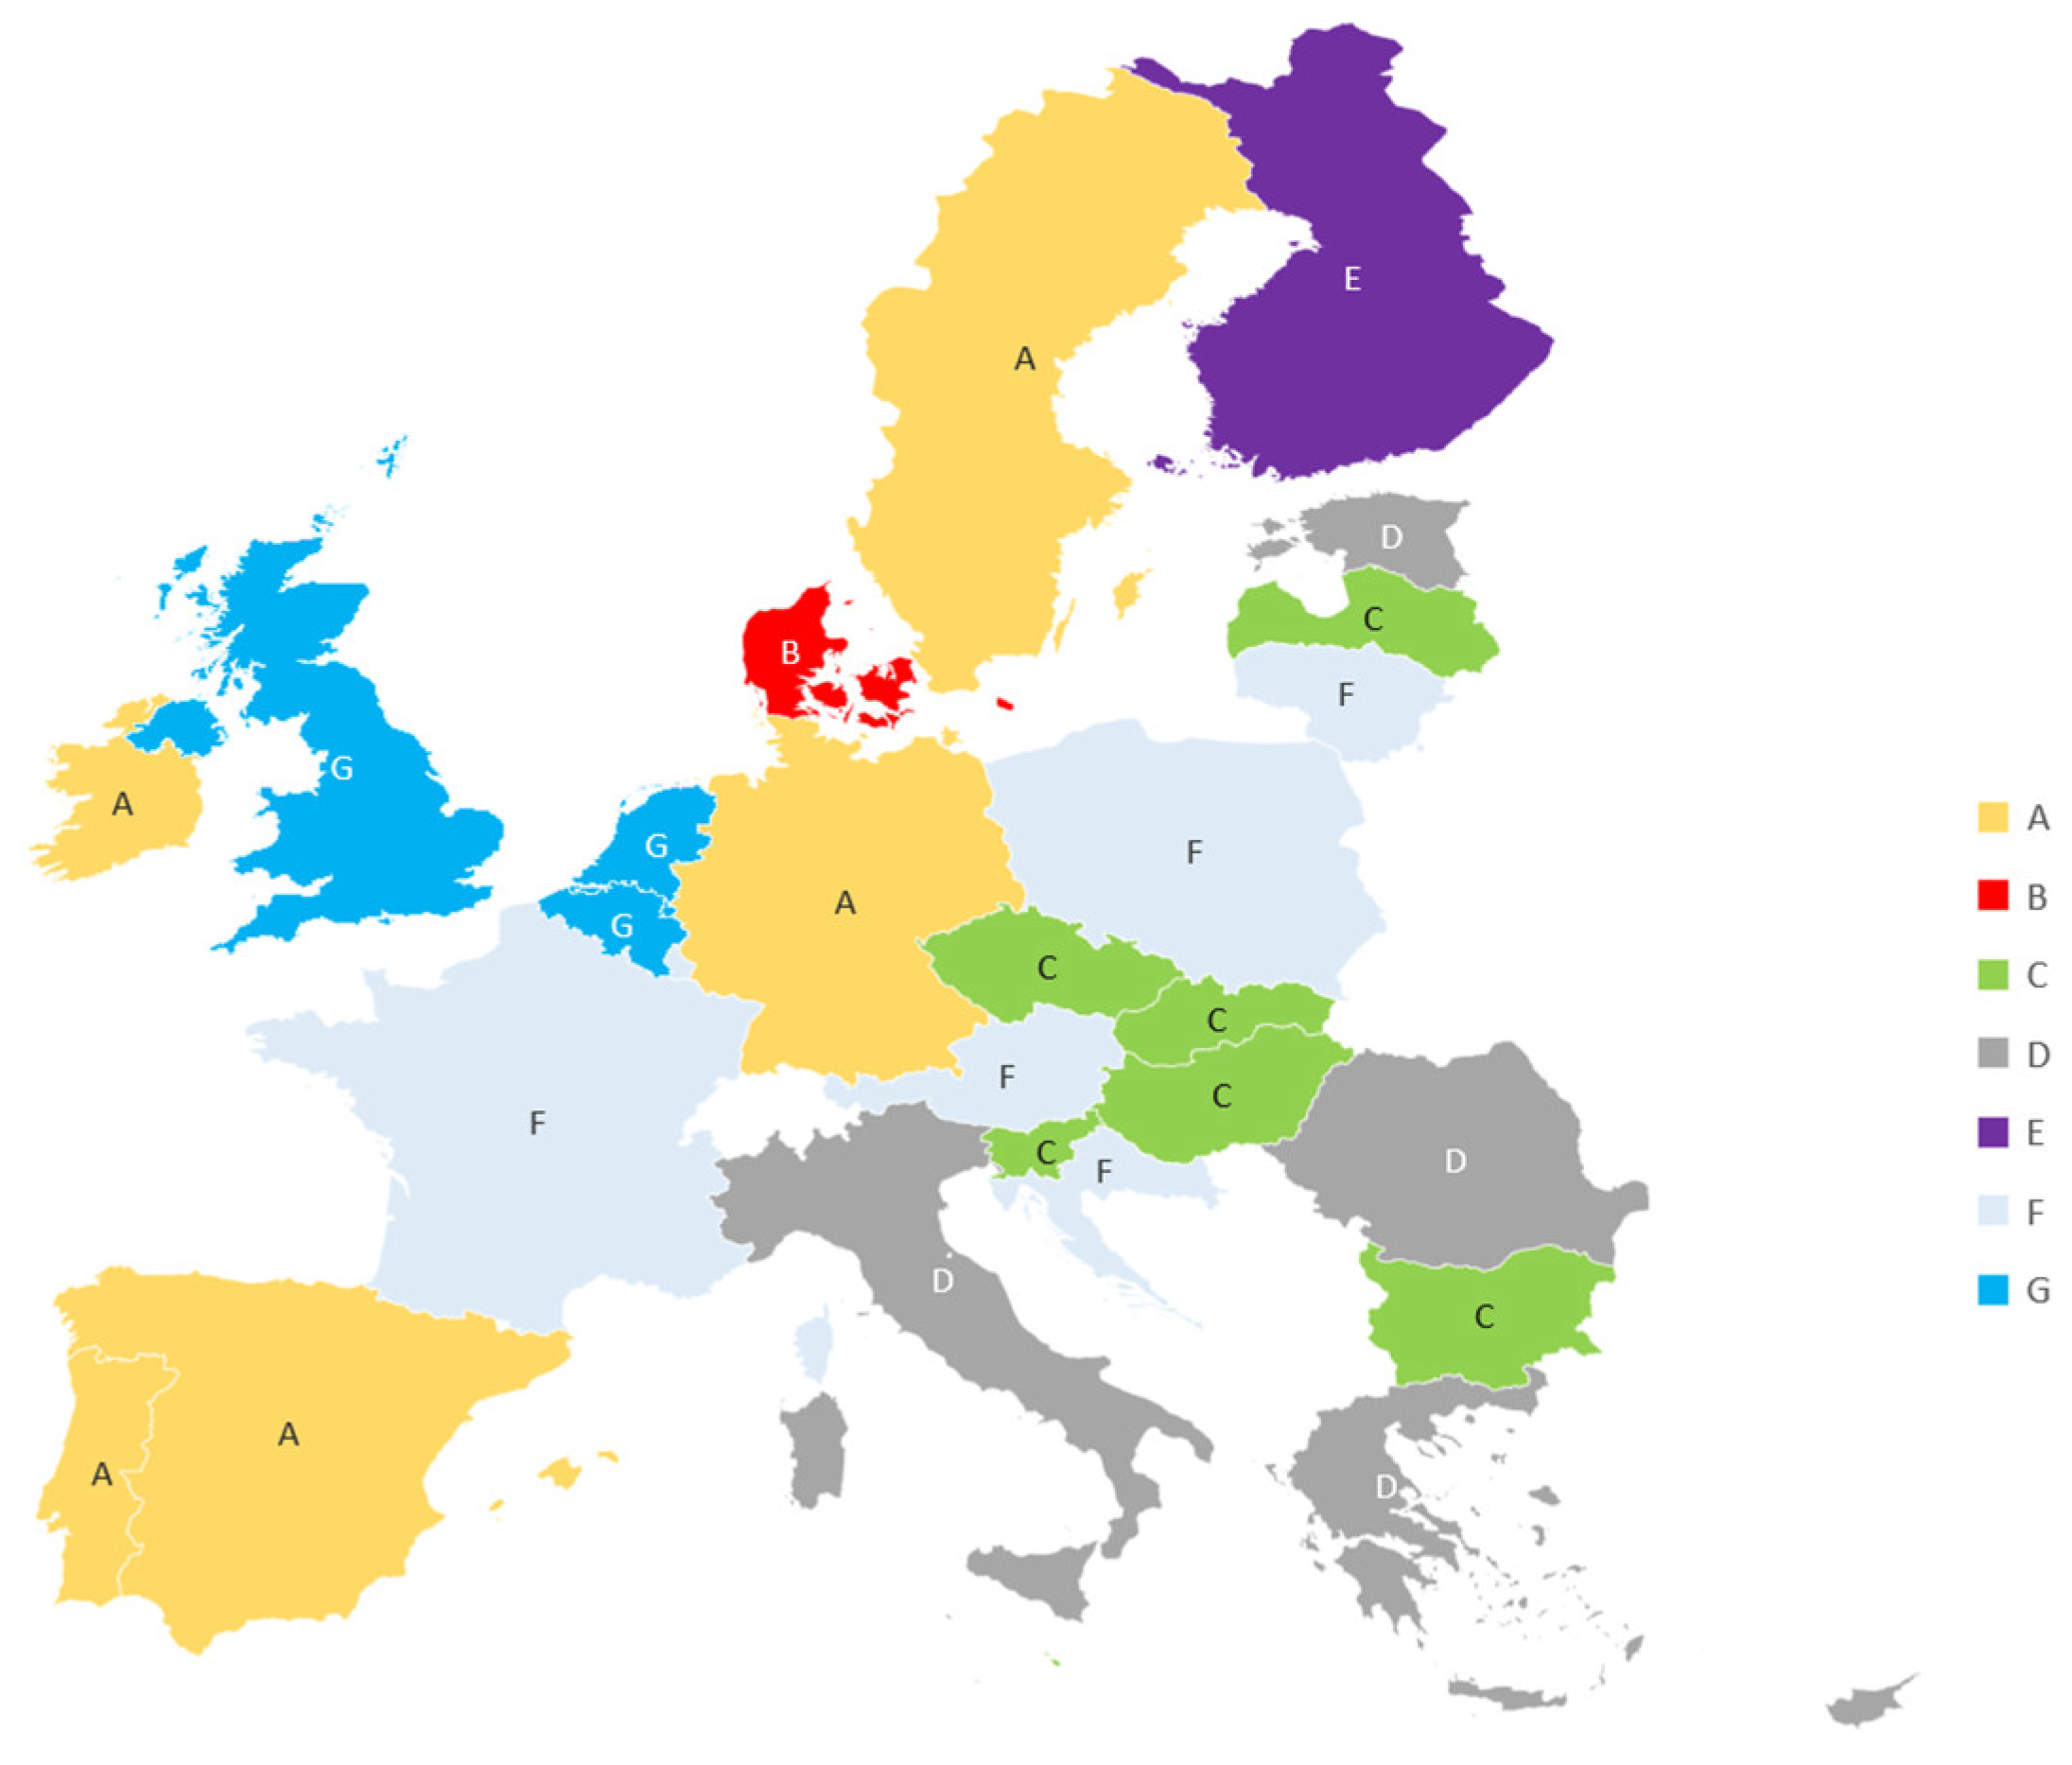
| Cluster | Countries |
|---|---|
| A | Spain, Portugal, Ireland, Sweden, Germany, |
| B | Denmark, |
| C | Slovakia, Slovenia, Malta, the Czech Republic, Hungary, Latvia, Bulgaria, |
| D | Cyprus, Romania, Greece, Italy, Estonia, |
| E | Finland, |
| F | Austria, Luxembourg, Lithuania, Croatia, Poland, France |
| G | The United Kingdom, the Netherlands, Belgium. |
| Country | GDM (Pattern) | GDM (Anti-Pattern) | TOPSIS Measure | Ranking |
|---|---|---|---|---|
| Denmark (DK) | 0.108 | 0.629 | 0.853 | 1 |
| Ireland (IE) | 0.222 | 0.528 | 0.704 | 2 |
| Sweden (SE) | 0.239 | 0.460 | 0.658 | 3 |
| Germany (DE) | 0.229 | 0.421 | 0.648 | 4 |
| Finland (FI) | 0.282 | 0.475 | 0.628 | 5 |
| Spain (ES) | 0.330 | 0.474 | 0.589 | 6 |
| Portugal (PT) | 0.318 | 0.419 | 0.568 | 7 |
| The United Kingdom (UK) | 0.289 | 0.341 | 0.541 | 8 |
| Estonia (EE) | 0.443 | 0.327 | 0.424 | 9 |
| Greece (EL) | 0.442 | 0.248 | 0.359 | 10 |
| Italy (IT) | 0.517 | 0.257 | 0.332 | 11 |
| Croatia (HR) | 0.472 | 0.229 | 0.327 | 12 |
| Austria (AT) | 0.444 | 0.184 | 0.293 | 13 |
| Belgium (BE) | 0.432 | 0.174 | 0.287 | 14 |
| Romania (RO) | 0.521 | 0.197 | 0.274 | 15 |
| Poland (PL) | 0.510 | 0.163 | 0.242 | 16 |
| The Netherlands (NL) | 0.444 | 0.139 | 0.239 | 17 |
| Cyprus (CY) | 0.559 | 0.175 | 0.239 | 18 |
| Lithuania (LT) | 0.508 | 0.118 | 0.189 | 19 |
| Luxembourg (LU) | 0.526 | 0.120 | 0.186 | 20 |
| France (FR) | 0.540 | 0.101 | 0.158 | 21 |
| Bulgaria (BG) | 0.640 | 0.043 | 0.064 | 22 |
| Latvia (LV) | 0.671 | 0.022 | 0.032 | 23 |
| Hungary (HU) | 0.683 | 0.021 | 0.029 | 24 |
| The Czech Republic (CZ) | 0.686 | 0.010 | 0.015 | 25 |
| Slovenia (SI) | 0.701 | 0.008 | 0.012 | 26 |
| Slovakia (SK) | 0.721 | 0.005 | 0.007 | 27 |
| Malta (MT) | 0.720 | 0.002 | 0.002 | 28 |
© 2020 by the authors. Licensee MDPI, Basel, Switzerland. This article is an open access article distributed under the terms and conditions of the Creative Commons Attribution (CC BY) license (http://creativecommons.org/licenses/by/4.0/).
Share and Cite
Chudy-Laskowska, K.; Pisula, T.; Liana, M.; Vasa, L. Taxonomic Analysis of the Diversity in the Level of Wind Energy Development in European Union Countries. Energies 2020, 13, 4371. https://doi.org/10.3390/en13174371
Chudy-Laskowska K, Pisula T, Liana M, Vasa L. Taxonomic Analysis of the Diversity in the Level of Wind Energy Development in European Union Countries. Energies. 2020; 13(17):4371. https://doi.org/10.3390/en13174371
Chicago/Turabian StyleChudy-Laskowska, Katarzyna, Tomasz Pisula, Mirosław Liana, and László Vasa. 2020. "Taxonomic Analysis of the Diversity in the Level of Wind Energy Development in European Union Countries" Energies 13, no. 17: 4371. https://doi.org/10.3390/en13174371
APA StyleChudy-Laskowska, K., Pisula, T., Liana, M., & Vasa, L. (2020). Taxonomic Analysis of the Diversity in the Level of Wind Energy Development in European Union Countries. Energies, 13(17), 4371. https://doi.org/10.3390/en13174371