Article

Optimal Condition-Based Maintenance Strategy for Multi-Component Systems under Degradation Failures

1
School of Mechanical Science and Engineering, Huazhong University of Science and Technology, Wuhan 430074, China
2
Yichang Meteorological Bureau, Yichang 443000, China
*
Author to whom correspondence should be addressed.
Energies 2020, 13(17), 4346; https://doi.org/10.3390/en13174346
Submission received: 8 June 2020 / Revised: 14 August 2020 / Accepted: 19 August 2020 / Published: 22 August 2020

Abstract

:
This paper proposes a condition-based maintenance strategy for multi-component systems under degradation failures. The maintenance decision is based on the minimum long-run average cost rate (LACR) and the maximum residual useful lifetime (RUL), respectively. The aim of this paper is to determine the optimal monitoring interval and critical level for multi-component systems under different optimization objectives. A preventive maintenance (PM) is triggered when the degradation of component exceeds the corresponding critical level. Afterwards, the paper discusses the relationship between the critical level and the monitoring interval with regards to the LACR and RUL. Methods are also proposed to determine the optimal monitoring interval and the critical level under two decision models. Finally, the impact of maintenance decision variables on the LACR and RUL is discussed through a case study. A comparison with conventional maintenance policy shows an outstanding performance of the new model.

1. Introduction

Maintenance decision-making is crucial to reduce cost and enhance the productivity of industries [1,2]. It has been proved by longstanding practices that condition-based maintenance (CBM) is more efficient than conventional scheduling maintenance, particularly for complex equipment [3]. CBM can effectively avoid high maintenance costs and potential hazards as well as improve the availability of sophisticated equipment [4,5]. So far, hundreds of CBM models have been reported in literature [6,7,8,9,10], and most of them assumed that the system can completely be restored to the original state. These assumptions, in fact, are not practical in reality and need to be relaxed in the CBM framework [11].
Basically, a maintenance policy relies essentially on two main decisions: when to take (preventively/correctively) maintenance actions and how to implement preventive maintenance actions [12]. In CBM modeling, the degradation process of most engineering systems can be generally divided into two phases [13]:
  • The first phase is called the normal working phase, where no obvious deviation from the normal operating state is observed. The end point of this phase is called the critical level of the system.
  • The second phase is referred to as the failure delay period, since a defect may be initiated and progressively develop into a true failure. That means the system is in a defective stage but still working, and the point of this phase is referred to as failure level.
In most present works, only the characteristic of the second phase of the system is taken into account rather than that of the whole degradation process [14]. If the characteristic of the two stages could be jointly considered into degradation modeling and maintenance optimization, the unnecessary maintenance actions and potential failures could be effectively avoided [15]. Generally, the determination of the initiation point of the second phase (i.e., critical level) will affect decision making in CBM policy, where choosing too high or too low are detrimental to the system’s reliability and production [16]. In the current industrial applications, the critical level and the maintenance cycle are usually determined based on maintainer experiences or through software simulation. Due to a lack of supportive model analysis, the selection of critical level is generally and relatively conservative, which leads to unnecessary maintenance actions with a costly system operation [17].
Although some investigations [9,18] considered the impact of the critical level and the monitoring interval on the maintenance policy, most of them have had perfect maintenance or imperfect maintenance for single component system [19]. Those assumptions have not considered the uncertainty of maintenance action and are not applicable for practical applications [11].
From the above motivations, the paper hereby proposes a practical maintenance policy based on the deterioration characteristics of complex systems. We develop a model exploring the impact of the critical level and the monitoring interval of the maintenance policy and address the problem of determining the optimal model decision variables. Meanwhile, we analyze the effects of a different soft failure cost rate on the overall operation cost. We also discuss the effects of the critical level and monitoring interval on the system reliability.
The remaining parts of the paper are organized as follows. Section 2 presents a brief system description, maintenance model, and health quantities derivations. Section 3 constructs two CBM models in which maintenance decision is made based on the LACR and RUL, respectively. The methods of finding optimal solutions and parameters estimates are presented. Section 4 gives a case example to illustrate the proposed method and analyzes the related CBM decision variables. Section 5 summarizes this paper.

2. Model Development

2.1. System Description

The system consists of m components, i.e., { 1 , i , , m } as shown in Figure 1. The overall system is subject to condition monitoring at discrete time points θ , 2 θ , , n θ , n = ( 1 , 2 , . . , ) , θ R + due to the limitations of sensor techniques and system structures. The system fails if the degradation level of one component i exceeds the corresponding L i , which is called the degradation failure level. Each component i experiences a degradation failure denoted by F i , and all the degradation failures are numbered from F 1 to F m . If the deterioration of the component has reached failure level, the system will continue operating with a lower performance and be likely to cause high quality loss in production.
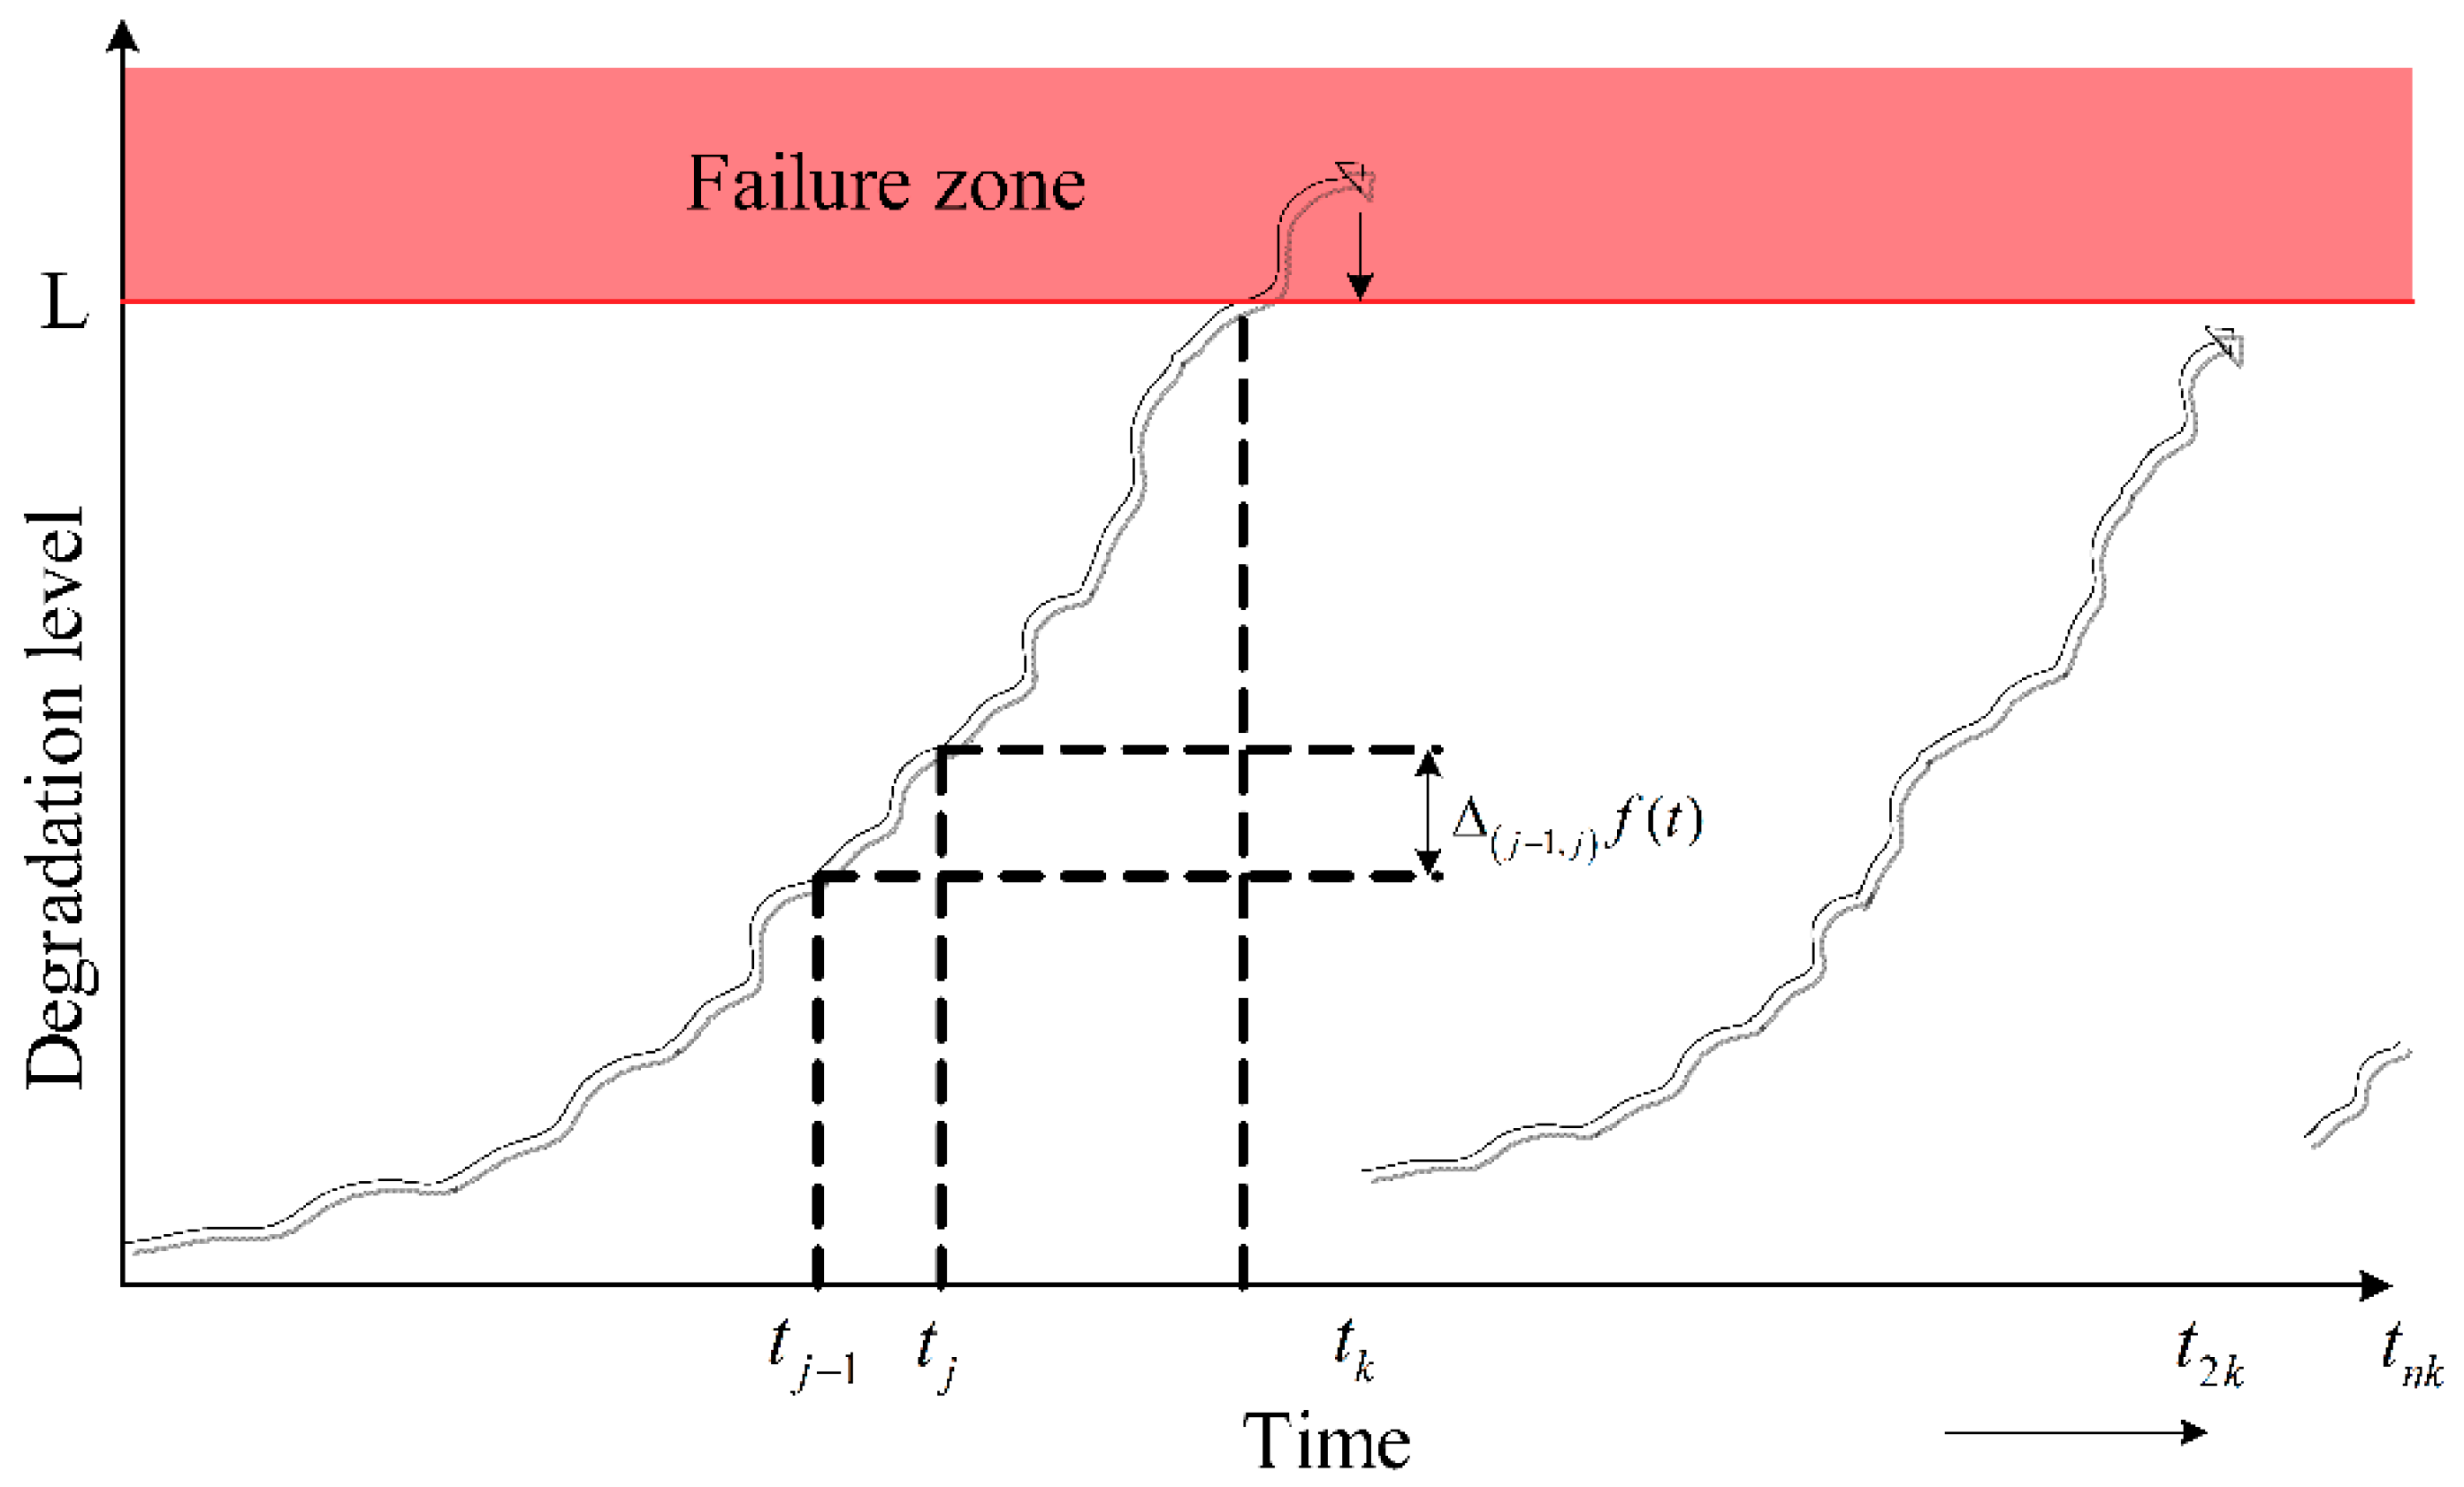
The system is operational under varying working conditions and subject to a continuous accumulation of wear and tear. For a given component i , it is assumed that deterioration is a stochastic process and described by a detective stochastic scalar variable f i ( t ) . Based on the actual deterioration behavior of component i , the random deterioration increments in a time interval are considered to be non-negative and monotonically increasing, which is shown in Figure 2. Accordingly, the deterioration increment of component i between t j 1 and t j is described by an exponential random variable Δ ( j 1 , j ) f i ( t ) , j R + . The degradation path of component i can be expressed as
f i ( t ) = c i + α e b i t
where b i and c i are constant parameters for component i . α is a random variable and M is the sample space of α . The degradation of the system has the following characteristics:
  • Δ ( j 1 , j ) f i ( t ) has independent increments.
  • The random variable parameter α follows an exponential probability density function.
An amount of degradation failure cost rate E is charged on the overall system if the system fails, and a costly corrective maintenance (CM) action would be performed. In practice, there is less likelihood that maintenance action could restore the conditions of components back to the exact initial operating condition. Therefore, a practical model is presented in the following section to estimate the real status of the system.

2.2. Maintenance Model

Since the deterioration process of the system is a stochastic progress, any of the maintenance actions will take the system condition to an approximately initial operating state. It is shown in the literature that the deterioration level of the system after a maintenance action can be random [11]; therefore, we assume the actual degradation path component i j via condition monitoring has the following relation:
y i ( t ) = f i ( t ) + ε = f i ( t k ; α ) + ε
where ε is the combined measurement and maintenance restoration errors, ε ~ N ( μ , σ 2 ) .
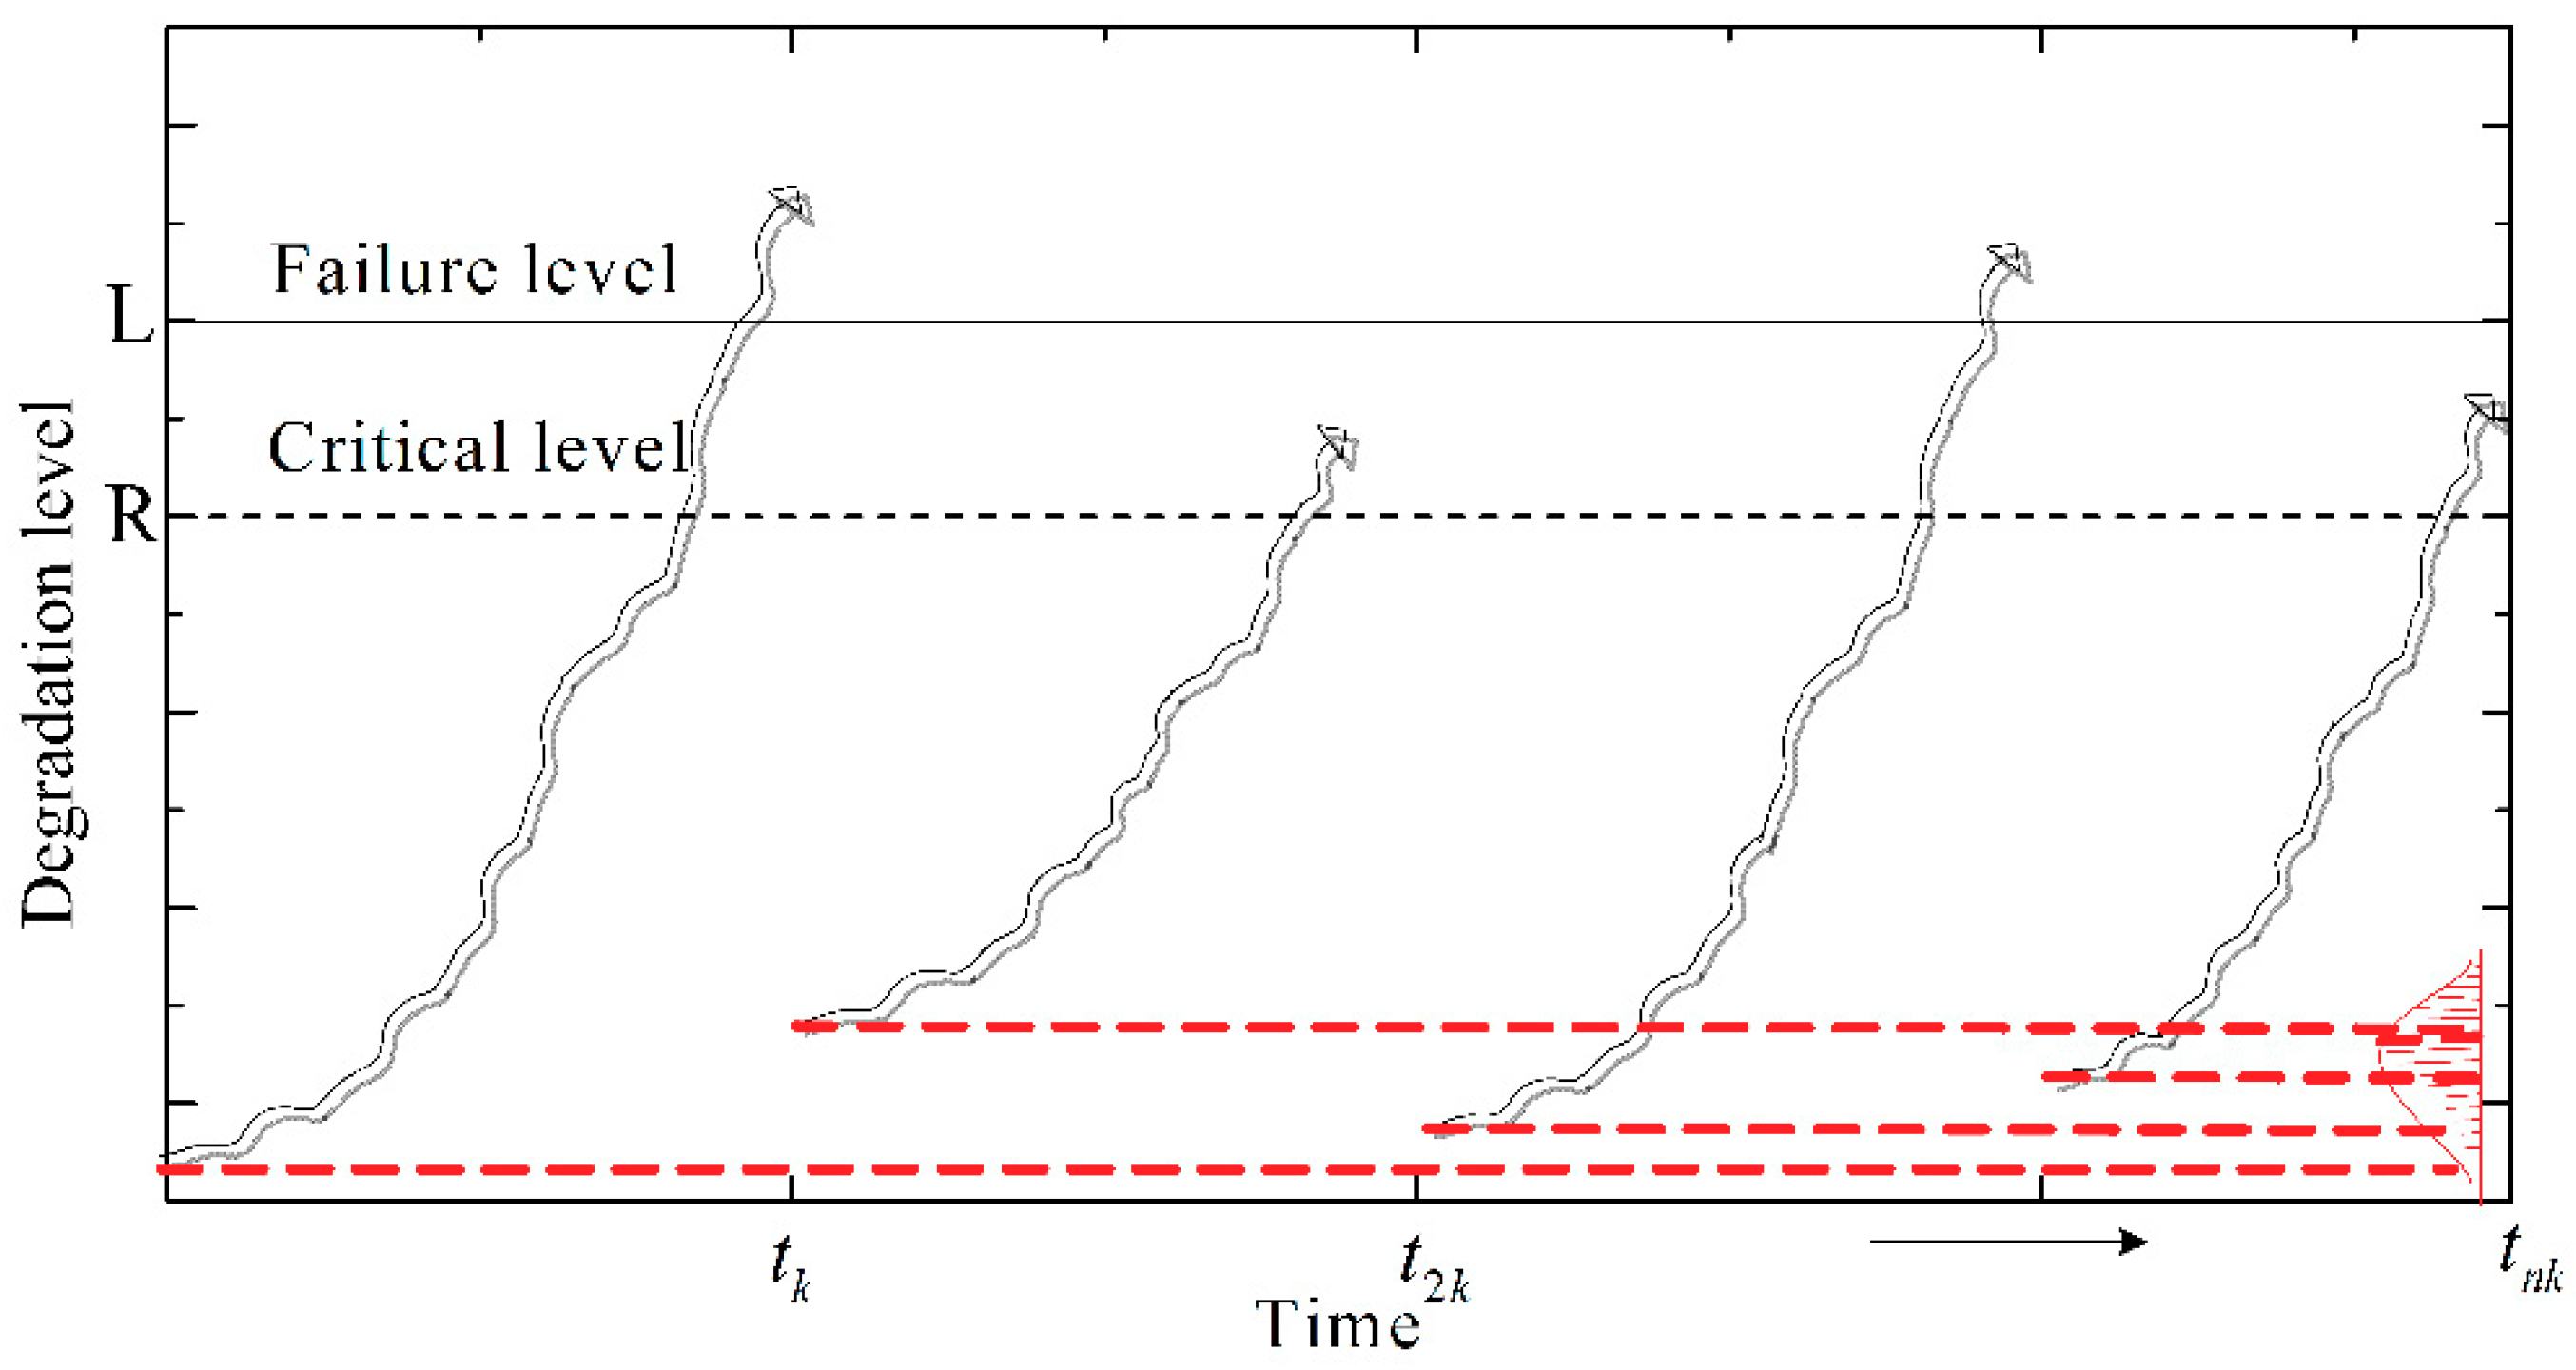
In practice, a failure always leads to large amount of economic losses and delays in product processing [20,21]. To reduce this high expense of maintenance cost, for each component i , the critical level R i is introduced to conduct PM actions at the monitoring epoch, before its degradation level exceeds L i ( R i < L i ), as shown in Figure 3. In this paper, the following decision process of the maintenance policy is adopted.
  • If the degradation level of a component increases rapidly and exceeds both the failure level and critical level at the monitoring epoch n θ , that is f i ( t ) > L i , a CM action would be taken.
  • If the degradation of components increases gradually and the degradation level is between R i and L i at the monitoring epoch n θ , that is R i f i ( t ) < L i , a PM action would be taken.
  • If the degradation level of components increases to below the critical level at the monitoring epoch n θ , that is f i ( t ) < R i , maintenance action would not be taken until it reaches the critical level R i or failure level L i at next monitoring epoch.
From the above decision process, the monitoring interval and the critical level are the decision variables in our maintenance model and need to be optimized.

2.3. Health Quantities Derivation

In this part, we focus on derivation of a PM action or CM action within a monitoring interval. According to the probability distribution, the probability of t t Y is shown as follows:
P { t t Y } = P { y i ( t ) Y }
where t Y is the passage time of the threshold Y . On the basis of distribution function of ε , the distribution of y i ( t ) at time t Y for a given α can be written by [14]:
P ( t t Y | α ) = P ( y i ( t ) Y | α )                       = P ( f i ( t k ; α ) + ε Y )                       = P ( ε Y f i ( t k ; α ) )                       = F ε ( Y f i ( t k ; α ) )                       = Φ Y f i ( t k ; α ) μ σ }
where F ε is the distribution function of ε ; Φ ( ) is the normal distribution function. Integrating overall possible α , the P ( t t Y ) is given by
P ( t t Y ) = P ( y i j ( t ) Y )                   = M g ( α ) P ( y i j ( t ) Y | α ) d α                   = M g ( α ) Φ Y f i j ( t k ; α ) μ σ d α
where g ( α ) is the probability distribution function of α , and M is the sample space of α . According to Equation (3), the distribution of the time to failure can be expressed by
F ( t ) = P { t t L } = M g ( α ) Φ L f i ( t k ; α ) μ σ d α
If a maintenance action is set up at monitoring point n θ , this means that from ( n 1 ) θ to n θ , the actual degradation level y i ( t ) increases to a value between critical level R i and failure level L i or exceeds L i j (which CM is performed). Therefore, based on Equation (3), the probability that CM or PM occurs at time point t k can be expressed as
{ P { C M } = P { t ( n 1 ) θ < t Y < t n θ , t n θ t L } P { P M } = P { t ( n 1 ) θ < t Y t n θ , t n θ < t L }
Based on Equations (5) and (6), the incidence of CM or PM can be obtained as:
{ P { C M } = [ F t ( t n θ ) F t ( t ( n 1 ) θ ) ] P ( y i ( t ) L i ) P { P M } = [ F t ( t n θ ) F t ( t ( n 1 ) θ ) ] P ( y i ( t ) < L i )
For the totality of α , integrating all the possible α , Equation (8) can be derived from Equation (5), which is written as:
{ P { C M } = M g ( α ) [ F ( t n θ | α ) F t ( t ( n 1 ) θ | α ) ] P ( y i ( t ) L i | α ) d α P { P M } = M g ( α ) [ F ( t n θ | α ) F t ( t ( n 1 ) θ | α ) ] P ( y i ( t ) < L i | α ) d α
Therefore, the probability of a PM or CM action performing in a monitoring interval is obtained. In the next, we devote to the optimal maintenance decision-making model.

3. Maintenance Decision-Making

This section proposes two maintenance decision models, which are based on the minimum LACR and the maximum RUL, respectively. A method to determine the optimal monitoring interval and critical level is discussed and the unknown model parameters are also estimated.

3.1. Maintenance Decision Based on Maximum LACR

The LACR comprises CM cost, PM cost, and soft failure cost. To begin with, the LACR for component i can be obtained by dividing the total expected operation cost by the expected cycle length. The total operation cost T C can be calculated by adding all the costs for components, which is given by:
T C = i = 1 m C i ( R i , θ )       = n = 1 [ n P { P M } C P M , i + n P { C M } C C M , i ] + C S , t
where C P M , i and C C M , i are the mean PM and CM costs for component i , respectively. The average soft failure cost for component i in a monitoring interval can be calculated as
C S , t = E t ( n 1 ) θ t n θ t P { C M } t d t
The expected cycle length for system can be solved using Equation (9) as:
C L = n = 1 t n θ ( P { P M } + P { C M } )
Therefore, the optimization model based on minimum LACR is expressed as
min ω ( R , θ ) = ω ( R * , θ * ) = T C R * , θ * C L R * , θ *
where R * = { R 1 * , , R m * } are the set of optimal values of critical level for each component. θ * is the optimal monitoring interval under a minimum LACR model.

3.2. Maintenance Decision Based on Maximum RUL

RUL based maintenance policy is particularly effective, especially in the context of CBM [22]. The aim of this policy is to establish an optimization model based on the maximum RUL for the system. RUL is defined as the duration left for the system before it fails [23]. Let f i be the failure rate of the component i , so f i can be expressed as:
f i = n = 1 P { C M }      = n = 1 { M g ( α ) [ F ( t n θ | α ) F t ( t ( n 1 ) θ | α ) ] P ( y i ( t ) L i | α ) d α }
Let S i denote the reliability of the component i over time interval [ 0 , n θ ] , we have
S i = 1 f i
Then the mean RUL of component i can be derived as
RUL i = 0 n θ ( 1 n = 1 { M g ( α ) [ F ( t n θ | α ) F ( t ( n 1 ) θ | α ) ] P ( y i ( t ) L i | α ) d α } )
In a similar way, the RUL optimization model is given by
max RUL ( R * , θ * ) = i = 1 m RUL i ( R i * , θ * )
where R * = { R 1 * , , R m * } are the set of optimal values of critical level under maximum RUL. θ * is the optimal monitoring interval under maximum RUL.

3.3. Optimal Solution for Monitoring Interval and Critical Level

As we know the failure level can be known from maintenance records and is usually fixed [24]. The critical level and the maintenance interval in Equations (13) and (16) are decision variables and need to be determined. Notice that the monitoring interval is assumed to be constant, namely each interval is equal, so that the critical level can be obtained for each component. This could be determined by:
{ ω ( R , θ ) / θ = 0 ω ( R , θ ) / R = 0
From this equation, we can find the optimal values of R * and θ * for the system by minimizing the LACR.
In a same manner, optimal values of R * and θ * for each component based on the longest RUL can be determined by solving:
{ RUL ( R * , θ * ) / θ = 0 RUL ( R * , θ * ) / R = 0
In some cases, this method is especially useful for equipment whose degradation increases slightly in a long period of time [25]. This equipment generally adopt fixed monitoring intervals because of economic and convenient reasons [26].

4. Experimental Example

4.1. Application and Results

The purpose of this section is to describe how the proposed maintenance model can be used in the maintenance optimization of a wind turbine transmission system through a simple example whose characteristics are illustrated in Section 2. The transmission unit consists of six bearing components. We monitor the crack length and width of each bearing and use the product of the crack length and width as measurement of the bearing degradation. The measurement path of one bearing is illustrated in Figure 4.
According to statistics from the previous maintenance records, the model parameters are estimated using the maximum likelihood estimation method [27]. The fitted values are given in Table 1, and the maintenance data is indicated in Table 2.
Using the approach presented in Section 4, for the minimum LACR model, the optimal monitoring interval is computed as θ = 48 , and the optimal critical levels for each component are illustrated in Table 3. For the maximum RUL model, the optimal monitoring interval is computed as θ = 43 , and corresponding optimal critical levels are presented in Table 4. We can find that the maximum RUL model gives much more conservative control policy than the minimum LACR model.
The soft failure cost rate is an essential part of the maintenance cost and has a potential impact on the process of establishing a CBM model. In proposed maintenance strategy, the soft failure cost rate of the system under different working conditions is not constant. Changes in amount of soft failure cost rate can affect determination of the optimal decision variables (i.e., monitoring interval, critical level) in the CBM model. Therefore, the influence of failure cost rate on decision variables is analyzed in the subsection.

4.2. Influence of Failure Cost Rate on Optimal LACR

This subsection focuses on analyzing the influence of the failure cost rate on the average operation cost and related decision variables. The three situations are considered: (1) for a system incurred low failure cost rate; (2) for a system incurred medium failure cost rate; (3) for a system incurred high failure cost rate.
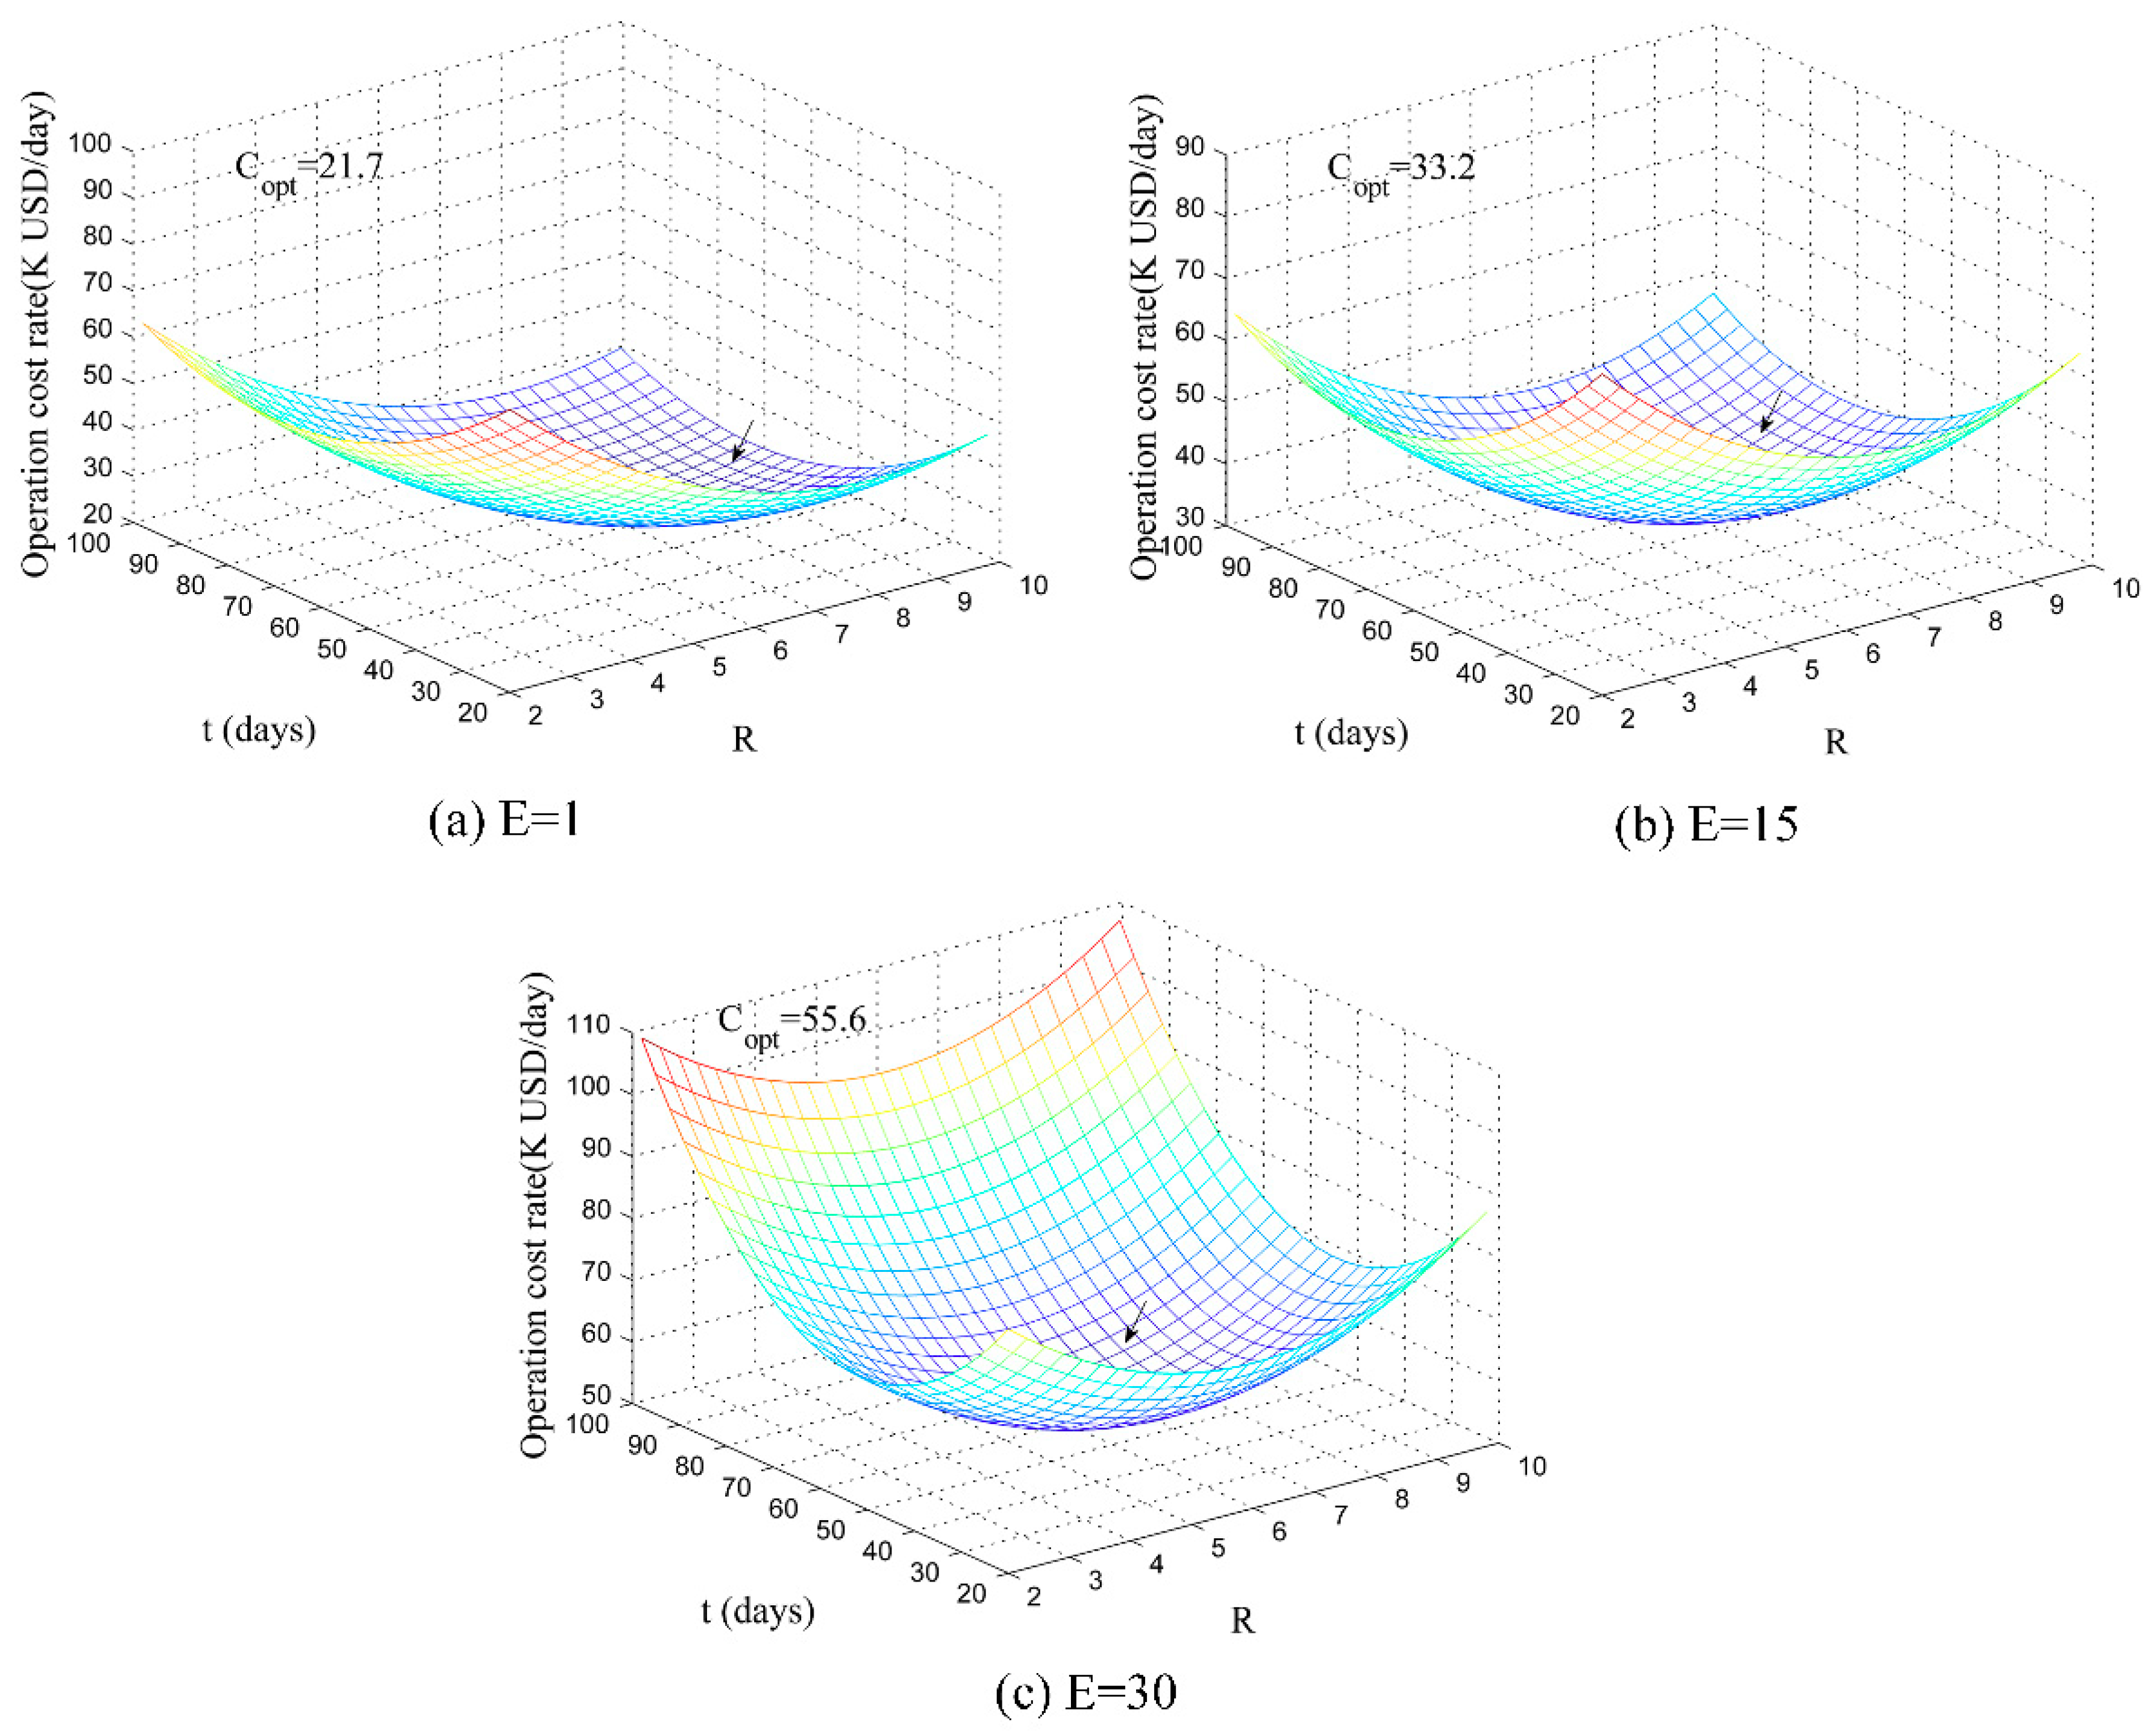
Hence, for three different failure cost rates (i.e., E = 1, 15, 30), Figure 5 indicates the evolution of the cost surface as a function of the monitoring interval and critical threshold. In order to find the optimal decision variables under varying policies, we have investigated the minimum maintenance cost rate under different values of monitoring interval and critical levels using Equations (13) and (16). The optimal critical level and monitoring interval are obtained for the transmission system and presented in Figure 5. The obtained minimum operation cost rate is denoted as C o p t .
As shown in Figure 5, all surfaces are concave shaped which can lead to optimization procedure. When the soft failure cost rate is negligible or close to zero (Figure 5a), the optimal value of the monitoring interval is 85 with the optimal C o p t = 21.7. When the soft failure cost rate increases to a medium cost range (Figure 5b), the optimal monitoring interval decreases to 55 and the optimal C o p t rising to 33.2. When the soft failure cost rate reaches a high level (Figure 5c), the optimal C o p t continues increasing to 55.6, with the optimal monitoring interval dropping to 48.
It is clear that as the soft failure cost rate increases, the values of optimal monitoring interval and critical level present decreasing trends, but the minimum LACR of the transmission system shows an upward trend. For a system incurred by a higher soft failure cost rate, the preventive maintenance actions need to be set up at a lower degradation level. This means that earlier and more frequent maintenance actions are needed when the soft failure cost rate goes higher.

4.3. The Relationship between the RUL and Decision Variables

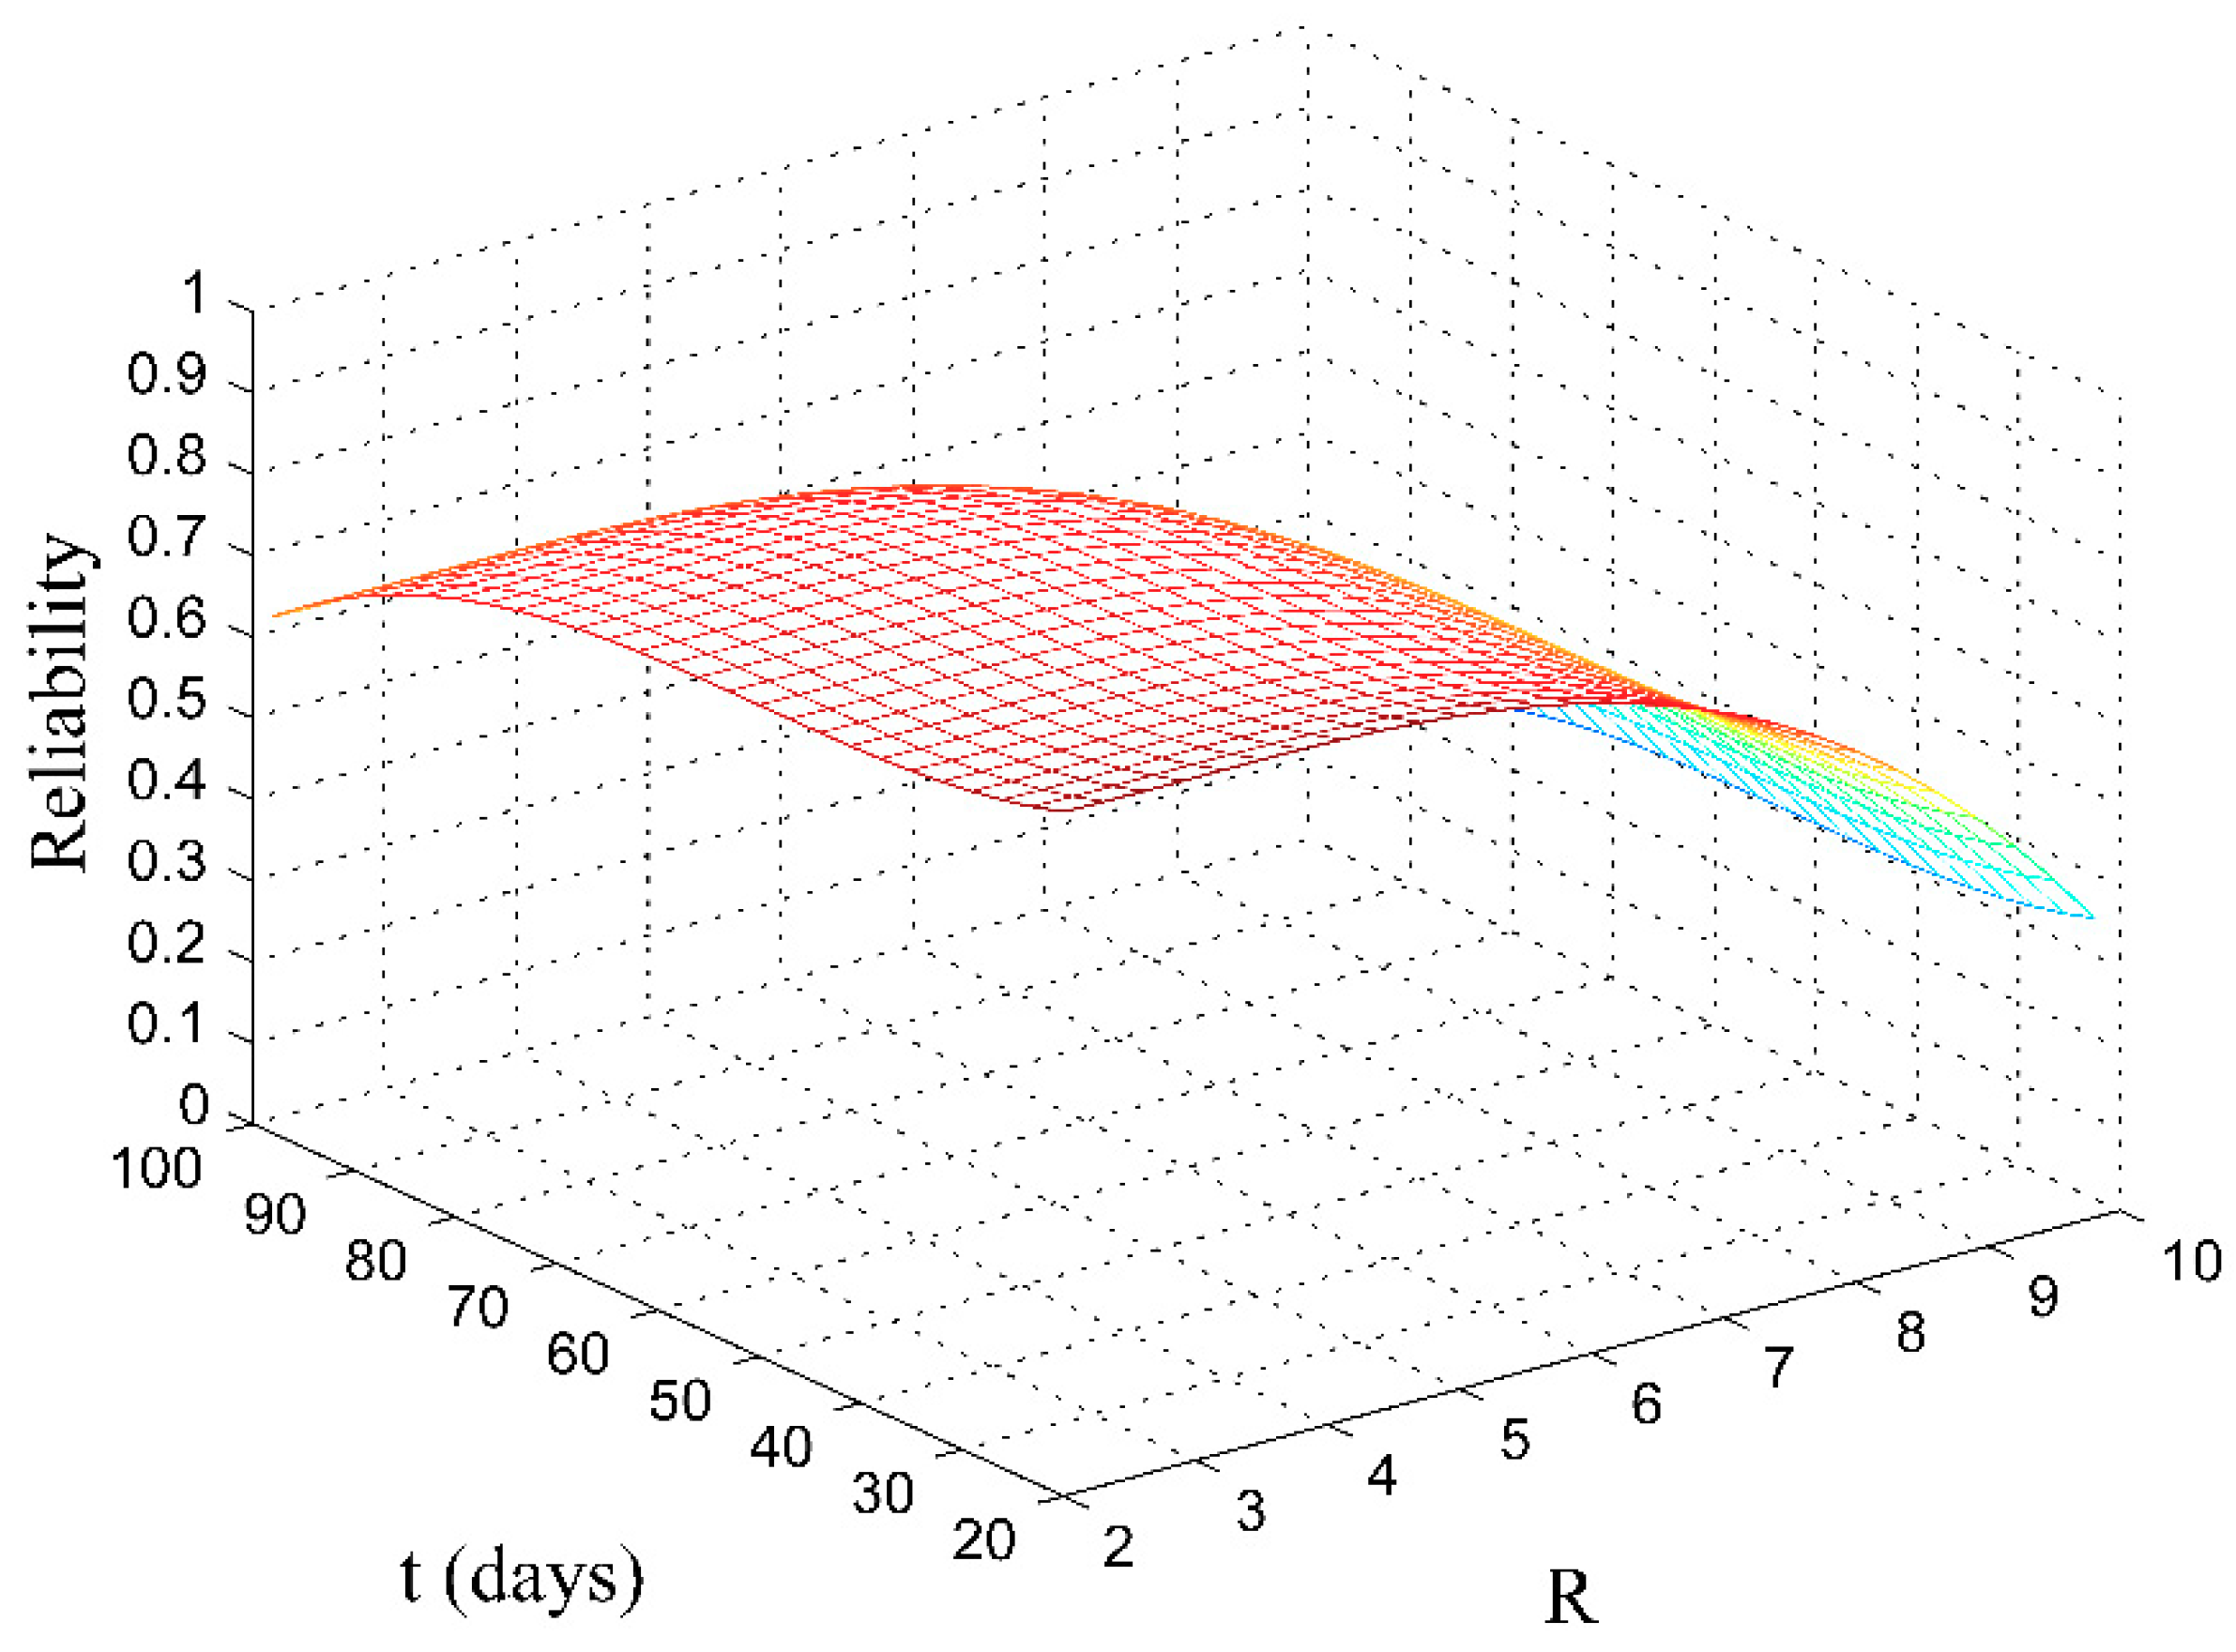
For the RUL based maintenance policy, it is clear that system reliability depends on the monitoring epoch and the degradation level. We have investigated the relationship of optimal RUL and decision variables. Figure 6 illustrates the evolution of the reliability of the transmission system as a function of the monitoring interval and critical threshold at the 25th monitoring epoch. A medium level of failure cost rate is considered to show the reliability of transmission system changes with decision variables. The other maintenance costs remain the same as the previous case.
As indicated in Figure 6, the monitoring interval and the critical level present strong negative influences on reliability of the transmission system. The change of monitoring interval has a more noticeable impact on the transmission system reliability. In this case, we can obtain the optimal range of values of decision variables. As shown in Figure 6, the higher values of system reliability are found in terms of smaller values of monitoring intervals and critical, which means more maintenance actions are set up, the system is more likely to keep a higher level of reliability. However, according to what we have found above, smaller values of decision variables suggest that the failure cost rate will be very high. Consequently, it is especially important to emphasize the balance of LACR and RUL when we consider both objectives of complex production systems.
Compared with the typical age-based policy [22], which carries out repairs 55 days with a failure level of 9.7, a medium level of failure cost rate 12, and same parameters configurations mentioned above, the strategy recommended by the proposed model gives 31.6 of LACR. This is noticeably less than the 52.7 under classical age-based maintenance policy.

5. Conclusions and Future Work

In this study, a CBM model which maintenance decision is made based on minimum LACR and maximum RUL. The preventive maintenance is triggered when the degradation level exceeds a critical level. The degradation failure incurs costly production loss and the reasonable optimizations of critical level and monitoring interval are required. The optimal maintenance critical level of components and the optimal monitoring interval are determined by maximizing RUL and minimizing LACR. Afterwards, the proposed strategy is optimized and a method to find the optimal monitoring interval and the critical level is presented. Lastly, the influence of soft failure cost rates on the LACR, and the relationship between the RUL and decision variables, are investigated through a case of multi-component system.
The model developed can be applied on a variety of engineering systems with a large number of non-identical components with different random degradation characteristics (e.g., generator set, turbines set). In practice, the developed model is instructive and meaningful to practical engineering applications. Our future research work will focus on the competing risks of failure modes under economic dependency among components. In this consideration, a dynamic monitoring interval will be also investigated.

Author Contributions

Conceptualization, K.W.; methodology, K.W.; software, K.W.; validation, K.W. and L.D.; formal analysis, K.W.; investigation, L.D.; resources, K.W.; data curation, K.W.; writing—original draft preparation, K.W.; writing—review and editing, L.D.; visualization, C.D.; supervision, C.D.; project administration, C.D. All authors have read and agreed to the published version of the manuscript.

Funding

The research was funded by the National Natural Science Foundation of China under grant number 51905330.

Conflicts of Interest

The authors declare that they have no conflicts of interest.

References

  1. Zhou, Y.; Sun, Y.; Mathew, J.; Wolff, R.; Ma, L. Latent degradation indicators estimation and prediction: A Monte Carlo approach. Mech. Syst. Signal Process. 2011, 25, 222–236. [Google Scholar] [CrossRef]
  2. Hajej, Z.; Rezg, N.; Gharbi, A. Quality issue in forecasting problem of production and maintenance policy for production unit. Int. J. Prod. Res. 2018, 56, 6147–6163. [Google Scholar] [CrossRef]
  3. Alsyouf, I. The role of maintenance in improving companies’ productivity and profitability. Int. J. Prod. Econ. 2007, 105, 70–78. [Google Scholar] [CrossRef]
  4. Duan, C.; Deng, C. Prognostics of health measures for machines with aging and dynamic cumulative damage. IEEE/ASME Trans. Mechatron. 2020, 1–12. [Google Scholar] [CrossRef]
  5. Do, P.; Voisin, A.; Levrat, E.; Iung, B. A proactive condition-based maintenance strategy with both perfect and imperfect maintenance actions. Reliab. Eng. Syst. Saf. 2015, 133, 22–32. [Google Scholar] [CrossRef]
  6. Hong, H.P.; Zhou, W.; Zhang, S.; Ye, W. Optimal condition-based maintenance decisions for systems with dependent stochastic degradation of components. Reliab. Eng. Syst. Saf. 2014, 121, 276–288. [Google Scholar] [CrossRef]
  7. Yanbin, C.; Bo, C. The Condition Based Maintenance Evaluation Model on On-post Vacuum Circuit Breaker. Syst. Eng. Procedia 2012, 4, 182–188. [Google Scholar] [CrossRef]
  8. Duan, C.; Deng, C.; Wang, B. Multi-phase sequential preventive maintenance scheduling for deteriorating repairable systems. J. Intell. Manuf. 2019, 30, 1779–1793. [Google Scholar] [CrossRef]
  9. El-Thalji, I.; Jantunen, E. On the Development of Condition Based Maintenance Strategy for Offshore Wind Farm: Requirement Elicitation Process. Energy Procedia 2012, 24, 328–339. [Google Scholar] [CrossRef] [Green Version]
  10. Tian, Z.; Jin, T.; Wu, B.; Ding, F. Condition based maintenance optimization for wind power generation systems under continuous monitoring. Renew. Energy 2011, 36, 1502–1509. [Google Scholar] [CrossRef]
  11. Duan, C.; Deng, C.; Gharaei, A.; Wu, J.; Wang, B. Selective maintenance scheduling under stochastic maintenance quality with multiple maintenance actions. Int. J. Prod. Res. 2018, 56, 7160–7178. [Google Scholar] [CrossRef]
  12. Duan, C.; Deng, C.; Gong, Q.; Wang, Y. Optimal failure mode-based preventive maintenance scheduling for a complex mechanical device. Int. J. Adv. Manuf. Technol. 2018, 95, 2717–2728. [Google Scholar] [CrossRef]
  13. Wang, W. A two-stage prognosis model in condition based maintenance. Eur. J. Oper. Res. 2007, 182, 1177–1187. [Google Scholar] [CrossRef]
  14. Zhang, M.; Ye, Z.; Xie, M. A condition-based maintenance strategy for heterogeneous populations. Comput. Ind. Eng. 2014, 77, 103–114. [Google Scholar] [CrossRef]
  15. Duan, C.; Makis, V.; Deng, C. A two-level bayesian early fault detection for mechanical equipment subject to dependent failure modes. Reliab. Eng. Syst. Saf. 2019, 193, 106676. [Google Scholar] [CrossRef]
  16. Wang, W. A model to determine the optimal critical level and the monitoring intervals in condition-based maintenance. Int. J. Prod. Res. 2000, 38, 1425–1436. [Google Scholar] [CrossRef]
  17. Sbihi, M.; Varnier, C. Single-machine scheduling with periodic and flexible periodic maintenance to minimize maximum tardiness. Comput. Ind. Eng. 2008, 55, 830–840. [Google Scholar] [CrossRef] [Green Version]
  18. Low, C.; Ji, M.; Hsu, C.-J.; Su, C.-T. Minimizing the makespan in a single machine scheduling problems with flexible and periodic maintenance. Appl. Math. Model. 2010, 34, 334–342. [Google Scholar] [CrossRef]
  19. Ji, M.; He, Y.; Cheng, T.C.E. Single-machine scheduling with periodic maintenance to minimize makespan. Comput. Oper. Res. 2007, 34, 1764–1770. [Google Scholar] [CrossRef] [Green Version]
  20. Zhu, Q.; Peng, H.; van Houtum, G.J. A condition-based maintenance policy for multi-component systems with a high maintenance setup cost. Or Spectr. 2015, 37, 1007–1035. [Google Scholar] [CrossRef]
  21. Papakonstantinou, K.G.; Shinozuka, M. Optimum inspection and maintenance policies for corroded structures using partially observable Markov decision processes and stochastic, physically based models. Probabilistic Eng. Mech. 2014, 37, 93–108. [Google Scholar] [CrossRef]
  22. Wang, W.; Zhao, F.; Peng, R. A preventive maintenance model with a two-level inspection policy based on a three-stage failure process. Reliab. Eng. Syst. Saf. 2014, 121, 207–220. [Google Scholar] [CrossRef]
  23. Duan, C.; Makis, V.; Deng, C. An integrated framework for health measures prediction and optimal maintenance policy for mechanical systems using a proportional hazards model. Mech. Syst. Signal Process. 2018, 111, 285–302. [Google Scholar] [CrossRef]
  24. Dieulle, L.; Bérenguer, C.; Grall, A.; Roussignol, M. Sequential condition-based maintenance scheduling for a deteriorating system. Eur. J. Oper. Res. 2003, 150, 451–461. [Google Scholar] [CrossRef]
  25. Duan, C.; Makis, V.; Deng, C. Optimal Bayesian early fault detection for CNC equipment using hidden semi-Markov process. Mech. Syst. Signal Process. 2019, 122, 290–306. [Google Scholar] [CrossRef]
  26. You, M.-Y.; Li, L.; Meng, G.; Ni, J. Two-Zone Proportional Hazard Model for Equipment Remaining Useful Life Prediction. J. Manuf. Sci. Eng. 2010, 132, 041008. [Google Scholar] [CrossRef]
  27. Dempster, A.P.; Laird, N.M.; Rubin, D.B. Maximum-likelihood estimation from incomplete data via the em algorithm (with discussion). J. R. Statal Soc. Ser. B Methodol. 1977, 39, 1–38. [Google Scholar]
Figure 1. Structure of typical multi-component systems.
Energies 13 04346 g001
Figure 2. Component degradation evolution path.
Energies 13 04346 g002
Figure 3. Actual degradation after maintenance.
Energies 13 04346 g003
Figure 4. Measurements of an illustrated component.
Energies 13 04346 g004
Figure 5. LACR obtained with different soft cost rate: (a) E = 1; (b) E = 15; (c) E = 30.
Energies 13 04346 g005
Figure 6. Reliability under different decision variables.
Energies 13 04346 g006
Table 1. Estimated values of the model parameters.
System UnitExponential Distribution Parameter ε
Component 10.0370.62
Component 20.0140.62
Component 30.0230.62
Component 40.0560.62
Component 50.0340.62
Component 60.0450.62
Table 2. Maintenance data.
System Unit C P M C C M Failure Level
Component 11.24.19.7
Component 20.51.79.7
Component 33.711.29.7
Component 41.55.29.7
Component 50.81.99.7
Component 60.31.09.7
Table 3. Maintenance decision variables under minimum LACR.
Component123456
Critical level6.86.47.76.57.86.3
Table 4. Maintenance decision variables under maximum RUL.
Component123456
Critical level6.26.17.26.37.66.1