1. Introduction
With the increasing penetration of renewable energy-based generation systems, energy storage systems (ESSs) and loads such as electric cars are driving the grid to rapid changes. Power system integrity, reliability and quality will become even more critical considerations as more inverter-based generation units and loads are integrated [
1,
2,
3]. In order to face this grid transformation, innovative power electronic grid support solutions are currently being developed. Up to now, grid-connected equipment based on power electronics have been designed to give specific solutions to particular problems. However, it is possible to use the same equipment to provide numerous services simultaneously.
The static synchronous compensator (STATCOM) is one example of equipment capable of combining more than one service. This device is mainly required to provide dynamic reactive power support to the grid, but it can also address harmonic filtering tasks. For instance, in steady state, when the required reactive power is low, the equipment can perform filtering tasks. The converter can start giving reactive power and stop filtering in order to compensate for any grid transient. Power quality service can be switched to low priority and the inverter full capacity redirected for reactive power control, enhancing voltage stability; for instance, with the aim of correcting any unbalance in the grid. Both services can be complementary. In the technical literature, it is possible to find several examples combining both services and some STATCOM and harmonic active filter manufacturers already have commercial solutions [
4,
5,
6,
7,
8,
9,
10].
In addition to STATCOMs, power converters with active power sources enlarge the capability of offering different functionalities. Different active power sources and scenarios can be found in the literature, such as wind turbines or energy storage systems. No matter which is the energy source, some references consider integrating a solution to offer active, reactive and harmonic mitigation in one single embodiment. Thus, several ancillary services such as harmonic and reactive power compensation, or grid unbalance compensation with frequency control, may have to operate together, sharing the same inverter hardware limits [
10,
11,
12,
13,
14].
In recent years this trend is gaining momentum and many authors have worked on controls in order to provide various grid support services at the same time, optimizing the performance of grid- connected inverters [
1,
14]. At the same time as these services are provided, there arises a need to know the limits of the inverters, especially when providing very diverse services. This paper proposes an analytical method in order to determine the limits for a converter giving different services, where the converter can work with active power, reactive power and harmonic active filtering capability. This method is extended to balanced and unbalanced grid scenarios. The presented steps can be used in early design stages in order to know if one converter solution is suitable for a certain scenario. It can be also used in order to know the limits when adding extra services to an existing power converter. Even if this paper analyzes the case of a commercial low voltage (LV) STATCOM converter with an added energy storage system (ESS) and harmonic active filter (HAF), the analysis can be easily extrapolated to any converter topology and active power source.
To the authors’ knowledge, there is no literature about inverter limits combining altogether active power, reactive power and harmonic current/voltage. This, together with the limits analysis of balanced and unbalanced scenarios is something not found in the literature. The present paper focuses on the analysis of the limits for energy management services and reactive power compensation alongside with harmonic active filter operation in real utility scale equipment.
As regards the outline of the paper, firstly the commercial LV STATCOM with energy storage system and harmonic active filter option is presented in
Section 2. Based on that, step-by-step operation limits for several grid support services are estimated, such as: voltage and frequency regulation, unbalanced voltage compensation and harmonic active filtering. Finally, operation limits for the combination of several grid support services are estimated for some example cases.
2. System Description
The analyzed system consists of a voltage source converter (VSC) with an energy storage system connected via a DC/DC converter to its DC bus and an inductance as output power filter. The grid connection is performed through a step-up transformer low voltage/medium voltage (LV/MV), shown in
Figure 1.
The most typical filter for grid-connected inverter applications is an LCL filter [
15,
16]. Nevertheless, as the present analysis is focused on harmonic active filter applications, for the sake of simplicity only an inductance is considered as an output power filter.
In applications oriented to grids (either industrial or distribution) with large load consumption, the grid connection point is usually at medium voltage in order to improve efficiency of the system. In such cases, it is common practice to use a step-up transformer to connect the inverter to the grid. The expressions for the system impedances are summarized in Equations (1) and (2):
where
L is the inductance between the point of inter-connection (POI) and the inverter,
X is the reactance between the POI and the inverter at nominal frequency,
fn is the nominal frequency,
Linv is the inductance of the grid connection filter and
LTransformer is the series inductance of the transformer.
In addition to the description of the layout, a commercial LV STATCOM with an ESS and an HAF option is also presented in this section. The commercial inverter is usually paired with the same coupling transformer in order to connect to the MV grid. The main characteristics of the system (converter and transformer) are presented in
Table 1.
Even if some harmonics are more typical than others in the grid—e.g., the 5th with the 7th order harmonics together or the 11th with the 13th order harmonics together—almost infinite combinations are possible. The same goes for the cases, one main harmonic (resonance) or more than one due to nonlinear loads can be found. To simplify the cases, the work is focused only on the active filtering of individual harmonics, i.e., direct harmonic control (DHC) only is considered.
The maximum modulation index of the inverter depends on several factors, such as the switching frequency, the dead time, the minimum conduction time, etc. Even for the same modulation technique, the maximum value can vary depending on the configuration [
17]. In order to simplify the scenario, the maximum modulation index is considered only as a parameter containing all those aspects.
The converter nominal output voltage can vary depending on the application. For some applications, for instance harmonic active filters, a reduction on the output voltage and a transformer with higher transformation ratio can be interesting. Compensation of high order harmonics usually requires a significant voltage capability. Furthermore, if reactive power compensation is also needed, besides harmonic compensation, inverter nominal output voltage reduction improves the current injection capability. By doing so, harmonic active filter (HAF) capability is prioritized.
In the same way, depending on the batteries’ state of charge (SoC), voltage at the battery terminals can also vary. Thus, a DC/DC inverter, in order keep the DC bus voltage within acceptable limits, is highly recommended (see
Figure 1).
3. Voltage and Frequency Regulation Limits
The inverter has a maximum rated current, which is thermally limited. This maximum current imposes the limit of active (
P) and reactive (
Q) power that can be injected into the grid, as described in Equations (3) and (4):
where
VPOI is the one-phase grid voltage,
IInv is the one-phase inverter current, and
P-Q represents the active and reactive power.
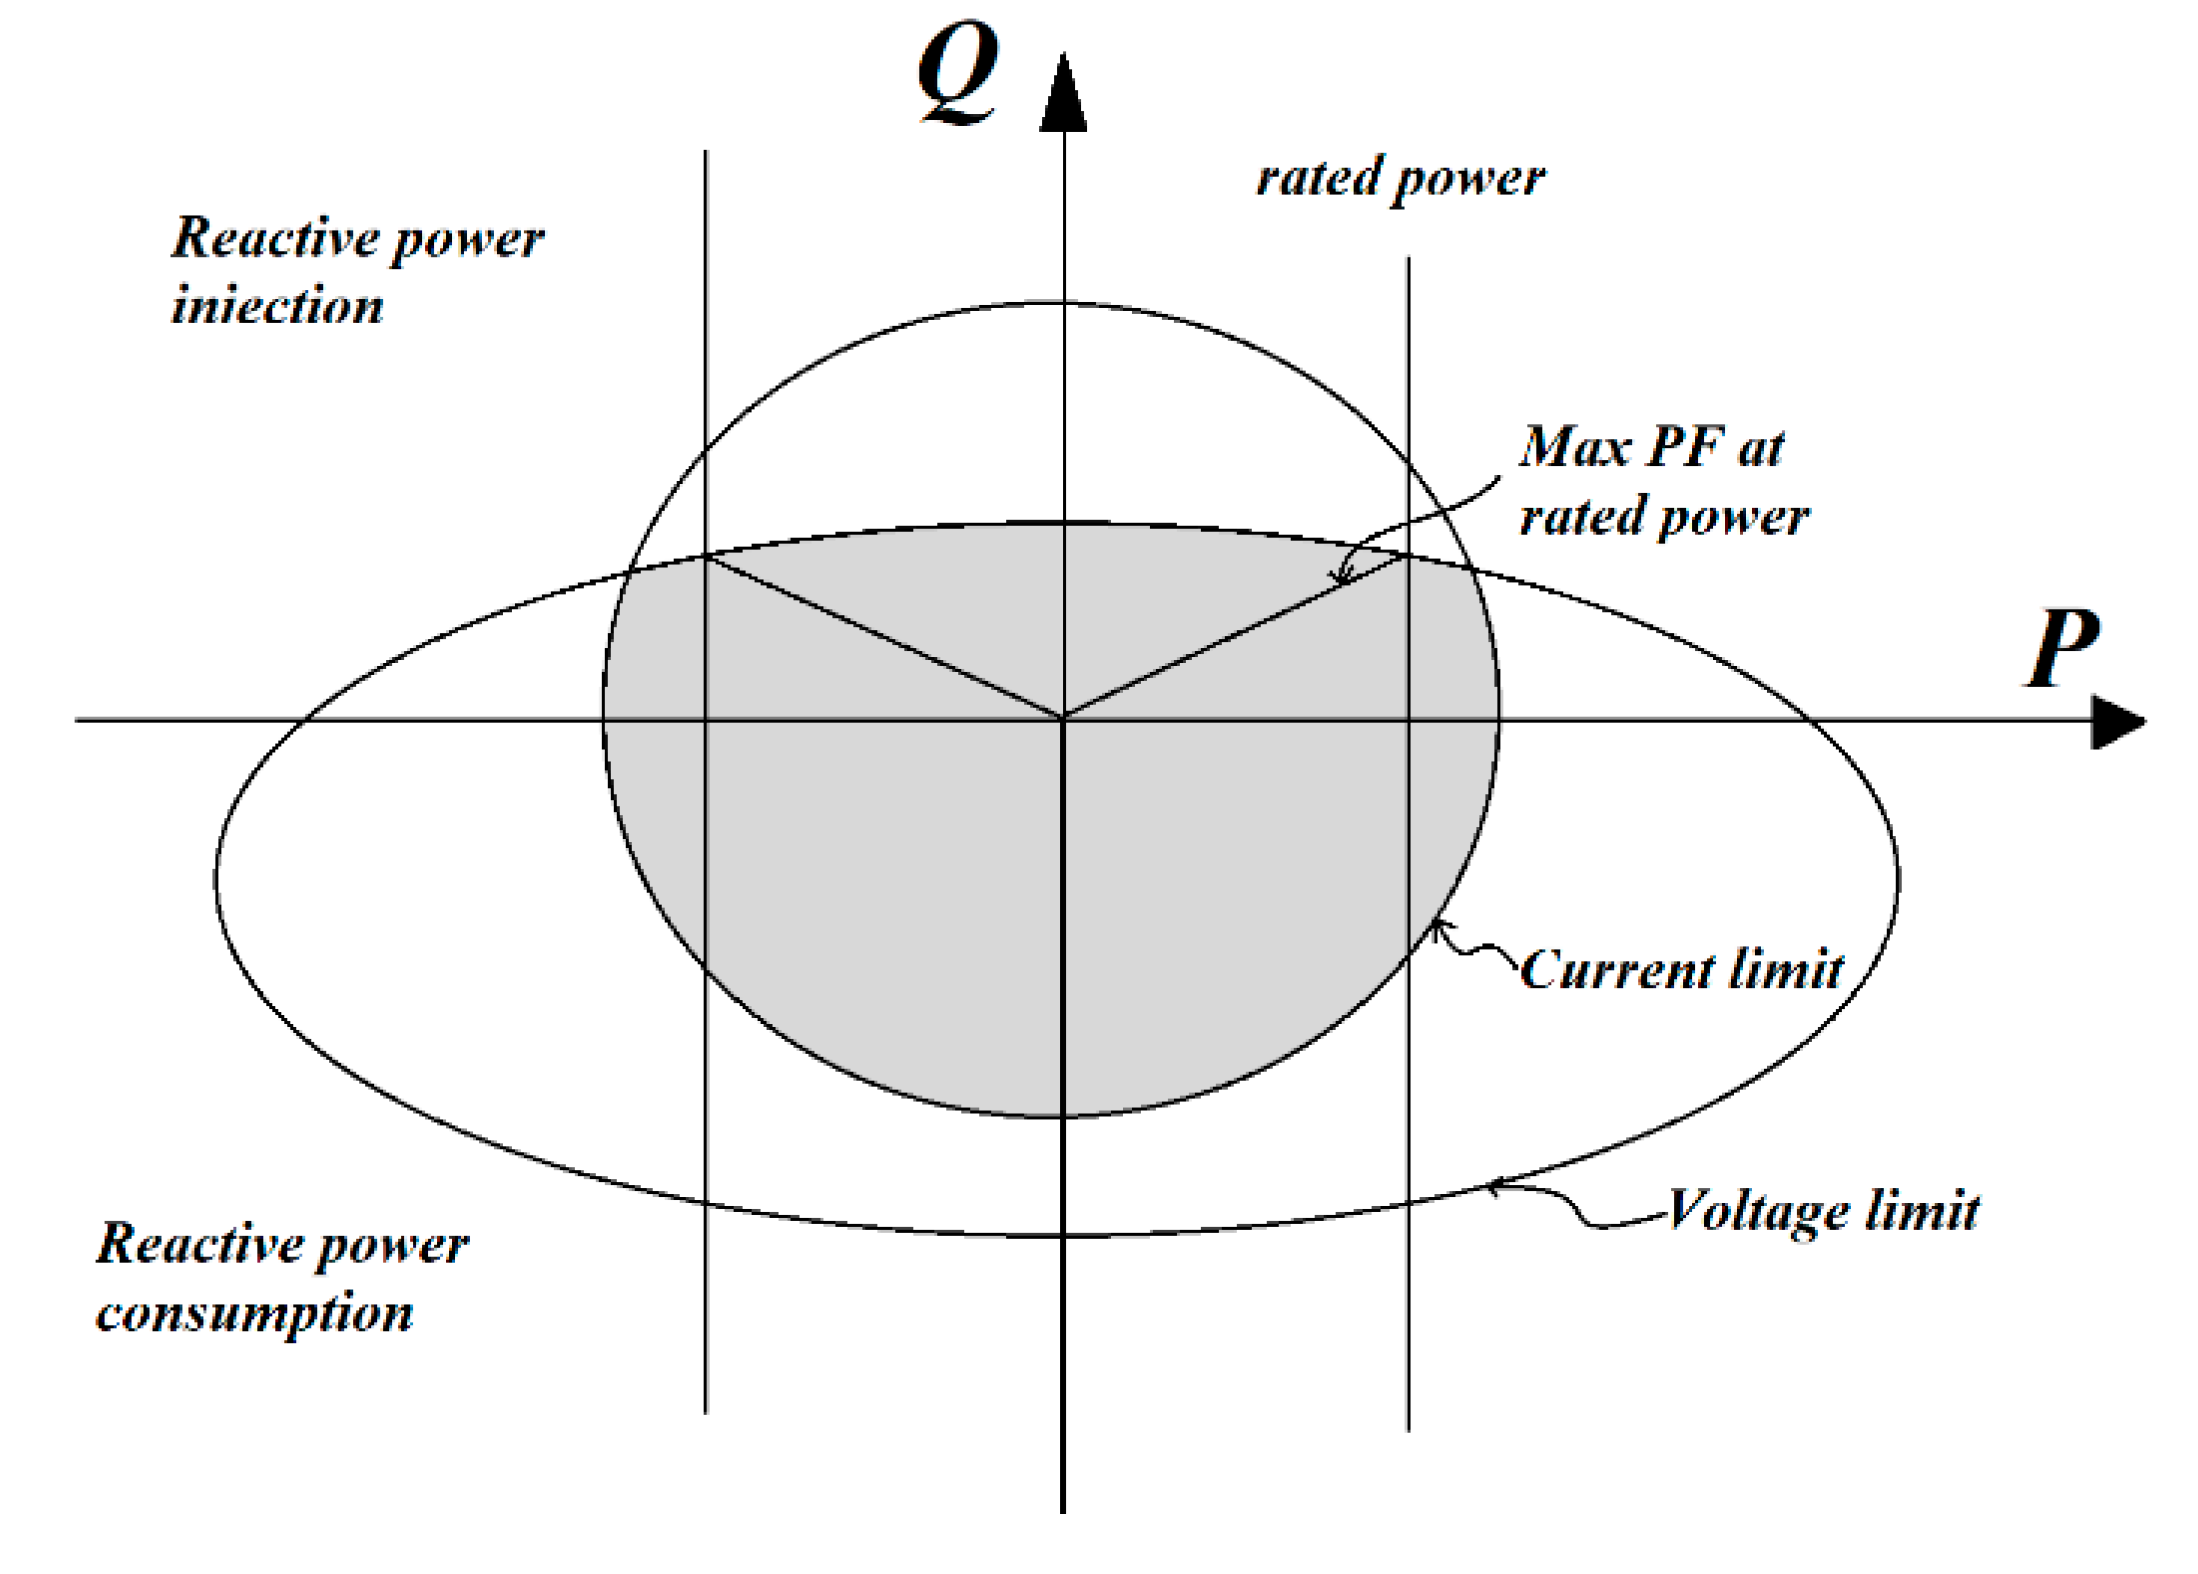
Considering the inverter maximum current, thermally limited (and constant), the apparent power depends on the grid voltage. Depending on the phase shift between inverter current and grid voltage, the amount of active and reactive power provided by the inverter will be different. The current limit describes a circle with constant apparent power [
18] (
Figure 2).
However, the maximum inverter voltage imposes an additional restriction. This additional capacity limit of
P and
Q is described by Equation (5):
where
Vinv is the one-phase inverter voltage and
X represents the system reactance. As aforementioned,
VInv depends on the modulation technique and settings, alongside with the inverter DC bus voltage.
From Equation (5) it is possible to isolate the inverter voltage as follows:
The inverter voltage expression in Equation (6) represents an ellipse [
9].
This means that the actual inverter limit is the area between both limits, i.e., the current limit (circle) and the voltage limit (ellipse), as illustrated in
Figure 2. Once one of the limits is achieved, whether current or voltage, the converter is not capable of working further.
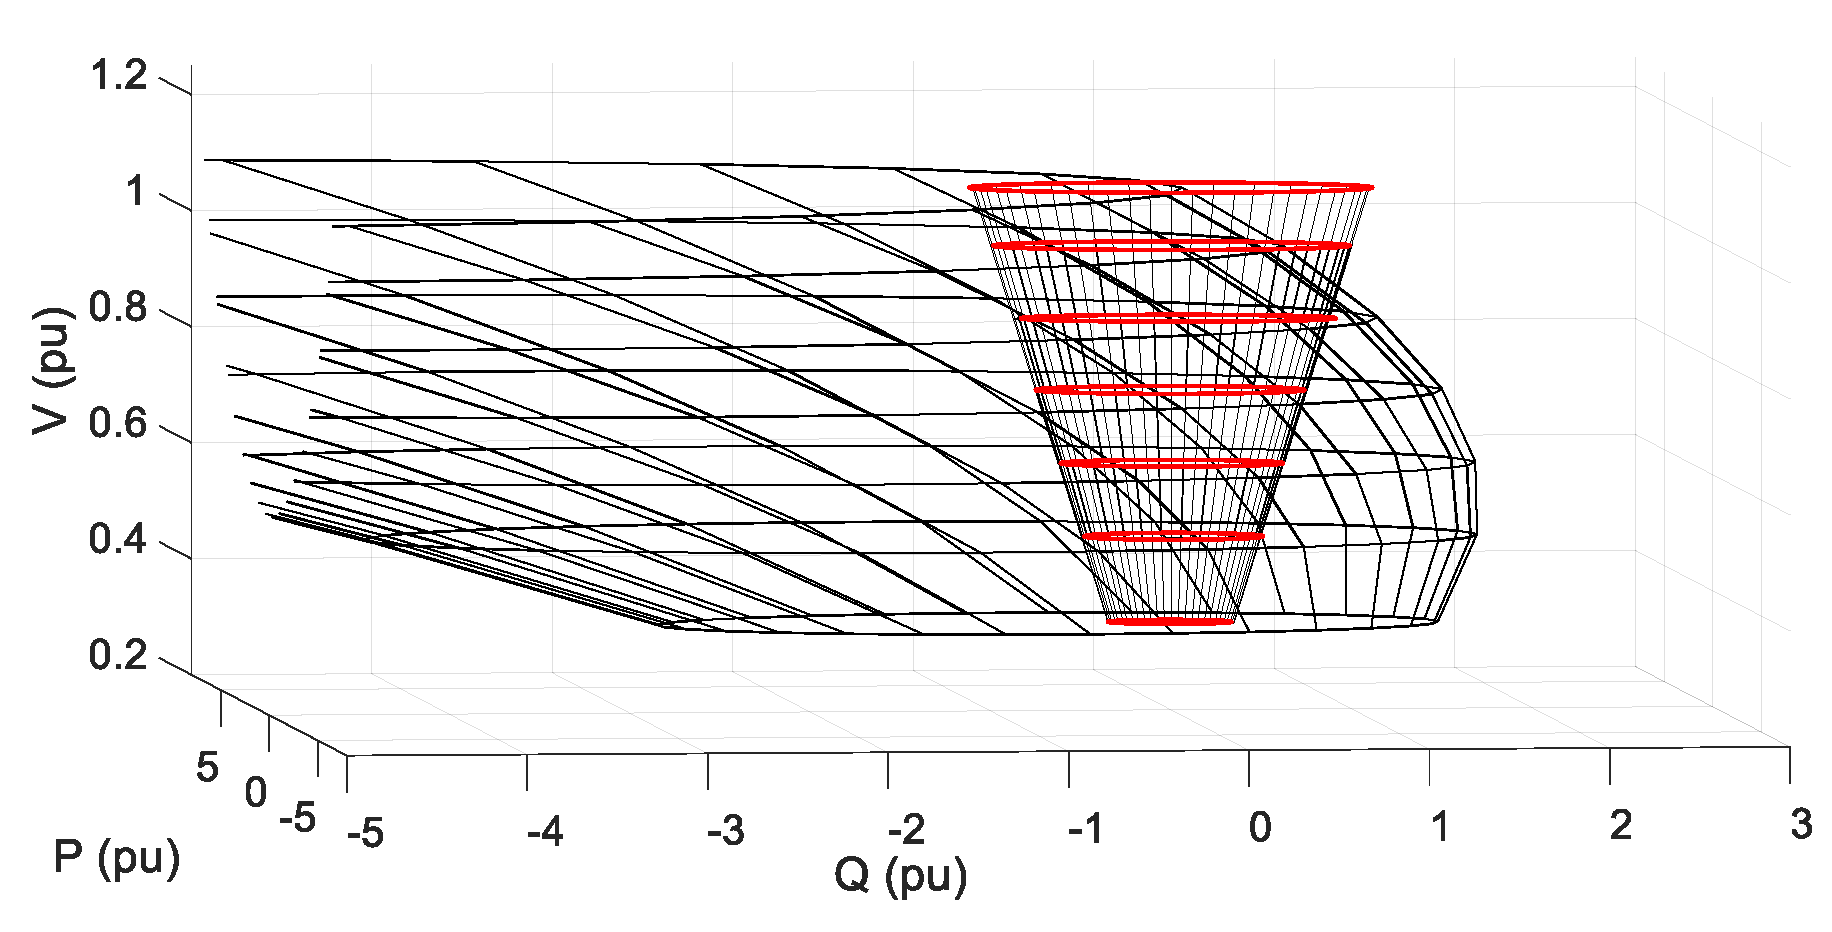
Voltage and frequency regulation is performed by injecting active and reactive power into the grid. If another dimension is added to the diagram (grid voltage), it is possible to see active and reactive power limits in the whole operational range of the inverter (
Figure 3).
The inverter hardware limits are delimited within the space shared by both cones. The higher the grid voltage, the bigger is the active and reactive power injection capability. However, the eccentricity of the voltage limit also increases proportionally, meaning that at higher grid voltage values the inverter will have more capacity to absorb reactive power (capacitive mode) but less capacity to supply it (inductive mode).
4. Unbalanced Grid Voltage Compensation Limits
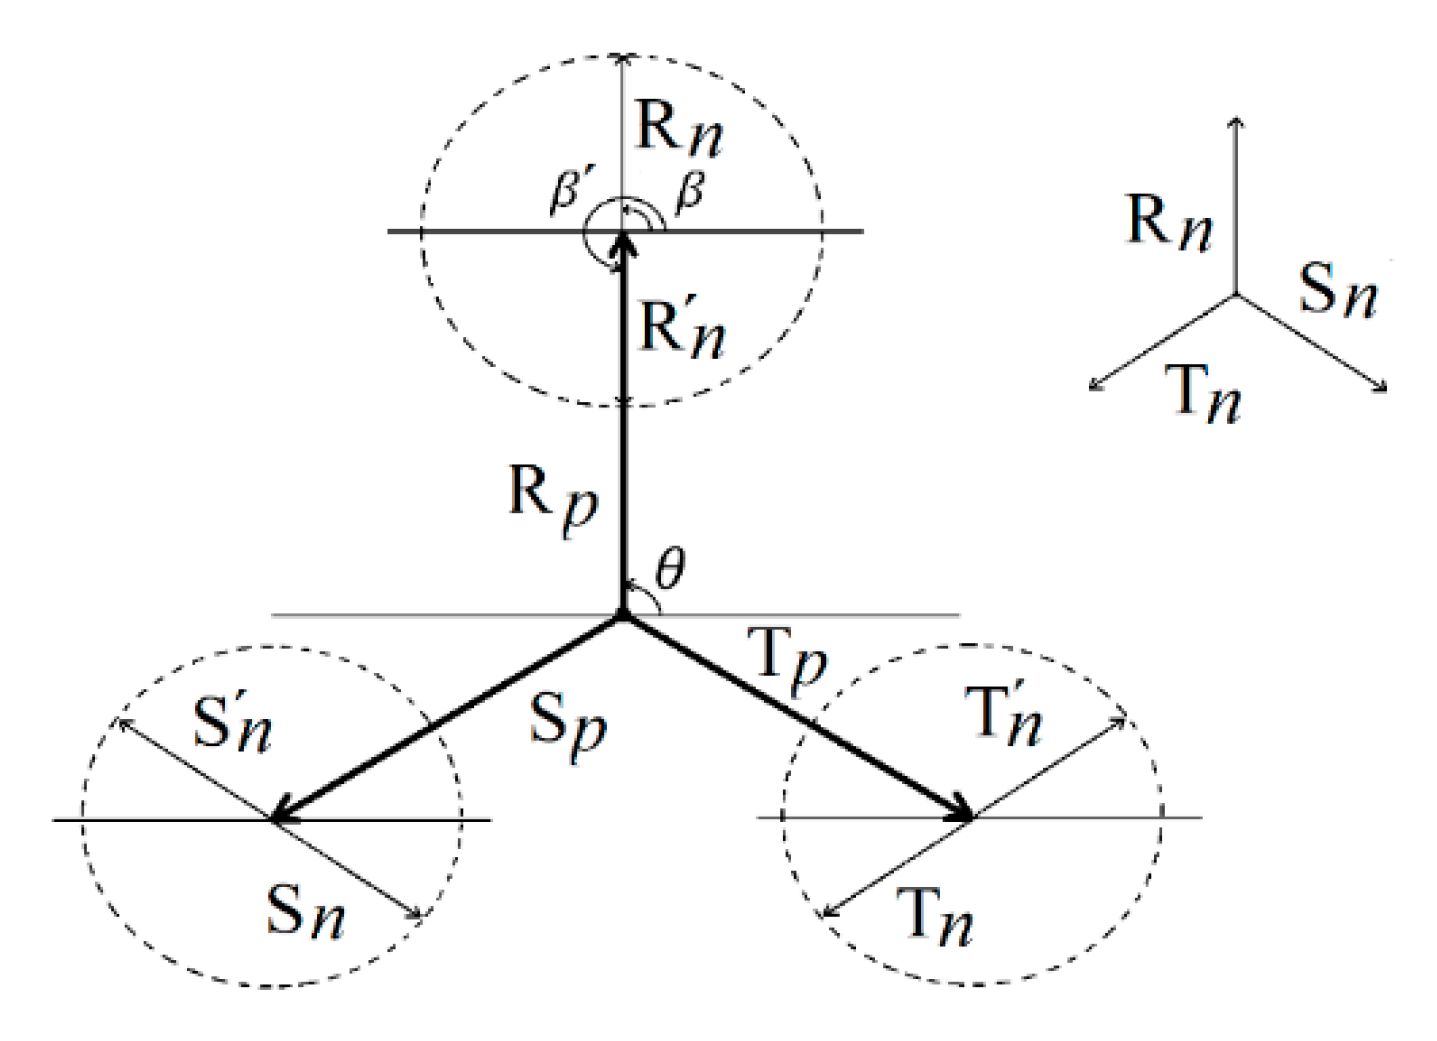
The injection of a negative sequence current has an impact on both the positive current capability and the voltage limit of the inverter. None of the phases can surpass the voltage limit and none of the semiconductors can surpass the thermal current limit. Thus, the maximum voltage is limited by the maximum at any phase. The same applies for the current limit. The limit has to be evaluated considering each phase, and the phase shift between sequences (
Figure 4).
The equations that describe the system shown in
Figure 4 are summarized in Equations (7)–(9). Note that the zero sequence is neglected, considering a Y-Δ transformer connection to the grid.
where
R(
t),
S(
t) and
T(
t) are the instantaneous values of the composed signals,
Ap is the amplitude and
θ is the phase of the positive sequence component (where each component would be
Rp,
Sp,
Tp),
An is the amplitude and
β is the phase of the negative sequence component
t (where each component would be
Rn,
Sn,
Tn).
Considering the worst case, the maximum signal limit can be estimated by the linear sum of the amplitudes of both components (for
V or
I), as described in Equation (10). Nevertheless, depending on the phase shift between the components, the limit can be higher, as described in Equation (11).
In order to show the impact of the phase shift, a sweep for all the possible phase shifts for several negative sequence current amplitudes has been carried out, and the maximum current out of the three phases is depicted in
Figure 5.
Looking at
Figure 5 it is possible to see three maximums and three minimums over the whole range of possible phase shifts. That can be explained due to the fact that the system is composed of three phases. In order to determine the negative sequence compensation capability for the worst case, the linear sum of the two components shown in Equation (10) should be considered. Nevertheless, depending on the phase shift, this limit can vary significantly, so the best way to optimize the hardware of the inverter is by implementing a negative sequence limit, taking into account the phase shift.
5. Harmonic Active Filter Compensation Limits
The definition of the power inverter voltage and current rating is one of the most complex aspects for many applications, and HAF applications are not an exception. The required ratings to compensate for the harmonics of the power system have to be addressed from the early stages of design and these requirements vary significantly from a particular case to another. To highlight a positive aspect, in cases when the harmonic active filter is under-rated, even if it is confirmed to meet the requirements and to completely compensate for the harmonics, the equipment can reduce the harmonic content significantly.
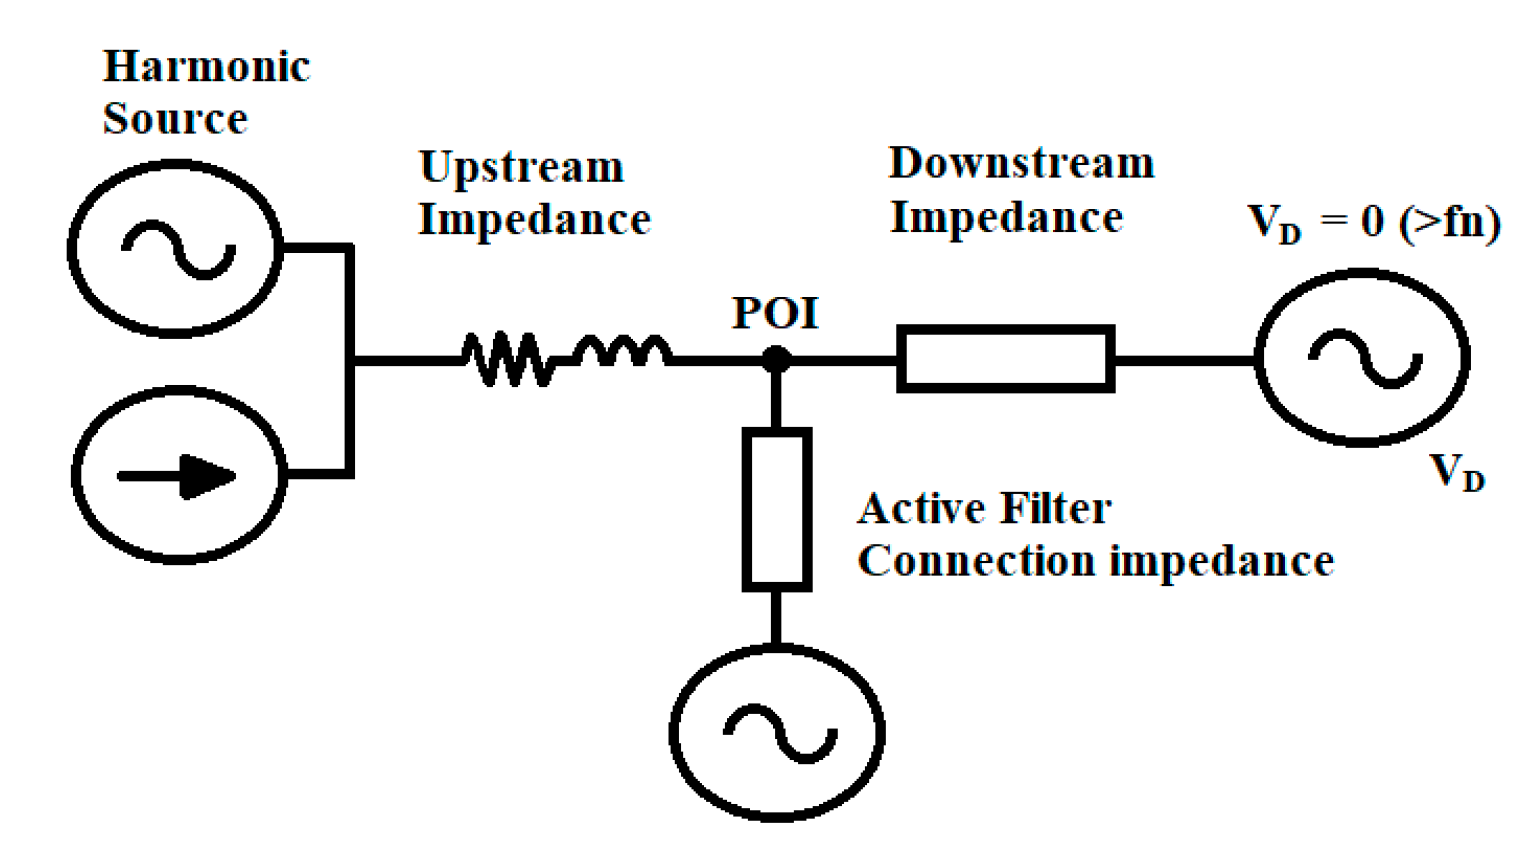
In this section, the maximum voltage and current requirements for harmonic active filtering applications are addressed. In order to do that, the cases are divided into two groups: when the harmonic source can be considered as a current source and when the harmonic source is approached as a voltage source. The analyses carried out in this section are based on the simplified generic diagram shown in
Figure 6. All the variables used are phasors, each having amplitude and phase.
5.1. Harmonic Active Filter Capability for Harmonic Currents
For the case when the harmonic source can be considered as a current source, the generic diagram shown in
Figure 6 can be expressed as shown in
Figure 7.
When the source of the harmonic is considered as a current source (
Figure 7) and neglecting downstream voltage perturbation (i.e., the grid voltage,
VDh = 0), the grid harmonic current and harmonic filter current should be equal to procure a complete harmonic compensation:
The equation that describes the relation between the required harmonic current and the required inverter voltage for the
h-th order harmonic is shown in Equation (13) [
9]:
where
VAFh is the voltage phasor of the active filter voltage,
IAFh is the current phasor for the active filter current and
ZAFh is the impedance value of the harmonic active filter.
5.2. Harmonic Active Filter Capability for Harmonic Voltages
For cases when the harmonic source can be approached as a voltage source, the generic diagram shown in
Figure 6 can be simplified to the system shown in
Figure 8.
Taking into account the system shown in
Figure 8, the following expressions can be used to describe the system:
Merging Equation (15) with the Equation (16), it is possible to re-write the expression as Equation (17).
Then, by again merging Equation (17) with Equation (14), it is possible to obtain the general Equation (18):
In order to procure a complete harmonic compensation, the downstream harmonic current should be equal to zero, thus:
Finally, operating with Equations (18) and (19), the equation that describes the relation between the required harmonic current and the required inverter voltage for the
h-th order harmonic can be obtained as Equation (20) [
9]:
where
VUh and
VAFh are the
h-th order harmonic voltage phasors for the upstream voltage and the active power filter voltage, respectively,
IAFh is the
h-th order harmonic current phasor of the active power filter current and
ZAFh and
ZUh are impedance values at harmonic order
n for the active power filter impedance and the upstream impedance, respectively.
From Equation (20), it is possible to conclude that for cases when the harmonic source can be considered as a voltage source the capability of an inverter for harmonic current filtering is heavily related to the system impedances. In particular, it refers to the relation between the inverter’s grid connection filter impedance and the upstream impedance. For these cases, an impedance ratio can be used in order to determine the inverter limits while operating as a harmonic active filter. In order to define in a simple and standard manner the capacity of the harmonic active filter, this paper proposes to relate the filtering capability of inverters depending on the ZUhn/ZAFhn ratio. Particularizing this way, it is easier to understand the gap of filtering capability between series (voltage harmonic source) and parallel (current harmonic source) resonances. For some simple cases:
With a ratio
ZUh/
ZAFh = 1 and
VDh = 0
With a ratio
ZUh/
ZAFh = 2 and
VDh = 0
With a ratio
ZUh/
ZAFh = 0.5 and
VDh = 0
6. System Related Limits
6.1. Transformer De-Rating
The consequence of imposing currents with harmonic components through a transformer is to cause an increment of the stray and eddy losses. As the capacity of a transformer to evacuate losses with heat is limited, to prevent damages to the transformer a reduction of the transformer rated current is a common practice [
19,
20]. The reduction of the transformer’s rated current due to harmonics and non-sinusoidal currents has been widely analyzed in the technical literature. It is also possible to find several standards regarding this matter, such as the IEEE C57-110 [
21]. This standard describes a procedure to estimate a transformer’s capacity de-rating depending on the non-sinusoidal currents.
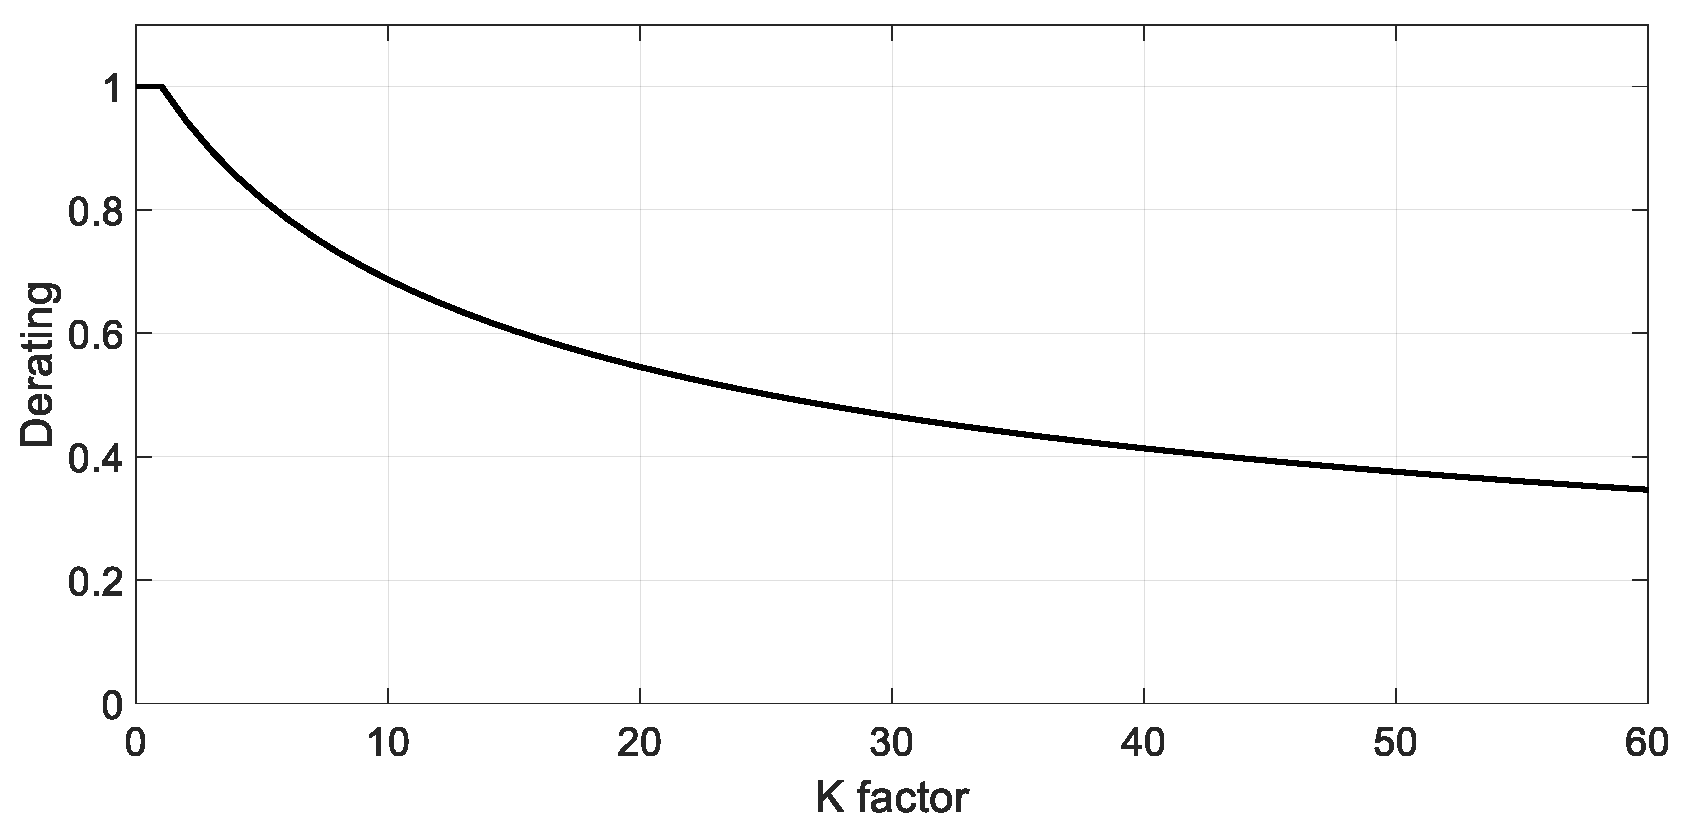
A transformer can be designed to hold a specific level of harmonic currents, but if for any reason the harmonic level intended to impose through the transformer is bigger than that, a de-rating should be applied. The amount of the de-rated capacity is estimated with a weighting
K-factor (Equation (24)), and depending on this factor, the rated current of the transformer is reduced (Equation (25)).
where
K is the weighting factor defined in standard IEEE C57-110,
Ih is the
h order one-phase harmonic current in root mean square (RMS) and
Irated is the transformer’s rated current in RMS.
The transformer de-rated capacity depending on this K-factor is shown in
Figure 9.
6.2. Harmonic Voltage Peak and Phase Shift
The peak value for a signal composed of several harmonic components depends on two variables: the amplitude of the components and the phase shift between those components. Based on this evidence, in this section the harmonic current injection capability depending on the phase shift (the phase difference between the fundamental and the harmonic components) is assessed [
9].
For that purpose, the general equation presented in Equation (26) is used. This generic signal is composed of a fundamental frequency (a sine wave of 50 Hz), a third order harmonic (over modulation) and an
h-th order harmonic with an arbitrary phase.
where
V(
t) is the instantaneous amplitude of the generic signal,
θ is the phase,
A is the amplitude of the fundamental component,
h is the harmonic order,
B is the amplitude and
β is the phase of the added harmonic component.
In
Figure 10 the maximum required modulation index for different phase shifts are estimated and compared for the 5th, 7th, 11th, 13th and 17th harmonics. The same conditions have been considered for all the harmonic orders.
In short, even if the phase shift (β) has an impact on the voltage peak, this impact is very limited and for 5th order harmonics or higher the linear sum of the harmonic and the fundamental voltage amplitudes, without considering the phase shift, is a valid approach.
7. Conjoint Operation Limits for Multiple Grid Support Services
7.1. Active Filter Capability Boundaries without ESS (STATCOM Mode)
In this case the inverter operating as a STATCOM and at the same time as a harmonic active filter is considered. In this case it is expected that the reactive power capability of the inverter will be reduced depending on the imposed harmonic current level. In the present section, this capability reduction is studied.
Based on the system presented in
Section 2, the reactive power capability limits combined with several harmonic order currents are illustrated in
Figure 11. Regarding the nature of the harmonic perturbation, it is considered as a current source as explained in
Section 5.1.
As depicted in
Figure 11, it is possible to identify that the limit of harmonic current injection is composed of 2 curves (
Figure 11a) or 3 curves (
Figure 11b). The first curve draws a circle and represents the thermal limit of the inverter, which is related to the maximum current capability. In this case, the RMS value estimation for currents with several harmonic components is performed with the well-known Equation (27). The harmonic current injection capacity is reduced proportionally to the amplitude of the fundamental (h1) current, as depicted in Equation (28).
where
Irms is the rated current,
Irms_1 is the current value at the fundamental frequency in RMS and
Irms n is the current value of the
n-th harmonic current in RMS.
The second curve is a straight line and represents the maximum inverter voltage limit (maximum modulation index + DC bus voltage). The straight lines of this second limit have different derivatives depending on the harmonic order; the higher the harmonic order, the smaller the derivative. The impedance presented by the inductances is proportional to the frequency, so the voltage required to impose the same amount of current is higher and proportional to the harmonic order. To estimate these limits, the phase difference between the fundamental and the injected harmonic is not considered. The sum of both amplitudes is considered as a good approach (refer to
Section 6.2).
The third curve is related to the applied de-rating of the transformer. Considering a correctly sized transformer, this limit does not apply. On the contrary, if a transformer designed for K < 2 harmonic content is considered it will affect operation points where the STATCOM injects high-amplitude harmonic currents with high nominal frequency current. In other words, the higher the current dedicated to HAF, the higher the impact will be on the transformer de-rating factor.
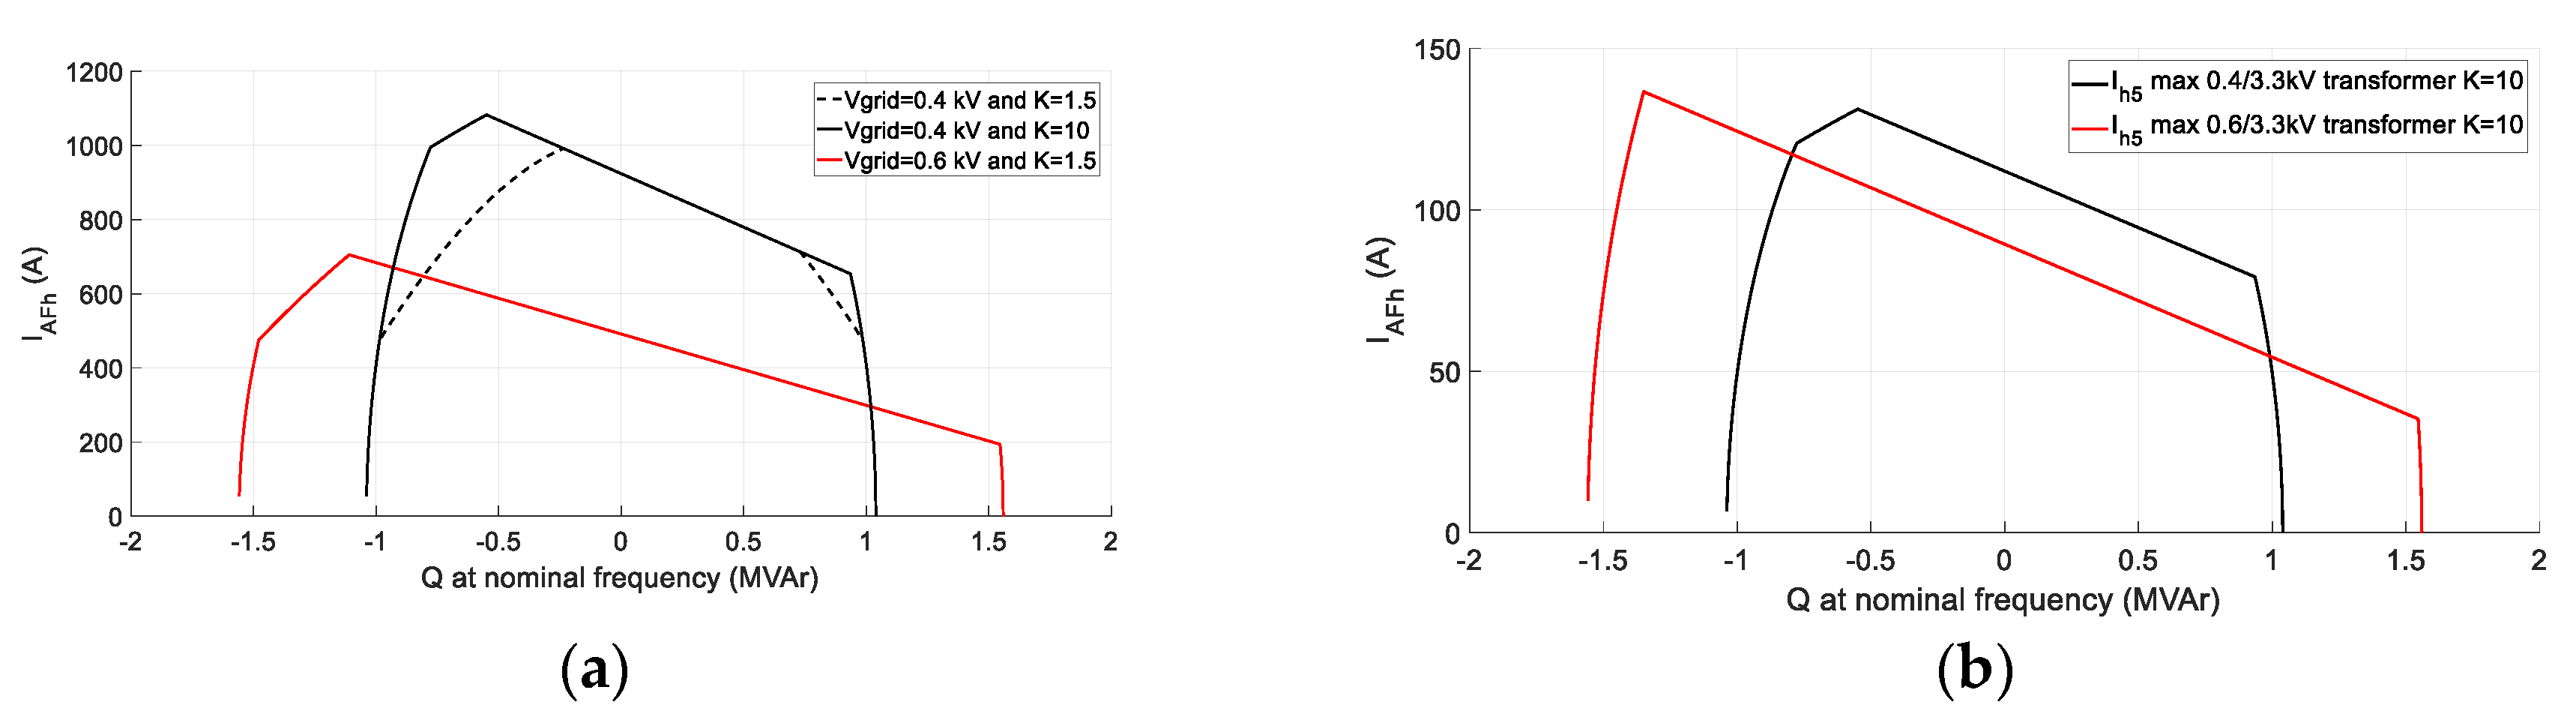
7.2. Grid Connection Voltage
Grid connection voltage selection (transformer primary voltage level) is an important issue for the limits of the inverter. Depending on the required operation, more power capability (at nominal frequency) or more harmonic compensation capability can be selected. The equipment presented in this paper can be connected to a 400 V or 600 V nominal grid voltage; by doing so, its rated power varies from 1 MVA to 1.5 MVA. This setting will determine the dominant nature of the equipment. The harmonic current capability difference seen from the point of view of an equivalent grid for the 5th harmonic is increased by about 24% and the reactive power capability reduced by 33%, as shown in
Figure 12b.
7.3. Active Filter Capability Boundaries with ESS
In this case, besides the reactive power capability, active power injection capability is also considered. Based on the same case, the active and reactive power injection limits depending on the injected 5th harmonic current are estimated. The limits are estimated for a 400 V grid nominal voltage and without considering the de-rating related to the transformer. These power boundaries are illustrated in
Figure 13. It can be seen how when the harmonic active filter current increases, voltage limitation is more restrictive than the current limitation.
This case may be represented in a better way when drawn in 3-D, as 3 different magnitudes are shown (
P-Q-IH5). Nevertheless, it is possible to see the
PQ capability reduction as a higher harmonic current is injected. If the limits of harmonic current injection are compared with the results without ESS (shown previously in
Figure 11), it can be seen how both limits (at
P = 0) are the same.
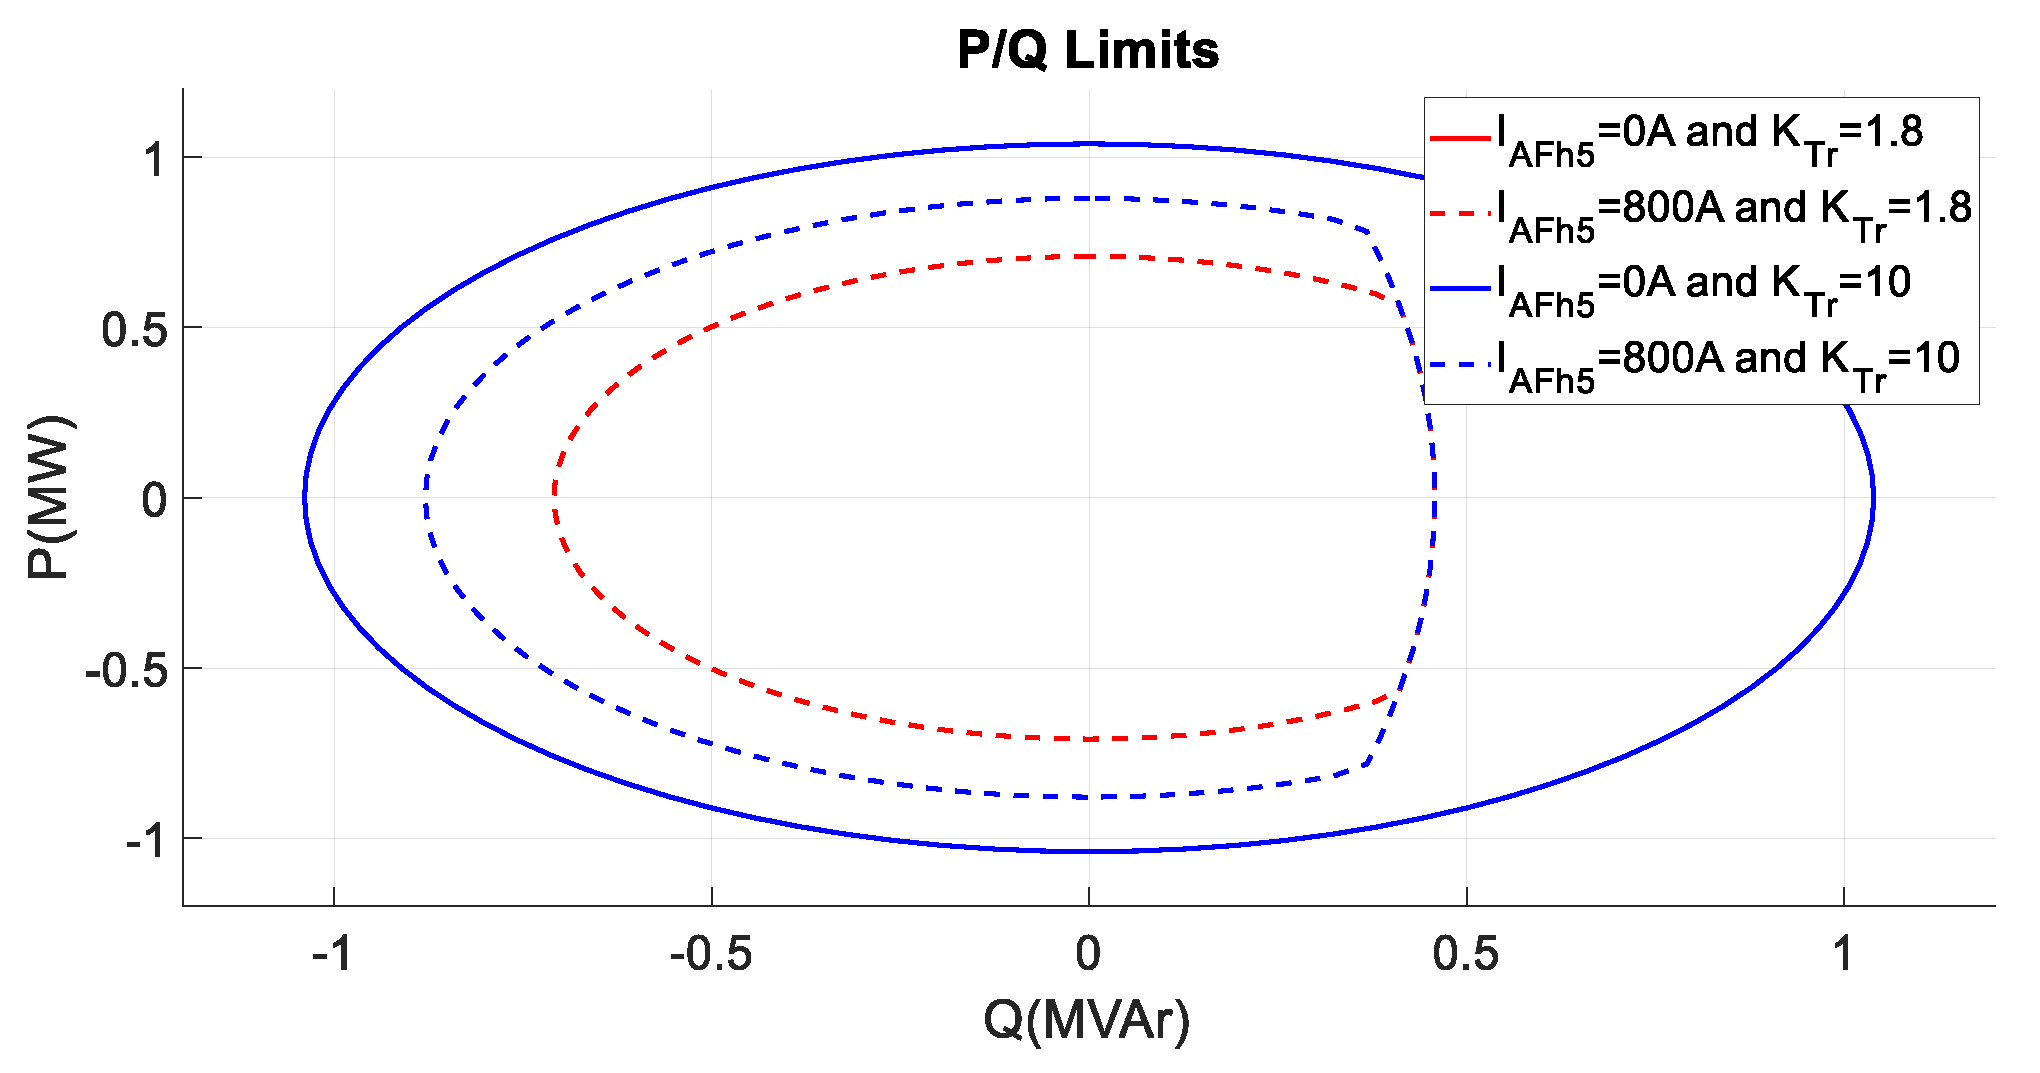
In a second step, the de-rating effect is evaluated, and the results are illustrated in
Figure 14. The maximum active and reactive power injection capability for two values of 5th harmonic currents (DHC) at nominal voltage are estimated. In order to show the de-rating effect, two different
K-factors for the transformer are considered and the results are overlapped.
From the results it can be concluded that, depending on the system requirements, a transformer with a K-factor or another can be more interesting. When the PQ injection limit is restricted by the voltage limit, the transformer de-rating has very little effect. Therefore, depending on which one of the limits (voltage or current) is expected to be the most restrictive, one solution (increased transformer’s K-factor) or the other, applying a de-rating will be the most suitable.
8. Conclusions
Multiple grid support services can coexist or can be complementary within the same inverter connected to the grid. This paper presents a method to estimate a conjoint operation limit of inverters providing several services at the same time, such as active and reactive power exchange, negative sequence and harmonic compensation or transformer de-rating values. The estimation of such operational limitations will be of high importance at an early stage in the design and sizing of grid-connected inverters, and could be also employed to adapt the operation ranges within their controllers. The results have demonstrated that, depending on the simultaneous services provided by the inverter, the power capabilities will be curtailed differently. For instance, in a STATCOM application the power is limited not only by the current capabilities of the inverter, but also by the voltage limit. Moreover, when this STATCOM is also working as an active filter, the power capabilities are reduced according to the order of the harmonic that is being injected. Another interesting finding of the study is that depending on the main purpose of the inverter (e.g., to work as a STATCOM or a HAF), it might be better to choose or design a transformer with a specific de-rating K factor.
All these results also show that new service prioritization techniques have to be developed in order to meet the requirements of the grid operator at each instant while keeping the inverter within adequate operational limits.
Author Contributions
M.Z.: conceptualization, formal analysis, investigation, software, writing—original draft preparation. A.S.-R.: conceptualization, formal analysis, investigation, writing—review and editing. E.O.: conceptualization, formal analysis, investigation, writing—review and editing. E.U.: conceptualization, formal analysis, investigation, writing—review and editing. A.B.: conceptualization, formal analysis, investigation, writing—review and editing. J.A.: conceptualization, formal analysis, investigation. All authors have read and agreed to the published version of the manuscript.
Funding
This research was funded by the FEDER/Spanish Ministry of Science as within the Retos-Colaboracion 2017 program under the GASAC project (RTC-2017-26091-3).
Conflicts of Interest
The authors declare no conflict of interest.
References
- Wang, G.; Konstantinou, G.; Townsend, C.D.; Pou, J.; Vazquez, S.; Demetriades, G.D.; Agelidis, V.G. A review of power electronics for grid connection of utility-scale battery energy storage systems. IEEE Trans. Sustain. Energy 2016, 7, 1778–1790. [Google Scholar] [CrossRef]
- Wang, X.; Blaabjerg, F. Harmonic stability in power electronic-based power systems: Concept, modeling, and analysis. IEEE Trans. Smart Grid 2019, 10, 2858–2870. [Google Scholar] [CrossRef]
- Ordono, A.; Unamuno, E.; Barrena, J.A.; Paniagua, J. Interlinking converters and their contribution to primary regulation: A review. Int. J. Electron. Power Energy Syst. 2019, 111, 44–57. [Google Scholar] [CrossRef]
- Singh, B.; Chandra, A.; Al-Haddad, K. A three-phase active power filter for harmonic and reactive power compensation. In Proceedings of the 1996 Canadian Conference on Electrical and Computer Engineering, Calgary, AB, Canada, 26–29 May 1996; Volume 2, pp. 838–841. [Google Scholar]
- Patel, A.A.; Patel, A.A. Application of DSTATCOM for harmonics elimination and power quality improvement. In Proceedings of the 2017 International Conference on Energy, Communication, Data Analytics and Soft Computing (ICECDS), Chennai, India, 1–2 August 2017; pp. 3007–3011. [Google Scholar]
- Lehmann, M.; Pieschel, M.; Juanparez, M.; Pabel, K.; Kocewiak, L.; Sahukari, S. Active filtering with large-scale statcom for the integration of offshore wind power. In Proceedings of the 17th International Wind Integration Workshop, Stockholm, Sweden, 17–19 October 2018. [Google Scholar]
- Abad, G.; Laka, A.; Saavedra, G.; Barrena, J.A. Analytical modeling approach to study harmonic mitigation in AC grids with active impedance at selective frequencies. Energies 2018, 11, 1337. [Google Scholar] [CrossRef]
- Lee, Y.; Song, H. A reactive power compensation strategy for voltage stability challenges in the Korean power system with dynamic loads. Sustainability 2019, 11, 326. [Google Scholar] [CrossRef]
- Zubiaga, M.; Sanchez-Ruiz, A.; Olea, E.; Balenciaga, J.X.; Madariaga, D.; Arza, J. Reactive power boundaries for a MV STATCOM with harmonic active filter capability. In Proceedings of the IECON 2019—45th Annual Conference of the IEEE Industrial Electronics Society, Lisbon, Portugal, 14–17 October 2019; Volume 1, pp. 6172–6177. [Google Scholar]
- Akagi, H. The state-of-the-art of active filters for power conditioning. In Proceedings of the 2005 European Conference on Power Electronics and Applications, Dresden, Germany, 11–14 September 2005; p. 15. [Google Scholar]
- Rodriguez, P.; Timbus, A.V.; Teodorescu, R.; Liserre, M.; Blaabjerg, F. Flexible active power control of distributed power generation systems during grid faults. IEEE Trans. Ind. Electron. 2007, 54, 2583–2592. [Google Scholar] [CrossRef]
- Naidu, N.K.S.; Singh, B. Doubly fed induction generator for wind energy conversion systems with integrated active filter capabilities. IEEE Trans. Ind. Inform. 2015, 11, 923–933. [Google Scholar] [CrossRef]
- Stöckl, J.; Jonke, P.; Bletterie, B.; Kadam, S. Power quality improvement strategies for battery storage systems with low-voltage grid support. In Proceedings of the 2017 19th European Conference on Power Electronics and Applications (EPE’17 ECCE Europe), Warsaw, Poland, 11–14 September 2017; p. P-1. [Google Scholar]
- Patel, P.; Ahir, J.; Jariwala, A. Operation methods for grid-connected PV system for voltage control in distribution system—A Review. Asian J. Converg. Technol. 2019, V. [Google Scholar] [CrossRef]
- Zabaleta, M.; Burguete, E.; Madariaga, D.; Zubimendi, I.; Zubiaga, M.; Larrazabal, I. LCL Grid filter design of a multimegawatt medium-voltage converter for offshore wind turbine using SHEPWM modulation. IEEE Trans. Power Electron. 2016, 31, 1993–2001. [Google Scholar] [CrossRef]
- Mazuela, M.; Sanchez-Ruiz, A.; Echeverría, I.; Telleria, S.; Atutxa, I. Modulation and LCR filter optimum design procedure for medium voltage adjustable speed drives. In Proceedings of the 2016 18th European Conference on Power Electronics and Applications (EPE’16 ECCE Europe), Karlsruhe, Germany, 5–9 September 2016; pp. 1–10. [Google Scholar]
- Sanchez-Ruiz, A.; Mazuela, M.; Alvarez, S.; Abad, G.; Baraia, I. Medium voltage–High power converter topologies comparison procedure, for a 6.6 kV drive application using 4.5 kV IGBT Modules. IEEE Trans. Ind. Electron. 2012, 59, 1462–1476. [Google Scholar] [CrossRef]
- Albarracin, R.; Alonso, M. Photovoltaic reactive power limits. In Proceedings of the 2013 12th International Conference on Environment and Electrical Engineering, Wroclaw, Poland, 5–8 May 2013; pp. 13–18. [Google Scholar]
- Sharifian, M.B.B.; Faiz, J.; Fakheri, S.; Zraatparvar, A. Derating of distribution transformers for non-sinusoidal load currents using finite element method. In Proceedings of the 10th IEEE International Conference on Electronics, Circuits and Systems, Sharjah, UAE, 14–17 December 2003; Volume 2, pp. 754–757. [Google Scholar]
- Gouda, O.; Amer, G.; Salem, W. A study of K-factor power transformer characteristics by modeling simulation. Eng. Technol. Appl. Sci. Res. 2011, 1, 114–120. [Google Scholar]
- IEEE. IEEE recommended practice for establishing liquid-filled and dry-type power and distribution transformer capability when supplying nonsinusoidal load currents. In IEEE Std C57.110-2008 (Revision of IEEE Std C57.110-1998); IEEE: Piscataway, NJ, USA, 2008; pp. 1–52. [Google Scholar] [CrossRef]
Figure 1.
Power conversion system configuration. VBus represents the dc-link voltage, VInv is the converter voltage, VPOI is the connection point voltage and IInv is the converter current. LInv is the equivalent converter filter inductance and LTransformer is the short-circuit inductance of the grid connection transformer. VSC is the voltage source converter.
Figure 2.
Inverter active and reactive power limits.
Figure 2.
Inverter active and reactive power limits.
Figure 3.
Inverter active and reactive power injection limits depending on the grid voltage. Voltage and current limits are shown separately, where the operational limit is the space within both limits.
Figure 3.
Inverter active and reactive power injection limits depending on the grid voltage. Voltage and current limits are shown separately, where the operational limit is the space within both limits.
Figure 4.
Diagram of positive and negative sequence vectors. The positive diagram with an arbitrary angle θ is shown along with two cases for the negative sequence (RnTnSn and R′nT′nS′n). In the first case β is in phase with θ and in the second case β′ is in counter-phase with θ.
Figure 4.
Diagram of positive and negative sequence vectors. The positive diagram with an arbitrary angle θ is shown along with two cases for the negative sequence (RnTnSn and R′nT′nS′n). In the first case β is in phase with θ and in the second case β′ is in counter-phase with θ.
Figure 5.
Maximum current out of the three phases for a 1 pu positive sequence current and a negative sequence current from zero to 0.2 pu (0.02 pu steps). Θ = 0, and β = 0–2π.
Figure 5.
Maximum current out of the three phases for a 1 pu positive sequence current and a negative sequence current from zero to 0.2 pu (0.02 pu steps). Θ = 0, and β = 0–2π.
Figure 6.
Simplified diagram for a harmonic active filter application considering harmonic voltage and current sources. Note: POI = point of inter-connection.
Figure 6.
Simplified diagram for a harmonic active filter application considering harmonic voltage and current sources. Note: POI = point of inter-connection.
Figure 7.
Simplified diagram of the active power filter application for parallel resonances.
Figure 7.
Simplified diagram of the active power filter application for parallel resonances.
Figure 8.
Simplified diagram of the active power filter application for series resonances.
Figure 8.
Simplified diagram of the active power filter application for series resonances.
Figure 9.
Transformer de-rated capacity depending on the K-factor.
Figure 9.
Transformer de-rated capacity depending on the K-factor.
Figure 10.
Maximum modulation index (Max Ma: inverter voltage) for a B = 40% and h = 5th, 7th, 11th, 13th and 17th voltage harmonics for a PWM modulation with a 3rd harmonic. Maximum modulation index value for all possible phase shifts (β = 0–2π).
Figure 10.
Maximum modulation index (Max Ma: inverter voltage) for a B = 40% and h = 5th, 7th, 11th, 13th and 17th voltage harmonics for a PWM modulation with a 3rd harmonic. Maximum modulation index value for all possible phase shifts (β = 0–2π).
Figure 11.
Maximum current at nominal voltage for different harmonics and injected reactive power: (a) considering a correctly sized transformer and (b) considering a transformer designed with K < 2.
Figure 11.
Maximum current at nominal voltage for different harmonics and injected reactive power: (a) considering a correctly sized transformer and (b) considering a transformer designed with K < 2.
Figure 12.
Maximum 5th order current limit at nominal voltage for a 400 V and 600 V nominal grid voltage: (a) current at the LV side of the transformer and (b) current at the MV side of the transformer.
Figure 12.
Maximum 5th order current limit at nominal voltage for a 400 V and 600 V nominal grid voltage: (a) current at the LV side of the transformer and (b) current at the MV side of the transformer.
Figure 13.
Maximum active and reactive power injection capability for different injected 5th harmonic current values (DHC) at nominal voltage (400 V).
Figure 13.
Maximum active and reactive power injection capability for different injected 5th harmonic current values (DHC) at nominal voltage (400 V).
Figure 14.
Maximum active and reactive power injection capability for two 5th harmonic currents (DHC) of 0 and 800 A at nominal voltage. In order to show the de-rating effect, two different k-factors for the transformer are considered.
Figure 14.
Maximum active and reactive power injection capability for two 5th harmonic currents (DHC) of 0 and 800 A at nominal voltage. In order to show the de-rating effect, two different k-factors for the transformer are considered.
Table 1.
Inverter characteristics.
Table 1.
Inverter characteristics.
| Parameter | Value | Unite |
|---|
| Grid nominal voltage | 400–600 | V |
| Rated current | 1500 | A |
| Snom | 1–1.5 | MVA |
| Vdc BUS | 1200 | V |
| Max modulation index | 0.96 | |
| Inverter output inductance | 100 | µH |
| Transformer leakage inductance | 70 | µH |
| Filtering capability | Up to 17th | Harmonic order 1 |
© 2020 by the authors. Licensee MDPI, Basel, Switzerland. This article is an open access article distributed under the terms and conditions of the Creative Commons Attribution (CC BY) license (http://creativecommons.org/licenses/by/4.0/).


 ,
, 


