1. Introduction
The Antarctic plateau is now widely regarded as offering the best atmospheric conditions for a ground-based astronomical observatory [
1]. The Amundsen–Scott South Pole station’s astronomical science activities have obtained a series of achievements. It found that the infrared sky emission was lower than typically found at mid-latitude sites in 1–2 orders of magnitude [
1,
2,
3,
4] and the atmosphere held extremely low precipitable water vapor [
5]. The expectation of weak free-atmosphere turbulence was also confirmed. A very strong turbulent surface layer, 200–300 m thick [
6], was found, resulting in mediocre ground level seeing [
7]. The cognition of astronomical observation conditions was moved forward by the Italian and French Concordia “Dome C” station. The local topography of “Dome C” indicated that the surface wind speed should be lower and thus, the turbulent boundary layer should be confined closer to the surface [
5,
7]. These expectations have been confirmed by a series of site testing experiments operated over the last several years. The submillimeter opacity and infrared atmospheric emission was shown to be lower than observed at the South Pole [
8,
9], and while the wintertime surface boundary layer was also found to exhibit relatively strong turbulence, this was confined to within 30 m of the surface [
9,
10,
11].
The “Dome A” region has the Antarctic highest altitude of 4093 m [
12] with thin air, minimum wind speed [
13], and the least air layer disturbance [
14,
15]. “Dome A” scientific activities started in 2008, which have gained some progress [
16,
17]. Continuing to develop further astronomical science activities is significant. China National Observatory and Nanjing Astronomical Optical Instrument Research Institute manufactured an astronomical instrument called AST3 and sent it to work at “Dome A” from 2012, which has already made contributions to scientific research [
18,
19,
20,
21].
The support of electricity supply and scientific instruments’ thermal insulation is needed in the continuous observation activities under extreme environment conditions on “Dome A” with unattended equipment. AAOISE was employed to fit the demands of electric power and thermal energy, which AST3 used as logistic support equipment. AAOISE was designed and constructed during 2009~2010 at the Southeast University with the Purple Mountain Observatory, then, was delivered, installed, and commissioned at “Dome A” as part of the Polar Research Institute of China (PRIC) 2010 expedition. In early 2011, the AAOISE operated in Kunlun Station successfully. In 2019, the current AAOISE was perfected further and worked in Taishan Station fluently.
Some small electrical energy generation systems have operated successfully in Antarctic, such as the PLATO designed by the University of New South Wales (Australia) [
22]. Japan constructed a Syowa Base small-scale energy network (Syowa Base Micro-Grid: SBMG) through photovoltaics and wind power generation [
23]. Research team from Taiyuan University of Technology implemented the design of a polar wind and solar hybrid power supply controller in Zhongshan Station [
24,
25].
The AAOISE’s power generation is similar to PLATO’s power generation [
22] but has obvious differences in its control strategy consideration. AAOISE consists of two banks of three single-cylinder diesel engines equipped with alternators. Each alternator offers 1.8 kwh of power. A new strategy is adopted to control power generation and transmission, which is called the ControlNet field bus technology. It has already had lots of application bases in the industry field. In this way, the master controller PLCs are core equipment of the control network and other equipment, including sensors and input modules, are cooperated with PLCs. All above jointly constitute the unified control network, ControlNet field bus. Not only are all the diesels and generators managed and set by the ControlNet field bus but also all the power supply and protection of the electrical equipment are. Even the requirement of AAOISE inner environment temperature maintenance is realized by it as well. The unified control network fulfills the temperature control based on the real-time monitoring and the operating of some components, such as the relays, the electric heaters, and the fans.
Overall, control based on the field bus way is one of the advantages of AAOISE, with plenty of features. Firstly, the effectiveness of the related technologies has been verified in the field of industry. Secondly, the field bus implementation can be flexibly adjusted to the scale of need. Thirdly, the project implementation cycle could be shorter if the development team has the field bus application experience. Fourthly, several control equipment manufacturers could produce the related devices to meet the demands of the field bus, including many world-famous enterprises, therefore, component backup is secured that helps to maintain the control system. Fifth, the field bus control system is an open control system, where AAOISE can have larger development space as a support equipment to realize a more flexible design, meeting more closely the needs of scientific observations. Therefore, the field bus technology is set as AAOISE’s basic control idea in the final project demonstration.
This article will introduce the AAOISE design idea, general structure, and basic function specifics in detail, including electric power generation with the control system, thermal control, scientific instruments support, and the overall information processing methods. The short-run site test is valuable.
2. Design Principles
Since “Dome A” has extreme weather conditions, AAOISE needs to provide continuous energy when unattended. In addition, the Antarctica area needs to focus on energy conservation and emissions reduction. Therefore, AAOISE needs to consider the above special requirements in the design.
2.1. Consideration of Environment Factors
The geographical position of “Dome A” is 80°22′ S, 77°21′ E, 1228 km from the coastline, to which transporting equipment is difficult [
12,
13]. At present, only in each summer, the Polar Research Institute of China (PRIC) expedition carries out scientific expeditions for about 2 weeks and the rest of the time, no one is there. It is needed that all the support equipment at “Dome A” can cope independently with the severe environment.
The altitude at “Dome A” is about 4093 m and the atmospheric pressure is 570 Mbars [
26]. This kind of low pressure has impact on the performance of internal combustion engines and computer hard drives, leading to difficult working conditions for personnel. All electronic devices and modules relying on air cooling are also affected by the geographical factors. Not only the device operating prerequisites but also the reduction in pollution should be considered. The engine needs to be researched specially and the suitable work plan needs designing beforehand. Selection of all equipment must be careful. Priority should be given to the devices with small pollution, low energy consumption, long life, and that are easy to carry. The purchasing cost may be increased owing to these demands but is worth it in the long term.
The ambient temperature at “Dome A” typically ranges from −25 to −40 °C during the summer months and from −55 to −85 °C in midwinter, with the average annual temperature about −58.5 °C. Electronic systems must be heated and heavily insulated. Low-temperature materials must be used for all external components as well. NAOISP had customized hull with good heat preservation and controlled the inner temperature specially.
The average wind speed is less than 2 m/s and the maximum speed is 3.4 m/s [
13], so wind power cannot be used due to its scattered distribution [
27]. Meanwhile, diesel generators can supply with stable electricity. In 2011 and 2019, diesel power generation facilities were put into operation successfully.
2.2. Consideration of Physical Structure
Diesel-generating facilities can produce noise, vibration work, exhaust gas, high temperature, and pollution. In order to avoid affecting the scientific instruments’ normal work, the six groups of generators and other power generation equipment, such as fuel tanks, were placed together in a cabin far away from scientific instruments. This cabin is called the power module and another cabin is called the equipment module for the scientific instruments. The two modules are 50 m apart and connected by the low-temperature cables. “Dome A” has almost no wind, so power generation noise and gas will not affect the work of the scientific instruments. The basic work, such as power generation and temperature control, were completed automatically. Moreover, control parameters can be adjusted remotely.
Since the field work is located in the hinterland of the South Pole, from Asia to the South Pole, then, going on from the coastline to “Dome A”, finally, traffic is very harsh, even perhaps extremely threatening [
12]. It must be taken into consideration how to safely transport AAOISE. First of all, in shape, AAOISE was referenced to Australia’s PLATO [
22], and each module was made in 10 feet square container sizes. The two modules can be put into 20-feet standard containers during ocean shipping. Secondly, each module cannot be overweight, which can be ensured by the selection of equipment. Moreover, on the journey, modules and the equipment should have safeguards, which need reasonable transport scheme and seismic design to guarantee their safety. As is known, AAOISE’s equipment selection, transportation scheme, and seismic design accommodates the transportation needs.
2.3. Operation Mode
AAOISE was designed to work unattended to support science instruments with power supply, temperature hold, and remote communication continuously for nearly one year. It is suitable for science equipment installation and operation, making the maintenance work easier at the same time. The design principles are sufficient, small, easy to be expanded, and maintainable. The links between the AAOISE and remote inland observatory are very limited due to its special geographical position with severe environment and confined communication satellite bandwidth, so automatically running is AAOISE’s most important fundamental daily mode of operation, which is called “independent work, remote fine-tuning” [
28,
29].
Under the self-determination situation, several main tasks need to be completed by AAOISE [
30,
31]. Firstly, it was designed to finish complete energy production, transport, supply, and protection. Secondly, it provides an appropriate, stable cabin environment (main index is temperature). Thirdly, it responds to the communication needs of the scientific instruments from time to time. Fourthly, it supports mass data storage for scientific instruments and own maintenance. Fifthly, it regularly communicates with remote observation.
The remote fine-tuning mainly includes transmitting the remote controlling command and a few control parameters from the inland observatory. The function was realized with the help of the satellite communication channel and the AAOISE inner site control network. Because of this, AAOISE paid rent to the United States iridium satellite for its communication channel. The AAOISE inner site control network is set up based on the ControlNet field bus [
32].
3. Composition and Structure
The key problems of continuous operation for AAOISE under the special requirements of Antarctica are high reliability and degree of automation. Therefore, the equipment used in the system all have high reliability. A redundancy mechanism is adopted for key equipment, key nodes, and other aspects.
3.1. General View
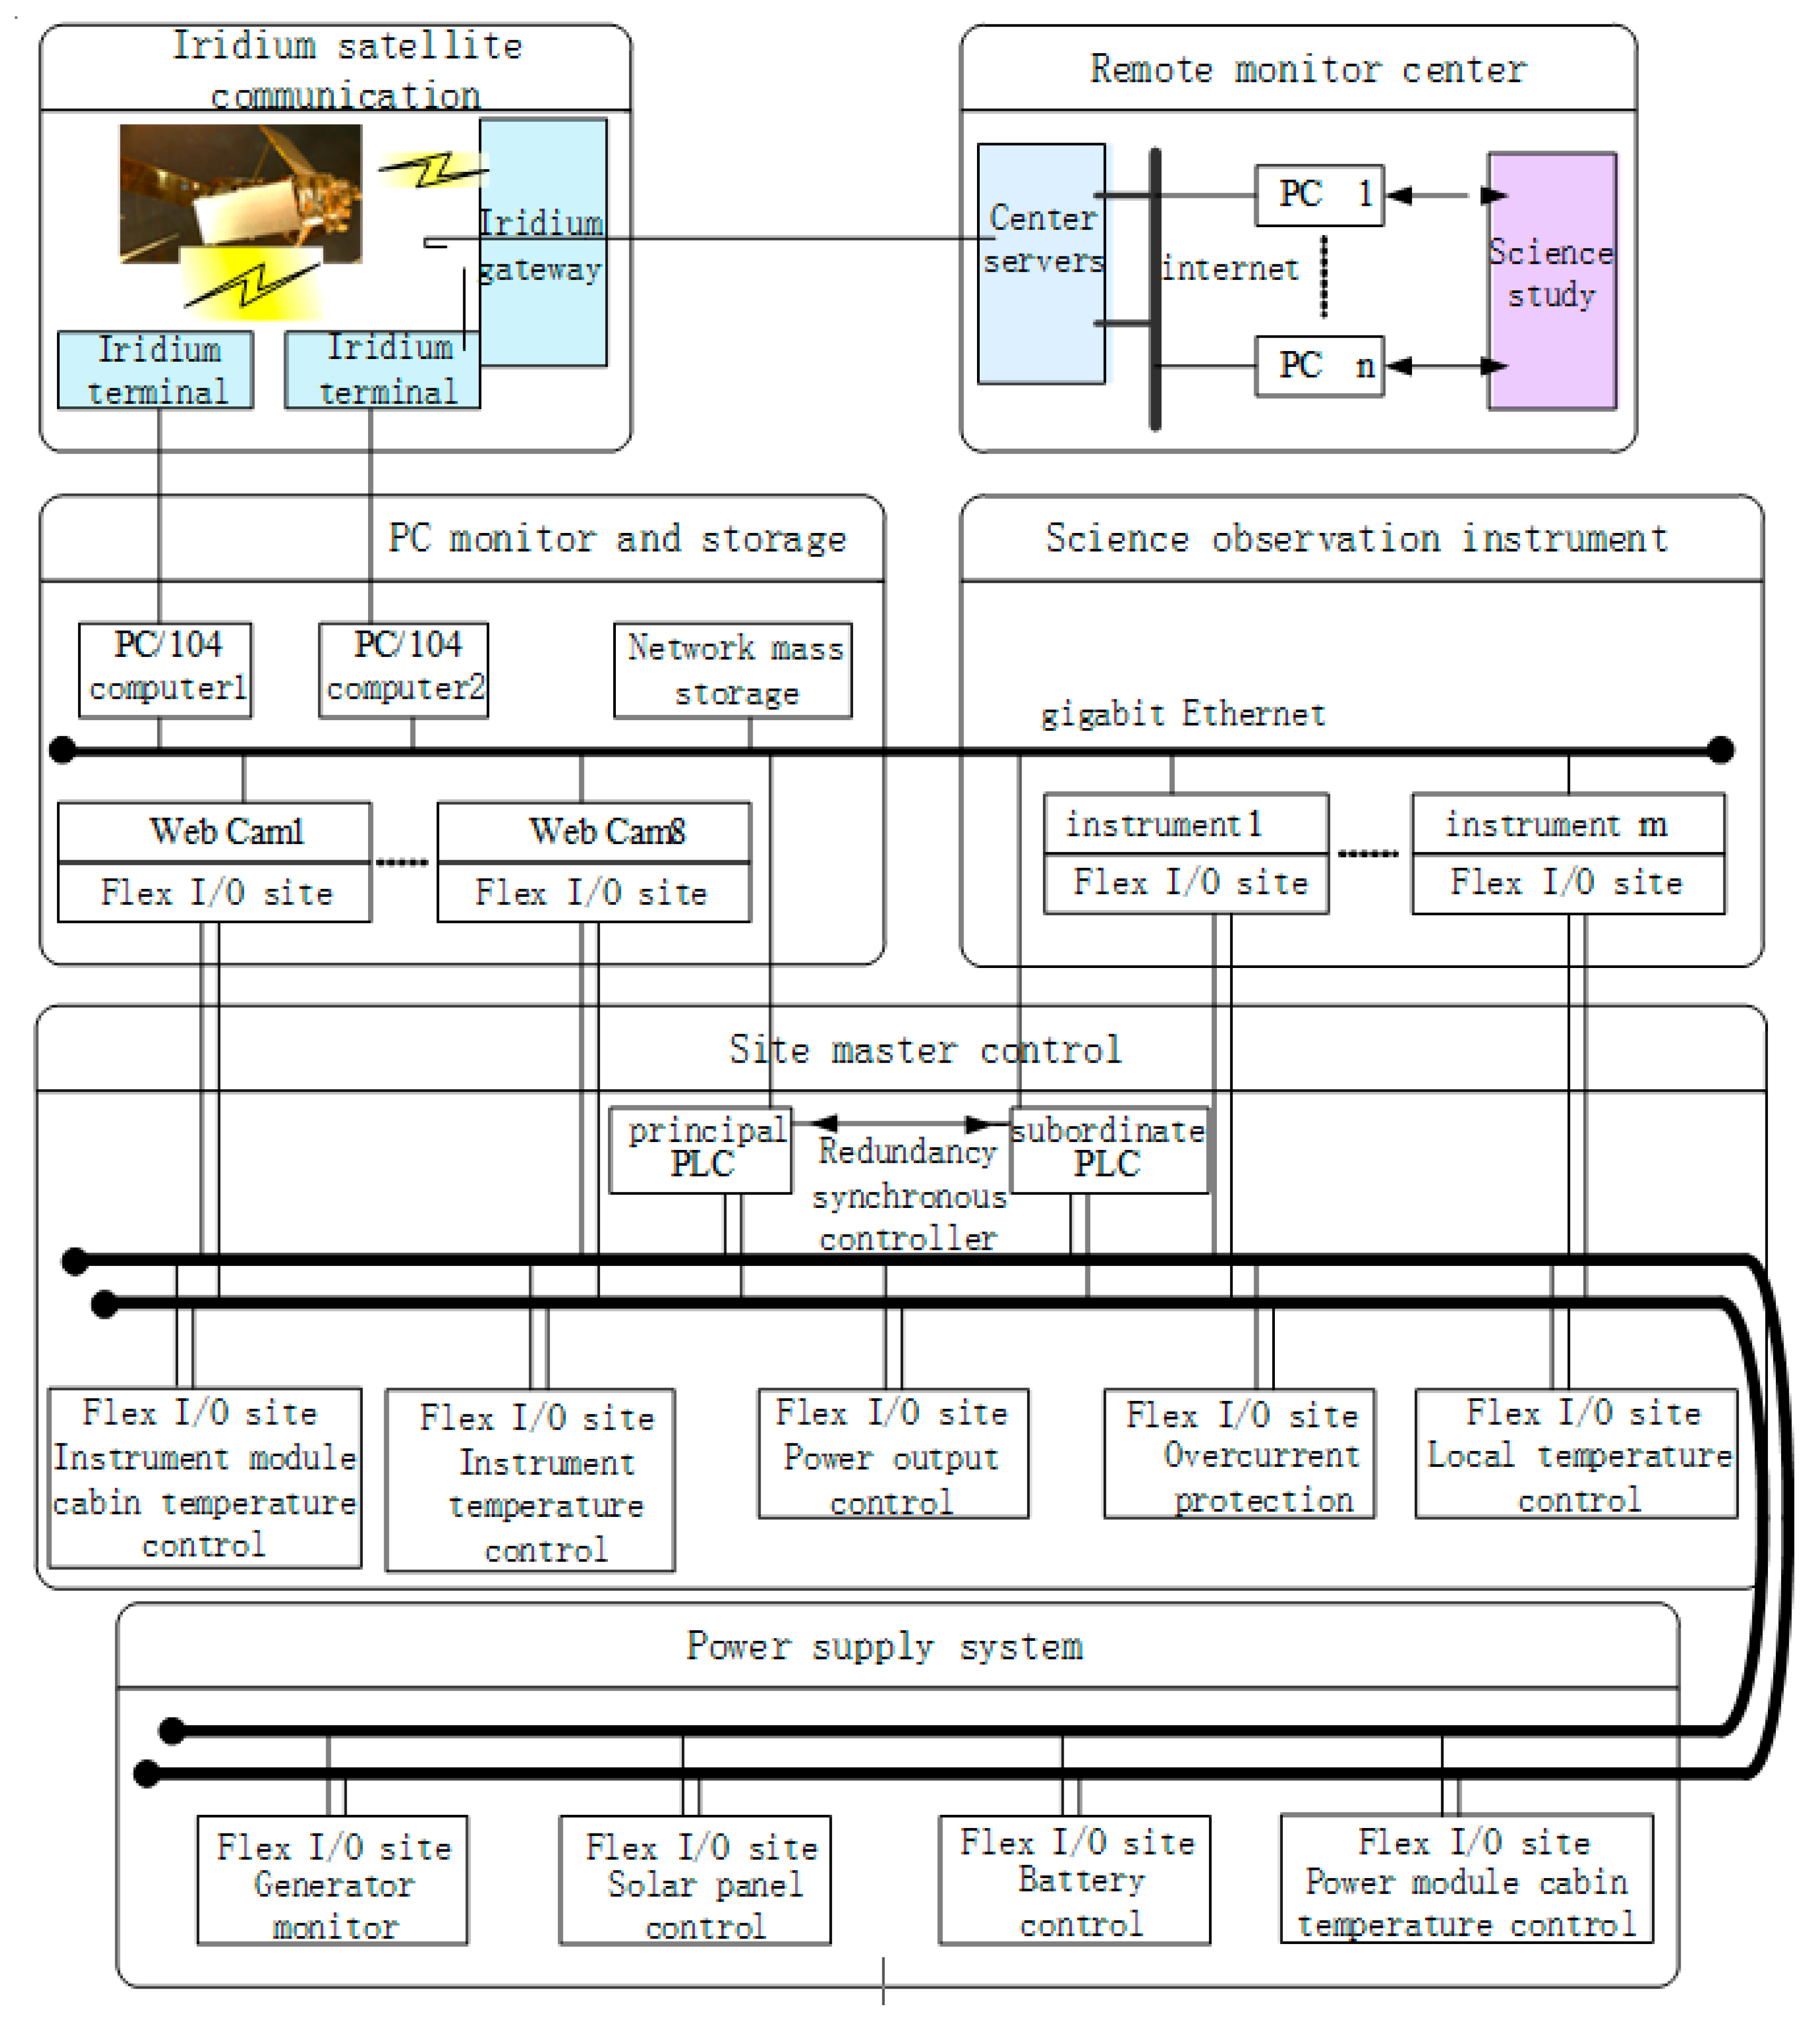
In order to complete the task, AAOISE is schemed to work collaboratively in five function subsystems. They are the structure and temperature control system, the power system, the site master control system, the PC monitoring with data storage system, and the communication with remote monitoring center system. Besides these five subsystems, another important part is the scientific observation connector subsystem. The relationships between them are shown in
Figure 1. The remote monitoring center system is located in China’s Antarctic astronomical center, while other systems and all scientific observation instruments are placed at the South Pole “Dome A”.
The electric power is currently only from the diesel launch unit, known as the “diesel engine power generation (DP) system”.
The alternating current coming from DP is first rectified into 220 V dc, then, transported to the equipment module through the connection bus cable which links the power module and the equipment module with the name of tension bus bar. In the equipment module, the 220 V dc is converted into two power ways, 220 V ac and 24 V dc, so that different types of equipment can be powered. In the power module, the super capacitors need 24 V dc in the course of charging to meet the engine start motor requirement, so a 24 V dc bus comes back from the equipment module to the power module.
The “site master control (SMC) system” executes the measurement and control of the electric power generation, conversion, transport, power supply protection, battery pack (BB) charge, and discharge through the redundant control nets when automatically running.
The “PC monitor (PCM) system” keeps in touch with the SMC science equipment and network storage system at any time through the redundancy Ethernet, realizing the flow of site data, except the data exchange with the satellite communication.
The “iridium satellite communication (IMC) and remote monitoring center (RMC) system” guarantee the realization of the satellite communications, including data receiver and data sender, which carry out the remote monitoring of AAOISE.
The “structure (SW) and temperature control (STD in power module and STI in instrument module) system” are responsible for designing and manufacturing the two modules’ cabins. Both the equipment installation and the internal environment heat preservation are taken into consideration. The two cabins have several heaters and fans inside controlled by the SMC.
The “scientific observation interface (SOI) system” installs the science instruments and connects them with AAOISE through the developed interfaces.
3.2. Collaborative Working Process of Subsystem
Automatic monitoring and operation in AAOISE mainly depend on the (site control) SMC, based on the field bus. The SMC communicates with the (remote center) RMC through the (PC monitor) PCM, whose core is the PC104 computer. On the one hand, the PCM obtains the data of SMC, saves them into site storage, and transfers part of it to China’s domestic observatory by iridium satellite at regular intervals. On the other hand, the domestic observatory also can give instructions to the PCM through the iridium satellite and PCM, and deliver them further to SMC if needed. However, the limited bandwidth of satellite communication results in the limited number of instructions delivered every day.
The control system consists of SMC, PCM, and IMC, while the power system is DP. The two systems are the focus of the paper. The (diesel engine power generation) DP is shown in
Section 4. The (temperature control of two module cabins) STD and STI are described in
Section 5. The (scientific observation interface) SOI supported by the (PC monitor) PCM are explained in
Section 6. The information collection and process work achieved by PCM with SMC and IMC will be described in
Section 6.4. The last section (
Section 7) is the conclusion.
4. Diesel Power System
In order to solve the problem of diesel engine failure during operation, the redundant scheduling operation mode of multiple diesel engines is adopted in the design of the diesel power system. The system is a controlled and switched scheduling operation by PLC.
4.1. System Composition and Work Style
AAOISE’s diesel power generation system is mainly comprised of the diesel generator set, ac–dc converter, dc–dc converter, super capacitor, storage battery, and transmission cable, as is shown in
Figure 2.
In the power module cabin, the power generation units have two sets of devices with exactly the same redundant configuration, with three HATZ1B40 diesel engines in each set. Each engine connects with an alternator and each alternator joins with an ac–dc converter. When the diesel engine starts, the generator transforms the three-phase 220 V AC which flows into the ac/dc converter into the 220 V dc. Then, it is transmitted to the instrument module through the bus bar between two cabins. The maximum output power is about 1.8 kW created by a diesel generator.
The fuel of the engine is aviation kerosene. The fuel tank capacity is about 4.5 tons, locating under the diesel engine. Generator units are fixed on the top of the tank to reduce vibration measures. Each engine has two lubricant oil tanks of 200 L, with a diesel engine and generator unit beside.
Every engine generator equips a controller directed by the SMC—only one engine generator is in operation and the others are in rest at any time. The generator unit works in turn, controlled by SMC which has the duty of retaining each generator unit in proper working condition, extending service life and saving fuel consumption. SMC makes all decision according to the device working time and the actual power loss.
In the equipment module cabin, the 220 V dc from the power module is divided into two parts. One is converted into 24 V dc through two redundant dc/dc converters, whose output is 10 amperes current. The other is converted into 50 Hz/220 V ac through redundant dc/ac converters with 150 W output power, even 300 W in peak. Besides, two sets of battery packs are located in the equipment cabin with a capacity of 320 Ah in each set.
The 24 V dc is also needed in the power module, including controllers and the super capacitor charging. As the power source of the start motor of diesel engine, the super capacitors can reach 12 V/300 A instantaneously during discharging. The 24 V dc is sent back to the power module cabin through the bus bar between the two modules.
4.2. Diesel Generator Automatic Control System
4.2.1. Function of Control System
The control system belongs to the (site mast control) SMC, one of whose most important tasks is controlling the work process of the diesel generator. It consists of condition monitoring, operation scheduling, and performing the remote control instructions.
The condition monitoring equipment monitors generator state, detect fault state, checks the generator sets regularly to ensure their operation ability, and provides operation data to the (PC monitor) PCM.
The operation dispatching equipment is used to deal with emergencies. For example, if the working generator operation fails, another generator must be started up to ensure stable energy power. When the core control equipment (like central controller) malfunctions or a communication link disconnects, a spare controller or communication link must take over the work instantaneously and automatically [
33].
The remote control instructions come from the (PC monitor) PCM which receives data through the satellite communication. The instructions mainly include switching generators by force and adjusting the priority of generator startup.
4.2.2. Basic Running Process and Control Content
The basic operation cycle of each diesel generator includes startup, operation, and stopping. Each engine has a conventional starter motor in sequential control mode. First, the super capacitor recharge group is charged until its voltage is up to 12 V. Then, under 300 A current at 12 V, the diesel starter motor is activated to motivate the diesel engine. The output voltage is monitored until the end of startup time. If the voltage can satisfy the standard level, it steps into operation monitor state; otherwise, it gets ready to launch next diesel generator and stop the current generator operation at the same time.
Six generators are divided into two groups and every moment, at least one generator is in starting or operating state. The “generator priority” switching operation decides which generator should be started next. Its queue rejects the defective generators of starting failure, running error, and so on. The “generator priority” can be adjusted automatically under the control of the “site conditions inspection regularly”. It updates all generators’ operation ability and can be adjusted by remote regulation through the PCM and satellite communication.
4.2.3. Architecture and Hardware
The stability and reliability of control is the most important index in a long-term unattended harsh environment, so the selection of system architecture and equipment needs special consideration and design.
Redundant PLC control technology has showed high reliability in the industrial control area, such as the AB ControlLogix PLC redundant control schemes used in extremely cold regions of Russia. In addition, the AB 1794 series I/O modules can work reliably in low-temperature environments as well. Thus, in our project, the AB related products are adopted to realize the SMC control scheme and the field bus technology solutions are used to obtain control effect.
In the hardware structure, the main control equipment, the special control communication network, and the flex I/O sites are all configured to redundant mode (as is shown in
Figure 3).
Two redundant main controllers of the ControlLogix 5561 low-temperature-type PLC are settled in the instrument module cabin. One is the principal PLC and the other is the subordinate one.
If the principal PLC breaks down, the subordinate PLC should take over all the work and become the current principal PLC in a very short time (less than 100 ms). The main controller refers to the principal PLC. Some other significant devices are close to the main controller, as follows. The redundant 1757-SRM is the frame of the fiber optic cable communication module between the redundant PLCs, whose CPU is L61. The redundant 1756-EWEB is the Ethernet connection module and 1756-CNBR is the control network connection modules. Through the Ethernet, the main controller PLC connects the (PC monitor) PCM’s PC104 machine. The content about PC104 can be referred to in
Section 6.4.
In the power module cabin, many distributed Flex I/O sites (also called data acquisition and control box, or control box) are the wide-temperature type of product. They can work reliably in low temperature and implement the task of data acquisition and terminal control. Each Flex I/O site can communicate with the controller PLC via the help of the 1794-ACNR 15 ControlNet adapter module which connects the Flex I/O with the field control network. Each ACNR module can connect eight I/O modules at most.
4.2.4. Software
The major software functions include starting up the diesel generator automatically, scheduling the generator switching, inspecting the diesel generators regularly, etc. Among them, generator switching includes failover, time switching, remote switch, etc.
The major software also takes a role in charge of the switch of the tension bus bar to supply an electric energy smoothly and steadily.
4.3. Power System Remote Control
The remote control path starts from the (remote monitor) RMC system, transmits through the (iridium satellite communication) IMC systems, arrives at the (PC monitor) PCM system, then, delivers to the (site master control) SMC system via the 1756-EWEB modules, acting as the interface between PCM and SMC. The current remote control commands include changing the start priority of the diesel generators or launching some diesel generators directly.
The 1756-EWEB module links the SMC and the PCM and adopts B/S (Browser/Server) mode. As a WEB Server, it renders services of data interaction between itself and the client WEB Browser, whose advantages are its short development cycle and good compatibility with Ethernet devices.
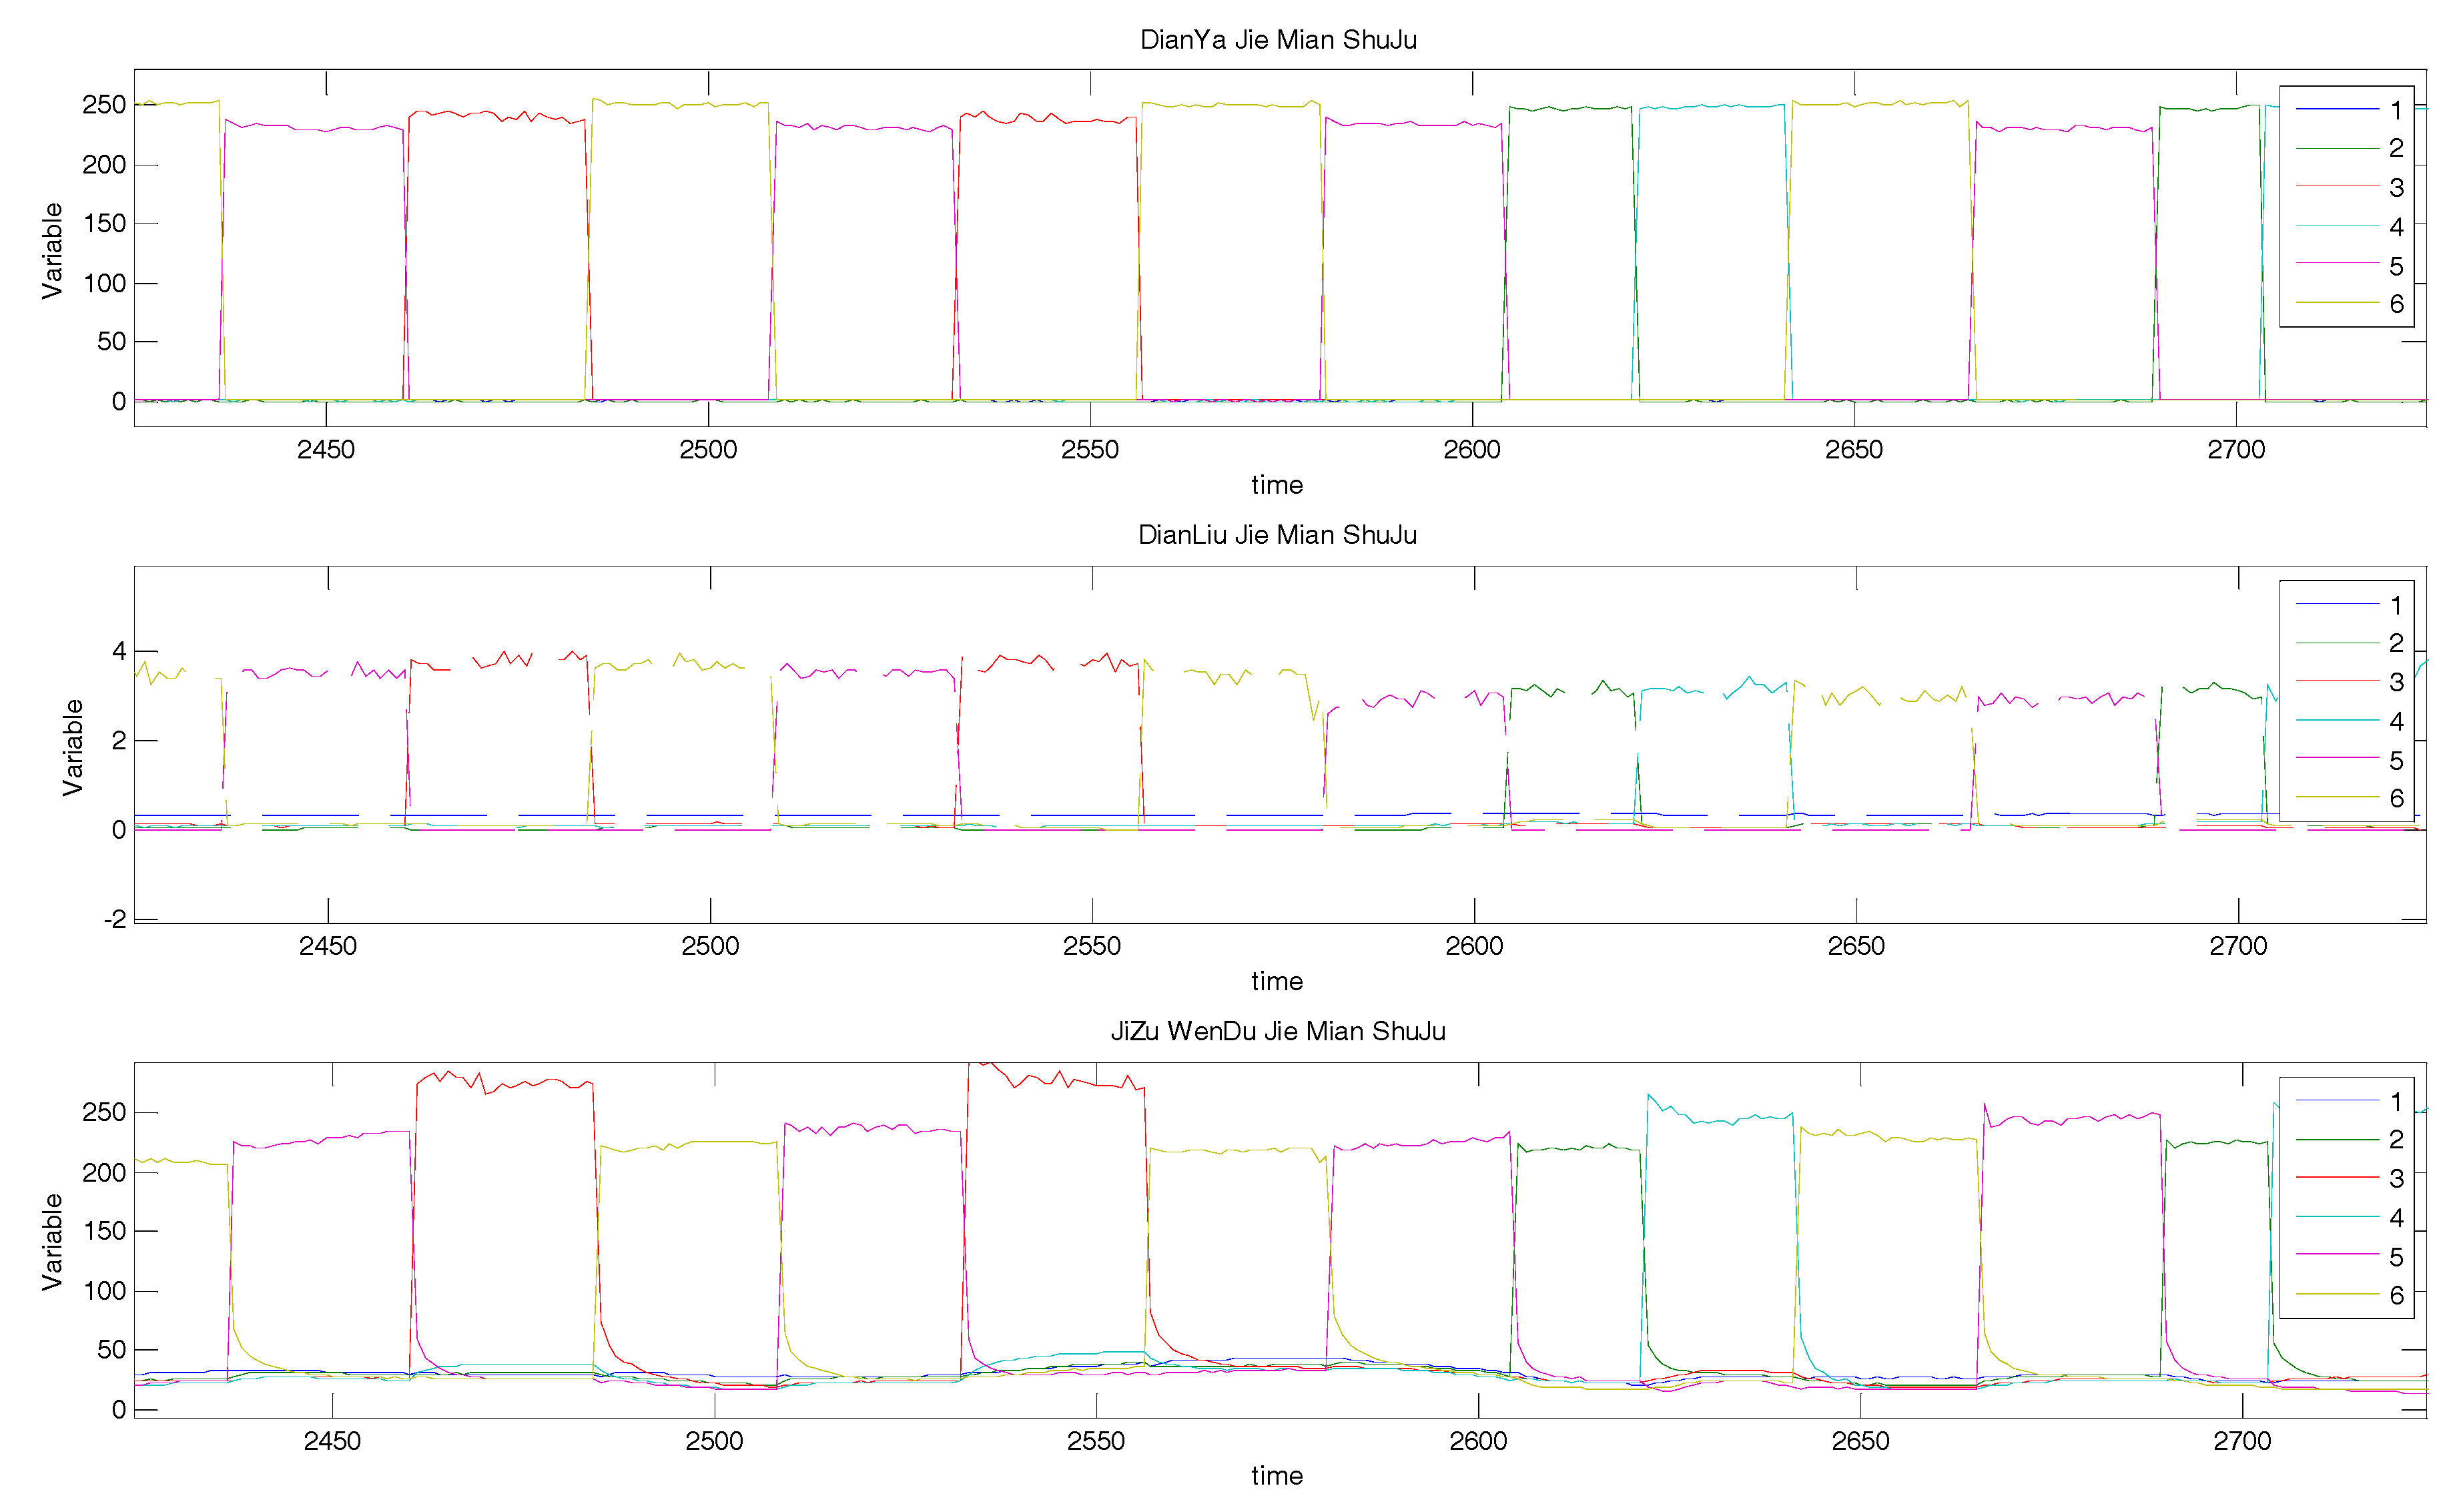
4.4. Diesel Generator Working Curve
Figure 4 is the output voltage/current curves when engines switch automatically. The third generator’s output voltage value is close to 250 V and output current value is around 3 A, similar to the test results. This indicates that the third diesel generator is working normally. Then, after a switch cycle, another generator is turned on and works normally and the third is stopped meanwhile. At last, a new switch cycle begins and the third generator restarts the operation. It displays that generator scheduling is normal during automatic switching. The SMC realizes the local automatic control of generator cycle switch in the power system.
Figure 5 is the output voltage/current in the case that a remote instruction of changing generator startup priority is executed and a remote switching generator command is carried out afterward. It illustrates that the (site master control) SMC’s local control, the (PC monitor) PCM’s communication, the (iridium satellite communication) IMC’s connection, and the power system’s remote control are all in normal operation.
5. Heat Energy Management
For AAOISE, temperature control and energy conservation issues are particularly important in the Antarctic low-temperature condition.
5.1. Heat Source and Thermal Management
All the heat energy comes from the power generation system. Working in an extremely cold and expensive fuel costing region, AAOISE ought to limit fuel consumption [
34]. Uniform management and distribution of heat energy are implemented by the (site main control) SMC, except that the network storage system in the PCM has its own temperature control system which can be referred to in
Section 6.4.
The basic method of thermal management is controlling temperature in two module cabins. The temperature sensors, settled in two cabins, sample the temperature in certain places. According to the control strategy, SMC decides which groups of heater or extractor fan should be in operation or not.
Six temperature sampling points and six groups of corresponding heaters, including two heating units, are settled in each cabin. Besides, there are two groups of extractor fans and air circulating fans in each cabin. All the heaters and fans are jointly controlled by the SMC.
Through on-the-spot inspection, in summer, the instrument cabin temperature range was correct, but heaters and extractor fans rarely worked. Therefore, its main work is temperature monitoring, thanks to the excellent performance of heat preservation. In the power module cabin, the lost energy of engine operation turns out to be heat energy and the temperature inside the cabin is higher than 30 °C in summer, so the main content of temperature control in summer is cooling, with extractor fans all continuing to work.
The heaters play a role at the beginning of starting the first diesel generator, controlled by the SMC.
5.2. Strategy of Temperature Control
The aim of temperature control is to guarantee the cabin inner temperature can meet the equipment’s and scientific instruments’ normal work demand, reducing power consumption of the heaters at the same time.
The circulation fans can be operated automatically or manually. In the automatic way, the SMC determines fans’ operation states according to SMC’s control strategies and adjustments. In the manual way, the fans’ operation states are decided by the remote commands and the SMC. If not specially requested, the circulation fans’ continuous operation can reduce the influence of temperature misdistribution. As a result, their initial state is manual remote control and all of them are turned on without shutting off in principle.
The heaters are engaged by the SMC automatically according to the six temperature sensors values in each cabin. The sensors are scattered in different areas and each can correspondingly affect a group of heaters with two heater units. If the temperature is less than the floor level, the corresponding heater group is switched on until the sensor detected the temperature has reached top limit.
The extractor fans are also controlled by the SMC automatically according to the six temperature sensors in each cabin. The average value of every three sensors decides a group of extractor fans’ operation state. The fans are supposed to power off while the temperature is higher than the upper limit and power on by contrary.
Because of the different structure of two cabins and equipment, their temperature control parameters are slightly different.
In the instrument module cabin, there are a few important parts, including the master controller PLC, the monitor PC machine PC104, the network storage system, the scientific apparatus etc. They all have their own working temperature demand. The initial setting range of temperature is −20~+20 °C in the PLC controller, which is remote adjustable.
The power generation systems are located at the power module cabin, responsible for the safety of power supply. The initial set of power generation cabin temperature control range is 0~+20 °C, which is also remote adjustable.
5.3. Temperature Control Curves
The working curves of the equipment module cabin temperature, the inner heaters switch, and the exhaust fans switch are shown in
Figure 6, in which the influence of the heaters and the exhaust fans indicate that the temperature control has some effect.
6. Facilities for Scientific Observation Instruments
AAOISE is used to support the operation of scientific research equipment. In terms of design, it is necessary to consider the access of scientific research equipment, realize system operation, and data storage of scientific research equipment, etc.
6.1. Functional Ports
Two kinds of ports were catered to the scientific instruments in AAOISE. One is the energy supply port and the other is the information transmission channel. The power supply includes the common 24 V DC whose path current is 10 A, the 220 V AC whose path power outputs usually are 150 W or even up to 300 W instantaneously. The information channel is the gigabit Ethernet, assisting serial port, and CAN bus.
6.2. Functional Ports Management and Control
The hardware connection form of the scientific instruments with docking ports on AAOISE is shown in
Figure 7, accompanied with
Figure 1 and
Figure 3.
The (site master control) SMC system is in charge of the power supply ports, with power switching control and the over-current protection through the redundant control network. The information transmission channels are managed by the (PC monitor) PCM system through the redundant Ethernet, which links the scientific instruments to the PC104 of PCM and supports the two-way communication.
In the control software, the power supply operation procedure and Ethernet application management are the most important parts.
6.3. Network Mass Storage
6.3.1. Introduction
The large volumes of data generated by the Antarctic scientific observing apparatus cannot all be sent back to the remote monitor due to the restrictions of the communication speed and flow. The scientific instruments can save part of local data itself [
35]. Meanwhile, AAOISE provides mass storage based on Ethernet, with capacity of about 6 TB available and 21 TB extensible. The network storage system responds to scientific instruments at any time for data storage through high-speed Ethernet during the unattended period. During annual regular maintenance, the network storage system’s hard disks should be unloaded from the management system and the new formatted ones will be loaded in. The old disks with data will be brought back to the remote monitor center.
AAOISE’s storage devices consist of some NASs under the control of PCM. The centralized network storage system based on controlled NAS has superiority against the usual computer local storage system. It has higher data reliability and larger storage space than local storage. Each NAS works in the B/S mode and acts itself as the server, offering ample application interfaces to the clients. Its storage space is manageable. It supports the redundancy storage scheme which can save data backups once part of disk error or disk array damage occurs.
It is of great significance how to manage the network mass storage system and give full play to its advantages to make it a self-maintainable automatic system.
6.3.2. Network Mass Storage Control System
The network storage groups are used in an extreme cold region under low air pressure. Ordinary computer devices, especially hard disks, will possibly break down and fail to provide a reliable storage space. The self-developed special control system is used here to deal with all kinds of possible problems, such as making fault switches to ensure the storage space’s continuous usage.
The network storage equipment is controlled and managed by the (PC monitor) PCM and the (site master control) SMC, as is seen in
Figure 1. The allocation of responsibilities is as follows. Firstly, the network storage three devices’ operation state is decided by the PCM according to the real-time data acquisition about these storages. In this way, part of the data acquisition and the power switch are supported by it as well. Then, since the storage equipment needs their work temperature above 0 °C, a local exclusive using temperature control system is developed here inside PCM.
The hardware of the mass storage network includes the NAS groups, the equipment controllers, the temperature sensors, the heaters, the monitor machines PC/104, and a high-speed Ethernet, as is shown in
Figure 8.
The information’s physical channel has two kinds, the Ethernet channel and one-way signal channel. The Ethernet channel can perform two-way communication, while the one-way signal channel can only transfer one-way signals like sensor signal, equipment control signal, power supply control signal, heating control signals, etc.
The mass storage system network’s control software realizes the NAS’s automatic scheduling and maintenance, ensuring continuously available storage space. Its main duties are collecting network storage equipment’s operation conditions, monitoring possible related faults and key links of the storage system, executing the device switching on faulty equipment, and realizing the redundant control mechanism.
6.4. Data Collection and Remote Communication
In the power module cabin, the equipment’s work data and controlling data are monitored by the (site master control) SMC through the various sensors arranged in certain places including voltage sensors, current sensors, temperature sensors, liquid level sensors, etc. The main controller PLC, as the core of SMC, obtains all kinds of real-time monitoring data through the one-way signal lines and then, classifies them, which decides whether should give an alarm to some device or switch it referring to its default value.
In the instrument module cabin, the similar data flow still exists. Moreover, there are some other data flows that belong to the PCM. The core devices are monitored and controlled by the SMC and the PCM at the same time. The SMC and PCM have different foci of attention on these core devices. The SMC implements control on the equipment’s power switch operation and the PCM gives priority to the equipment operation-state adjustment. The devices will not receive conflicting control instructions. For example, if PCM needs to power on a device, it will send a request to SMC, the SMC will first finish its own logical judgment, operate the switch, and return the answer action back then.
Within a predetermined cycle, a packet of SMC’s real-time data section will be sent from the main controller PLC to the PC104 monitor machine of PCM. These data packets and the PCM’s real-time data section packets are compressed together and saved at PCM. Part of the data is regularly transferred to the (remote monitor) RMC system through the (iridium satellite communication) IMC.
The (remote monitor) RMC can give instruments to the (site master control) SMC and the (PC monitor) PCM for remote intervention. These orders, issued by the RMC, flow through the (iridium satellite communication) IMC to the (PC monitor) PCM or are conveyed from the PCM to the SMC when necessary. The detailed view of the PCM communication with the SMC can be referred to in [
26].
The site scientific observation instruments can send data to the PCM at any time, using the redundant Ethernet. Then, these data will not be saved and directly sent to the (remote monitor center) RMC through the (iridium satellite communication) IMC. Correspondingly, the data from the (remote monitor) RMC to the site scientific observation instruments flow through the (iridium satellite communication) IMC and then, arrive at the (PC monitor) PCM, directly conveying to these site scientific observation instruments.
The mass storage system network connects with the site scientific observation instruments through gigabit Ethernet. The data transmission between them can be processed without other computers.
As is shown in
Figure 9, all the real-time sampling data and control data will flow into the PC104 of PCM finally. They are saved in local hard disks with binary compressed ways, except the site scientific observation instruments data, which can be stored in their local hard disks or in the mass storage network.
The remote connection is installed, relying on the iridium satellite communication channel. Its main equipment is the iridium satellite modem, driven by the PC104 of the (PC monitor) PCM system. The iridium satellite modem exchanges information with PC104 through a serial port, and receives the control signals from PC104 through a multi-function port assembled in the iridium satellite modem at the same time. The external antenna, fixed on top of the instrument module cabin, is connected to the iridium satellite modem’s main pillar through a special cold resistant cable.
7. Conclusions
The AAOISE realizes the field control, data collection, operation monitoring, data storage, and remote control functions of the Antarctic equipment. The system is designed to enhance the reliability of the system through redundancy design. The system is operated by system diagnosis, scheduling, and other technologies. The system is operated by means of independent operation combined with remote intervention.
The AAOISE can work in a low-temperature and low barometric pressure environment to provide instruments with heat-preserved foundation support and continuous electric power. During the field inspection period, AAOISE mainly worked in self-control mode and its remote monitor function passed the test too. It showed good independent control stability and flexible remote handling. The field inspection indicated that the power supply and heat preservation were successful.
The AAOISE’s design tried to reduce the impact on the environment and dependence on distant control. It is an independent completely controlled intelligent equipment, which also supports remote real-time online monitoring. Its site master control, SMC, is set up based on the field bus technology in an independent control way. Redundant technology is applied widely to satisfy the demands for power supply and temperature maintenance as low energy consumption as possible.
After 50 days of operation of AAOISE in 2011, it worked fluently in Kunlun Station. Then, in 2019, the capacity of output power was improved and served the science observation instruments in an even better way in Taishan Station.


