Abstract
In recent years, the fight against global warming and therefore CO reduction have become the most important issue for humanity. As a result, volatile sources of energy—like wind and solar power—are penetrating the electrical grid and therefore an increased demand on storage capacities is required. At the TU Wien Institute for Energy Systems and Thermodynamics, a Fluidization Based Particle Thermal Energy Storage (FP-TES) working with bulk material as a sensible storage material is developed. In this paper, the concept and an experimental study of the cold test rig is presented. By means of various pressure measurements, a novel concept of particle transport based on advanced fluidization technology without any mechanical transport devices is investigated. Moreover, a mathematical correlation between the pressure gradients and the particle mass flow is found. Overall, the experimental study provides a full proof of concept and functionality of the novel energy storage system.
1. Introduction
In 2009, politicians around the globe have agreed that the global warming caused by CO emissions has to be limited by two degrees above the average global temperature of pre-industrial times [1]. As a result, the European Union (EU) has set a total reduction of greenhouse gas emissions goal of 20% until 2020 and 80–95% until 2050 [2]. Such reduction of greenhouse gas and especially CO cannot be achieved without utilization of renewable energy sources and improving efficiency in energy intensive industries. Based on changes in the legal framework, the share of renewable energies of electricity and heat production has been increasing in the last few years. While production of electricity via hydro-power in the EU has almost stagnated, wind and solar power have more essential quintupled between 2005 and 2015 and further increase is expected [3]. The basic problem concerning those renewable energy sources is their volatility and therefore unreliability and unpredictability leading to a demand of flexible storage technologies in order to guarantee a stable power grid. In that regard, centralized hydro-power pumped-storage and especially ternary sets with high capacities, lifetimes [4], flexibility, and very good round trip efficiencies around 80% are well suited [5]. However, they are also subject to topological restrictions and can cause serious ecological impact [6]. Another option would be the integration of flywheel storage for wind turbines but high capital costs and self-discharge need to be considered [7]. Furthermore, electrochemical storage systems are the most popular and mature energy storage devices. They are very flexible and independent of geological restrictions but are subjected to rather low lifetimes and complex waste management strategies [7,8].
With a capacity of 3.3 GW, the thermal energy storage (TES) systems are already the second most developed storage method in terms of installed global power [9]. Power-to-heat (P2H) and even power-to-heat-to-power (P2H2P)—formerly regarded as sheer wastefulness—could become a realistic and even economically feasible alternative, taking into account vastly fluctuating electricity prices and free availability of renewable energy sources, converted to electricity at low operating costs. Besides changes in electricity production, consumers, forced by the EU’s Energy Efficiency Directive [10], are trying to enhance efficiency. Heat recovery, as could be provided by TES, can contribute to increased efficiency in the industry and reduce total industrial energy consumption. Depending on the application, different TES technologies are available and under research, divided into latent [11], sensible [12], and thermochemical storages [13]. In [14,15,16], an overview of TES technologies is provided. For high temperature applications, sensible TES working with bulk material is advantageous because of their low investment costs and flexibility regarding operation temperature as well as power and capacity [17,18,19]. High heat transfer coefficients can be achieved by using a fluidized bed heat exchanger (HEX) [20] but developing an efficient particle-fluid HEX is still a challenge. Such TES systems have already been presented especially in the context of solar power plants [21,22,23,24]. Based on experiences gained during the course of the sandTES project, a novel TES, called Fluidization Based Particle TES (FP-TES) [25], has been developed on the TU Wien, Institute of Energy Systems, and Thermodynamics as a further development. The FP-TES concept is very flexible in application and can be applied as a so called P2H2P system as well as for heat recovery and storage in general. In contrast to so far presented particle TES systems, the FP-TES does not depend on any mechanical transport devices, like bucket elevators or screw conveyers, to carry the bulk material.
In contrast to pneumatic conveying [26] the whole HEX is fluidized and slowly moving in a horizontal direction, while the main flow direction of the air and the particles is still vertical. Whereas other presented fluidized bed conveying mechanisms are using gravitational effects to transport the storage medium through the HEX [27,28], the sandTES prototype [29] and the FP-TES are utilizing the patented air cushion technology [30,31,32] to achieve horizontal plug flow. This novel particle transport mechanism is using a pressure gradient instead of gravity or air flow as a driving force for particle mass flow.
To demonstrate the functionality of the FP-TES, experimental investigations on a FP-TES test rig are performed and presented in this paper. The underlying geometry of the test rig was optimized with numerical simulations by the second author as his diploma thesis [33], and an additional paper based on this work was already submitted [34]. A first paper showing the results of preliminary simulations and experiments as well as an energetic consideration of an industrial application has already been accepted for publication [35]. The target of this work is to prove the novel concept of particle transport without mechanical transport devices and to figure out the range of stable particle mass flow as well as requirements to control the particle mass flow. Furthermore, the experiments can be used to validate the numerical simulations.
2. FP-TES Technology
2.1. General Concept
The FP-TES is a sensible short- to mid-term heat storage working with bulk materials transported by an advanced fluidization technology. Figure 1 shows a conceptual sketch of FP-TES.
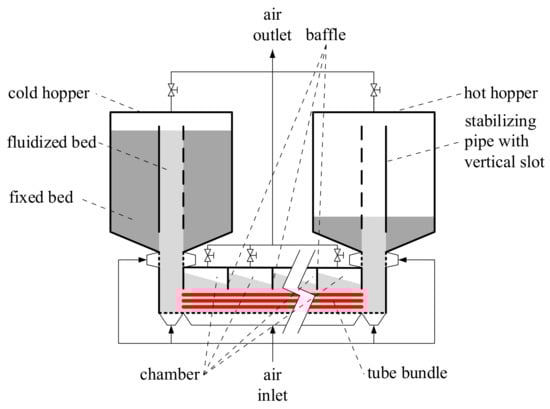
Figure 1.
Conceptual sketch of FP-TES.
Detailed information regarding the principle of the fluidization technology can be found in [20,36]. In terms of charging the heat, the storage medium is transported from a cold hopper through a fluidized bed HEX to a hot hopper, respectively in case of discharging the other way around. The HEX contains a tube bundle, shown in red in Figure 1, carried out, for example, as a condenser/evaporator or for the application of a sensible heat transfer fluid. In case of charging the system electrically, additional heating rods can be applied. In general, the storage medium is fluidized by air, but, if advantageous, another fluidization gas can be used.
In order to maximize energy density and minimize investment costs, an easily and quite affordable available storage medium with high heat capacity, like quartz sand or corundum powder, is demanded. Based on the fact that minimum fluidization velocity and thus also auxiliary energy demand increases with rising particle diameter [20], smaller particles are favorable. Particle diameters of approximately 100 or a little bit smaller are considered to be ideal because smaller particles are not cost efficient.
2.2. Technology of Pressure Gradient Induced Particle Transport
To enable efficient heat exchange in the HEX, a counter current regime is advantageous. Therefore, the fluidized bulk material has to be transported horizontally over a longer distance without back mixing. This can be realized by separating the freeboard into isolated chambers by baffles reaching below the level of fluidized powder and building up a pressure gradient from one chamber to the next. Such a countercurrent fluidized bed HEX has already been tested and described abundantly in the context of the sandTES-project [29,31]. The sandTES test loop is a semi-industrial TES working with quartz sand, which is also transported from a cold to a hot hopper, respectively, the other way around. With the sandTES test loop, mechanical transportation devices such as screw conveyors and bucket elevators are required to convey the sand from the hoppers into the HEX, respectively, into the hoppers. That dependence on mechanical conveyers proved to be a significant downside of the sandTES-technology, as those mechanical components cause the need for frequent maintenance and are limiting operating temperature.
Contrary to the sandTES test loop [29] with the FP-TES-concept, there is no need for any mechanical or rotating components to transport the storage medium not only through the HEX but also into and out of the cold and hot storage, both realized as cylindrical hoppers. As may be observed from Figure 1, those hoppers are placed above the endings of the HEX (further called risers), so that they may be completely emptied by means of gravity only. Transport of the bulk material is enabled and controlled by fluidization and pressure gradients applied on top of the hoppers and in the chambers above the HEX. The pressure drop through a fluidized bed with the height h depends on the porosity and material properties:
To stabilize differing bed levels in interconnected fluidized beds, the pressure above the lower level has to be the sum of the pressure at the top of the higher level and the pressure drop caused by a fluidized bed with a high level of difference. It could be assumed that this pressure equilibrium is also valid for the FP-TES and the differing levels in the HEX and the hoppers, but, according to simulations [33,35], there is an addition pressure drop at the edges occurring. The determinant absolute pressures and pressure drops in the FP-TES are depicted in Figure 2. At an equilibrium state, meaning a fully fluidized FP-TES without particle mass flow, the pressure differences along the HEX have to be zero. The resulting pressure equilibrium is expressed in Equation (2):
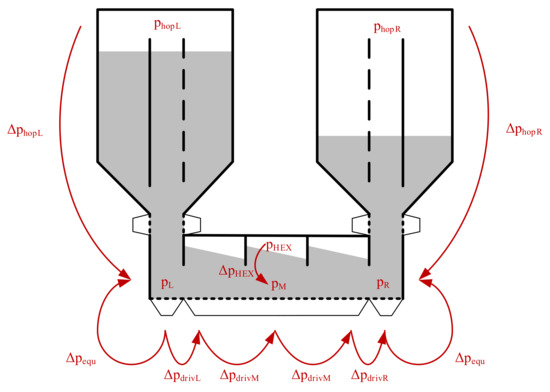
Figure 2.
Absolute pressures and pressure drops in the FP-TES.
A pressure gradient between the top of the hopper and the top of the HEX, differing from this state of equilibrium, will lead to and will therefore cause a mass flow of bulk material out of or into the hopper. The more the mass flow increases, the stronger the pressure gradient deviates from this equilibrium state. Therefore, it can be controlled by applying suitable pressure gradients.
2.3. Hopper Design
In order to minimize the needed air mass flow, only those particles located above the riser area are fluidized (see light gray area in Figure 1), while the majority of the particles is not perfused by air and remains a fixed bed (see the dark gray area in Figure 1). According to the simulations, hanging a pipe in the hopper separating the fluidized from the fixed bed area is necessary to prevent fluidization from collapse. In the course of numerical investigations, various pipe designs were tested. Based on the results shown in [33,34,35], the pipe depicted in Figure 3 was chosen for further investigations. To preserve the possibility to balance the level of the fixed bed outside of the pipe and the fluidized bed inside the pipe, there is a vertical slot over the whole tube on the side facing the HEX. In order to stabilize the fluidized area additionally and to speed up the starting process of the FP-TES, further fluidization of air can be added through a ring-shaped wind-box arranged directly below the hoppers.
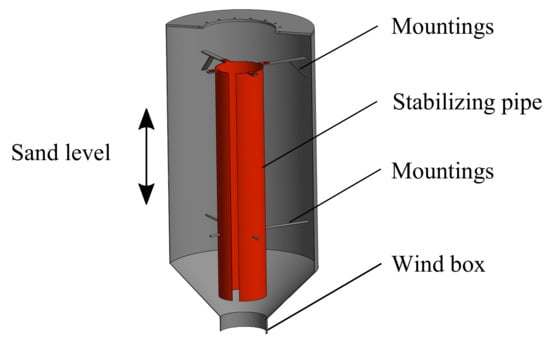
Figure 3.
Stabilizing pipe in the hoppers.
3. FP-TES Cold Test Rig
According to simulation results [33,34,35], transport of particles out of one hopper, through a horizontal HEX and into the other hopper only by fluidization and pressure gradients, as described above, is possible. In order to prove this concept of particle transport, a cold test rig was designed and built, see Figure 4.
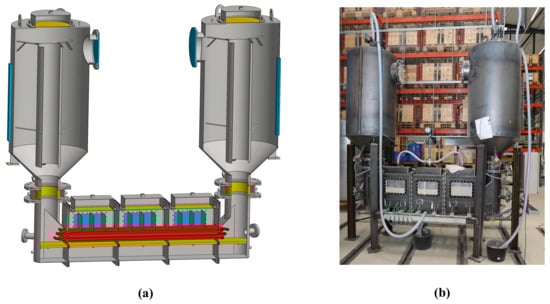
Figure 4.
(a) 3D-CAD sketch and (b) picture of the FP-TES test rig.
The test rig’s hoppers have a diameter of 0.8 m and a height of around 1.4 m. The HEX is divided into three identical segments with a length of 0.5 m. The free-boards of the single HEX segments are separated by baffles, so that applying a pressure gradient from each segment to the next one would be possible. Such pressure gradients along the HEX would be necessary in an industrial FP-TES plant needing a longer HEX for sufficient heat transfer. Considering the high costs of lots of valves needed for an industrial application, there is an aim to segment the HEX in as few sections as possible. In order to prove whether or not the operation of the test rig with a 1.5 m long HEX-section is possible, just one valve is implemented at the HEX, which is allowing pressure compensation between the three separated HEX-sections. Additionally, in every HEX segment, three baffles allowing pressure compensation are installed to prevent back-mixing. The geometry of the baffles results in a free channel cross section of 250 mm × 129 mm. In that channel, a tube bundle with 14 tubes with a diameter of 25 mm in three rows can be placed. In order for the tube bundle to not disturb the particle flow upwards into the hoppers, the tubes are bent at the end of the HEX and enter the FP-TES from the front and the back side. As the FP-TES test rig is working at ambient temperature, it is feasible to integrate large-scale acrylic glass windows enabling watching the particle flow regime.
The fluidization air is entering and leaving the fluidized bed of FP-TES through sheets of sintered metal, which are available with various thicknesses and porosity resulting in various pressure losses. The sinter plates below the fluidized bed have to cause a high pressure drop to guarantee an equal distribution of fluidization air. In contrast to the pressure drop of the sinter plates, the air outlet should be as small as possible because its only function is filtering. The additional injection of fluidization air below the hoppers is realized by sintered tubes.
The most important and difficult issue regarding the measurement is to capture the particle mass flow along the HEX. A particularly precise and reproducible direct measuring method has not been found yet. Therefore, mass flow of sand out of or into a hopper is measured by detecting the sand level in the hopper through a long vertical sight glass and calculating mass increase or decrease with cross-sectional area and bulk density. This simple method is working well because there is a fixed bed in the largest part of the hoppers and the bulk density is well known. In addition, the pressure drop along the height of the hoppers indicates the sand level in the hopper and allows an additional monitoring of the mass flow out of or into each hopper. Figure 5 shows a piping and instrumentation diagram (P&ID) of the test rig. For the static pressure measurements, 38 piezoresistive pressure transducers (P1–38) are used for measurements in a range of 0–1 bar.
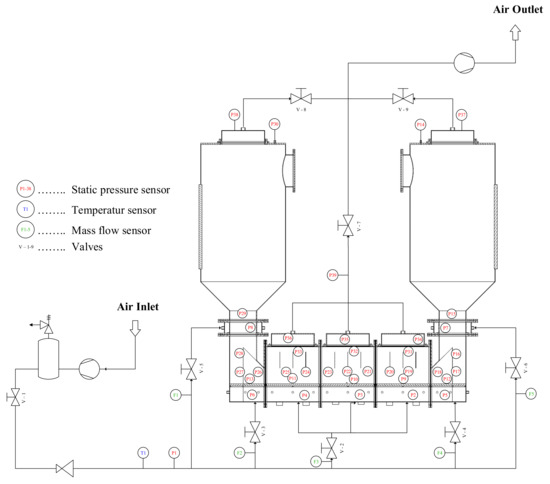
Figure 5.
P&ID of the cold test rig.
The air mass flow is determined by two different kinds of sensors. A thermal flow sensor (F5) with a range of 0.3–197 m/h is used to calibrate four body flow meters (F1–4). To determine the density, a temperature measurement of the working fluid is also required. This is achieved by a thermocouple. Furthermore, three membrane valves are used to control the free board pressures in the test rig (V7–9). They are advantageous for the application in the FP-TES because of the high closing speed and erosion resilience. As the other valves (V2–6) do not have those requirements, ordinary motor-driven proportional valves are used.
4. Experimental Investigations and Results
Some preliminary investigations are performed to determine the fluidization properties of the utilized sand. The minimum fluidization velocity is calculated by the correlation of Geldart and Baeyens [36] and validated in small and simple fluidized bed systems with acrylic glass cylinders. At a fluidization velocity, only slightly higher than the minimum fluidization velocity, a bubbling fluidized bed occurs. The material properties of the used sand are summarized in Table 1. The sphericity was estimated by means of microscopy and literature [37]. Dry air at a temperature of 20 C to 25 C was used for fluidization.

Table 1.
Material properties of the used particles.
The measurements on the test rig were started without a tube bundle in the HEX to validate the simulations [33,34]. However, later on, a dummy tube bundle as it can be seen in Figure 6 is added to the test rig and all measurements were reproduced to compare the results.
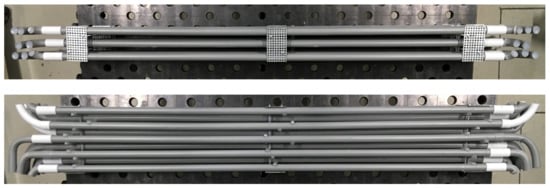
Figure 6.
Dummy tube bundle.
4.1. General Functional Capability and Fluidized Bed Regimes
To determine possible operating conditions with stable particle mass flow, the fluidization grades (FGs) and the valve positions of the control valves (V7–V9) are varied. The fluidization grade is defined as
with the superficial velocity and the minimum fluidization velocity. Moreover, it is the target to keep the FGs as low as possible to minimize auxiliary energy consumption and thermal losses. The ranges of applied FGs during all the presented experiments are summarized in Table 2. The lower limits of the given ranges are the minimum required FGs for stable particle transport. While the FG in the HEX has no influence on the particle transport as long as sufficient fluidization is guaranteed, higher FGs in the riser and at the ring-shaped wind-box directly under the hoppers are facilitating the particle transport especially at higher levels of sand in the hopper, which is filled.
Table 2.
Ranges of applied FGs during the experiments.
The occurring fluidization regimes in the different areas of the FP-TES test rig are observed through the windows. As designated in the FP-TES concept, in the HEX, a bubbling fluidized bed is occurring and the particles outside the stabilizing pipes in the hoppers are staying in a fixed bed. The bubbling bed in the pipe shifts towards a slugging bed at a certain filling height.
By modifying the control valve (V7–V9) positions, stable particle mass flows between 1 and 4.3 kg/s without tube bundle and 1 and 2.5 kg/s with tube bundle are achieved. The lower limit results from the fact that a uniform and stable mass flow is required. Due to low driving pressure gradients, the particle transport is highly fluctuating and undesired back-mixing can occur [35]. Figure 7 shows a picture of the sand level in the test rig at a mass flow close to the maximum value. The incline of the sand level in the HEX gets higher with increasing mass flow. The height of the HEX and length of the baffles are limiting the sand level and its increase and therefore also the maximum mass flow. The sand level for the maximum mass flow with the given geometry and connected HEX-sections using only one valve is depicted in Figure 7 with a red line. The mass flow could be increased by implementing a valve at every HEX-section and building up a pressure gradient from one HEX segment to the next. The resulting sand level at the maximum mass flow with three valves is in Figure 7 marked with blue lines.
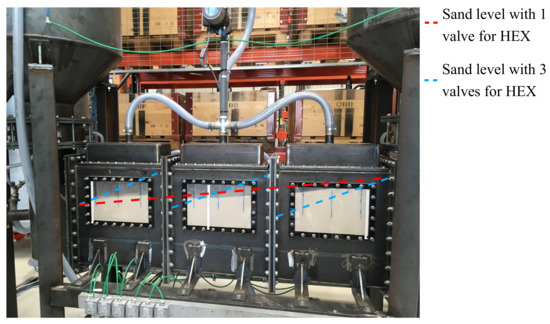
Figure 7.
Picture of the HEX with a particle mass flow from the right to the left close to the upper mass flow limit.
According to numerical investigations [34], stable particle flow out of or into a hopper without a stabilizing bed is not possible caused by the formation of a large bubble above the riser, which is blocking the hopper’s exit. When the bubble develops enough lift, it upraises through the bed and the formation of another bubble is started. To validate this simulation result, the stabilizing pipes were removed from the hoppers for one of the experiments. The transport of the sand was initialized under the same conditions as described above. It was managed to transport the particles from one hopper to the other without stabilizing pipes, but the particle mass flow was very fitful. Through the windows in the hopper, it could be observed that the surface of the bed in the hopper was completely fixed, looking like a fixed bed, for some seconds followed by the breakthrough of a huge bubble whirling up a lot of sand. The bubble was again followed by a period of a fixed surface.
4.2. Conditions for State of Equilibrium
While fluidizing the whole test rig, the pressures at the top of the hoppers and the HEX were set so that there was no sand mass flow out of or into the hoppers. By changing the pressure in the air supply pipe, the FGs were varied to investigate their influence on the state of equilibrium. The pressure differences and absolute pressures at several points of the FP-TES are recorded over approximately 8 min and the pressure drop at the edges for equilibrium is calculated for each time step by using Equation (2). This experiment under equilibrium conditions was replicated with different sand levels in both hoppers. In Figure 8, the absolute pressure signals for a completely sand filled left and an nearly empty right hopper (a) and for both hoppers half-full (b) are depicted. , , and are the measured values at the top of the hoppers and the HEX. , , and are calculated by adding the measured pressure drops along the height of the hoppers, respectively, in the HEX. These values represent absolute pressures on the middle height of the HEX (see Figure 2). The difference between and , respectively , is according to Equation (2) the pressure drop caused by the edge . As can be seen in Figure 8, the pressure drop at the edge is independent of the FGs and the sand level in the hoppers. The averaged value for the pressure drop at the edge for different FGs and all sand levels is 32,176 Pa with a weighted standard deviation of only 3.5%.
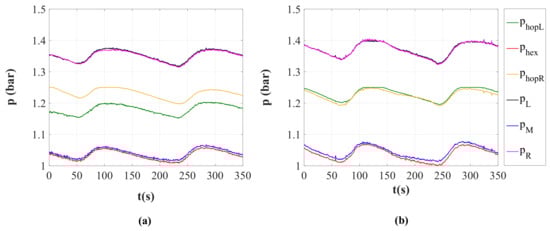
Figure 8.
(a) pressure signals for a completely filled left and a nearly empty right hopper and (b) pressure signals for both hoppers half-full.
4.3. Investigations on Particle Mass Flow
The particle mass flow through the HEX is a decisive factor for the thermal power and the heat transfer of a future industrial application of FP-TES. In principle, there is an influence on the mass flow of the FGs in the riser and the applied pressure differences at the top of the hoppers and the HEX. As the FGs should be set to a minimum, the particle transport has to be controlled by pressure gradients. To force the particle mass flow driving pressure gradients, and are added to the pressure gradient needed for the equilibrium in Equation (2), see Equation (4). Positive values for and will lead to a particle transport from the left hopper to the right one and vice versa:
In addition to the driving pressure gradients at the edges and , Figure 2 also shows driving pressure gradients along the HEX . These pressure gradients turned out to be dispensable at the test rig based on the comparatively short HEX, but they could be applied by implementing a separate valve at every HEX-section, if a higher particle mass flow is desired. The pressure drops at the edges for equilibrium and the driving pressure gradients cannot be measured separately. Moreover, the pressure drops for equilibrium are significantly higher than the driving pressure gradients. Therefore, it is impossible to determine the driving pressure gradient and as they are defined in Equation (4). By definition,
The pressure drops can be eliminated from Equation (4) leading to Equation (6) (the middle part of Equation (4) is skipped). Contrary to and , can be determined by measuring the absolute pressures at the top of the hoppers ( and ) and the pressure drops along the height of the hoppers ( and ):
To describe the dependence of the particle mass flow on the driving pressure gradient, experiments on the particle transport in the cold test rig were performed. For each experiment, the whole sand was transported from one hopper to the other one. The investigations on the mass flow were carried out with FGs in the lower region of the ranges given in Table 2. At the end of the transport process, the FGs of the hopper, which is filled, were increased to hold the mass flow constant despite the high sand level in the hopper. The obtained correlations of mass flow and driving pressure gradients for the particle transport with and without a tube bundle are presented in Figure 9. For better comparability, the mass flux, which is the mass flow related to the free cross-sectional area of the HEX, is depicted.
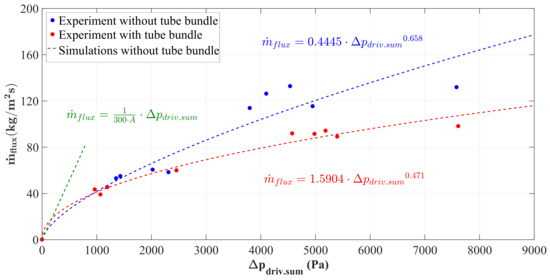
Figure 9.
Mass flux of the storage material with and without the tube bundle.
For the regression of the measured data points, a power function was chosen, based on analytic considerations. Taking into account that a fluidized bed is behaving similarly to a fluid, the particle transport through the HEX can be compared with a fluid flow through a pipe. Thereby, the driving pressure gradient is corresponding to the pressure drop of the pipe, which is proportional to the square of the flow velocity. Therefore, the obtained regression functions revealing a power function with an exponent of around 0.5 are plausible. The mass flux at implemented tube bundle is lower because the tubes are causing an additional flow resistance. The correlation for the particle mass flow obtained by numerical investigations without a tube bundle [34] divided by the cross-sectional area of the HEX A is depicted in Figure 9 in green. As it can be seen, the needed driving pressure gradients in the simulations are lower than in the experiments. This may result from the fact that the highly complex and dynamic particle and air flow at the edges is not sufficiently resolved high enough in the numerical simulations.
In case of an industrial application, a longer HEX with several separated HEX chambers would be needed for sufficient heat exchange. From each HEX chamber to the next one, a driving pressure gradient, , in Figure 2, has to be applied. This is leading to higher driving pressure gradients with increasing HEX length to achieve the same particle mass flow. To separate the driving pressure gradient , the pressure difference between the measuring point P24 and P20 (see Figure 5), which have a horizontal distance of 0.8 m, is examined. The measured values are in a range from 200 to 1000 Pa, but expressing a correlation between the pressure difference along the HEX and the particle mass flow is not possible because the HEX in the test rig is too short and the influence of the edges is too intense. The sandTES pilot plant [29,30,31] is including a longer HEX working with the identical particle transport mechanism and a slightly different tube bundle geometry. In this case, a dependence of the needed driving pressure gradients related on the length of the HEX l on particle mass flux and the FGs was found by doing multiple stationary backlog measurements for several operating points [38]. Under the consideration of Equation (1), a regression of the mean value was carried out leading to the empirical correlation
The proposed equation is validated for a FG range of 3.7 and 5.5, which is slightly different from the FGs in the HEX of the FP-TES shown in Table 2. However, it can be seen that the influence of the FG is low and the received values for the pressure difference along the HEX using Equation (7) match the measured values. Therefore, Equation (7) is used to estimate the particle mass flux depending not only on but also the HEX length l. Using the regression function obtained in Figure 9 for experiments with tube bundle and Equation (7) leads to
In Figure 10, the received correlation for the particle mass flux depending on the driving pressure gradient is depicted for different HEX lengths. The regression function obtained for experiments with tube bundle and the 1.5 m long HEX of the test rig as well as the measured data are depicted in red.
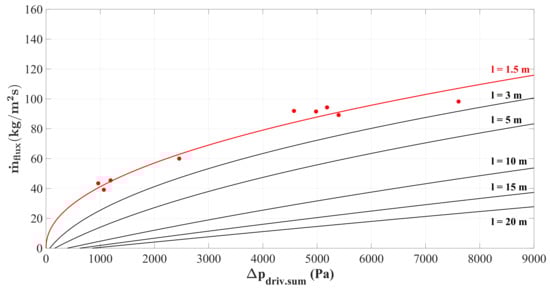
Figure 10.
Mass flux for different HEX lengths.
4.4. Startup and Changeover
To investigate the flexibility of the FP-TES, experiments on the startup and change over (CO) procedure were performed. To start the FP-TES up, the whole sand inventory must be lifted. Thereby, the highest absolute pressures and pressures drops compared to all other operating modes occur. The startup is finished as soon as the fluidized bed is fully developed in the whole FP-TES. To perform a CO from charging to discharging respectively the other way around, the flow direction of the particles must be reversed. Therefore, the opening positions of the valves at the top of the hoppers were changed to reverse the driving pressure gradients. To identify the needed time for startup and CO, the course of the pressure drops through the hoppers are observed. Under fully fluidized conditions, a higher pressure drop through the hopper is corresponding to a higher sand level in the hopper. A rising pressure drop through one hopper with simultaneously decreasing pressure drop through the other hopper indicates a particle mass flow.
The experiment presented in Figure 11 was started with a nearly full left hopper and an empty right hopper. By means of pressure drop courses, one can see that the particle transport started around 150 seconds after activating the fluidization. After a transport period with a mass flow of 1.43 kg/s, a CO was initiated at second 674. The particle transport from the right hopper to the left one started at around second 730. In Figure 11, one can identify the startup time of approximately 150 s and the CO time of around 56 s. The startup and CO time are independent of the applied particle mass flow, but it is expected that the start up would take somewhat longer if a higher hopper is installed.
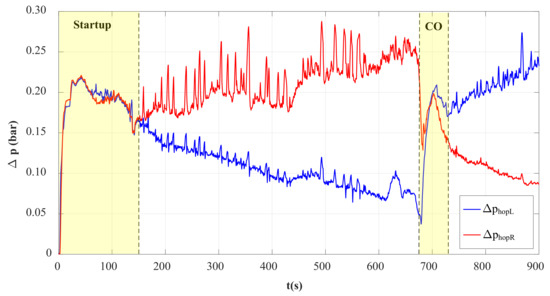
Figure 11.
Pressure drop through the hoppers during startup, particle transport, and CO.
5. Discussion and Industrial Application
Based on the results of the investigations on the FP-TES, a few conclusions for an industrial application can be made. To reveal an increased storage capacity and realistic charging and discharging time, the hoppers are scaled up to a cylindrical height of 2 m and a diameter of 3.5 m. The cross-sectional area of the HEX and therefore also range of the particle mass flow is still kept the same as in the experiments, but the length of the HEX has to be extended to approximately 10 to 15 m to guarantee sufficient heat transfer. For the energetic calculations, the usage of corundum powder, which offers a higher energy density, leading to increased storage capacity and thermal power, is also considered. To estimate the energetic efficiency, the major losses are determined.
- The thermal losses caused by cooling down of the storage material during the storage period are minimized by thermal isolation and the isolating effect of the storage material itself [34].
- The thermal losses caused by the fluidization air leaving the FP-TES at high temperature are minimized by recuperation.
- The auxiliary energy demand for blowers to provide the fluidization air is dependent on the needed air mass flow, which is, at a low level, caused by low FGs and the pressure ratio. For quartz sand, the obtained maximum needed pressure ratio of 1.4 in the test rig is increased to 1.7 to cover the higher hopper. For corundum powder, the expected pressure drop is higher, caused by its higher density.
The results of the energetic considerations are summarized in Table 3. Caused by the longer operating time of the blower, the efficiency decreases with increasing charging or discharging time. The assumptions made and the efficiency calculation are further described in [35].
Table 3.
Energetic consideration of an exemplary application working with corundum powder or quartz sand.
Figure 12 shows a Sankey diagram to illustrate the energy balance of the system. The values are related to the use of quartz sand and a charging/discharging time of 10.3 h as this leads to higher losses compared to the shorter duration of 2.3 h.
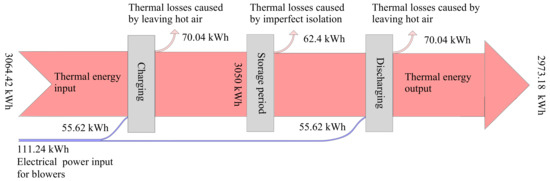
Figure 12.
Sankey diagram for an industrial application.
Another important part for an industrial application is the survivability of the novel energy system. As early studies discovered that the erosion damage correlates with particle kinetic energy [39] and is therefore highly dependent on the velocity, no erosion effects are expected in the HEX due to low FGs [40,41]. However, erosion should be taken into account when using corundum powder, which is usually utilized as an abrasive.
A future option would be the utilization of encapsulated phase change material as a storage medium or to use the FP-TES technology as a thermochemical storage. Contrary to quartz sand or corundum powder, materials for phase change and thermochemical storage suffer in general under attrition issues. The application of fluidized bed reactors for thermochemical reactions is successfully demonstrated in [42]. However, it must be ensured that any material utilized in FP-TES provides enough mechanical stability to resist the applied FGs of 7 up to 14 in the riser.
6. Conclusions
To demonstrate the functionality of FP-TES, a novel sensible TES system working with bulk material, a cold test rig was built. The performed experiments show that a complete substitution of mechanical transport devices by advanced fluidization technology and driving pressure gradients is possible. To cover real industrial application as close as possible to the use of the cold test rig, a dummy tube bundle is implemented, and the results are compared to the experiments without a tube bundle. By varying the applied FGs and the pressures at the air outlets, the range of possible operating conditions is determined. With the given geometry of the test rig and using one valve for the whole HEX, stable particle mass fluxes between 50 kg/m s and 140 kg/m s without a tube bundle and 40 kg/m s up to 100 kg/m s with a tube bundle are achieved. The mass flux could be increased by the implementation of more valves or an adapted tube bundle geometry. The requirements for an equilibrium state with stable sand levels in the hoppers and the HEX are investigated and an unexpected pressure drop at the edges is found. This pressure drop is independent of the FGs and hopper sand levels, which is discovered by the use of multiple static pressure sensors. Furthermore, the experiments showed a power-dependence relation with an exponent of approximately 0.5 between the driving pressure gradients and the mass flux. Moreover, the startup and CO process of the FP-TES is also investigated. The experiments prove that the new storage concept is really flexible with a startup duration of approximately 150 s. The CO from charging to discharging respectively the other way around, which is managed by changing the flow direction of the sand, can be achieved in roughly a third of the time. Furthermore, these experiments and the correlation between mass flux and driving pressure gradients can be used for the development of a control algorithm which is key to utilizing the FP-TES concept in an industrial environment.
Author Contributions
Conceptualization, V.S., D.W., and H.W.; methodology, V.S., D.W., and H.W.; validation, V.S. and D.W.; investigation, V.S., D.W., and H.W.; resources, M.H.; writing—original draft preparation, V.S.; writing—review and editing, D.W. and H.W.; visualization, V.S.; supervision, H.W.; project administration, H.W. and M.H.; funding acquisition, H.W., M.H., and V.S. All authors have read and agreed to the published version of the manuscript.
Funding
The authors would like to thank the FFG—Austrian Research Promotion Agency (FFG project No. 858916) and the Austrian Wirtschaftsservice (prototype funding project No. P1621702) for the financial support and funding of the conducted research work. The authors acknowledge TU Wien University Library for financial support through its Open Access Funding Programme.
Acknowledgments
Open Access Funding by TU Wien.
Conflicts of Interest
The authors declare no conflict of interest.
Abbreviations
The following abbreviations are used in this manuscript:
| Acronyms | |
| CO | Changeover |
| EU | European Union |
| FG | Fluidization Grade |
| FP-TES | Fluidization Based Particle Thermal Energy Storage |
| HEX | Heat Exchanger |
| P2H | Power to Heat |
| P2H2P | Power to Heat to Power |
| Latin Symbols | |
| A | Cross-Sectional Area HEX, () |
| g | Gravitational Acceleration, () |
| h | Height, (m) |
| l | Length HEX, (m) |
| Mass Flux, () | |
| p | Pressure, () |
| t | Time, (s) |
| Greek Symbols | |
| Pressure Difference, () | |
| Density, () | |
| Porosity, (−) | |
| Indices | |
| Driving | |
| Equilibrium | |
| g | Gas |
| h | Height |
| Heat Exchanger | |
| Hopper | |
| L | Left |
| M | Middle |
| p | Particle |
| R | Right |
| Summarized | |
References
- United Nations Framework Conventionon Climate Change (UNFCCC). Report of the Conference of the Parties on Its Fifteenth Session, Held in Copenhagen from 7 to 19 December 2009; FCCC/CP/2009/11/Add. 1; UNFCCC: Bonn, Germany, 2010. [Google Scholar]
- European Commission. Communication from the Commission to the European Parliament, the Council, the European Economic and Social Committee and the Committee of the Regions, Roadmap for Moving to a Competitive Low Carbon Economy in 2050; European Commission: Brussels, Belgium, 2011. [Google Scholar]
- International Energy Agency. Market Report Series: Renewables 2018; International Energy Agency: Paris, France, 2018. [Google Scholar]
- Unterluggauer, J.; Doujak, E.; Bauer, C. Fatigue Analysis of a Prototype Francis-Turbine based on strain gauge measurements. WasserWirtschaft Extra 2019, S1, 66–71. [Google Scholar] [CrossRef]
- Ruppert, L. Pumped-Storage Implementation in Order to Balance Volatile Renewable Energy Generation. Ph.D. Thesis, TU Wien, Wien, Austria, 2017. [Google Scholar]
- Arias, M.E.; Cochrane, T.A.; Kummu, M.; Lauri, H.; Holtgrieve, G.W.; Koponen, J.; Piman, T. Impacts of hydropower and climate change on drivers of ecological productivity of Southeast Asia’s most important wetland. Ecol. Model. 2014, 272, 252–263. [Google Scholar] [CrossRef]
- Argyrou, M.C.; Christodoulides, P.; Kalogirou, S.A. Energy storage for electricity generation and related processes: Technologies appraisal and grid scale applications. Renew. Sustain. Energy Rev. 2018, 94, 804–821. [Google Scholar] [CrossRef]
- Chen, H.; Cong, T.N.; Yang, W.; Tan, C.; Li, Y.; Ding, Y. Progress in electrical energy storage system: A critical review. Prog. Nat. Sci. 2009, 19, 291–312. [Google Scholar] [CrossRef]
- Ralon, P.; Taylor, M.; Ilas, A.; Diaz-Bone, H.; Kairies, K. Electricity Storage and Renewables: Costs and Markets to 2030; International Renewable Energy Agency: Abu Dhabi, UAE, 2017. [Google Scholar]
- EU. Directive (EU) 2018/2001 of the European Parliament and of the Council of 11 December 2018 Amending Directive 2012/27/EU on Energy Efficency; PE/54/2018/REV/1; EU: Brussels, Belgium, 21 December 2018; Volume OJ L 328, pp. 210–230. [Google Scholar]
- Zhang, N.; Yuan, Y.; Cao, X.; Du, Y.; Zhang, Z.; Gui, Y. Latent heat thermal energy storage systems with solid–liquid phase change materials: A review. Adv. Eng. Mater. 2018, 20, 1700753. [Google Scholar] [CrossRef]
- Cascetta, M.; Serra, F.; Arena, S.; Casti, E.; Cau, G.; Puddu, P. Experimental and numerical research activity on a packed bed TES system. Energies 2016, 9, 758. [Google Scholar] [CrossRef]
- Huber, C.; Setoodeh Jahromy, S.; Jordan, C.; Schreiner, M.; Harasek, M.; Werner, A.; Winter, F. Boric Acid: A High Potential Candidate for Thermochemical Energy Storage. Energies 2019, 12, 1086. [Google Scholar] [CrossRef]
- Alva, G.; Lin, Y.; Fang, G. An overview of thermal energy storage systems. Energy 2018, 144, 341–378. [Google Scholar] [CrossRef]
- Alnaimat, F.; Rashid, Y. Thermal Energy Storage in Solar Power Plants: A Review of the Materials, Associated Limitations, and Proposed Solutions. Energies 2019, 12, 4164. [Google Scholar] [CrossRef]
- Frazzica, A. Recent Advancements in Materials and Systems for Thermal Energy Storage; Springer: Heidelberg, Germany, 2018. [Google Scholar]
- Calderón, A.; Barreneche, C.; Palacios, A.; Segarra, M.; Prieto, C.; Rodriguez-Sanchez, A.; Fernández, A.I. Review of solid particle materials for heat transfer fluid and thermal energy storage in solar thermal power plants. Energy Storage 2019, 1, e63. [Google Scholar] [CrossRef]
- Segarra, M.; Barreneche, C.; Calderón, A.; Fernández, A.I. Materials Selection for Thermal Energy Storage Applications—Case Studies. In Recent Advancements in Materials and Systems for Thermal Energy Storage; Springer: Heidelberg, Germany, 2019; pp. 55–66. [Google Scholar]
- Diago, M.; Iniesta, A.C.; Soum-Glaude, A.; Calvet, N. Characterization of desert sand to be used as a high-temperature thermal energy storage medium in particle solar receiver technology. Appl. Energy 2018, 216, 402–413. [Google Scholar] [CrossRef]
- Yang, W.C. Handbook of Fluidization and Fluid-Particle Systems; CRC Press: Cleveland, OH, USA, 2003. [Google Scholar]
- Sakadjian, B.; Hu, S.; Maryamchik, M.; Flynn, T.; Santelmann, K.; Ma, Z. Fluidized-bed technology enabling the integration of high temperature solar receiver CSP systems with steam and advanced power cycles. Energy Procedia 2015, 69. [Google Scholar] [CrossRef]
- Ho, C.K.; Iverson, B.D. Review of high-temperature central receiver designs for concentrating solar power. Renew. Sustain. Energy Rev. 2014, 29, 835–846. [Google Scholar] [CrossRef]
- Rovense, F.; Reyes-Belmonte, M.; González-Aguilar, J.; Amelio, M.; Bova, S.; Romero, M. Flexible electricity dispatch for CSP plant using un-fired closed air Brayton cycle with particles based thermal energy storage system. Energy 2019, 173, 971–984. [Google Scholar] [CrossRef]
- Gomez-Garcia, F.; Gauthier, D.; Flamant, G. Design and performance of a multistage fluidised bed heat exchanger for particle-receiver solar power plants with storage. Appl. Energy 2017, 190, 510–523. [Google Scholar] [CrossRef]
- Schwaiger, K.; Haider, M.; Steiner, P.; Wünsch, D. Fluidized Bed Facility and Method for Conveying a Solid Bulk Product. World Patent No. WO2020097657A1, 22 May 2020. [Google Scholar]
- Woods, J.; Thorpe, R.; Johnson, S. Horizontal pneumatic conveying from a fluidized bed. Chem. Eng. Sci. 2008, 63, 1741–1760. [Google Scholar] [CrossRef]
- Zhang, H.; Kong, W.; Tan, T.; Gilles, F.; Baeyens, J. Experiments support an improved model for particle transport in fluidized beds. Sci. Rep. 2017, 7, 1–10. [Google Scholar] [CrossRef]
- Ogata, K.; Furukawa, T.; Yamamoto, Y. Fluidized powder conveying in a horizontal rectangular channel using fluidizing air. Adv. Powder Technol. 2012, 23, 761–770. [Google Scholar] [CrossRef]
- Steiner, P.; Schwaiger, K.; Walter, H.; Haider, M. Active fluidized bed technology used for thermal energy storage. In Proceedings of the ASME 2016 10th International Conference on Energy Sustainability Collocated with the ASME 2016 Power Conference and the ASME 2016 14th International Conference on Fuel Cell Science, Engineering and Technology, American Society of Mechanical Engineers Digital Collection, Charlotte, NC, USA, 26–30 June 2016. [Google Scholar]
- Eisl, R.; Haider, M.; Holzleithner, F. Heat Storage System. World Patent No. WO2012027769A3, 26 October 2012. [Google Scholar]
- Schwaiger, K. Development of a Novel Particle Reactor/Heat-Exchanger for Thermal Energy Storage. Ph.D. Thesis, TU Wien, Wien, Austria, 2016. [Google Scholar]
- Steiner, P.; Schwaiger, K.; Walter, H.; Haider, M.; Hämmerle, M. Fluidized bed particle heat exchanger for supercritical carbon dioxide power cycles. In Proceedings of the ASME 2016 International Mechanical Engineering Congress and Exposition, American Society of Mechanical Engineers Digital Collection, Phoenix, AZ, USA, 13–16 November 2016. [Google Scholar]
- Wünsch, D. Advanced Regenerator: A Countercurrent Fluidized Bed Regenerator Utilizing a Pressure Gradient for Powder Transport. Master’s Thesis, TU Wien, Wien, Austria, 2016. [Google Scholar]
- Wünsch, D.; Sulzgruber, V.; Haider, M.; Walter, H. FP-TES: A Fluidization Based Particle Thermal Energy Stotage, Part I: Numerical Investigations. Energies 2020, submitted. [Google Scholar]
- Sulzgruber, V.; Wünsch, D.; Haider, M.; Walter, H. Numerical Investigations on the Flow Behavior of a novel Fluidization Based Particle Thermal Energy Storage. Energy 2020. [Google Scholar] [CrossRef]
- Rhodes, M.J. Introduction to Particle Technology; John Wiley & Sons: Hoboken, NJ, USA, 2008. [Google Scholar]
- Cho, G.C.; Dodds, J.; Santamarina, J.C. Particle shape effects on packing density, stiffness, and strength: Natural and crushed sands. J. Geotech. Geoenviron. Eng. 2006, 132, 591–602. [Google Scholar] [CrossRef]
- Steiner, P. Experimental Investigations and Application Analysis of a Particle-Based High Temperature Thermal Energy Storage. Ph.D. Thesis, TU Wien, Wien, Austria, 2017. [Google Scholar]
- Stringer, J.; Wright, I. Materials issues in fluidized bed combustion. J. Mater. Energy Syst. 1986, 8, 319–331. [Google Scholar] [CrossRef]
- Wiman, J.; Almstedt, A.E. Hydrodynamics, erosion and heat transfer in a pressurized fluidized bed: Influence of pressure, fluidization velocity, particle size and tube bank geometry. Chem. Eng. Sci. 1997, 52, 2677–2695. [Google Scholar] [CrossRef]
- Rautenbach, R.; Katz, T. Survey of long time behavior and costs of industrial fluidized bed heat exchangers. Desalination 1997, 108, 335–344. [Google Scholar] [CrossRef]
- Angerer, M.; Becker, M.; Härzschel, S.; Kröper, K.; Gleis, S.; Vandersickel, A.; Spliethoff, H. Design of a MW-scale thermo-chemical energy storage reactor. Energy Rep. 2018, 4, 507–519. [Google Scholar] [CrossRef]


© 2020 by the authors. Licensee MDPI, Basel, Switzerland. This article is an open access article distributed under the terms and conditions of the Creative Commons Attribution (CC BY) license (http://creativecommons.org/licenses/by/4.0/).