Data Augmentation for Electricity Theft Detection Using Conditional Variational Auto-Encoder


Abstract
1. Introduction
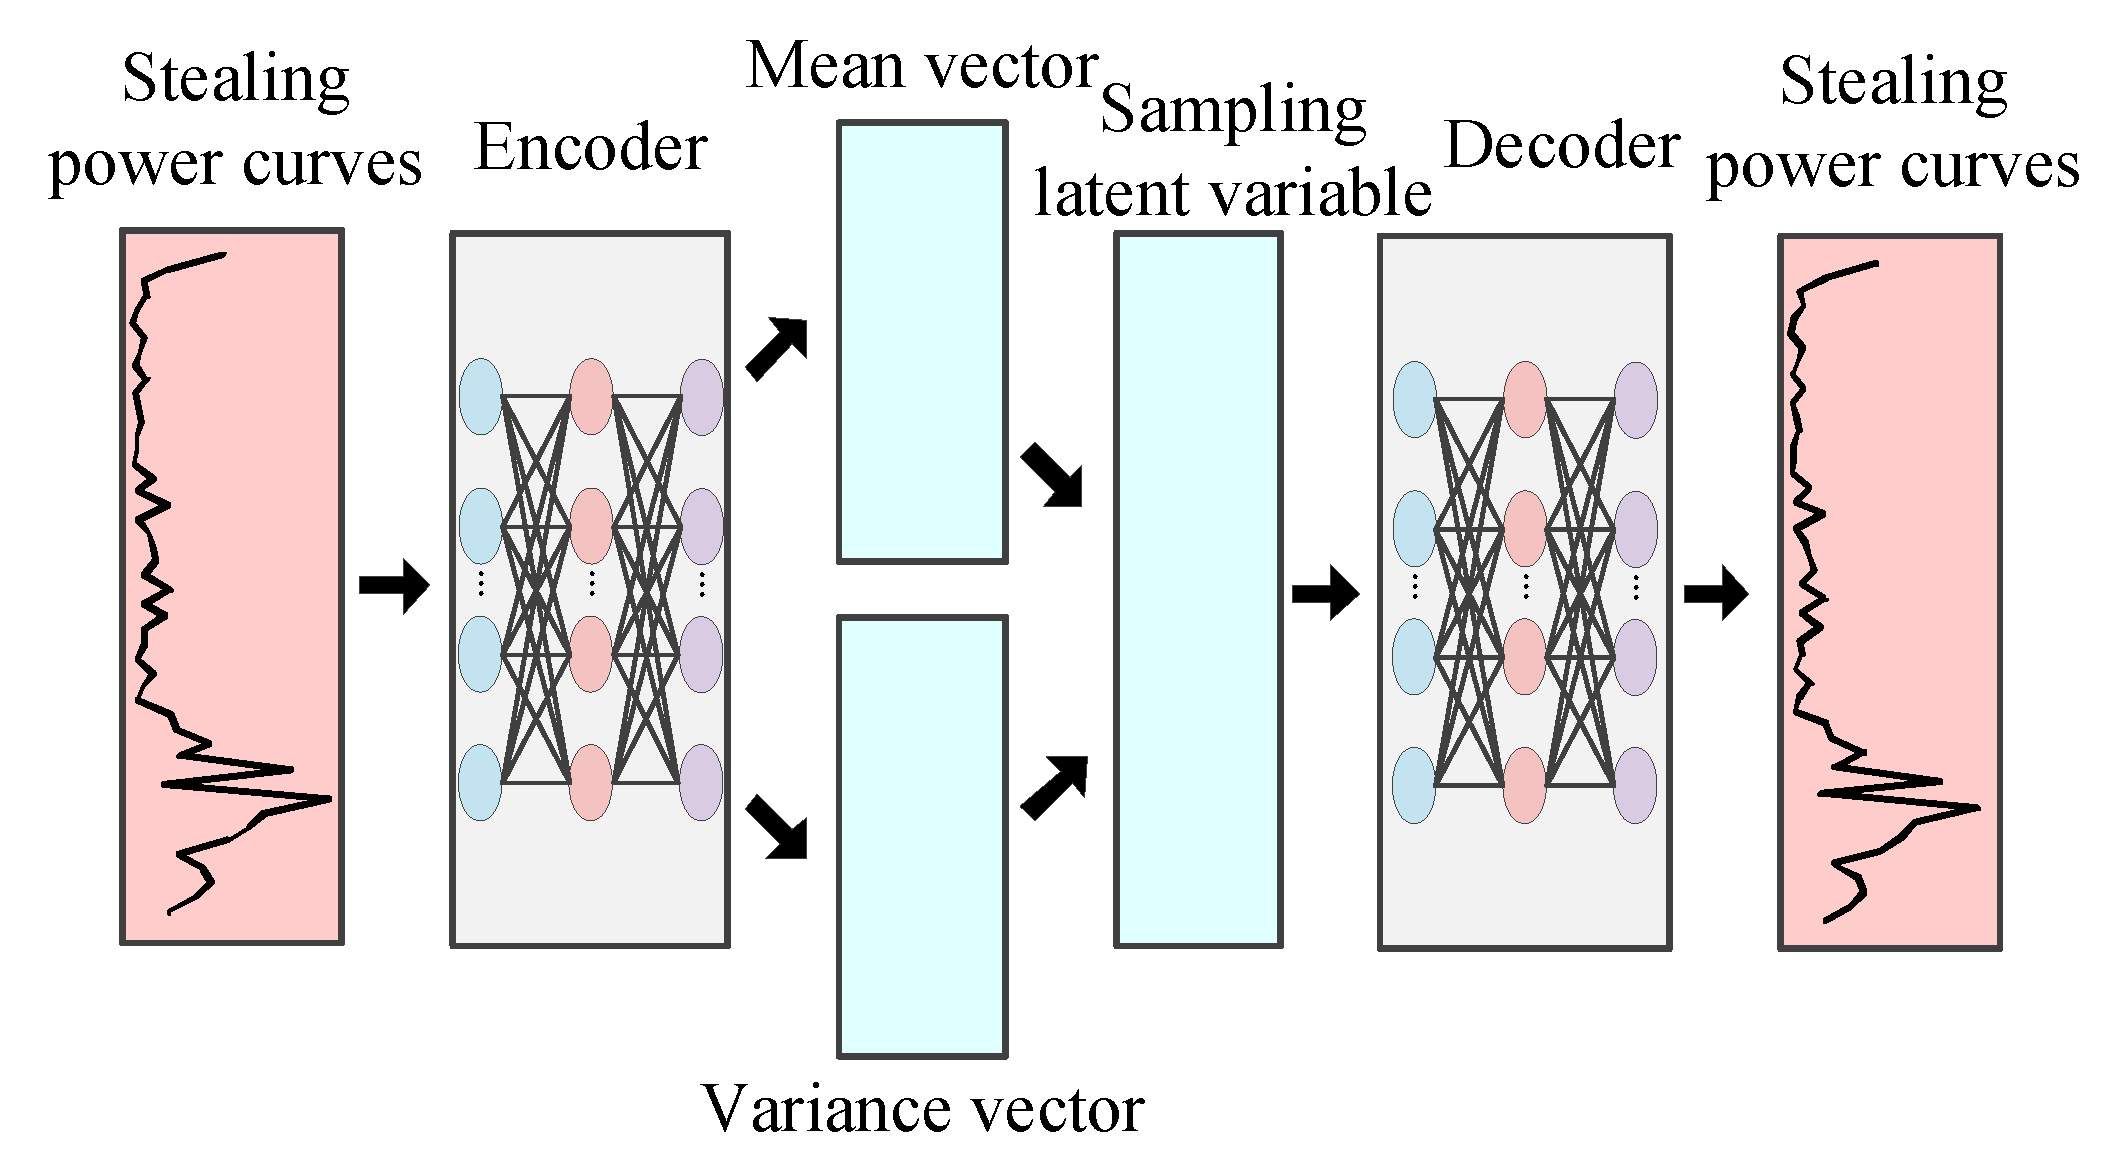
- The CVAE proposed has strong generalization ability and can generate many stealing power curves similar to that from the test set through unsupervised learning. As long as Gaussian noises are input to the decoder of CVAE, any number of samples of stealing power curves can be generated to train the deep neural network.
- Compared with ROS and SMOTE, the samples generated by CVAE not only have diversity, but also capture the probability distribution characteristics of stealing power curves. In addition, the training process of CVAE is more stable than that of CGAN and can generate new samples with higher quality.
- After data augmentation for the training set by CVAE, the detection accuracy of deep neural network can be significantly improved, and it is suitable for different classifiers.
2. Conditional Variational Auto-Encoder for Data Augmentation
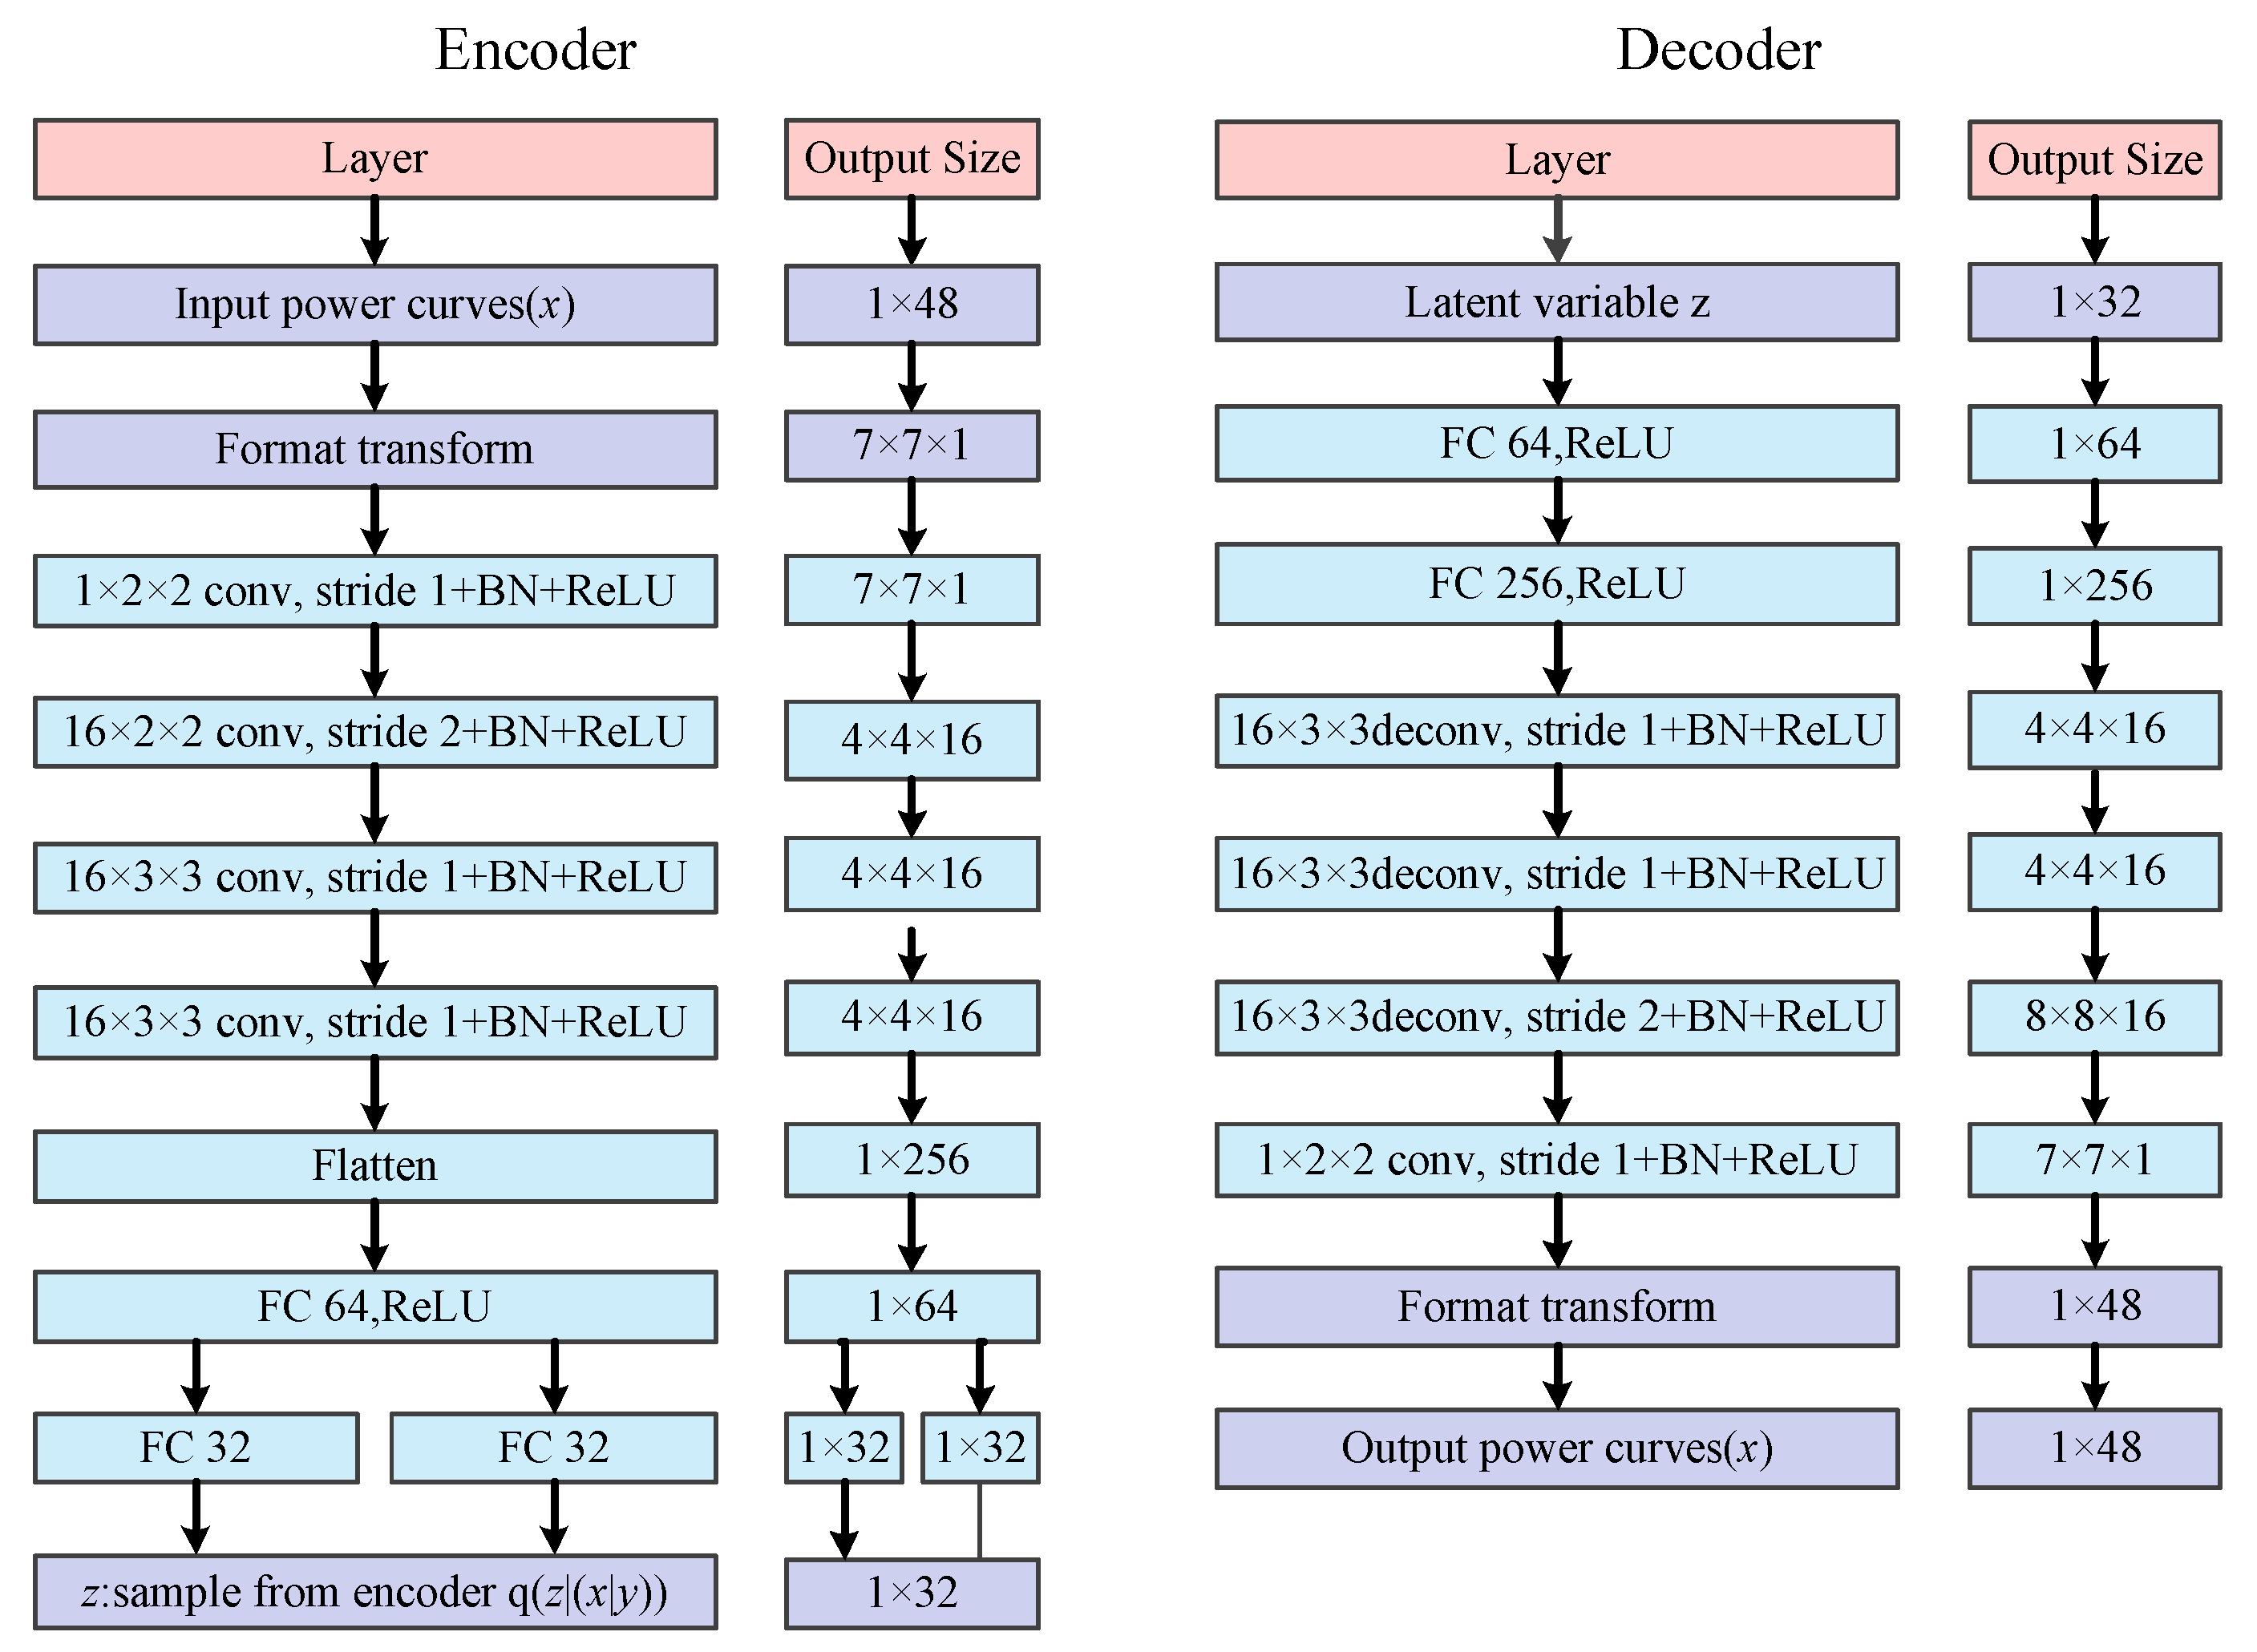
2.1. Conditional Variational Auto-Encoder
2.2. Data Augmentation for Stealing Power Curves
3. Electricity Theft Detection Based on Data Augmentation
3.1. Attack Models for Generation of Stealing Power Curves
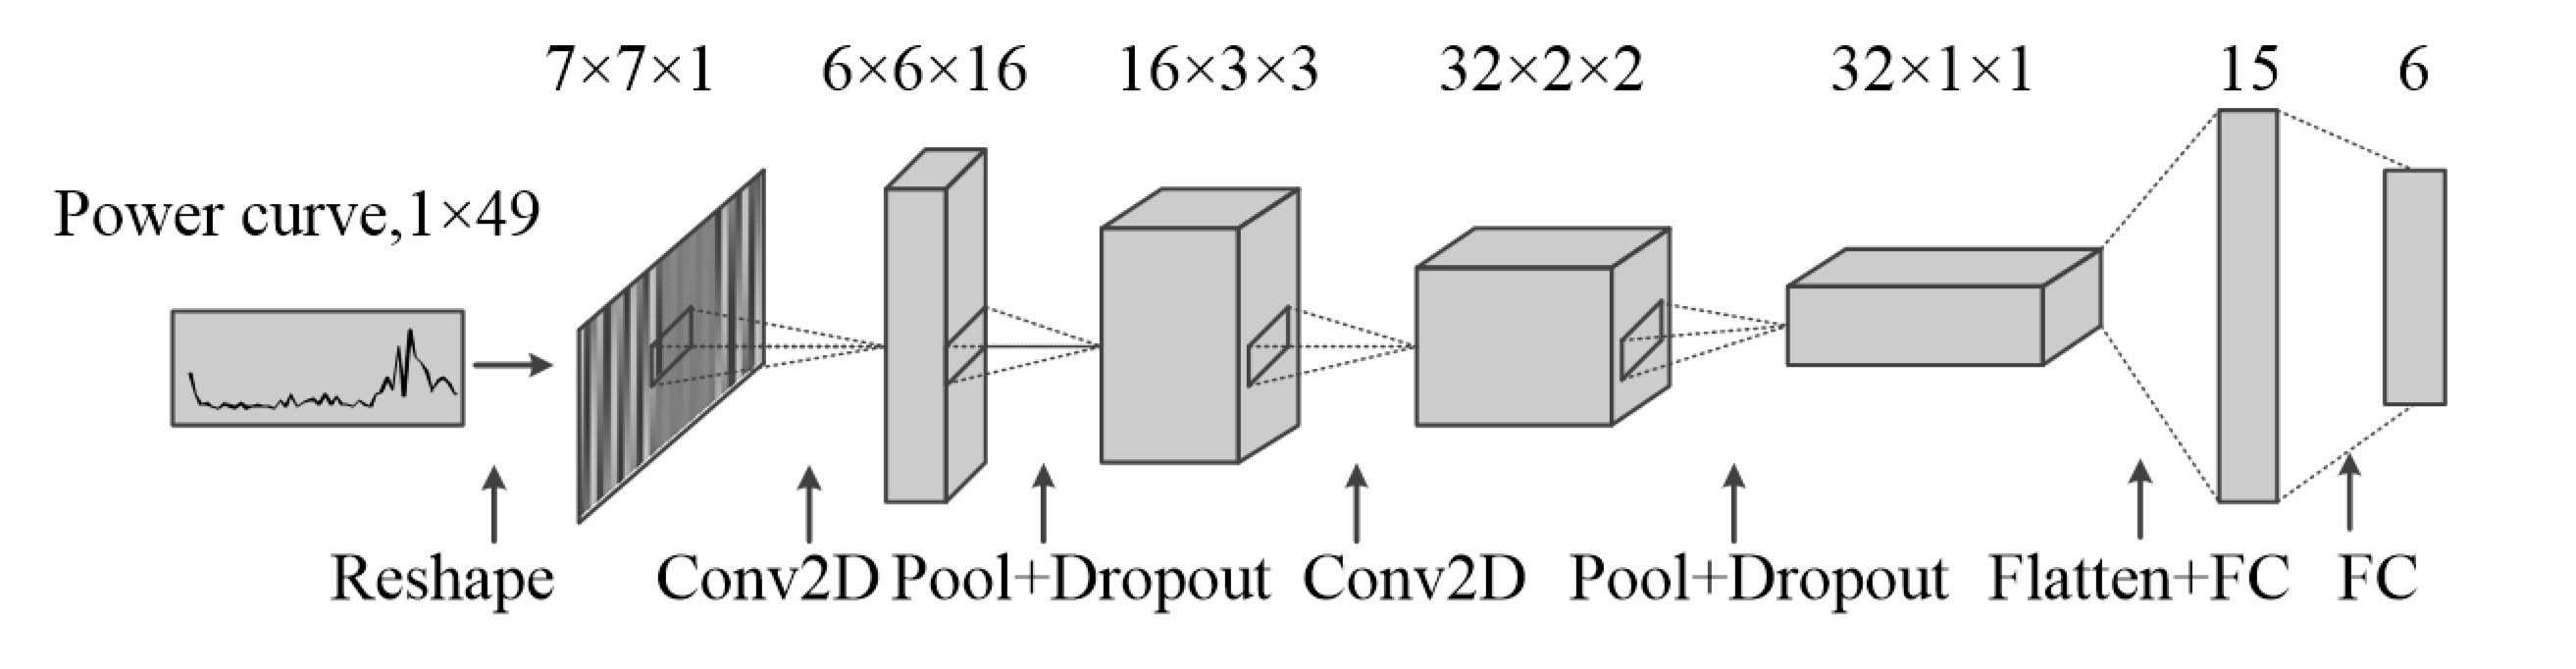
3.2. Electricity Theft Detection Based on CNN
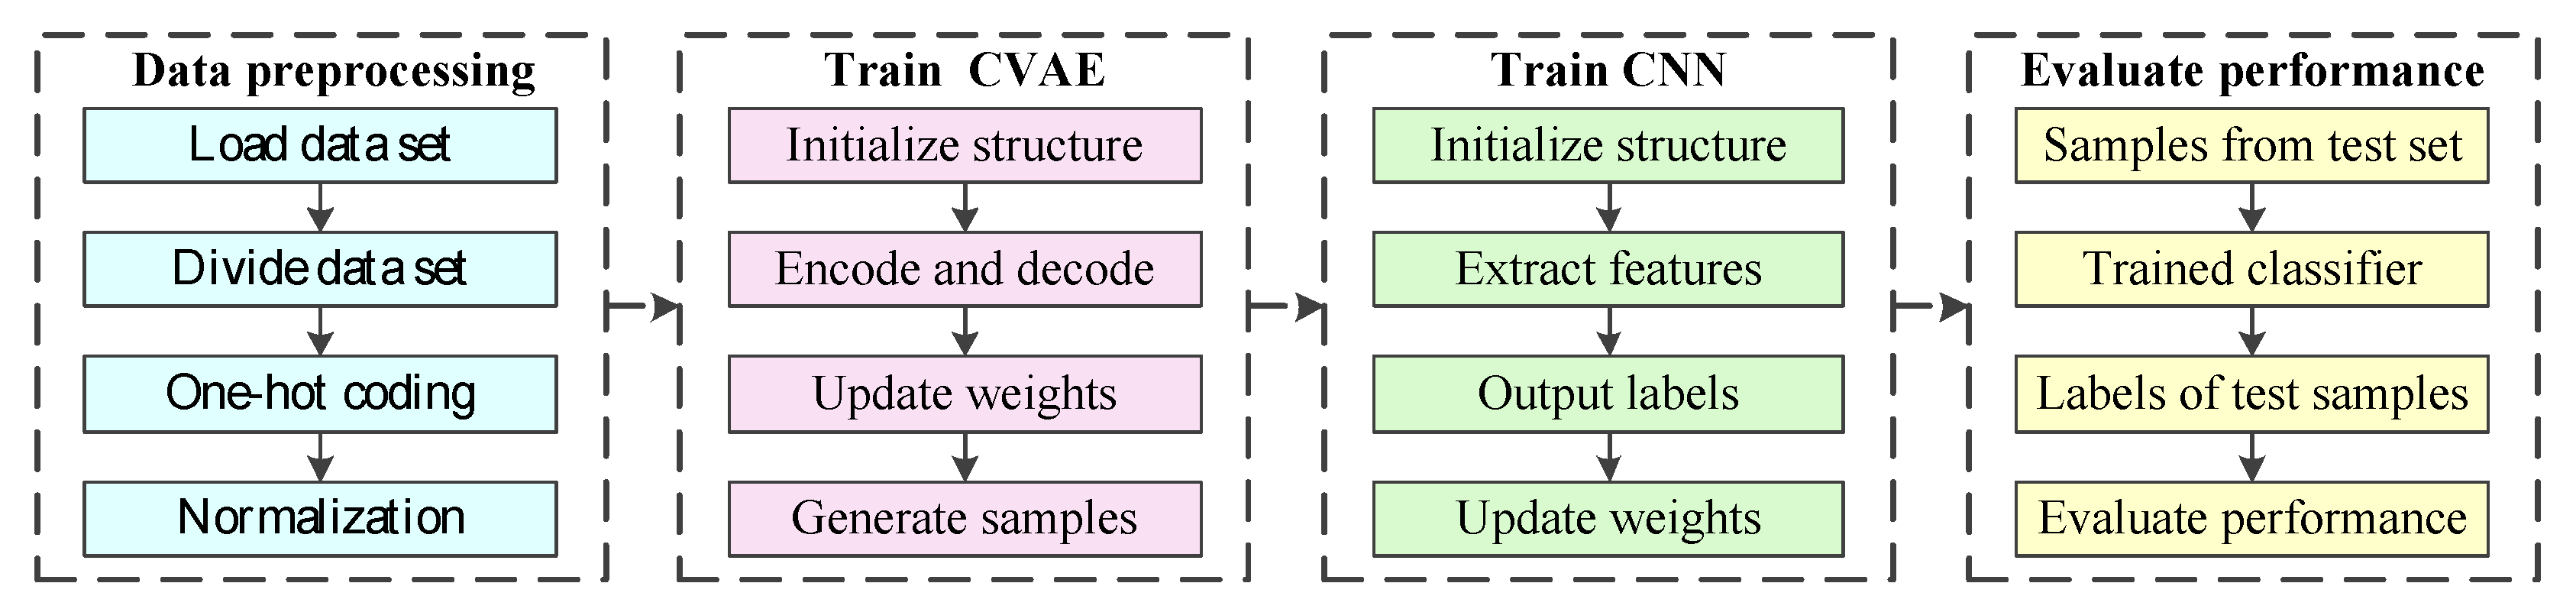
3.3. The Process of the Proposed Methods
4. Case Study
4.1. Data Description
4.2. Performance of CVAE
4.3. Performance Comparison of Different Methods for Data Augmentation
4.4. Adaptability Analysis of CVAE
5. Discussion
6. Conclusions
- (1).
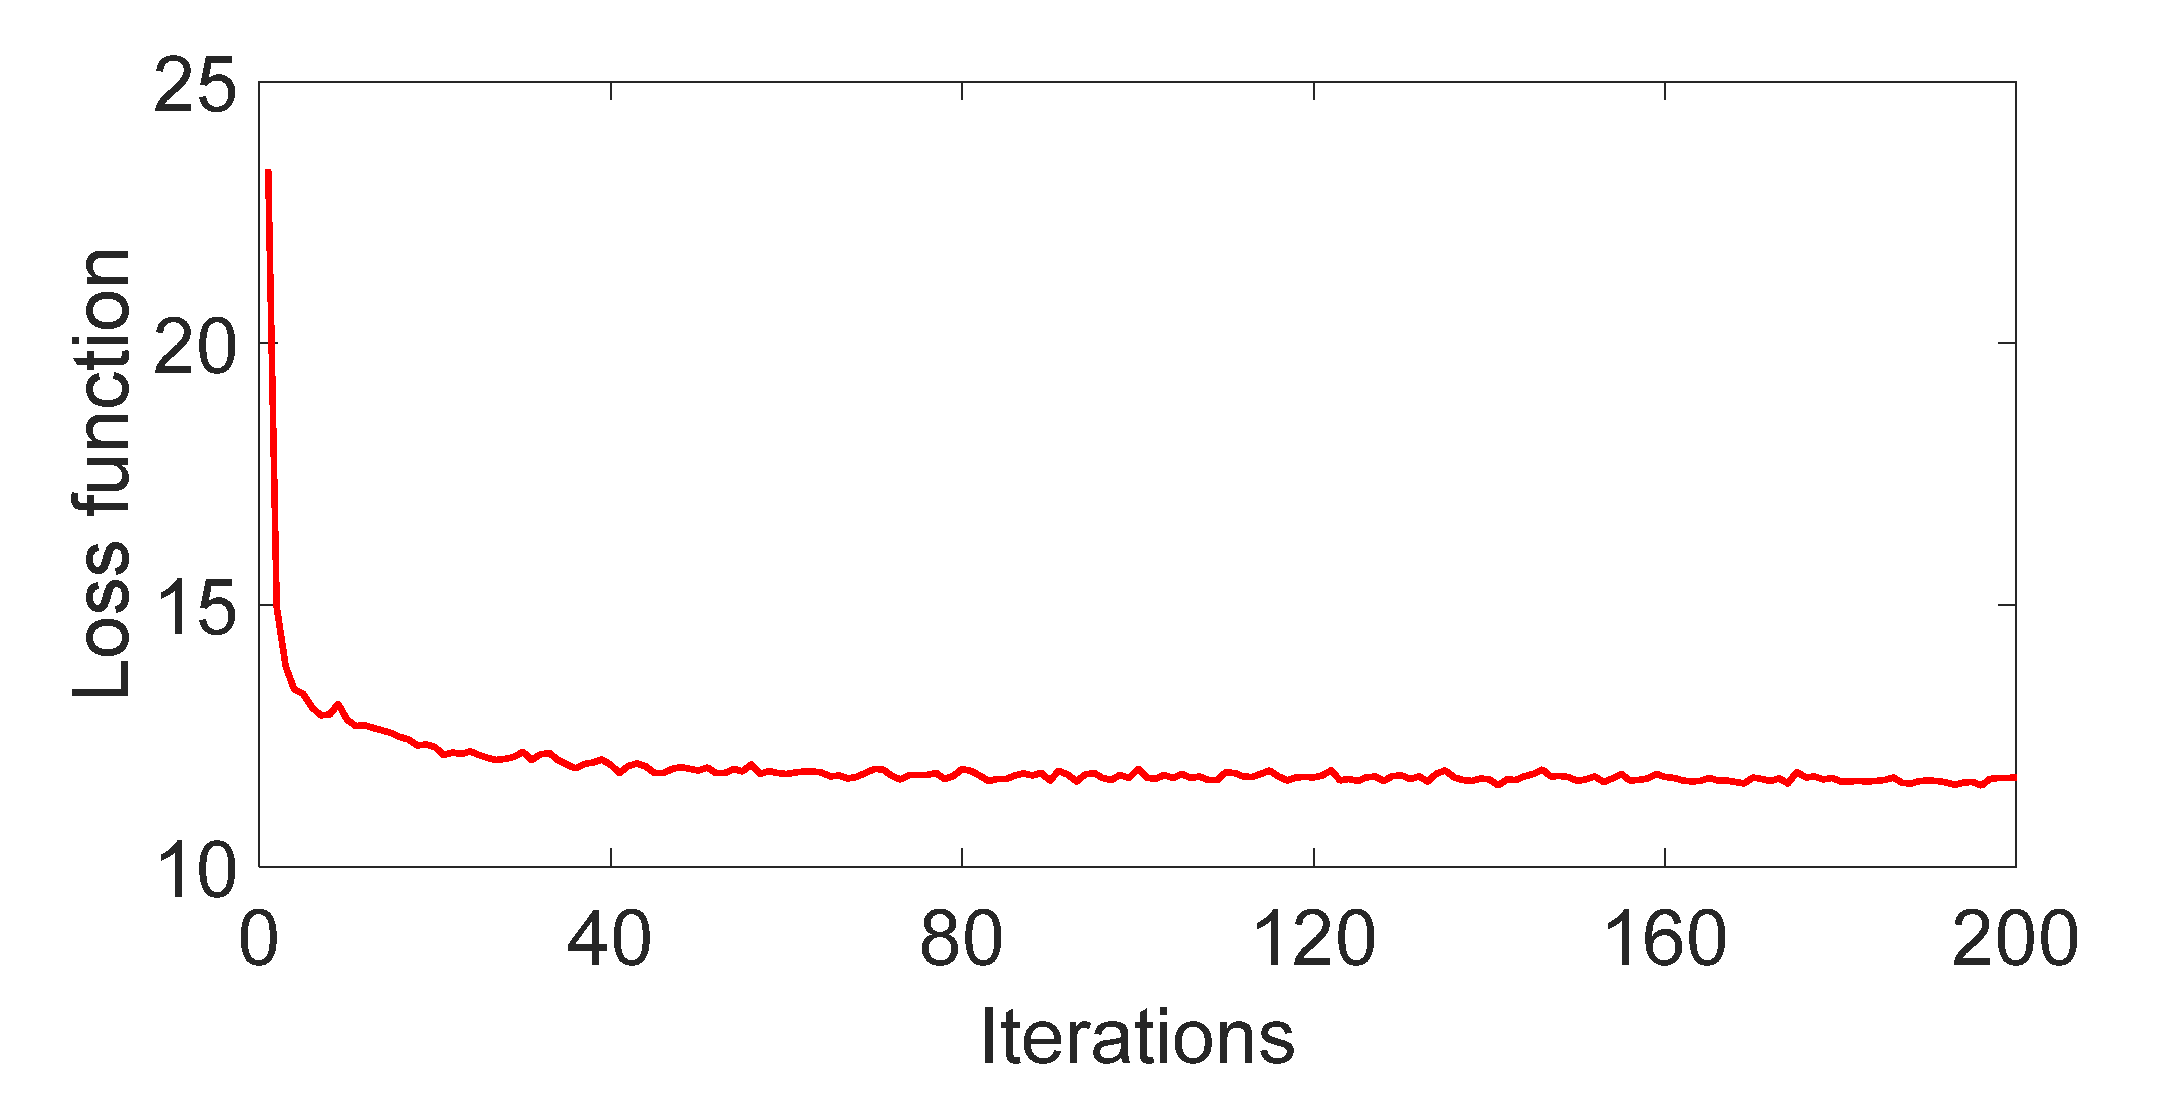
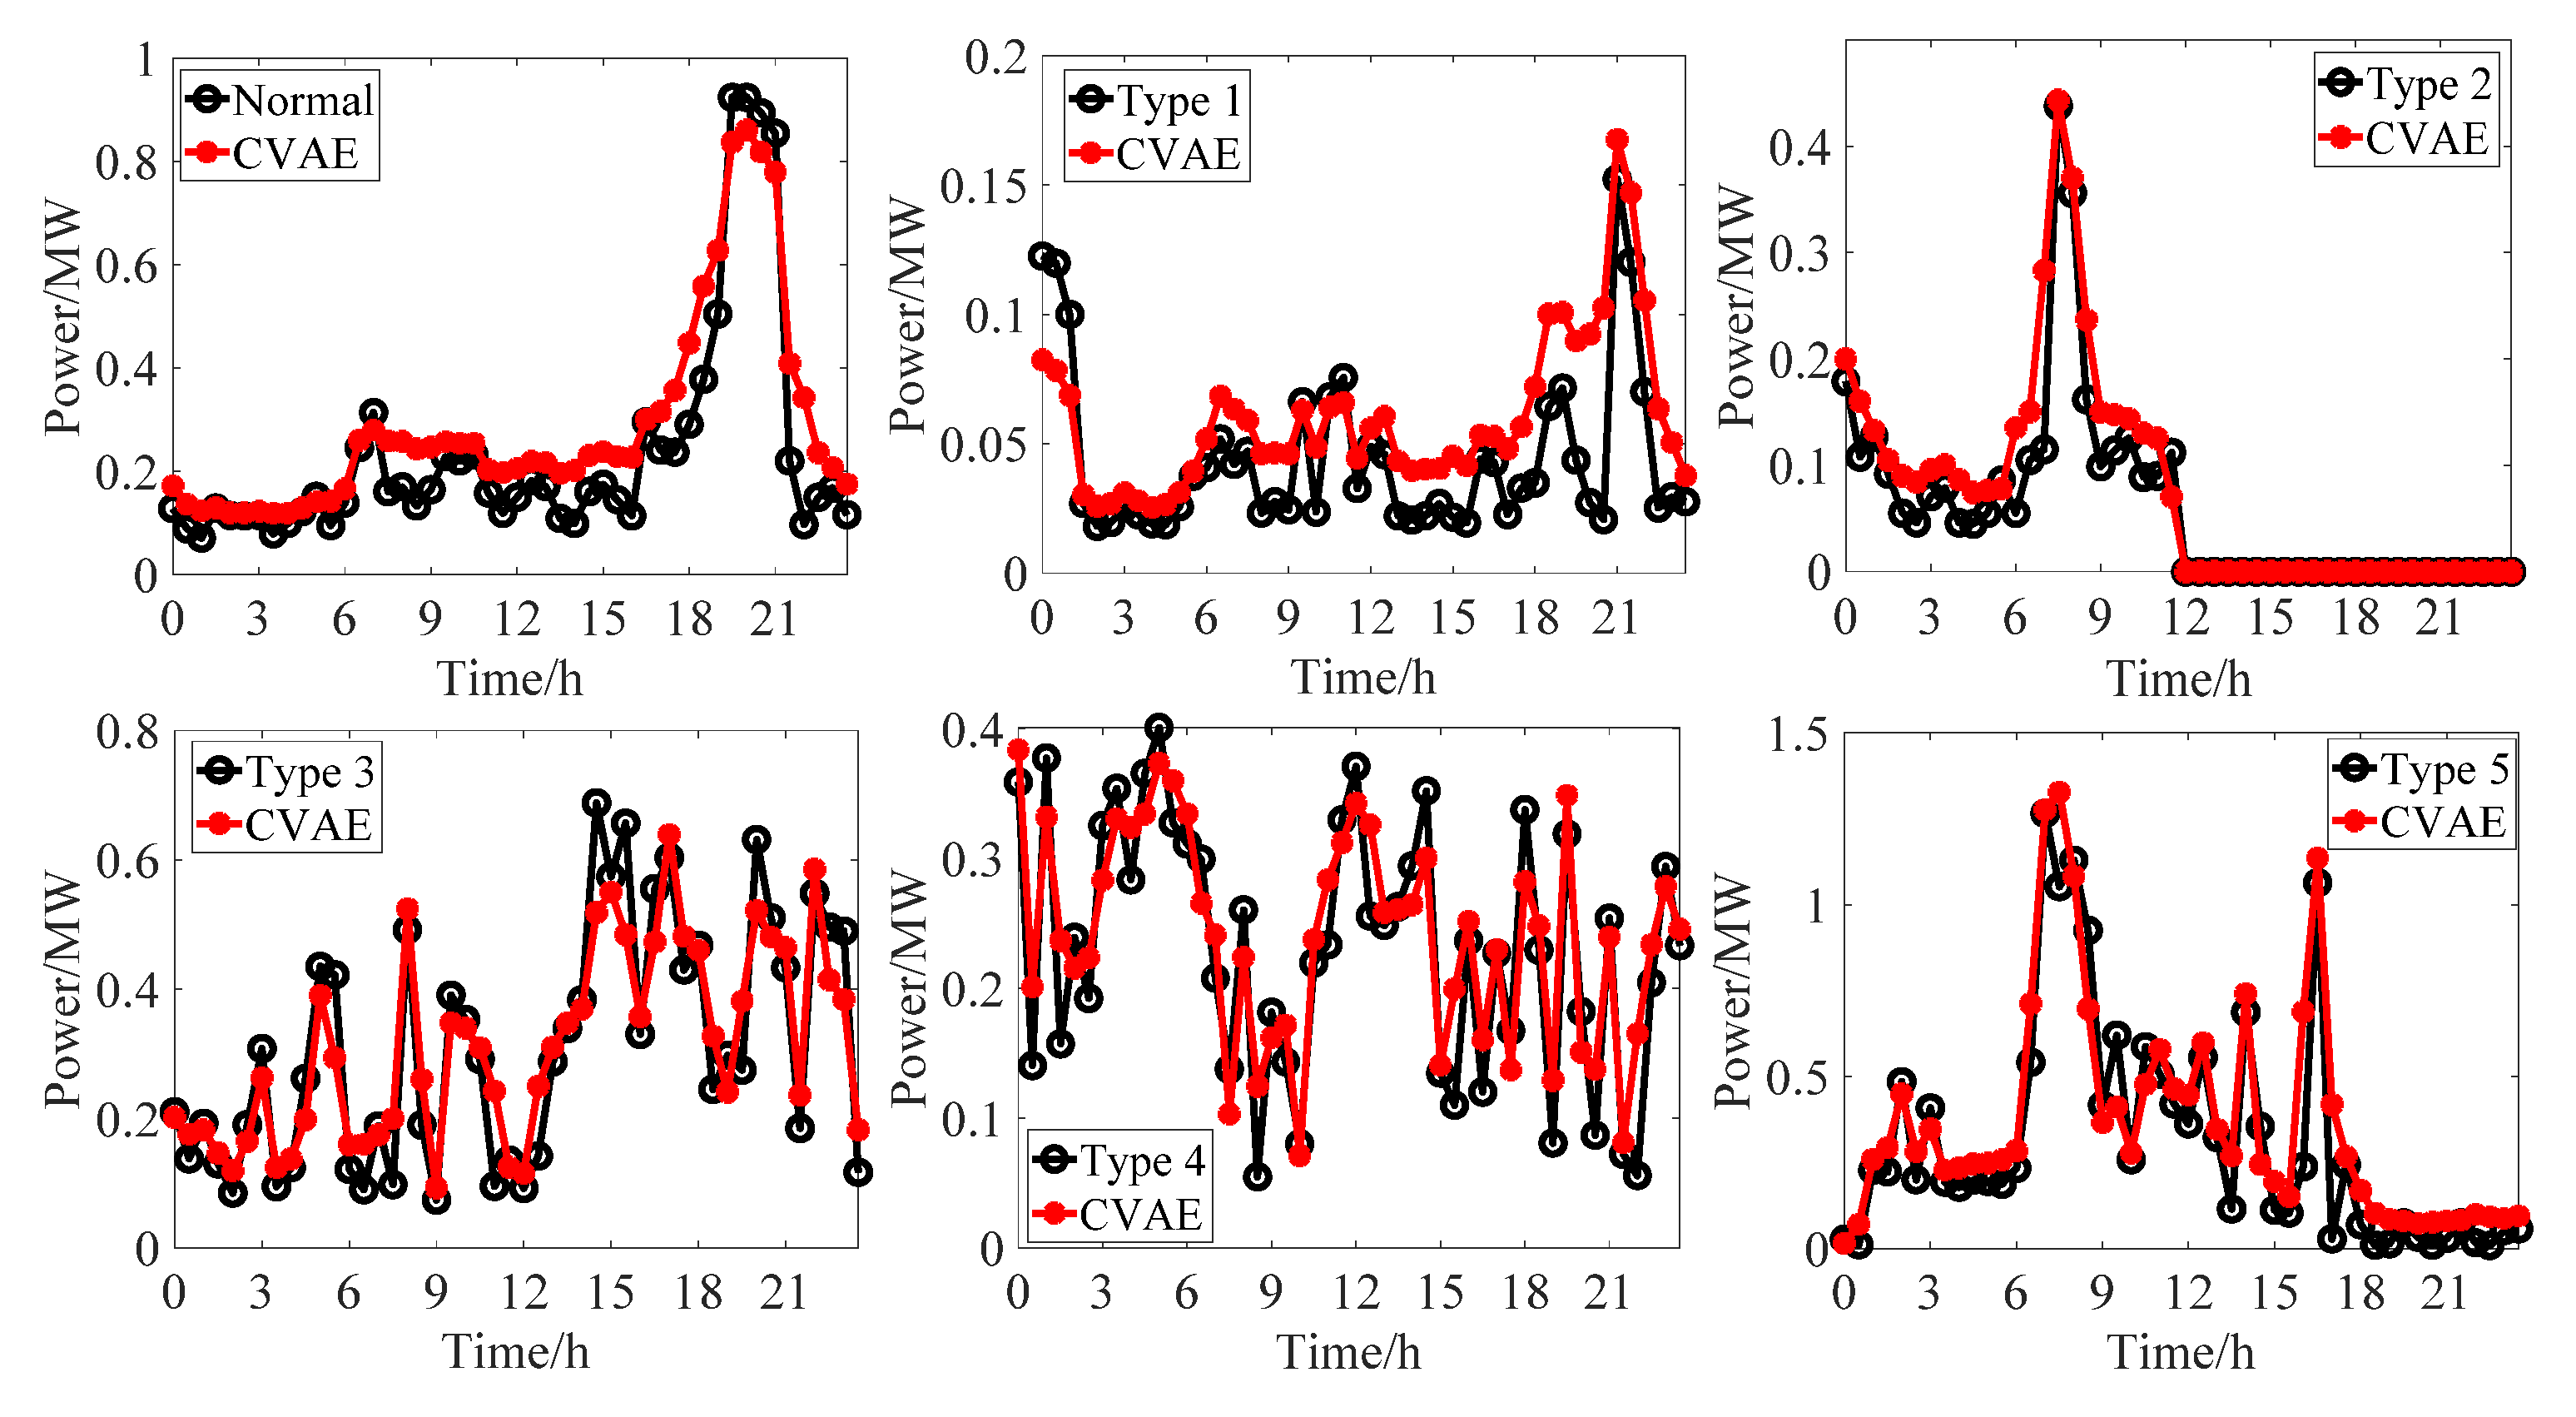
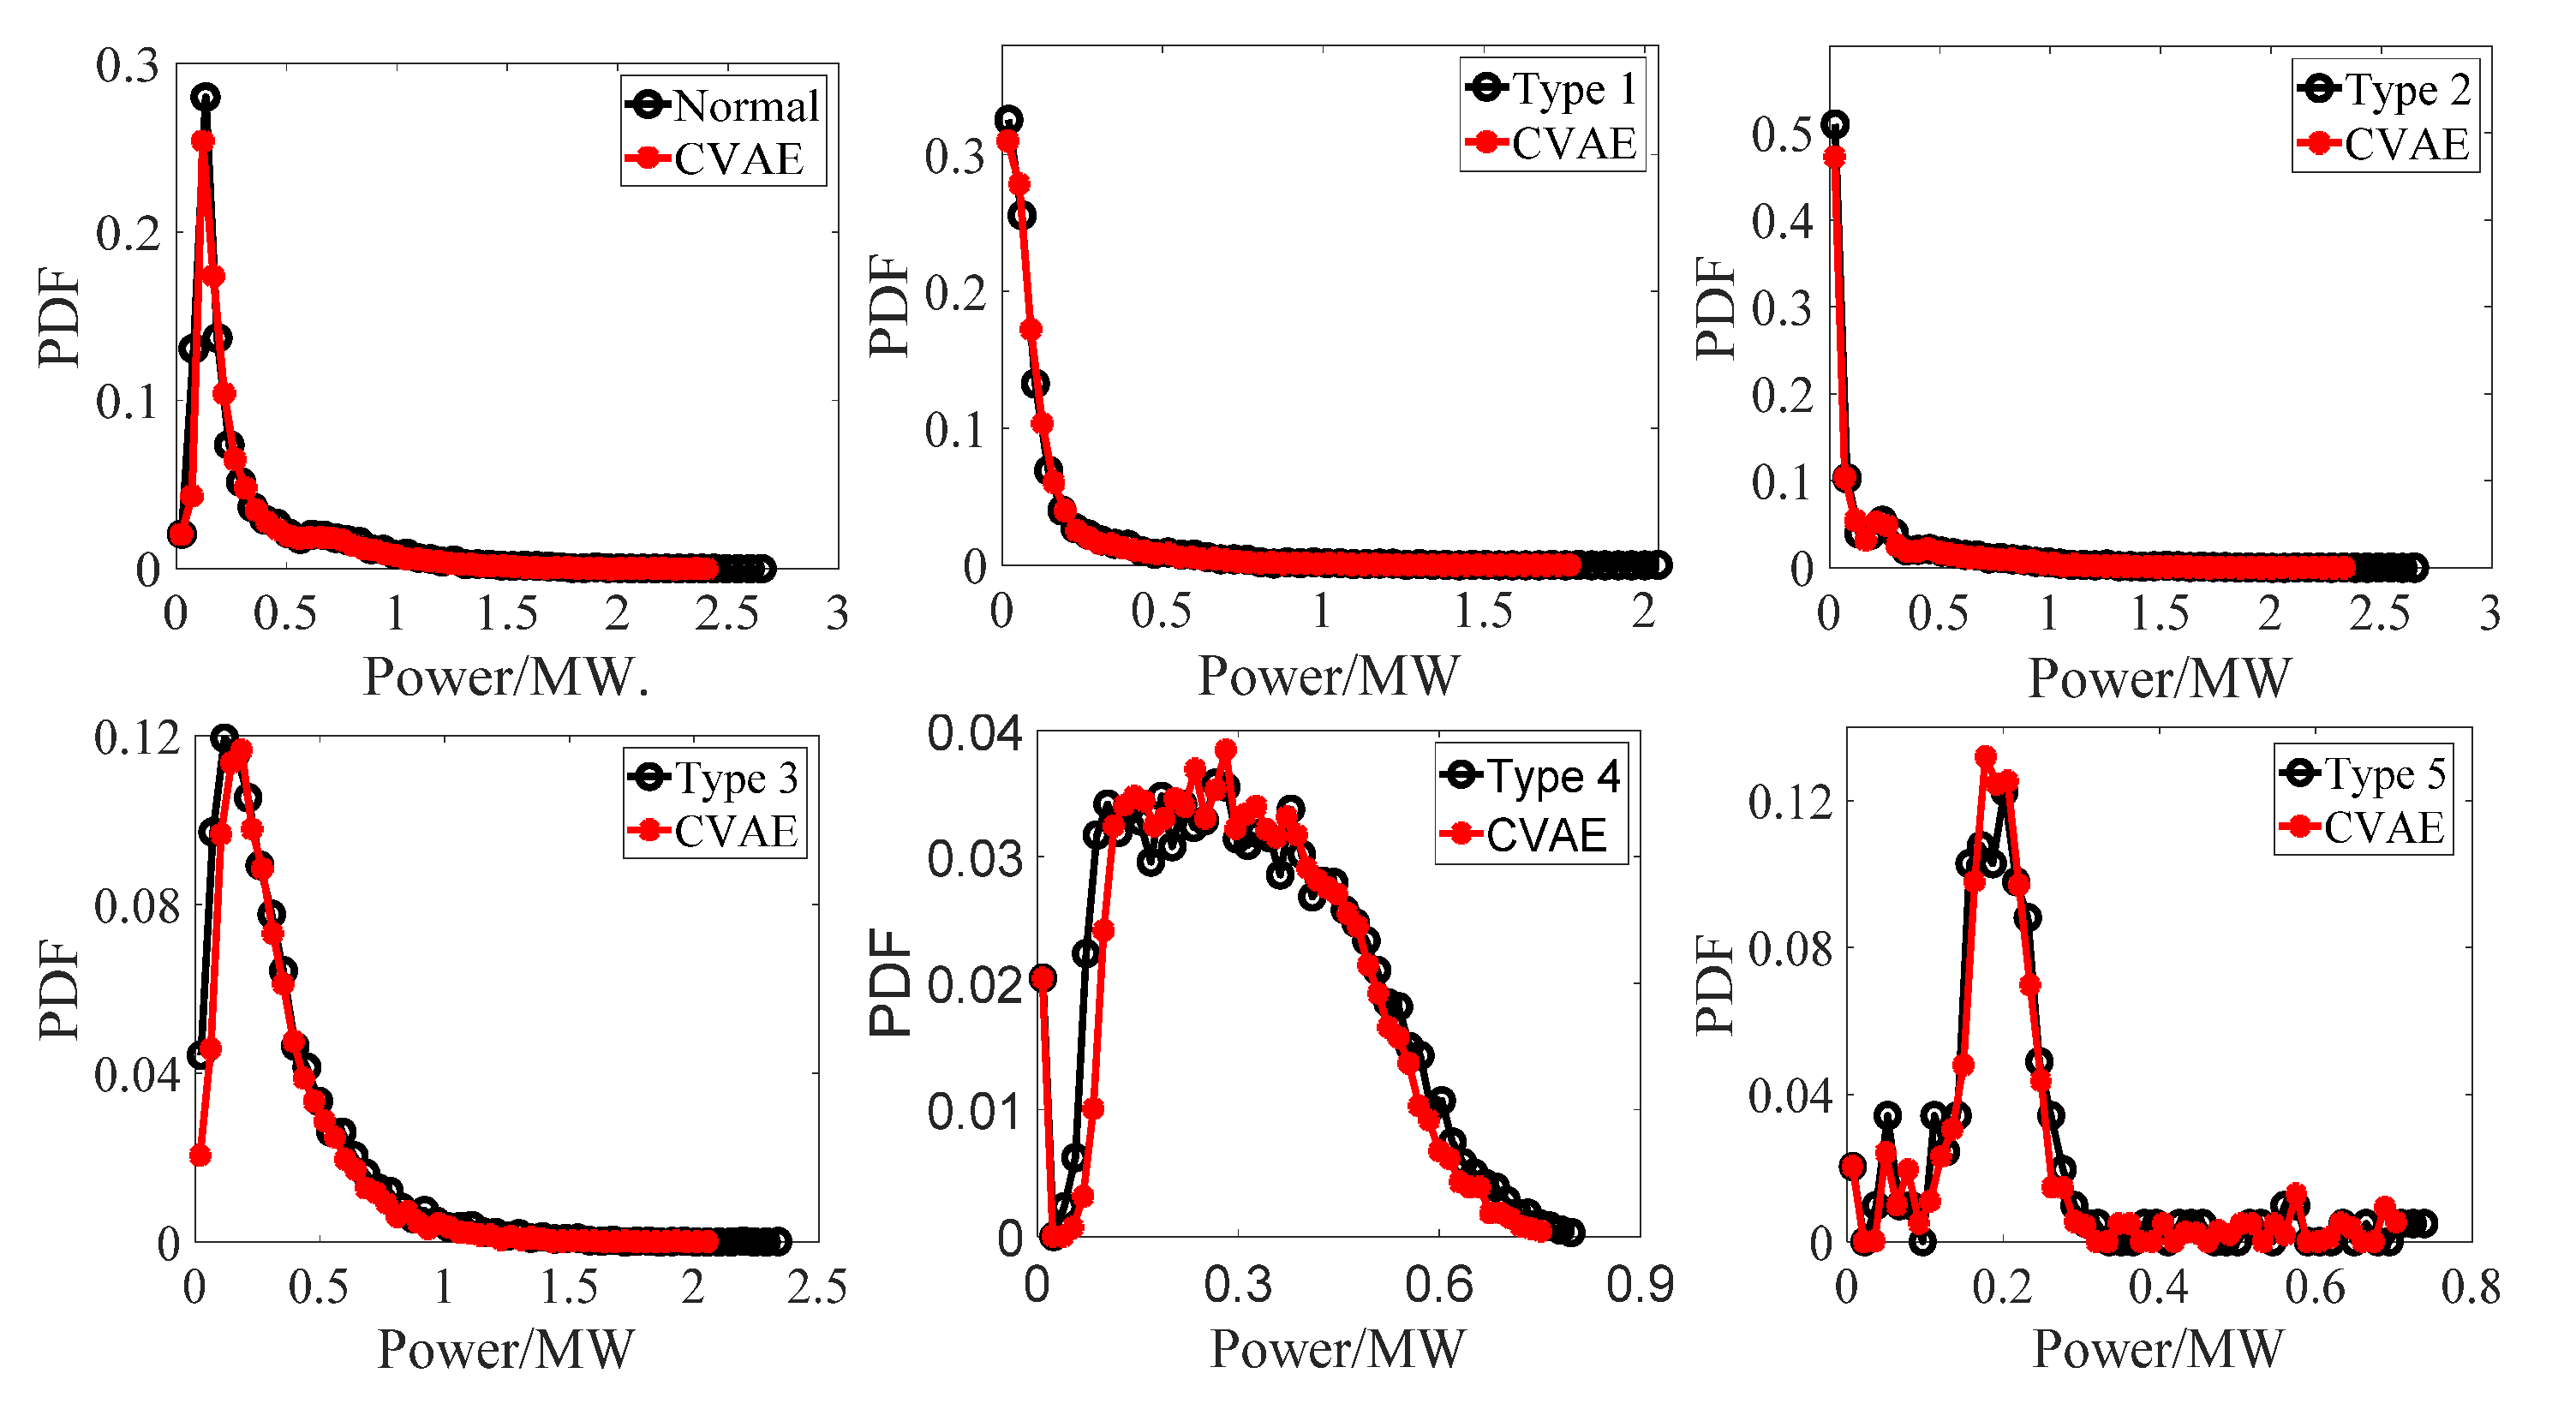
- The training process of CVAE is very stable, and the convergence speed is fast. The generated stealing power curves have a similar shape and distribution characteristics with the original stealing power curves.
- (2).
- After data augmentation by CVAE, the accuracy, Macro F1, and G-mean of CNN are improved by 7.00%, 6.65%, and 6.01%, respectively compared with the original training set. Compared with existing data augmentation methods (e.g., ROS, SMOTE and GAN), the accuracy, Macro F1, and G-mean values of CNN are the largest, which indicates that the new samples generated by CVAE have the strongest improvement on detection performance.
- (3).
- Compared with the original training set, the training set augmented by CVAE improves the comprehensive detection performance of classifiers such as CNN, MLP, SVM, and XGBoost, which indicates that CVAE is suitable for different classifiers.
Author Contributions
Funding
Conflicts of Interest
Nomenclature
| historical stealing power curves | |
| data distribution of stealing power curves | |
| z | latent variable |
| the prior probability | |
| the posterior probability | |
| the Kullback–Leibler divergence | |
| the probability distribution to be learned | |
| the prior distribution of latent variables | |
| a random noise in the range of 0.1 to 0.8 | |
| a random noise in the range of 0.1 to 0.8 for the t-th point of power curves | |
| the t-th point of stealing power curves generated by attack models | |
| the t-th point of normal power curves | |
| the weights of the i-th convolutional layer | |
| the offset vector of the i-th convolutional layer | |
| the output data of i-th max-pooling layer | |
| the weights of the i-th fully connected layer | |
| the offset vector of the i-th fully connected layer | |
| the output data of i-th fully connected layer |
References
- Nabil, M.; Ismail, M.; Mahmoud, M.M.E.A.; Alasmary, W.; Serpedin, E. PPETD: Privacy-Preserving Electricity Theft Detection Scheme with Load Monitoring and Billing for AMI Networks. IEEE Access 2019, 7, 96334–96348. [Google Scholar] [CrossRef]
- Zanetti, M.; Jamhour, E.; Pellenz, M.; Penna, M.; Zambenedetti, V.; Chueiri, I. A Tunable Fraud Detection System for Advanced Metering Infrastructure Using Short-Lived Patterns. IEEE Trans. Smart Grid 2019, 10, 830–840. [Google Scholar] [CrossRef]
- Yip, S.; Tan, C.; Tan, W.; Gan, M.; Bakar, A.A. Energy theft and defective meters detection in AMI using linear regression. In Proceedings of the 2017 IEEE International Conference on Environment and Electrical Engineering and 2017 IEEE Industrial and Commercial Power Systems Europe (EEEIC/I & CPS Europe), Milan, Italy, 6–9 June 2017. [Google Scholar]
- Wu, R.; Wang, L.; Hu, T. AdaBoost-SVM for Electrical Theft Detection and GRNN for Stealing Time Periods Identification. In Proceedings of the IECON 2018—44th Annual Conference of the IEEE Industrial Electronics Society, Washington, DC, USA, 21–23 October 2018. [Google Scholar]
- Gu, G.; He, Q.; Wang, B.; Dai, B. Comparison of Machine Learning Techniques for the Detection of the Electricity Theft. In Proceedings of the 2018 IEEE 3rd International Conference on Cloud Computing and Internet of Things (CCIOT), Dalian, China, 20–21 October 2018. [Google Scholar]
- Jindal, A.; Dua, A.; Kaur, K.; Singh, M.; Kumar, N.; Mishra, S. Decision Tree and SVM-Based Data Analytics for Theft Detection in Smart Grid. IEEE Trans. Ind. Inform. 2016, 12, 1005–1016. [Google Scholar] [CrossRef]
- Punmiya, R.; Choe, S. Energy Theft Detection Using Gradient Boosting Theft Detector with Feature Engineering-Based Preprocessing. IEEE Trans. Smart Grid 2019, 10, 2326–2329. [Google Scholar] [CrossRef]
- Ahmad, T.; Chen, H.; Wang, J.; Guo, Y. Review of various modeling techniques for the detection of electricity theft in smart grid environment. Renew. Sustain. Energy Rev. 2018, 82, 2916–2933. [Google Scholar] [CrossRef]
- Messinis, G.M.; Hatziargyriou, N.D. Review of non-technical loss detection methods. Electr. Power Syst. Res. 2018, 158, 250–266. [Google Scholar] [CrossRef]
- Toma, R.N.; Hasan, M.N.; Nahid, A.; Li, B. Electricity Theft Detection to Reduce Non-Technical Loss using Support Vector Machine in Smart Grid. In Proceedings of the 2019 1st International Conference on Advances in Science, Engineering and Robotics Technology (ICASERT), Dhaka, Bangladesh, 3–5 May 2019. [Google Scholar]
- Zheng, Z.; Yang, Y.; Niu, X.; Dai, H.; Zhou, Y. Wide and Deep Convolutional Neural Networks for Electricity-Theft Detection to Secure Smart Grids. IEEE Trans. Ind. Inform. 2018, 14, 1606–1615. [Google Scholar] [CrossRef]
- Bhat, R.R.; Trevizan, R.D.; Sengupta, R.; Li, X.; Bretas, A. Identifying Nontechnical Power Loss via Spatial and Temporal Deep Learning. In Proceedings of the 2016 15th IEEE International Conference on Machine Learning and Applications (ICMLA), Anaheim, CA, USA, 18–20 December 2016. [Google Scholar]
- Wei, L.; Gao, D.; Luo, C. False Data Injection Attacks Detection with Deep Belief Networks in Smart Grid. In Proceedings of the 2018 Chinese Automation Congress (CAC), Xi’an China, 30 November–2 December 2018. [Google Scholar]
- Wu, X.; Zuo, W.; Lin, L.; Jia, W.; Zhang, D. F-SVM: Combination of Feature Transformation and SVM Learning via Convex Relaxation. IEEE Trans. Neural Netw. Learn. Syst. 2018, 29, 5185–5199. [Google Scholar] [CrossRef]
- Yu, S.; Li, X.; Zhang, X.; Wang, H. The OCS-SVM: An Objective-Cost-Sensitive SVM with Sample-Based Misclassification Cost Invariance. IEEE Access 2019, 7, 118931–118942. [Google Scholar] [CrossRef]
- Liu, J.; Li, D.; Xu, Y. Collaborative Online Edge Caching with Bayesian Clustering in Wireless Networks. IEEE Internet Things J. 2020, 7, 1548–1560. [Google Scholar] [CrossRef]
- Han, S.; Kong, G.; Choi, S. A Detection Scheme with TMR Estimation Based on Multi-Layer Perceptrons for Bit Patterned Media Recording. IEEE Trans. Magn. 2019, 55, 1–4. [Google Scholar] [CrossRef]
- Jiang, Y.; Tong, G.; Yin, H.; Xiong, N. A Pedestrian Detection Method Based on Genetic Algorithm for Optimize XGBoost Training Parameters. IEEE Access 2019, 7, 118310–118321. [Google Scholar] [CrossRef]
- Gu, X.; Han, Y.; Yu, J. A Novel Lane-Changing Decision Model for Autonomous Vehicles Based on Deep Autoencoder Network and XGBoost. IEEE Access 2020, 8, 9846–9863. [Google Scholar] [CrossRef]
- He, Y.; Mendis, G.J.; Wei, J. Real-Time Detection of False Data Injection Attacks in Smart Grid: A Deep Learning-Based Intelligent Mechanism. IEEE Trans. Smart Grid 2017, 8, 2505–2516. [Google Scholar] [CrossRef]
- Niu, X.; Li, J.; Sun, J.; Tomsovic, K. Dynamic Detection of False Data Injection Attack in Smart Grid using Deep Learning. In Proceedings of the 2019 IEEE Power & Energy Society Innovative Smart Grid Technologies Conference (ISGT), Washington, DC, USA, 18–21 February 2019. [Google Scholar]
- Pang, Y.; Chen, Z.; Peng, L.; Ma, K.; Zhao, C.; Ji, K. A Signature-Based Assistant Random Oversampling Method for Malware Detection. In Proceedings of the 2019 18th IEEE International Conference on Trust, Security and Privacy in Computing and Communications/13th IEEE International Conference on Big Data Science and Engineering (TrustCom/BigDataSE), Rotorua, New Zealand, 5–8 August 2019. [Google Scholar]
- Pan, T.; Zhao, J.; Wu, W.; Yang, J. Learning imbalanced datasets based on SMOTE and Gaussian distribution. Inf. Sci. 2020, 512, 1214–1233. [Google Scholar] [CrossRef]
- Elreedy, D.; Atiya, A.F. A Comprehensive Analysis of Synthetic Minority Oversampling Technique (SMOTE) for handling class imbalance. Inf. Sci. 2019, 505, 32–64. [Google Scholar] [CrossRef]
- Feng, W.; Huang, W.; Bao, W. Imbalanced Hyperspectral Image Classification with an Adaptive Ensemble Method Based on SMOTE and Rotation Forest with Differentiated Sampling Rates. IEEE Geosci. Remote Sens. Lett. 2019, 16, 1879–1883. [Google Scholar] [CrossRef]
- Wang, D.; Yang, K. A Data Generation Method for Electricity Theft Detection Using Generative Adversarial Network. Power Syst. Technol. 2020, 44, 775–782. [Google Scholar]
- Du, C.; Chen, B.; Xu, B.; Guo, D.; Liu, H. Factorized discriminative conditional variational auto-encoder for radar HRRP target recognition. Signal Process. 2019, 158, 176–189. [Google Scholar] [CrossRef]
- Pesteie, M.; Abolmaesumi, P.; Rohling, R.N. Adaptive Augmentation of Medical Data Using Independently Conditional Variational Auto-Encoders. IEEE Trans. Med. Imaging 2019, 38, 2807–2820. [Google Scholar] [CrossRef]
- Sadeghi, M.; Leglaive, S.; Alameda-Pineda, X.; Girin, L.; Horaud, R. Audio-Visual Speech Enhancement Using Conditional Variational Auto-Encoders. IEEE/ACM Trans. Audio Speech Lang. Process. 2020, 28, 1788–1800. [Google Scholar] [CrossRef]
- Pan, Z.; Wang, J.; Liao, W.; Chen, H.; Yuan, D.; Zhu, W.; Fang, X.; Zhu, Z. Data-Driven EV Load Profiles Generation Using a Variational Auto-Encoder. Energies 2019, 12, 849. [Google Scholar] [CrossRef]
- Du, Y.; Xu, J.; Zhen, X.; Cheng, M.; Shao, L. Conditional Variational Image Deraining. IEEE Trans. Image Process. 2020, 29, 6288–6301. [Google Scholar] [CrossRef] [PubMed]
- Liang, G.; Weller, S.R.; Zhao, J.; Luo, F.; Dong, Z.Y. The 2015 Ukraine Blackout: Implications for False Data Injection Attacks. IEEE Trans. Power Syst. 2017, 32, 3317–3318. [Google Scholar] [CrossRef]
- Lin, J.; Yu, W.; Yang, X. On false data injection attack against Multistep Electricity Price in electricity market in smart grid. In Proceedings of the 2013 IEEE Global Communications Conference (GLOBECOM), Atlanta, GA, USA, 9–13 December 2013. [Google Scholar]
- Yu, L.; Sun, X.; Sui, T. False-Data Injection Attack in Electricity Generation System Subject to Actuator Saturation: Analysis and Design. IEEE Trans. Syst. Man Cybern. Syst. 2019, 49, 1712–1719. [Google Scholar] [CrossRef]
- Xin, R.; Zhang, J.; Shao, Y. Complex network classification with convolutional neural network. Tsinghua Sci. Technol. 2020, 25, 447–457. [Google Scholar] [CrossRef]
- Zhou, D.-X. Theory of deep convolutional neural networks: Downsampling. Neural Netw. 2020, 124, 319–327. [Google Scholar] [CrossRef]
- Kerschke, P.; Hoos, H.H.; Neumann, F.; Trautmann, H. Automated Algorithm Selection: Survey and Perspectives. Evol. Comput. 2019, 27, 3–45. [Google Scholar] [CrossRef] [PubMed]
- Qin, Z.; Hu, L.; Zhang, N.; Chen, D.; Zhang, K.; Qin, Z.; Choo, K.R. Learning-Aided User Identification Using Smartphone Sensors for Smart Homes. IEEE Internet Things J. 2019, 6, 7760–7772. [Google Scholar] [CrossRef]
- UK Power Networks. Low Carbon London Project. Available online: https://data.london.gov.uk/dataset/smartmeter-energy-use-data-in-london-households (accessed on 10 August 2020).


| Attack Models | Mathematical Model | Attack Models | Mathematical Model |
|---|---|---|---|
| Type 1 | Type 4 | ||
| Type 2 | Type 5 | ||
| Type 3 |
| Curves | Output Code | Curves | Output Code | Curves | Output Code |
|---|---|---|---|---|---|
| Normal | 000000 | Type 2 | 001000 | Type 4 | 000010 |
| Type 1 | 010000 | Type 3 | 000100 | Type 5 | 000001 |
| Samples | Before Data Augmentation | After Data Augmentation | ||||||
|---|---|---|---|---|---|---|---|---|
| Sum | Training | Validation | Test | Sum | Training | Validation | Test | |
| Normal | 600 | 400 | 100 | 100 | 1000 | 800 | 100 | 100 |
| Type 1 | 300 | 200 | 50 | 50 | 500 | 400 | 50 | 50 |
| Type 2 | 300 | 200 | 50 | 50 | 500 | 400 | 50 | 50 |
| Type 3 | 300 | 200 | 50 | 50 | 500 | 400 | 50 | 50 |
| Type 4 | 300 | 200 | 50 | 50 | 500 | 400 | 50 | 50 |
| Type 5 | 300 | 200 | 50 | 50 | 500 | 400 | 50 | 50 |
| Methods | Accuracy | Macro F1 | G-Mean |
|---|---|---|---|
| No data augmentation | 83.25% | 83.90% | 83.55% |
| ROS | 85.25% | 85.54% | 85.24% |
| SMOTE | 86.75% | 86.80% | 86.88% |
| GAN | 88.00% | 88.36% | 88.23% |
| CVAE | 90.25% | 90.55% | 90.56% |
| Classifiers | Before Data Augmentation | After Data Augmentation | ||||
|---|---|---|---|---|---|---|
| Accuracy | Macro F1 | G-Mean | Accuracy | Macro F1 | G-Mean | |
| CNN | 83.25% | 83.90% | 83.55% | 90.25% | 90.55% | 90.56% |
| MLP | 78.75% | 78.78% | 78.06% | 82.50% | 83.13% | 82.71% |
| SVM | 75.25% | 75.64% | 74.44% | 79.75% | 80.04% | 78.70% |
| XGBoost | 80.25% | 80.75% | 80.65% | 83.25% | 83.48% | 82.62% |
© 2020 by the authors. Licensee MDPI, Basel, Switzerland. This article is an open access article distributed under the terms and conditions of the Creative Commons Attribution (CC BY) license (http://creativecommons.org/licenses/by/4.0/).
Share and Cite
Gong, X.; Tang, B.; Zhu, R.; Liao, W.; Song, L. Data Augmentation for Electricity Theft Detection Using Conditional Variational Auto-Encoder. Energies 2020, 13, 4291. https://doi.org/10.3390/en13174291
Gong X, Tang B, Zhu R, Liao W, Song L. Data Augmentation for Electricity Theft Detection Using Conditional Variational Auto-Encoder. Energies. 2020; 13(17):4291. https://doi.org/10.3390/en13174291
Chicago/Turabian StyleGong, Xuejiao, Bo Tang, Ruijin Zhu, Wenlong Liao, and Like Song. 2020. "Data Augmentation for Electricity Theft Detection Using Conditional Variational Auto-Encoder" Energies 13, no. 17: 4291. https://doi.org/10.3390/en13174291
APA StyleGong, X., Tang, B., Zhu, R., Liao, W., & Song, L. (2020). Data Augmentation for Electricity Theft Detection Using Conditional Variational Auto-Encoder. Energies, 13(17), 4291. https://doi.org/10.3390/en13174291