1. Introduction
Lithium-ion batteries have the characteristics of low self-discharge rate, good safety performance, fast charging and discharging capabilities, and high output power. They have been widely used in almost all industrial energy supply fields [
1,
2,
3]. However, with continuous use of lithium-ion batteries, the performance will gradually decline. It is generally believed that the battery should be replaced when the capacity decays to 70–80% of its rated capacity, which is also considered as the battery life threshold. Continuing to use the battery after reaching its life threshold may bring a series of safety issues. Therefore, it is particularly important to accurately predict the remaining useful life (RUL) of lithium-ion batteries.
Battery RUL prediction methods are developing rapidly. The literature [
4] has proposed a model that combines empirical index and polynomial regression to characterize capacity decline and predict RUL using particle filter (PF). Literature in [
5] improved the prediction performance of RUL by introducing the unscented particle filter (UPF). This PF-based prediction method usually needs to track the system state based on known capacity data. However, the capacity data are often difficult to obtain accurately during use of the battery, and the PF algorithm itself has problems of particle degradation and sample shortage, which limit its applications.
With the development of machine learning algorithms, many data-driven methods are gradually being used in battery RUL prediction, such as support vector machines, correlation vector machines, neural networks, etc. [
6,
7,
8]. Literature in [
9] proposed a fusion algorithm based on PF and support vector regression to predict RUL. Data-driven methods can effectively improve the prediction performance of battery RUL, and the accuracy of the collected data is very high, but it is difficult to analyze uncertainty in the prediction results. There exist many RUL prediction methods. Most of them use battery capacity data to characterize the battery degradation. However, the capacity data are difficult to obtain online [
10].
Because the direct parameters of the remaining capacity in a battery cannot be updated online, we propose to estimate battery capacity by analyzing measurable, indirect parameters during the discharge cycle of the battery. Then, the estimated capacity is used as the measured value of PF to predict the RUL of the lithium battery. To address the problems of particle degradation and lack of samples in the standard PF, the PF based on the Kendall rank correlation coefficient (KCCPF) is adopted in this paper to improve the resampling process. Simulation results show that KCCPF effectively improves the prediction performance of battery RUL.
The rest of this article is arranged as follows:
Section 2 introduces the battery capacity estimation method.
Section 3 introduces the RUL prediction method based on KCCPF. In
Section 4, the proposed method is verified by simulation.
Section 5 summarizes the full text.
2. Lithium-Ion Battery Capacity Estimation Method
The remaining capacity, a direct parameter to characterize the decline in battery performance, is often difficult to obtain when the battery is in active use, or its measurement accuracy is difficult to guarantee. In response to this problem, we propose to use indirect parameters (current, voltage, temperature) to estimate battery capacity. Compared with the remaining capacity parameter, the indirect parameters are easier to obtain and have higher accuracy, which are more suitable for applications in practical scenarios.
2.1. Feature Extraction and Analysis
The experimental data come from the Battery Dataset provided by NASA PCoE [
11]. The dataset contains a set of normal degradation state data collected under the same experimental environment for the same type of battery. In the experiment, when the battery capacity decays to 1.38 Ah, it is considered to have reached its life threshold. B5 and B6 batteries are used in this paper.
Although the internal mechanism of capacity decline is complicated, it can be reflected by the change of some external measurable physical quantities.
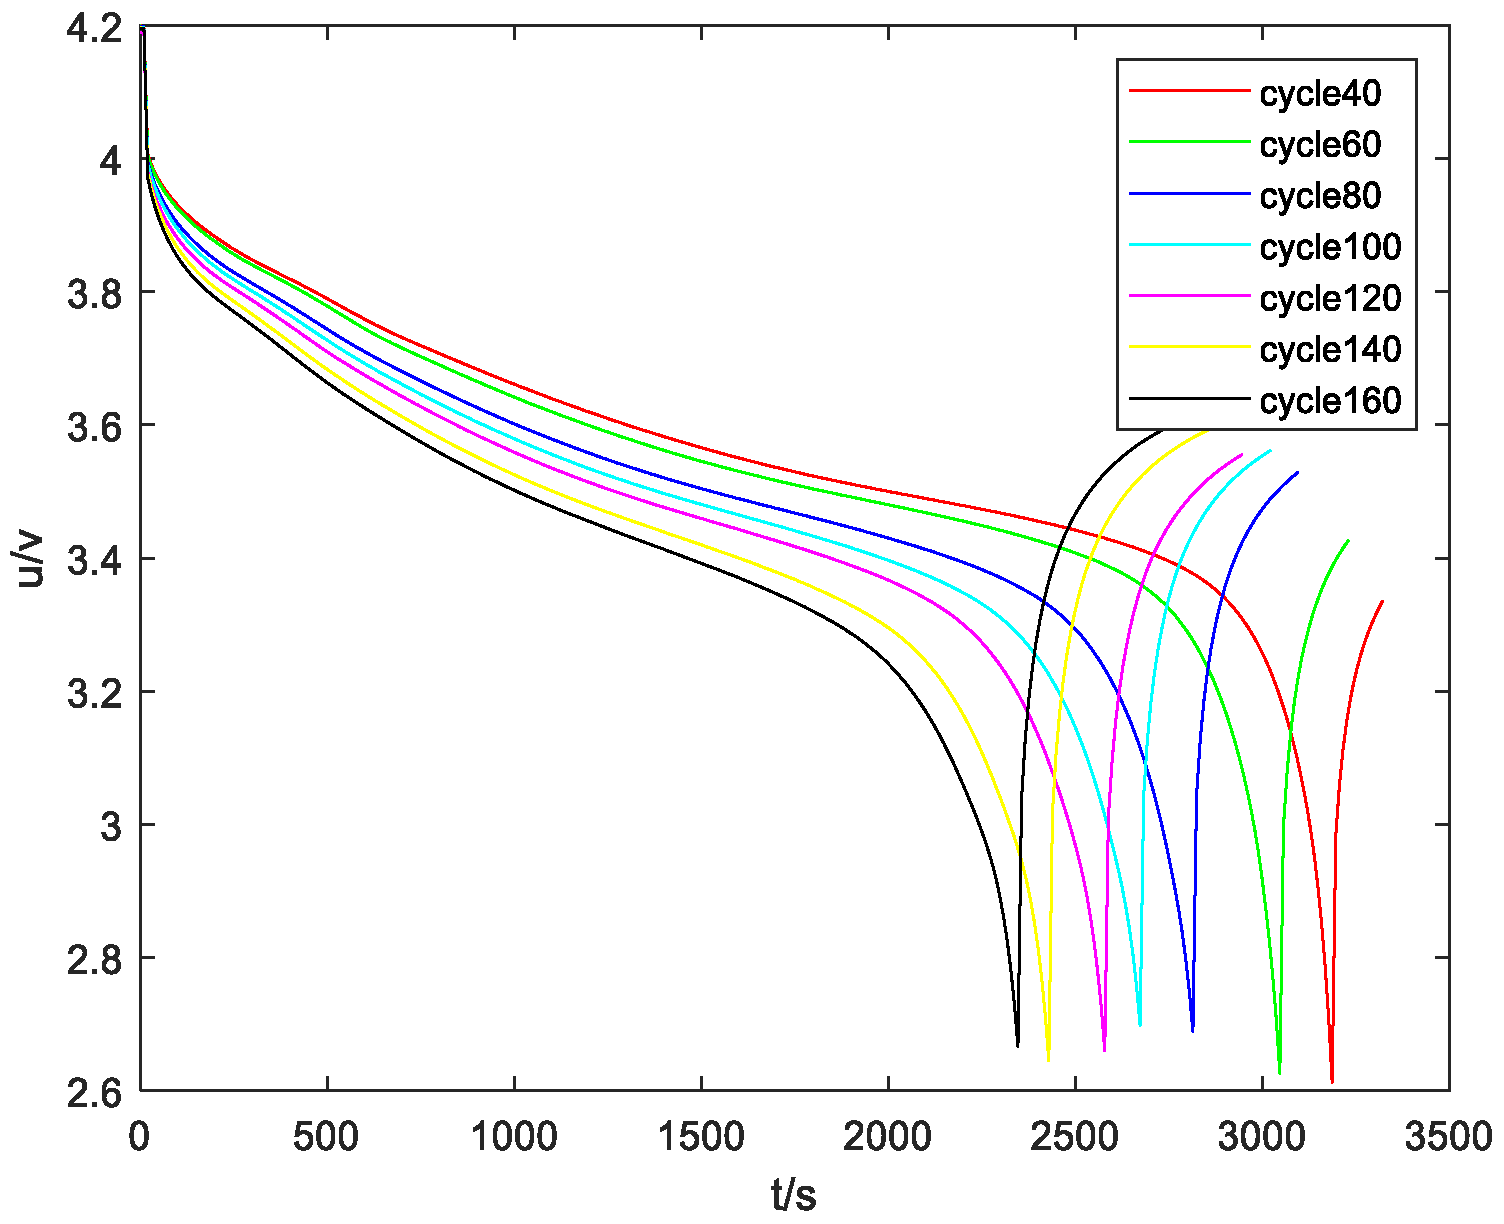
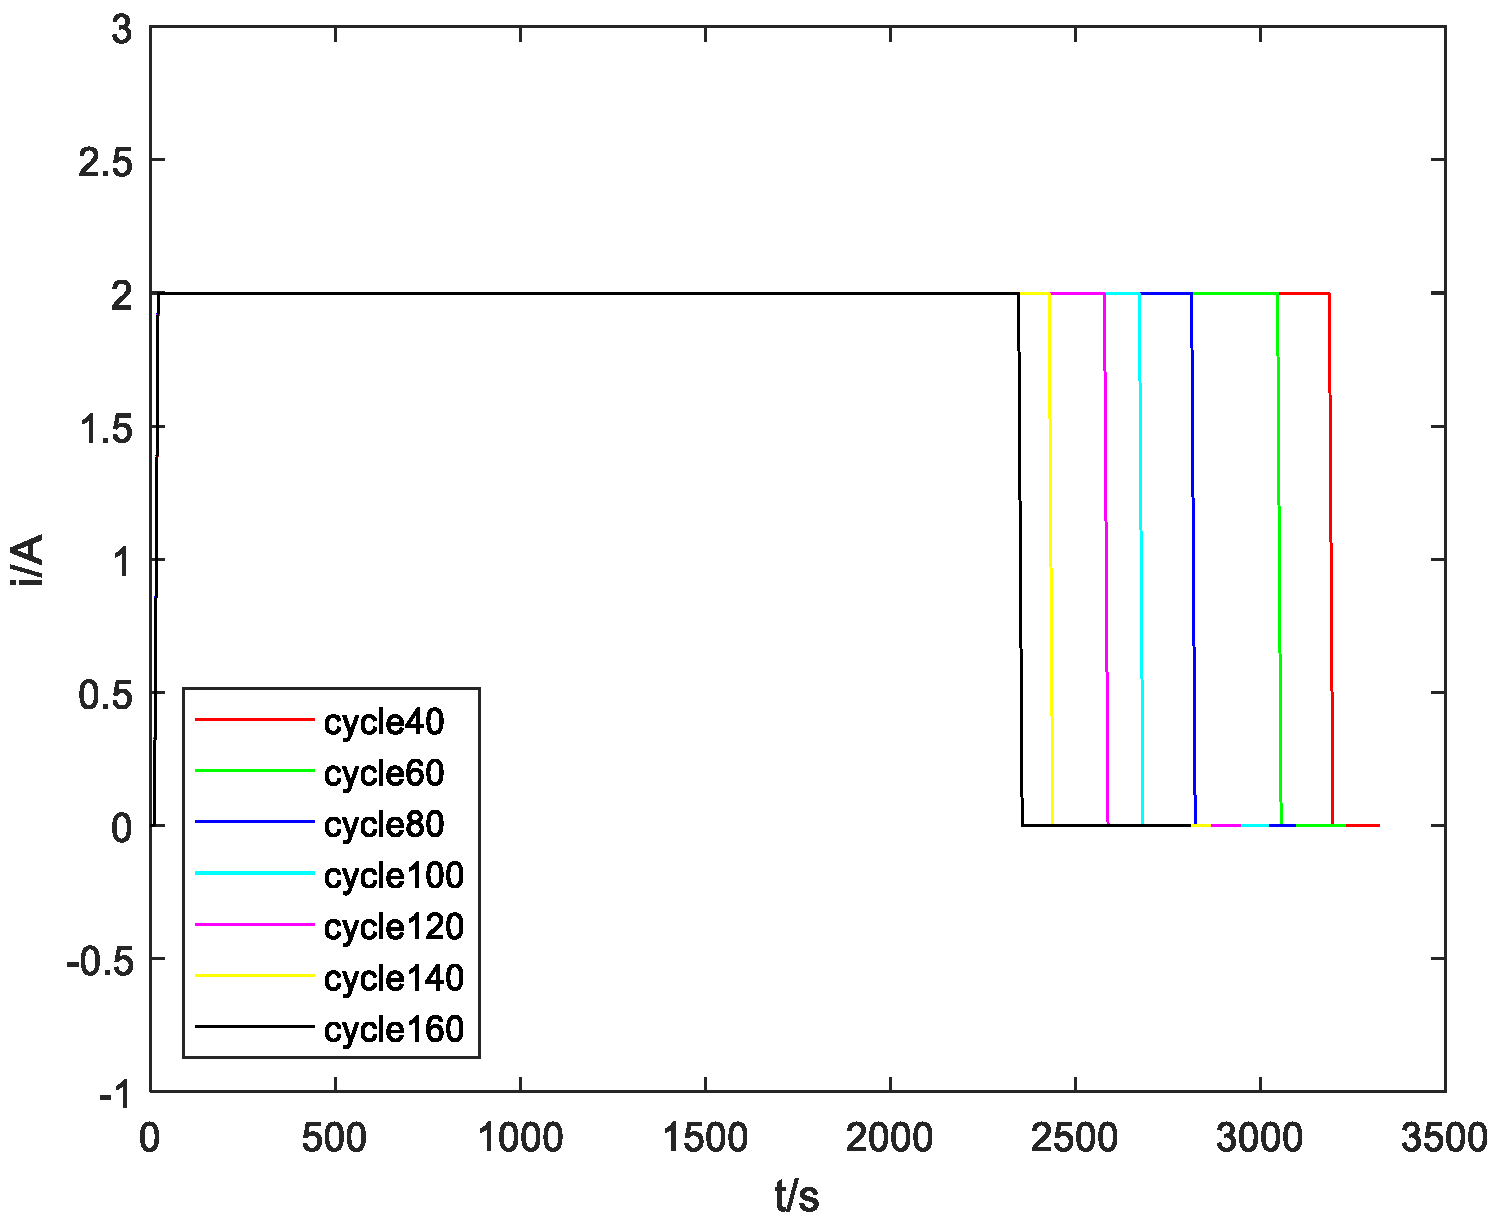
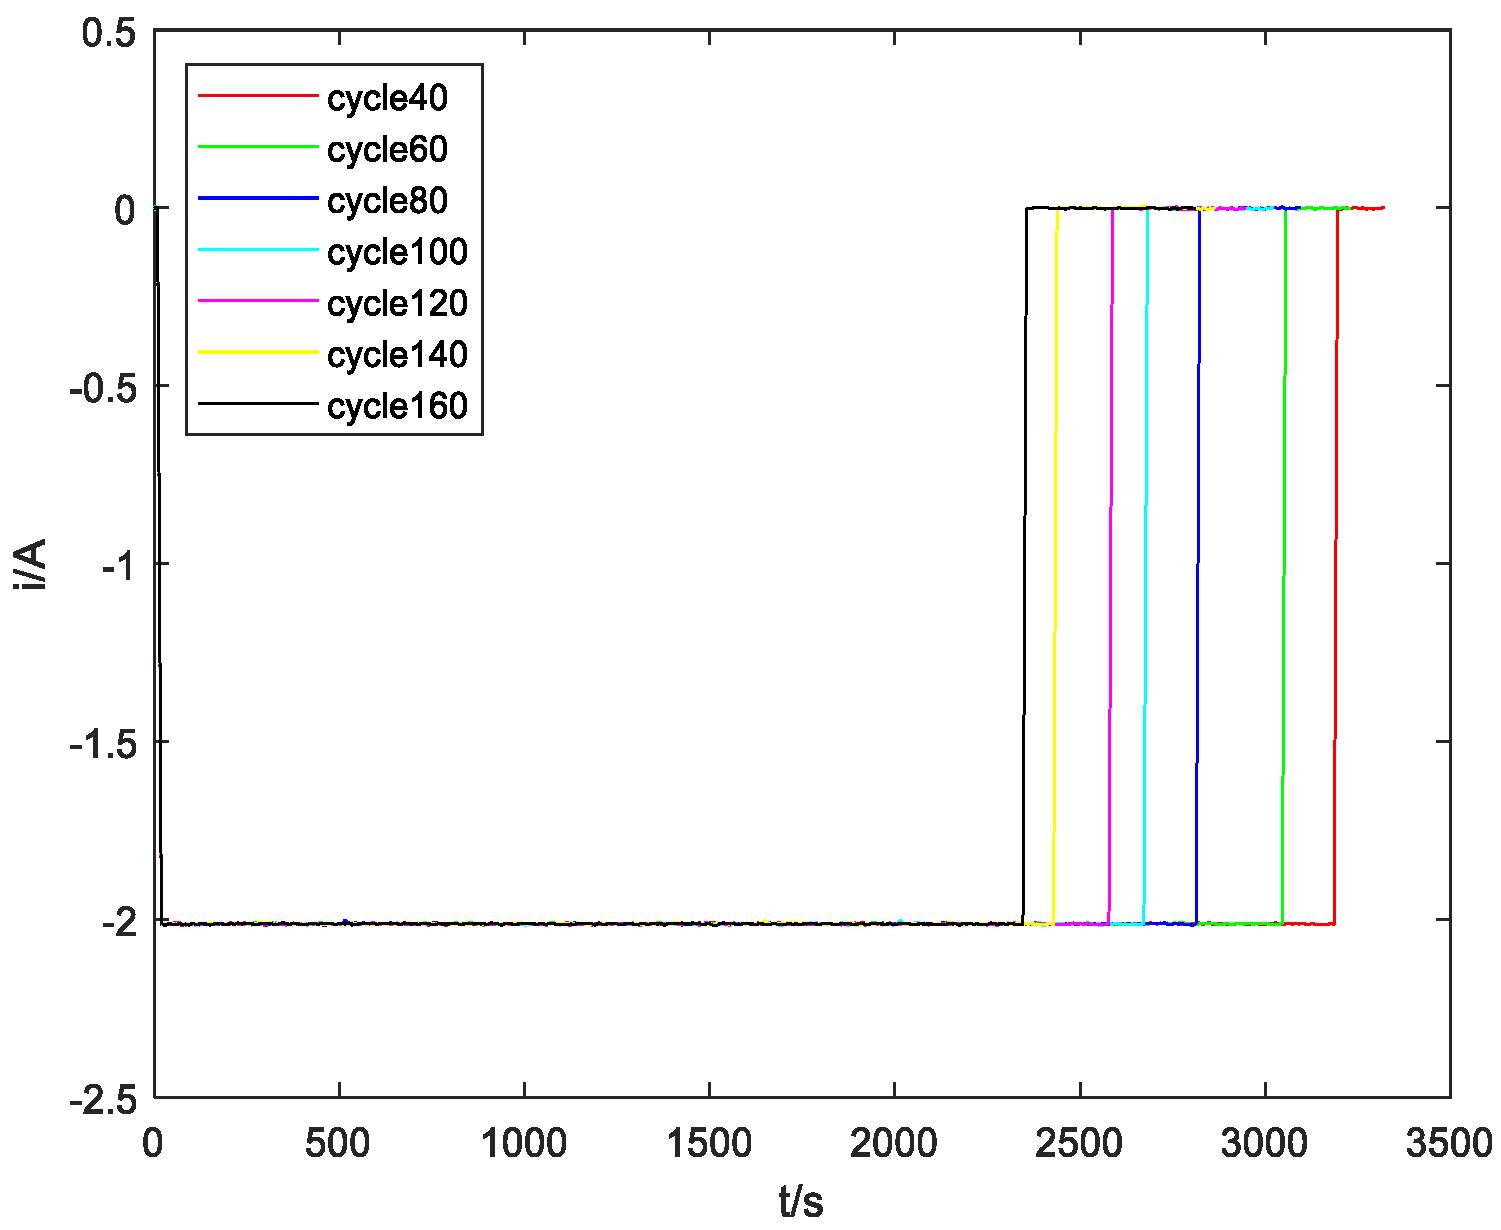
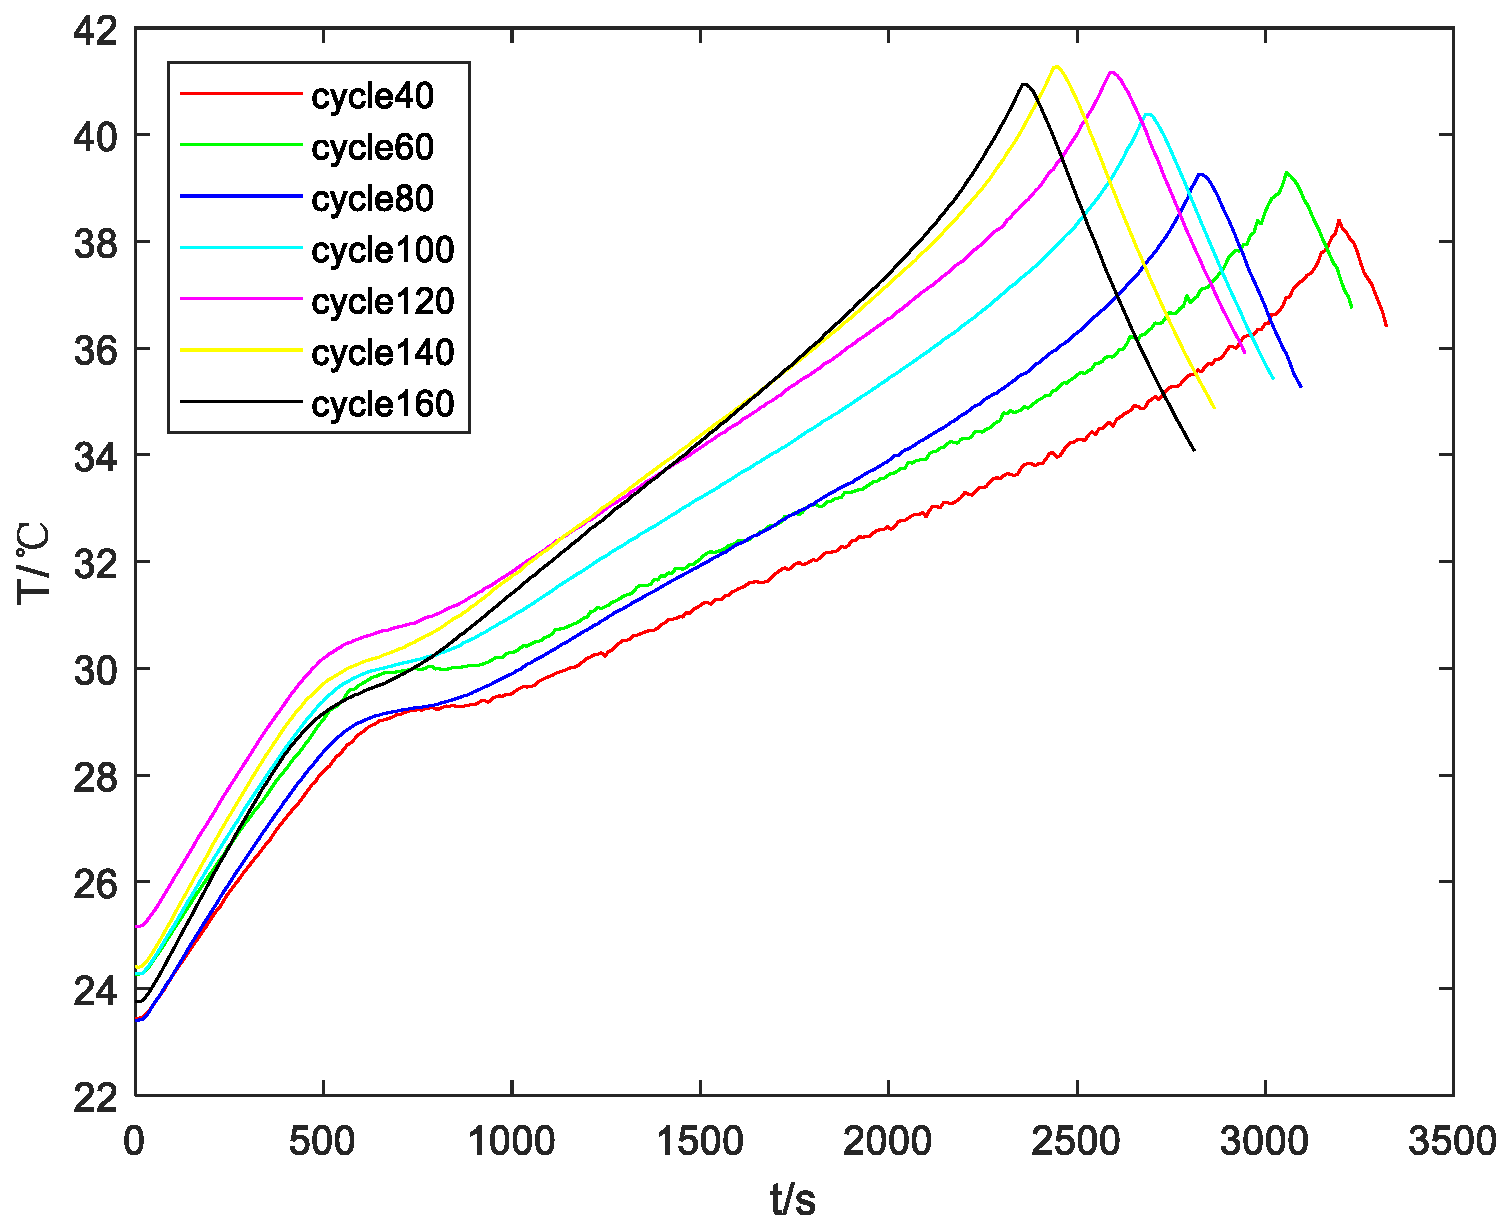
Figure 1 shows the output voltage variation curves of multiple cycles. As the battery continues to charge and discharge, the time when the output voltage drops to the minimum peak gradually decreases, and the rate of decrease is significantly accelerated. Therefore, the time during which the output voltage drops to its minimum peak can be selected as an indirect parameter that reflects the remaining capacity. At the same time, the voltage drop discharge time from 4.2 to 3.9 V can be selected as a second indirect parameter. Similarly, during the cyclic charge and discharge processes, the time for the load current and output current to decrease to their minimum peak gradually becomes shorter, and the time for the temperature to increase to the highest peak gradually becomes shorter, as shown in
Figure 2,
Figure 3 and
Figure 4. Therefore, we chose five physical quantities to characterize the battery capacity degradation: the time for the output voltage to drop from its maximum to its minimum peak, the time for the voltage to drop from 4.2 to 3.9 V, the time for the load terminal current and the output current to fall to their minimum peaks from their maximum values, and the time for the temperature to increase to its highest peak.
In practice, there are strong correlations between the extracted five indirect parameters. The redundancy or correlation between different health factors will increase the number of calculations and the difficulty of analyzing problems. The Principal Components Analysis (PCA) algorithm allows one to create uncorrelated features as well as denoise and reduce the dimensionality of the data, so the PCA algorithm was used to solve this problem in this paper. PCA uses orthogonal transformation to linearly transform the observations of a series of possible related variables, thereby projecting the values of a series of linear unrelated variables. These unrelated variables are called principal components. Take the B5 battery for example, the five indirect parameters of the discharge cycle are extracted, and the dimensionality of the extracted data is reduced by the PCA method. The results show that the contribution proportion of the first principal component reached 90%, which essentially contains all the performance indicators. To test the ability of the first principal component to express battery degradation as a comprehensive health factor, Pearson correlation coefficients for the capacity and comprehensive health factors are calculated, and a significance test is performed. The results are shown in
Table 1.
The correlation coefficient analysis method is a statistical way to examine the linear correlation between variables. The formula to calculate the Pearson correlation coefficient
r is
where
and
are two variable sequences; and
and
are the average values of
and
respectively. When the value of
is closer to 1, the correlation between the two sets of sequences is stronger; when it is close to 0, the correlation between the two sets of sequences is weaker. When
r is positive, it is a positive correlation; when it is negative, it is a negative correlation.
To discuss whether the two variables are related, the significance level must be discussed. The correlation between the two may only be caused by accidental factors, so we have to judge the significance level of the correlation between the two variables. The method of hypothesis testing is adopted. Under the null hypothesis, H0, r is equal to 0; under the alternative hypothesis, H1, r is not equal to 0. According to the hypothesis testing method, under the condition that the null hypothesis is established, the probability (P value) that there is no correlation between the two variables is calculated. Usually 5% or 1% is the threshold (the threshold here is also called the significance level). When the P value is less than the significance level, we can reject the null hypothesis; that is, there is a significant, linear relationship between the two variables.
Table 1 shows the correlation analysis for comprehensive health factor and capacity. The
P values corresponding to the correlation coefficients in
Table 1 were all 0, which indicates that the correlation between comprehensive health factor and capacity is significantly established. We can see from
Table 1 that the calculated correlation coefficient was very high. Therefore, comprehensive health factor can be selected as characteristic parameter instead of the actual capacity data to characterize the degradation of lithium battery performance.
2.2. Lithium-Ion Battery Capacity Estimation Method
By taking the above comprehensive health factor as input for the NARX neural network and the measured capacity data as the output, a relationship model between health factor and capacity can be established. On the premise of obtaining indirect parameters during battery operation, the model can be used to estimate the remaining battery capacity online. NARX is a recursive neural network, which introduces output feedback functions into a static multilayer perceptron through a delay unit. NARX neural network is usually composed of an input layer, hidden layer, output layer, and input and output delay [
12]. In general, the NARX neural network model can be expressed as
where
is the input, and
is the output. Since the input of the network includes the output feedback of the network, the dynamic characteristics of the parameter time series related to the degradation of battery performance can be well reflected.
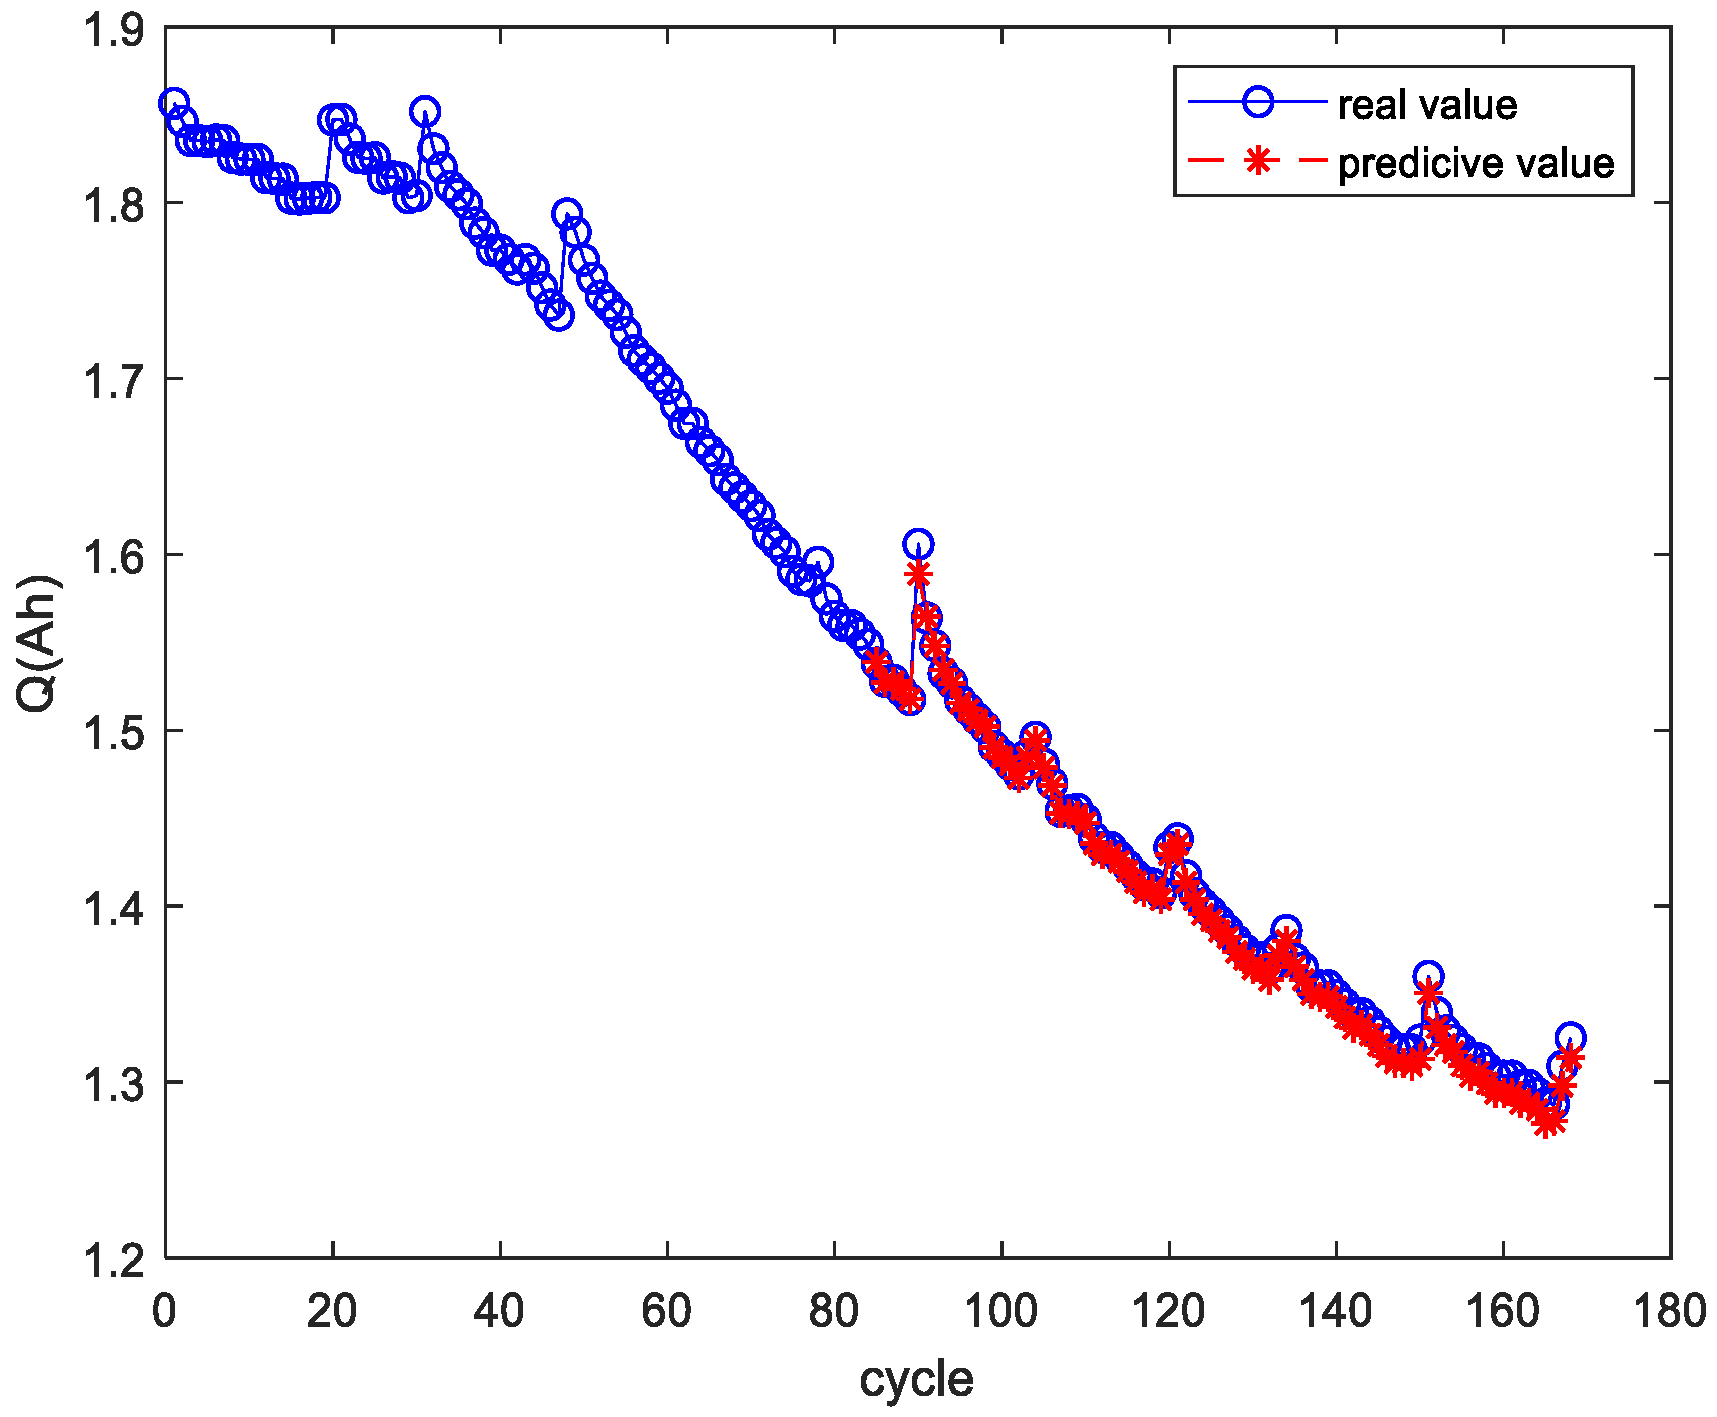
The proposed capacity estimation method is tested using B5 battery life cycle data. The B5 battery contains a total of 168 cycles of battery charge and discharge data. Five indirect parameters of the first 84 cycles of the B5 battery are firstly extracted. Then, the PCA method is used to reduce the dimensions of the extracted indirect parameters to obtain the comprehensive health factor for the first 84 cycles. The relationship between measured battery capacity and comprehensive health factor is then obtained by taking the comprehensive health factor as input and the measured capacity data of the first 84 cycles as the output. Finally, the comprehensive health factor after PCA conversion of the last 84 cycles of the B5 battery is taken as the input of the above model, and the remaining capacity of the last 84 cycles can be estimated, which will be compared with the true values.
Figure 5 shows the estimation result, and the root-mean-square prediction error was 0.0054.
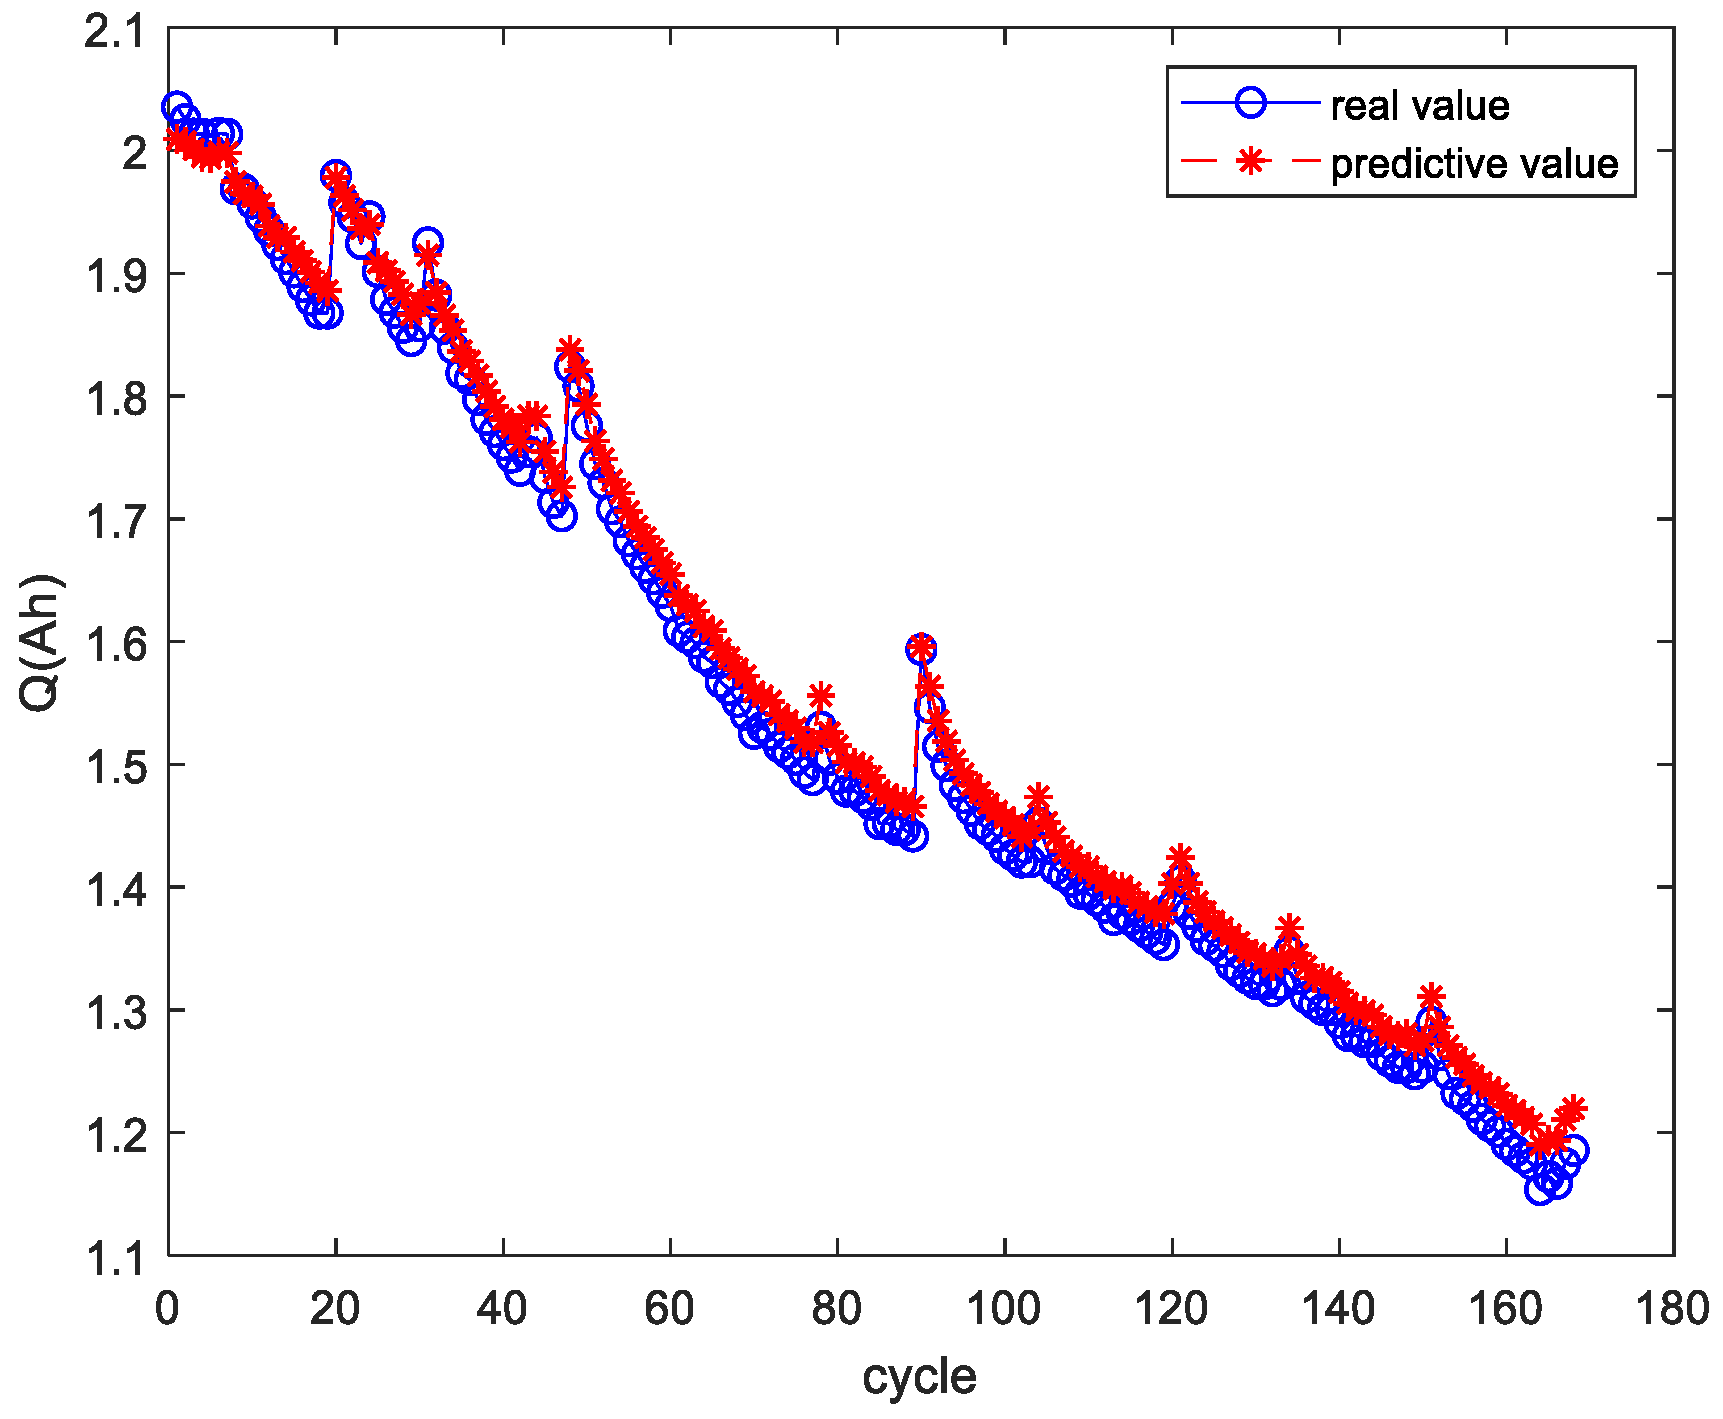
In order to assess the generalization capability or adaptability of the proposed capacity estimation method, the B5 battery life cycle data are used to establish the model between the remaining capacity and the comprehensive health factor. Then, the comprehensive health factor after PCA conversion of the B6 battery life cycle is taken as the input for the above model, and the capacity value of the B6 battery life cycle can be estimated.
Figure 6 shows the estimation result, and the root-mean-square prediction error was 0.0226. The test results verify the effectiveness of the proposed capacity estimation method. B5 and B6 used in the simulation are the same type of batteries, and the prediction model can work normally. However, considering that there may be great differences between different types of batteries, if the relationship model between measured battery capacity and comprehensive health factor, established by using B5 battery data, is used to estimate the capacity of different types of batteries, it may not be applicable. In this case, it is necessary to obtain the data of the battery to be estimated and rebuild the model.
3. Proposed Lithium-Ion Battery Rul Prediction Method
Particle filter (PF) can solve nonlinear and non-Gaussian problems, and it does not have too many restrictions on state variables. Therefore, in view of the characteristics of battery RUL prediction, such as when the amount of known historical data is small, the degradation process is nonlinear, and the degradation process is complex, PF is very suitable to predict RUL of batteries. Because the standard PF algorithm has problems of particle degradation and insufficient samples, which may cause deviations in the obtained results, we introduce the PF based on the Kendall rank correlation coefficient (KCCPF) into the battery RUL prediction.
3.1. Particle Filter Based on the Kendall Rank Correlation Coefficient (KCCPF)
To describe the dynamic system, define the transition equation and measurement equation are used as follows:
where
and
are the transition function and measurement function,
is the measured value,
is the state value, and
and
are independent process noise and measurement noise.
The purpose of Bayesian estimation is to use known measurement information to recursively estimate the system state variable . All information of the state variable is contained in the posterior probability density . Taking the probability density function of the state variable as the prior knowledge, the process of recursive estimation can be divided into two steps.
- (1)
Prediction process. Prior probability distribution of
is obtained by the following formula:
- (2)
Update process. The posterior probability distribution is calculated using the measured values and the following updated formula:
However, this recursive method for calculating the posterior probability is only a theoretical method, and it is difficult to directly calculate it in actual situations. For complex nonlinear systems, such as the lithium-ion battery system in this article, PF can be used to obtain the suboptimal solutions.
The KCCPF algorithm is a regularized PF algorithm. In the resampling step of the PF algorithm, a kernel function is introduced. Through the calculation of the kernel function, the weight of each particle in the sample set is continuously adjusted to avoid discarding a large number of particles with smaller weights and increase the sample diversity in the sample set. The kernel function introduced in the algorithm resampling step is based on the concept of the Kendall rank correlation coefficient. The kernel function recalculates the weight of the resampled particles according to a short time series of measured values
with length
L, so that the weight of the particles with strong correlation becomes larger, and the weight of particles with weak correlation becomes smaller [
13].
The KCCPF algorithm flow can be described as follows:
- (1)
Initialization. Sampling particle set , , according to the known prior probability density .
- (2)
Importance weight calculation. Sample
according to
and update the particle weight:
where
is the recommended distribution density, and
is the transition probability density.
A simple and effective strategy is to sample from the transition probability density of the state variables [
14]:
Then, the corresponding weight update process of (7) is simplified as
- (3)
Normalization of the importance weights:
- (4)
Initialization of the resampling process. Calculate the effective sample size
, set the resampling threshold
; when the calculated effective sample number
, the resampling process is performed.
- (5)
Prepare system measurement value sequence and sample estimate value matrix. The actual measurement value
of the system and the measurement value
generated by the samples in the sample set
are constantly updated over time. In continuously updating the measured value, we selected a sequence of measured values of length
L starting from the current time point k. For the actual measurement value of the system, we selected
. For the measurement value continuously updated from the sample set, we selected
:
- (6)
Calculate the correlation coefficient matrix. For the actual measured value series
and the sample estimated value matrix
, calculate the correlation coefficient. Two sets of random variables
and
can be combined into a pair to form a set of time series data pairs
. For the two data pairs
and
under the condition
, if they satisfy
and
, or
and
, the two data pairs are said to have the same consistency; if they satisfy
and
, or
and
, the two data pairs are said to have different consistency; if
or
, the two data pairs are not consistent. The Kendall rank correlation coefficient is the ratio of the difference between the data pairs with the same consistency and the data pairs with different consistency to the total number of combinations. Its calculation formula can be expressed as
where
P and
Q are the number of data pairs with the same consistency and the number of data pairs with different consistency, respectively.
- (7)
Recalculate the sample weight. The calculated correlation coefficient is between −1 and 1. In order to transform it into a positive range, an exponential function with parameters is used to process the correlation coefficient:
Parameter
in Formula (14) is used to adjust the degree of dispersion of particle weights in the sample. When
, the value of
is concentrated toward the origin, the value range of parameter
tends to shrink, and the corresponding particle weights are also more concentrated; when
,
diverges from the origin to both ends, the value range of parameter
tends to expand, and the corresponding particle weights tend to have a larger dispersion. The value of the parameter cannot be too large, otherwise calculation of the exponential function will cause the parameter to be too small or too large, resulting in a shortage of samples. This paper adopted the proposition from the literature [
13], where the value of
is set to 10. The new sample weights are
- (8)
Weight normalization and state estimation. First normalize the weights by (10), and then estimate the state:
- (9)
Determine whether to end. If yes, exit the algorithm, otherwise return to step (2).
3.2. Lithium-Ion Battery Capacity Decay Model
Literature [
15] shows that the battery capacity decreases in the form of an exponential function during the continuous charge and discharge cycle:
where
is the remaining capacity,
k is the charge and discharge cycle, and
a,
b,
c, and
d are the parameters.
The double exponential empirical degradation Model (17) is derived by a polynomial, and we can get
According to the capacity decay Model (18), the transition equation and measurement equation at time
k can be expressed as
where
is the state estimation of the remaining capacity, and
is the measured value of the remaining capacity.
The model can effectively improve the RUL prediction performance and shorten the running time of the prediction algorithm [
16].
3.3. Proposed Lithium-Ion Battery Rul Prediction Method
The PF method needs to substitute the measured value of the current moment to update in the iterative process, and the remaining capacity data of the batteries are often difficult to be obtained online. In actual engineering, the ampere-hour integration method is usually used to estimate the data. The error is large. In this work, the battery capacity estimation method in
Section 2 was used to estimate the capacity value in the current cycle. Then, the estimated capacity is used to replace the measured value, which is more feasible in practical application scenarios.
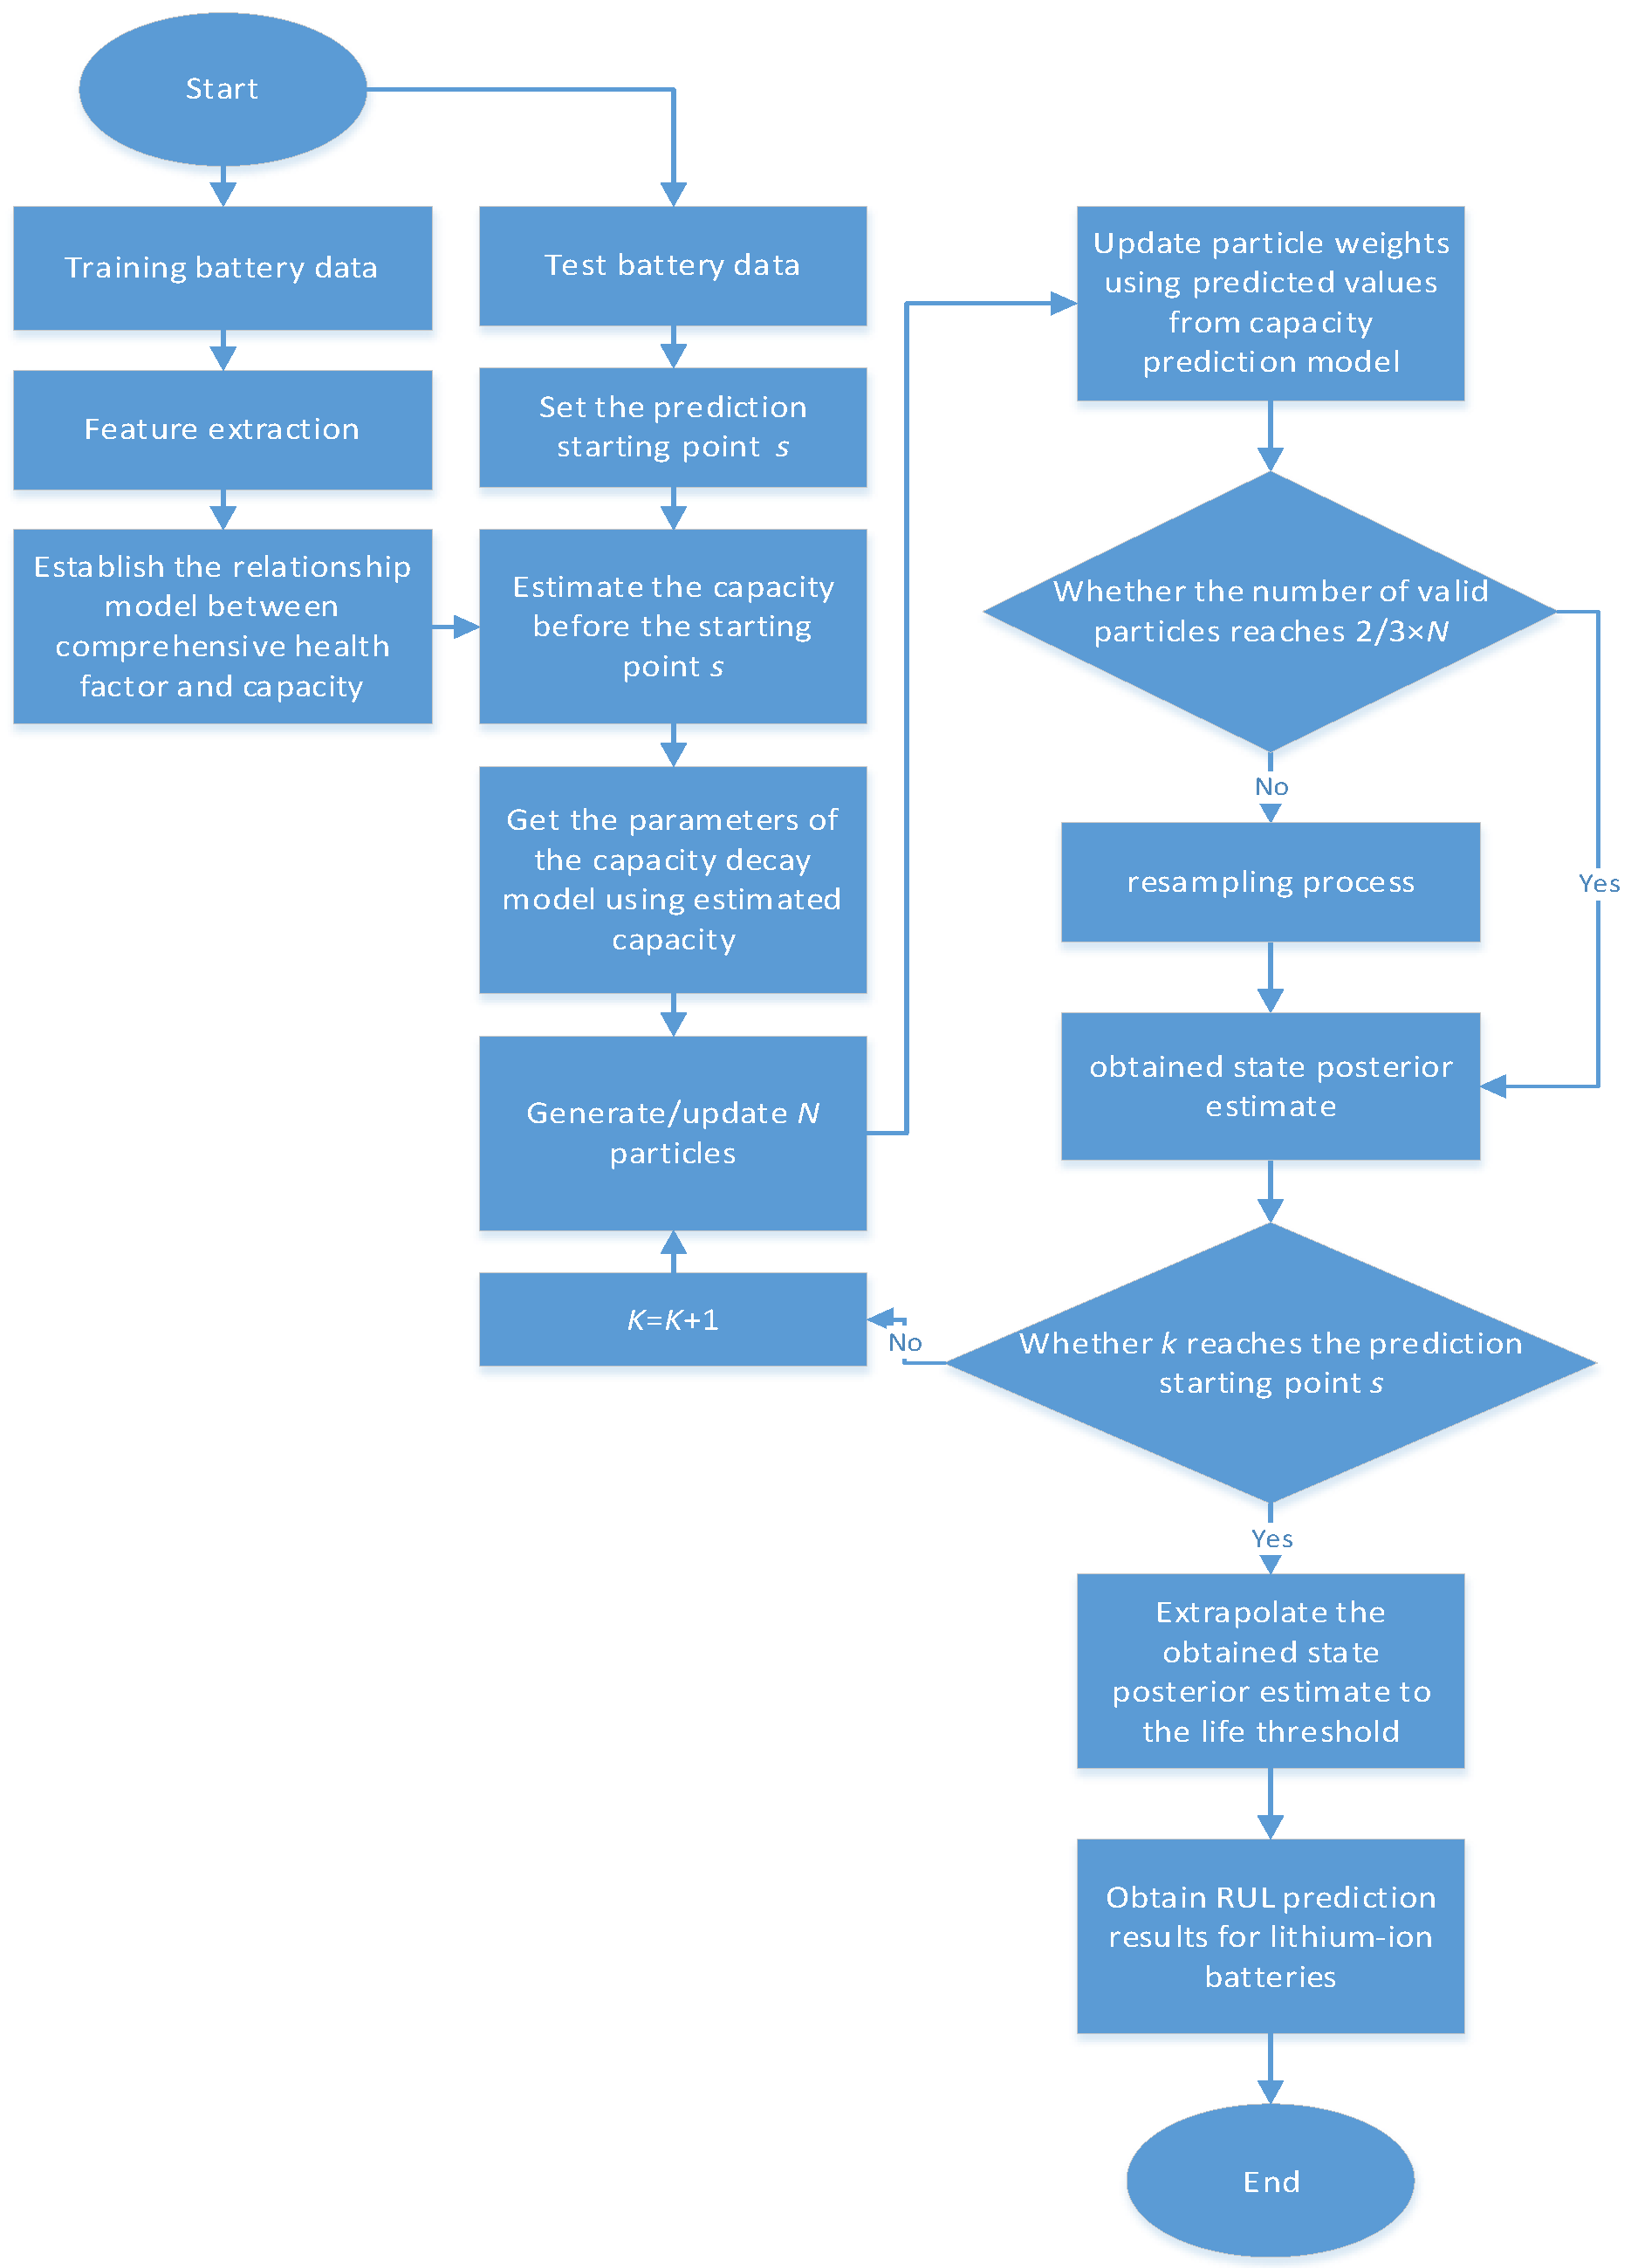
Figure 7 shows the flow chart of the proposed method. The whole forecasting process mainly includes three parts: estimating battery capacity, determining the capacity decay model parameters, and predicting the RUL of the battery. Steps of the proposed method are as follows:
- (1)
Focus on the training battery data to establish the relationship model between health factor and capacity;
- (2)
Set the prediction starting point s and battery life threshold;
- (3)
Obtain the indirect parameter data before the starting point of the lithium battery to be predicted, and obtain the estimated value of capacity based on the model established in (1);
- (4)
Estimate the parameters of the capacity decay Model (18);
- (5)
Given the number of sampled particles N, noise variance and , and the resampling threshold ;
- (6)
Substitute the measured value into the system state model, update the particle weights, and then obtain the posterior estimate of the system state when predicting the starting point;
- (7)
Extrapolate the obtained state posterior estimate to the life threshold according to the capacity decay model, and obtain the RUL predicted value and corresponding posterior probability density function (PDF).
4. Experiment and Analysis
The 40th and 80th cycles were selected as the starting point for early and late predictions, and RUL predictions were made using standard PF and KCCPF. In this section, the B5 battery data were trained to establish the relationship model between health factor and capacity, and B6 battery data were used as test data for RUL prediction.
There are three parameters b, c, and d in the improved Model (18). Considering that the PF algorithm has a good parameter estimation ability, we will use the PF algorithm to estimate the parameters.
According to the capacity decay Model (17), taking the parameters as the system state, the transition equation and measurement equation at time
k are
The steps of parameter estimation are as follows:
- (1)
Determine the initial values of Model (17) parameters. Fit the B5 battery life cycle capacity data using MATLAB, and then use the fitted parameters as the initial values of the parameters in Model (17) of the B6 battery. The fitted parameters are shown in
Table 2.
- (2)
Parameter Estimation. The capacity estimation value of the B6 battery is used to replace the measured value, and the parameters are updated using the PF algorithm according to (22) and (23).
Because the parameters in the improved Model (18) have changed to three, here we only recorded the values of
b,
c, and
d.
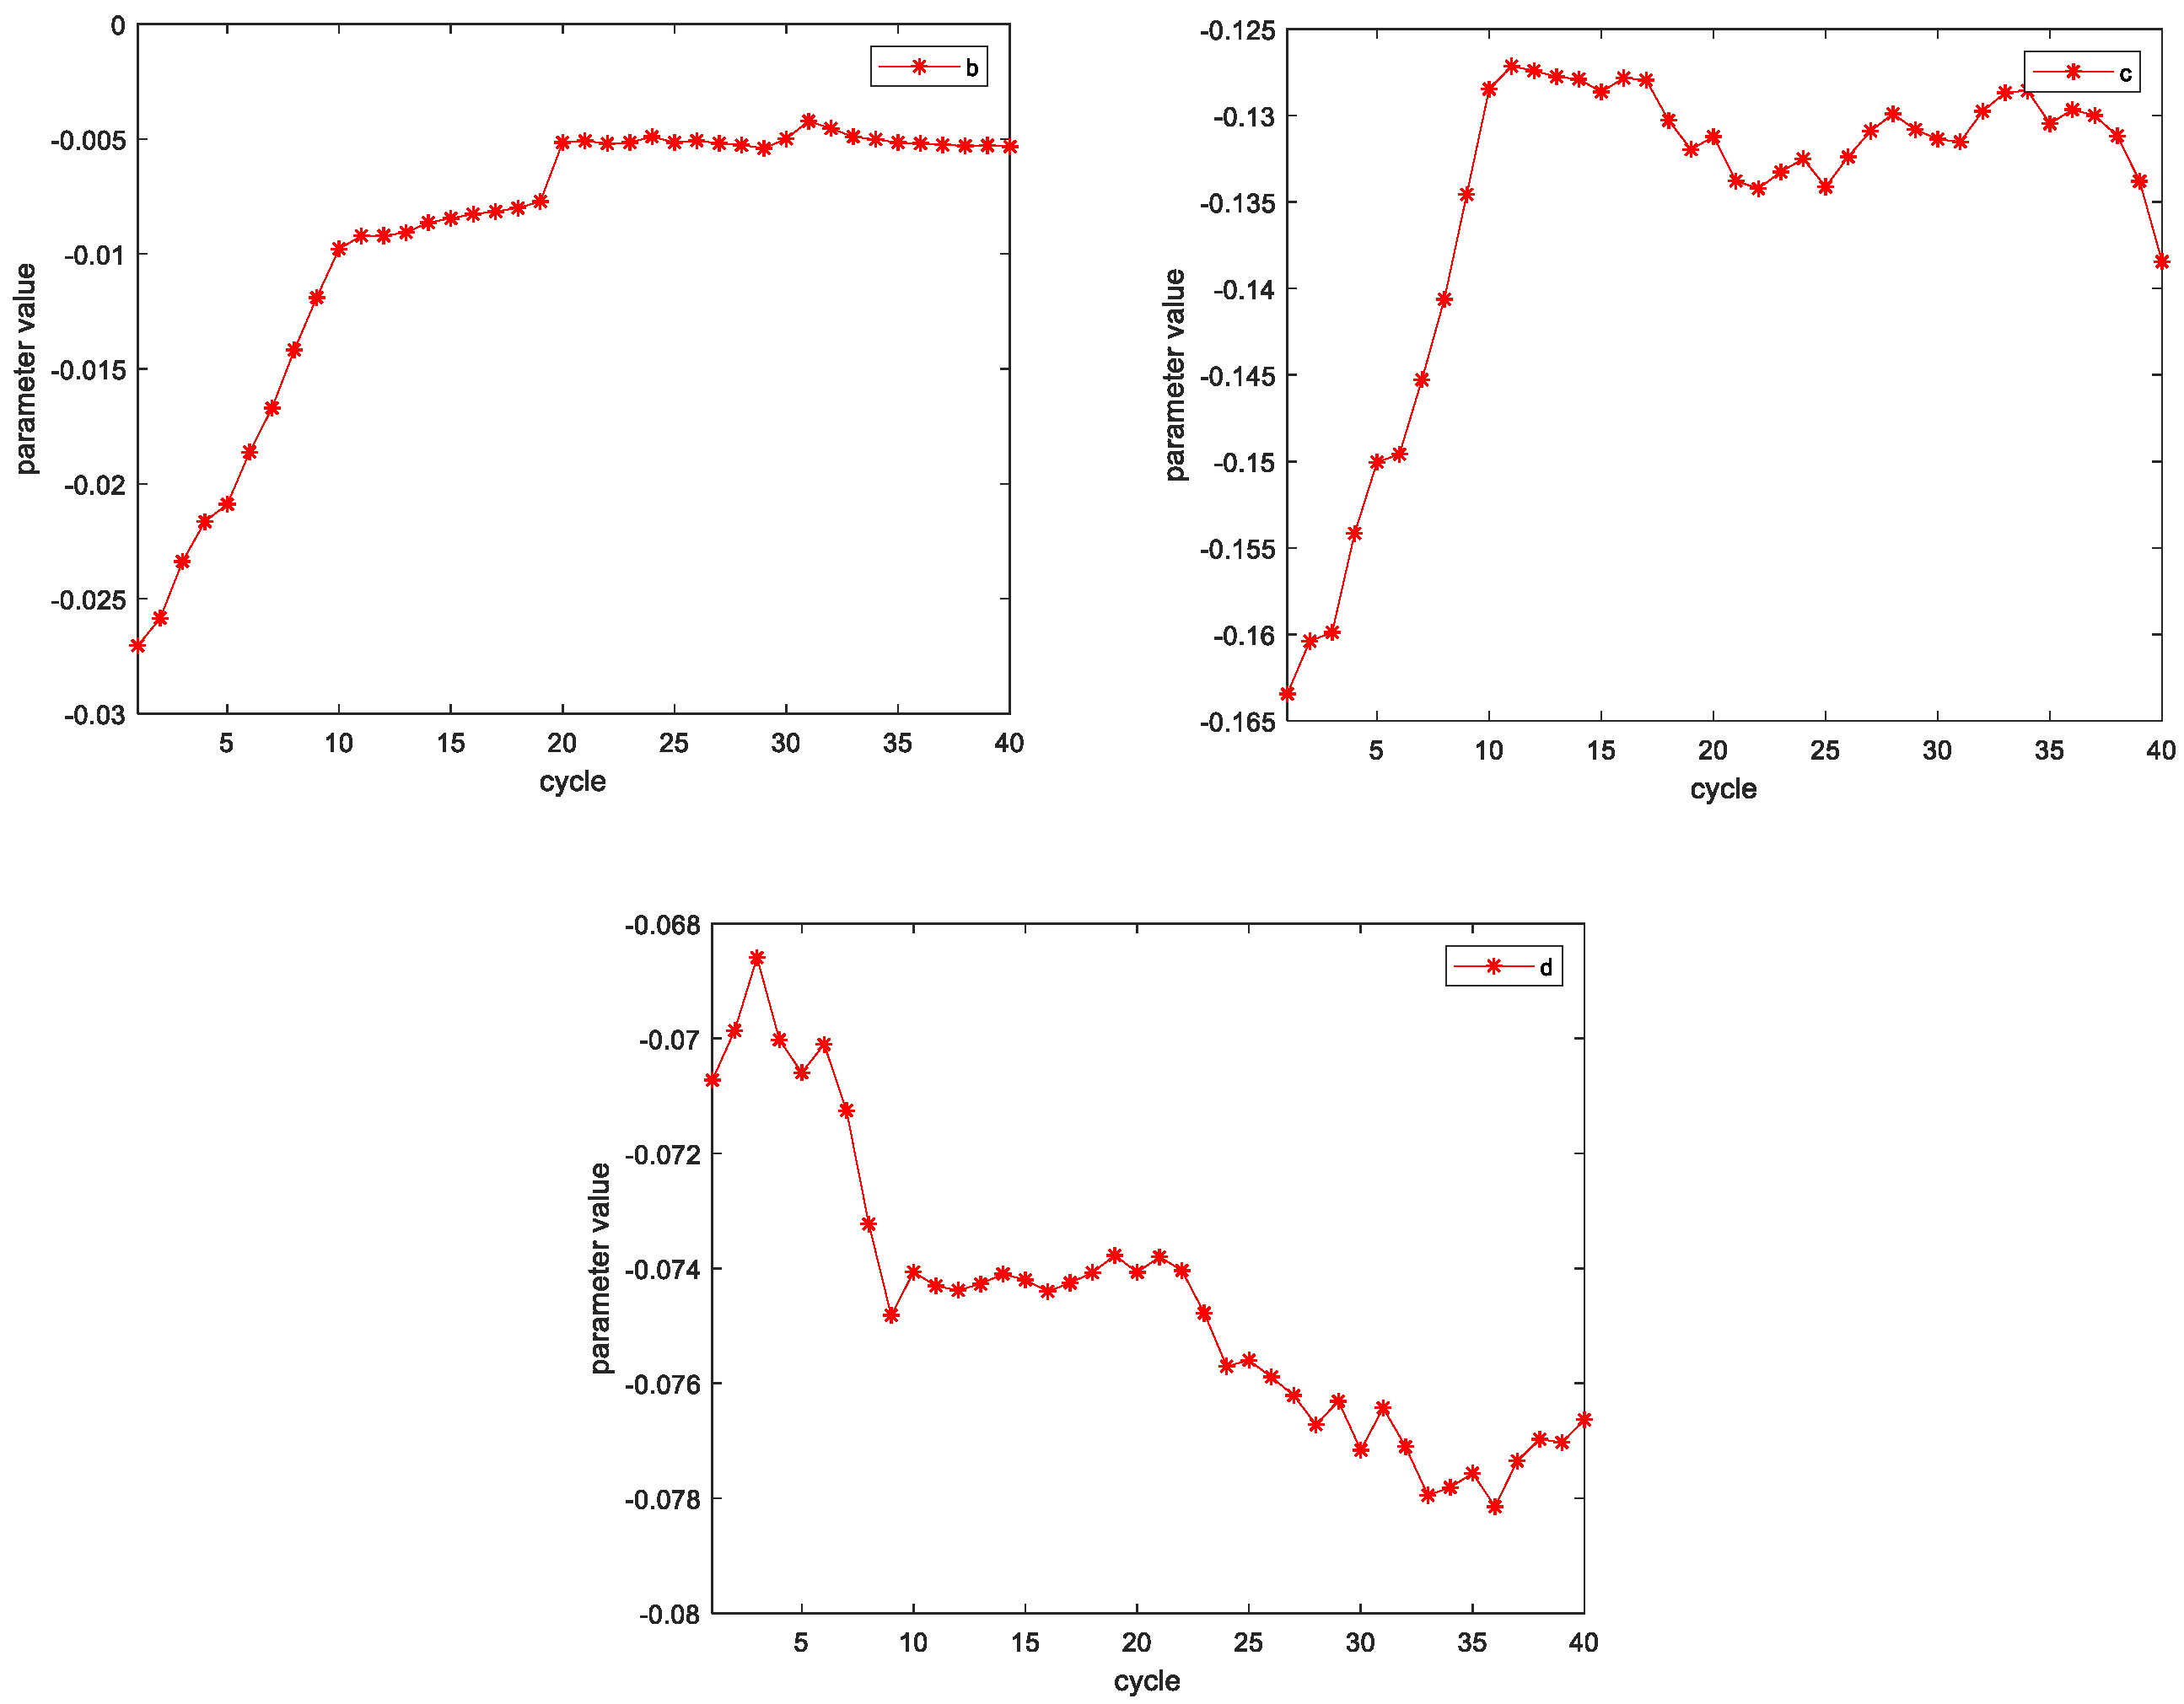
Figure 8 shows the estimation process of parameters
b,
c, and
d when the B6 battery is updated to the 40th cycle. The same method is also applicable when the prediction starting point is the 80th cycle.
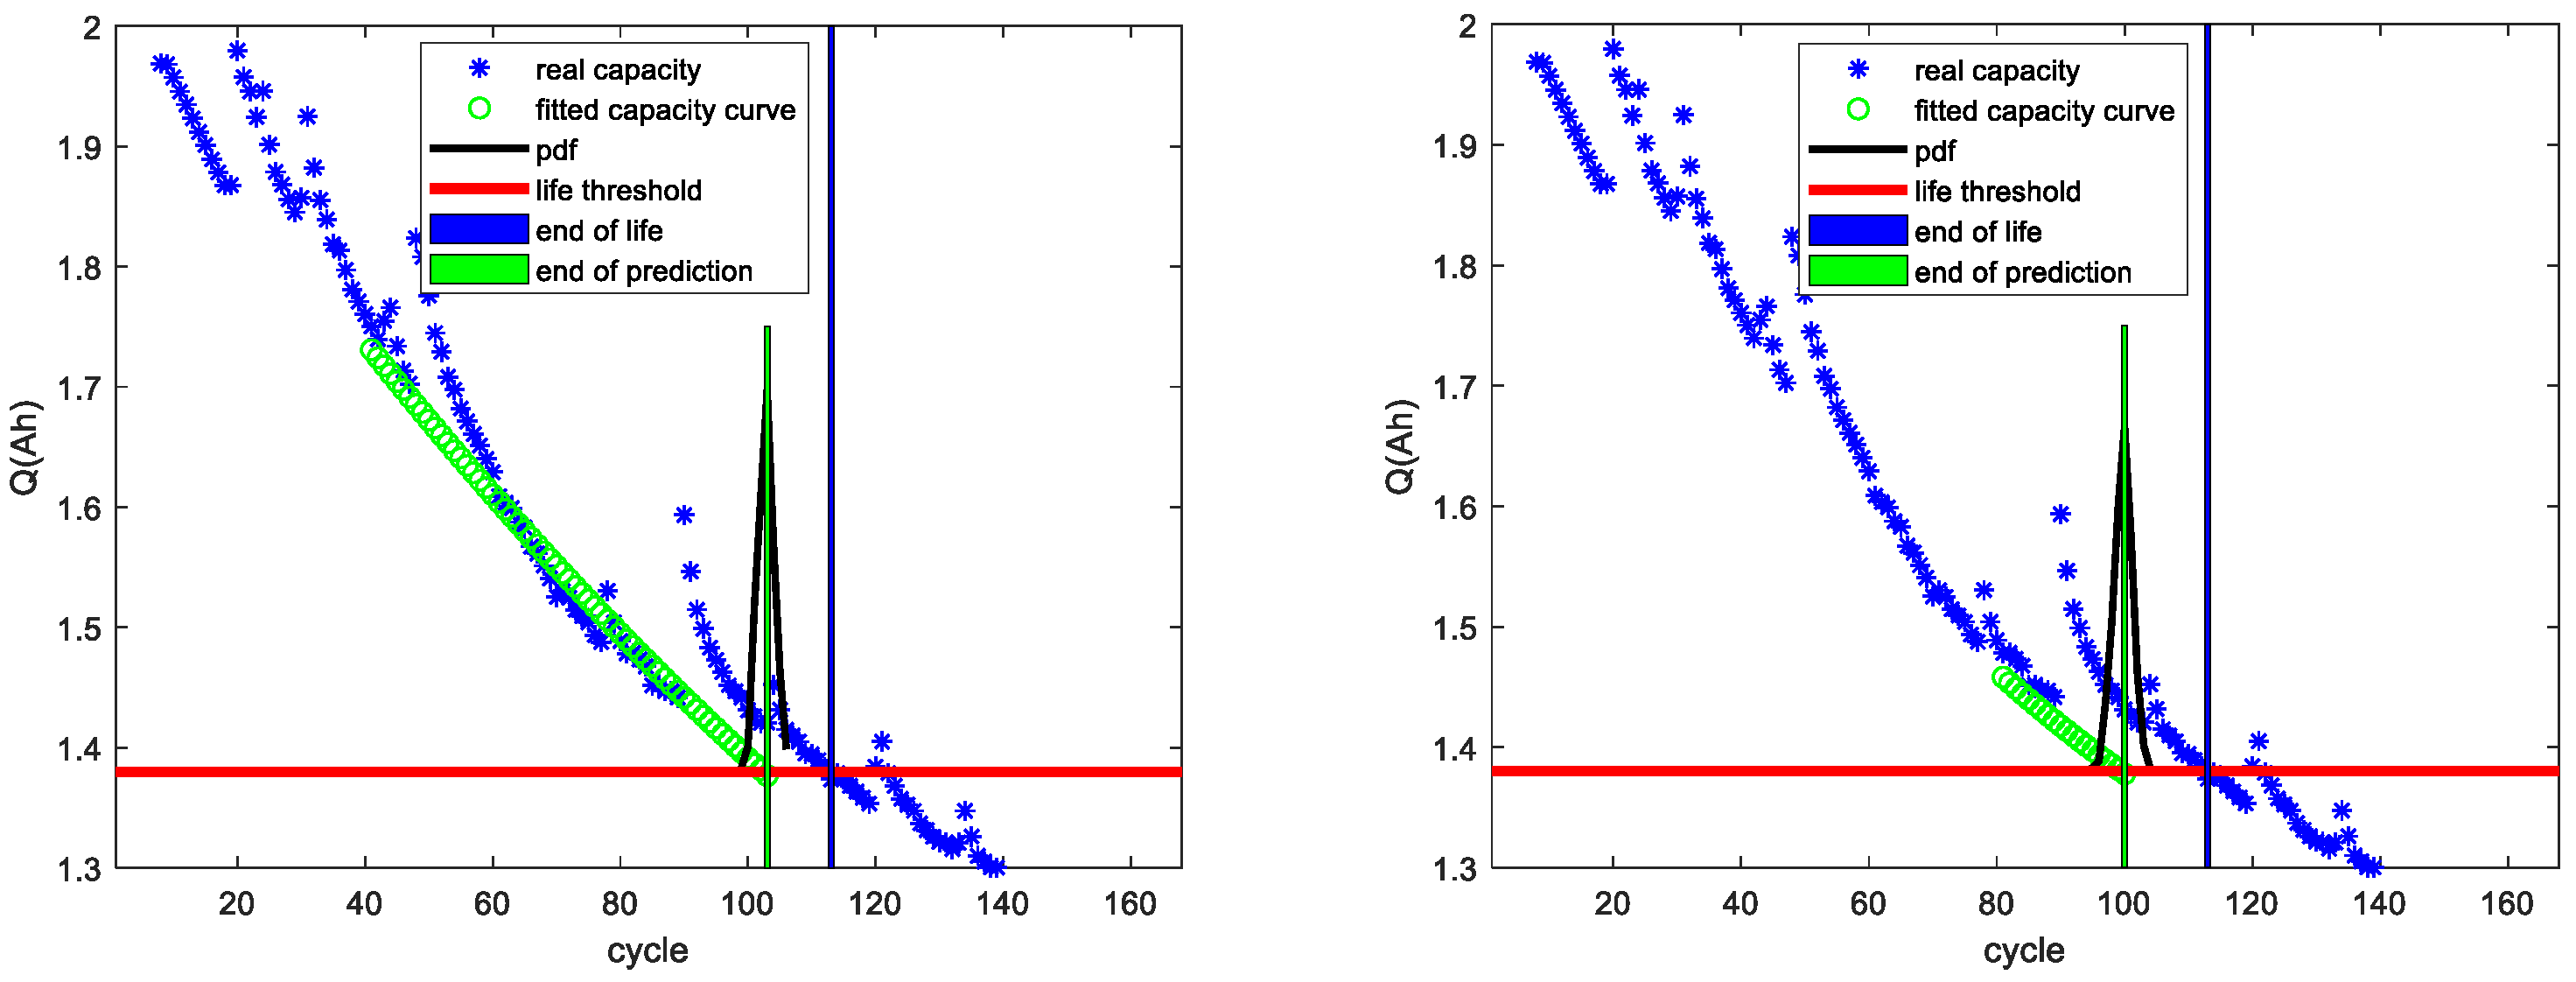
Figure 9 and
Table 3 show the RUL prediction results of the B6 battery using standard PF. The left picture in
Figure 9 shows the RUL prediction result at the 40th cycle. The predicted remaining life cycle was 63, the actual remaining life cycle was 73, and the error was 10 cycles. The picture on the right shows the RUL prediction result at the 80th cycle. The predicted remaining life cycle was 20, the actual remaining life cycle was 33, and the error was 13 cycles.
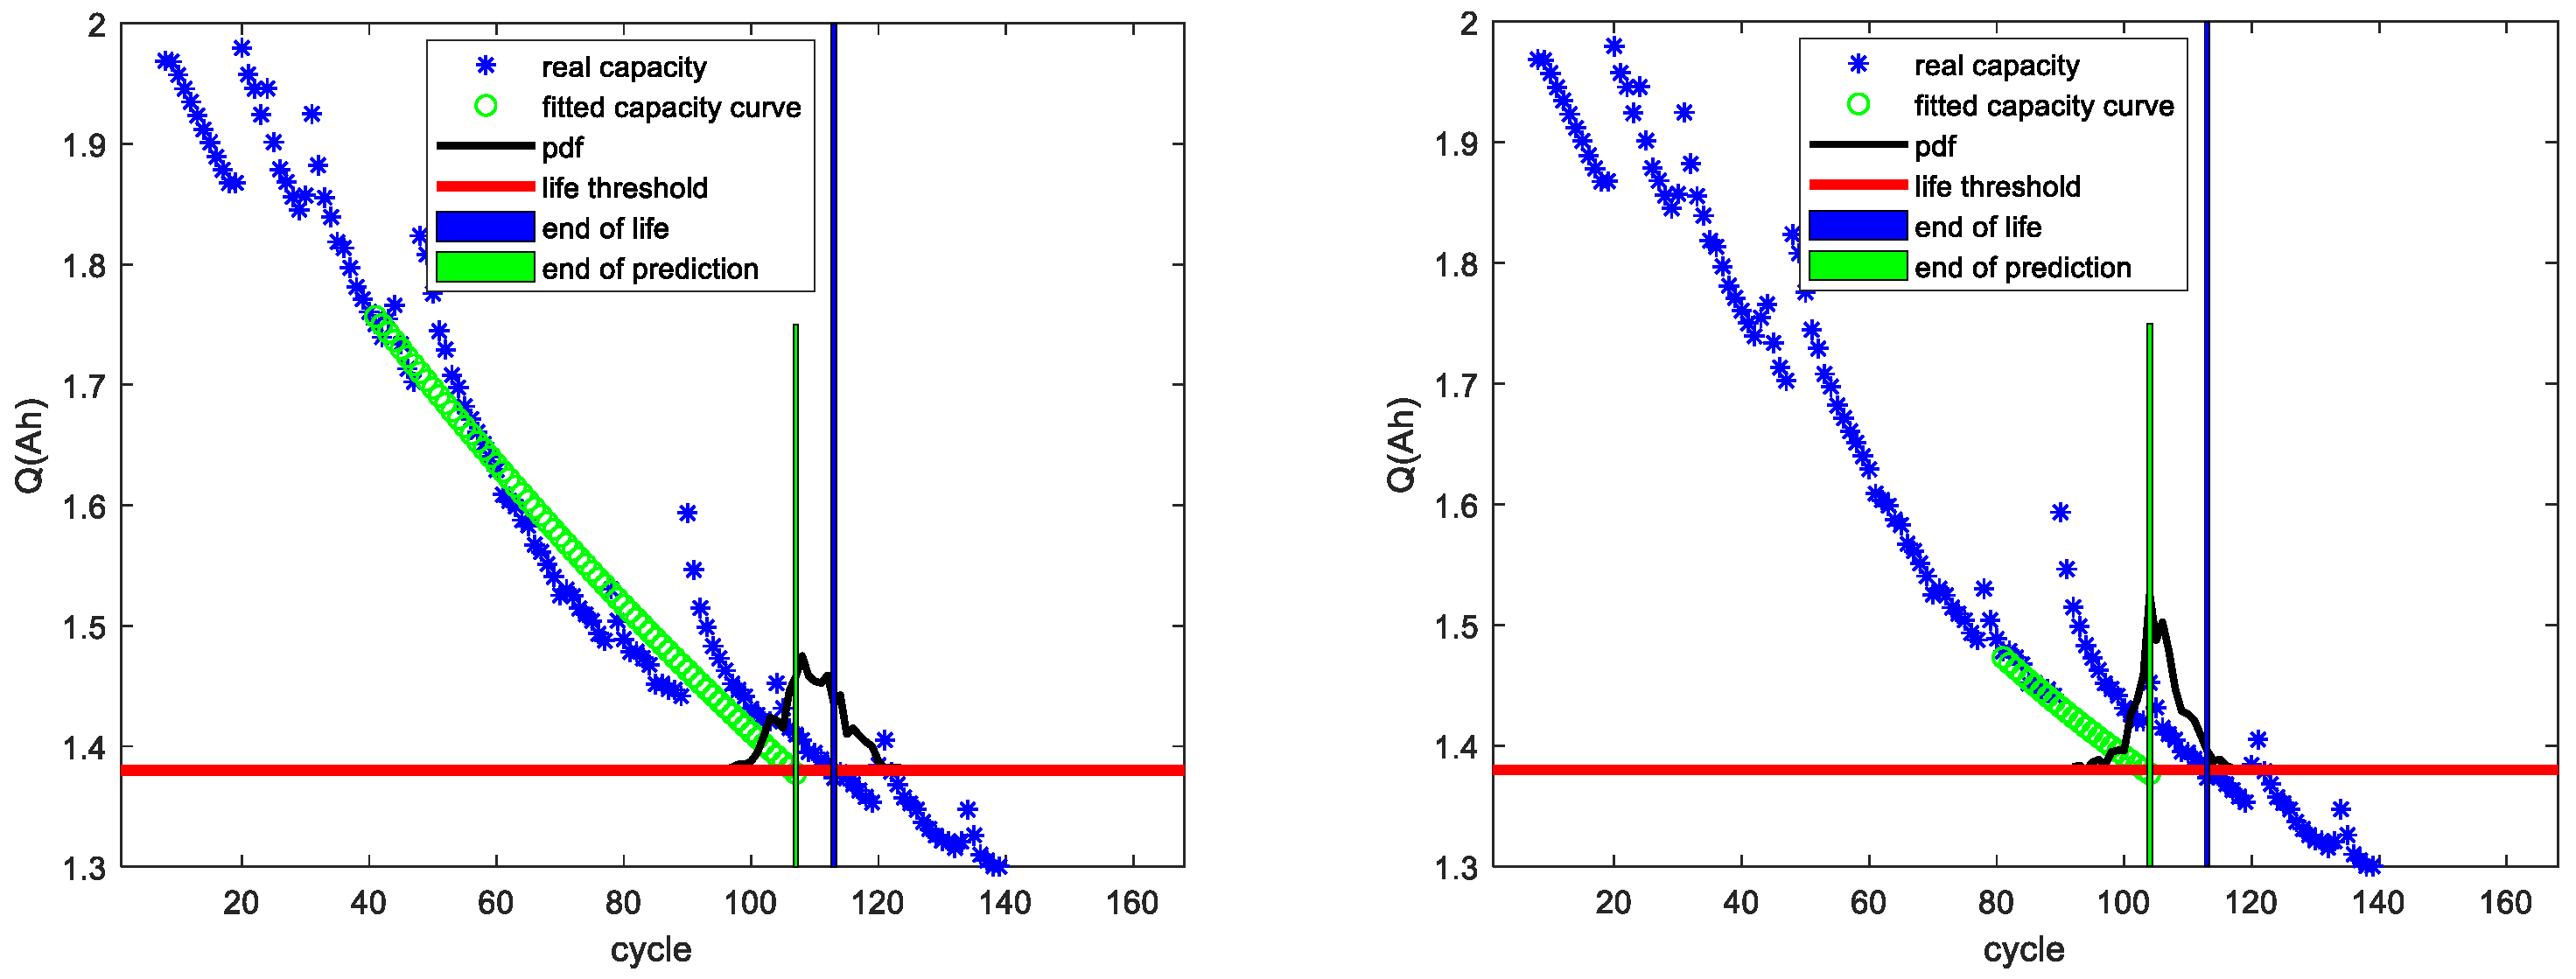
Figure 10 and
Table 4 show RUL prediction results of the B6 battery using KCCPF. The left picture in
Figure 10 shows the RUL prediction result at the 40th cycle. The predicted remaining life cycle was 67, the actual remaining life cycle was 73, and the error was 6 cycles. The picture on the right shows the RUL prediction result at the 80th cycle. The predicted remaining life cycle was 24, the actual remaining life cycle was 33, and the error was 9 cycles.
The simulation results show that although there were still some errors, the model could be used to provide information about battery capacity degradation in practical applications. The validity of our proposed method is verified. At the same time, it can be seen that PDF of the prediction result using KCCPF was wider than the standard PF. This is because the KCCPF algorithm only adjusts the weight of each particle in the sample set, thereby avoiding discarding a large number of particles with smaller weights, and increasing the sample diversity in the sample set. In the KCCPF-based RUL prediction result, the true value of RUL was within the 95% confidence interval, while the prediction result using standard PF did not cover the true value of RUL. Therefore, in terms of the uncertainty expression of the prediction results, KCCPF had a relatively excellent prediction performance. Furthermore, compared with standard PF, KCCPF effectively improves the accuracy of predictions. The capacity root-mean-square errors were reduced by 21.8% and 11.9%, respectively, when the prediction starting points were the 40th and 80th cycles.
5. Conclusions
Regarding the problem that battery capacity is not easy to obtain online, this paper proposed to estimate battery capacity by analyzing the indirect parameters that can be measured during the battery discharge process. Then, the estimated capacity was used as the measured value of PF to predict the RUL of lithium batteries. Regarding the problems of particle degradation and lack of samples in PF, this paper adopted KCCPF in the battery RUL prediction. Simulation results verified the effectiveness of the proposed method for predicting the RUL of lithium batteries, which provides an effective reference for practical RUL prediction applications. Moreover, compared with the standard PF, the KCCPF algorithm can improve the RUL prediction performance.
