Multi-Label Learning for Appliance Recognition in NILM Using Fryze-Current Decomposition and Convolutional Neural Network


Abstract
1. Introduction
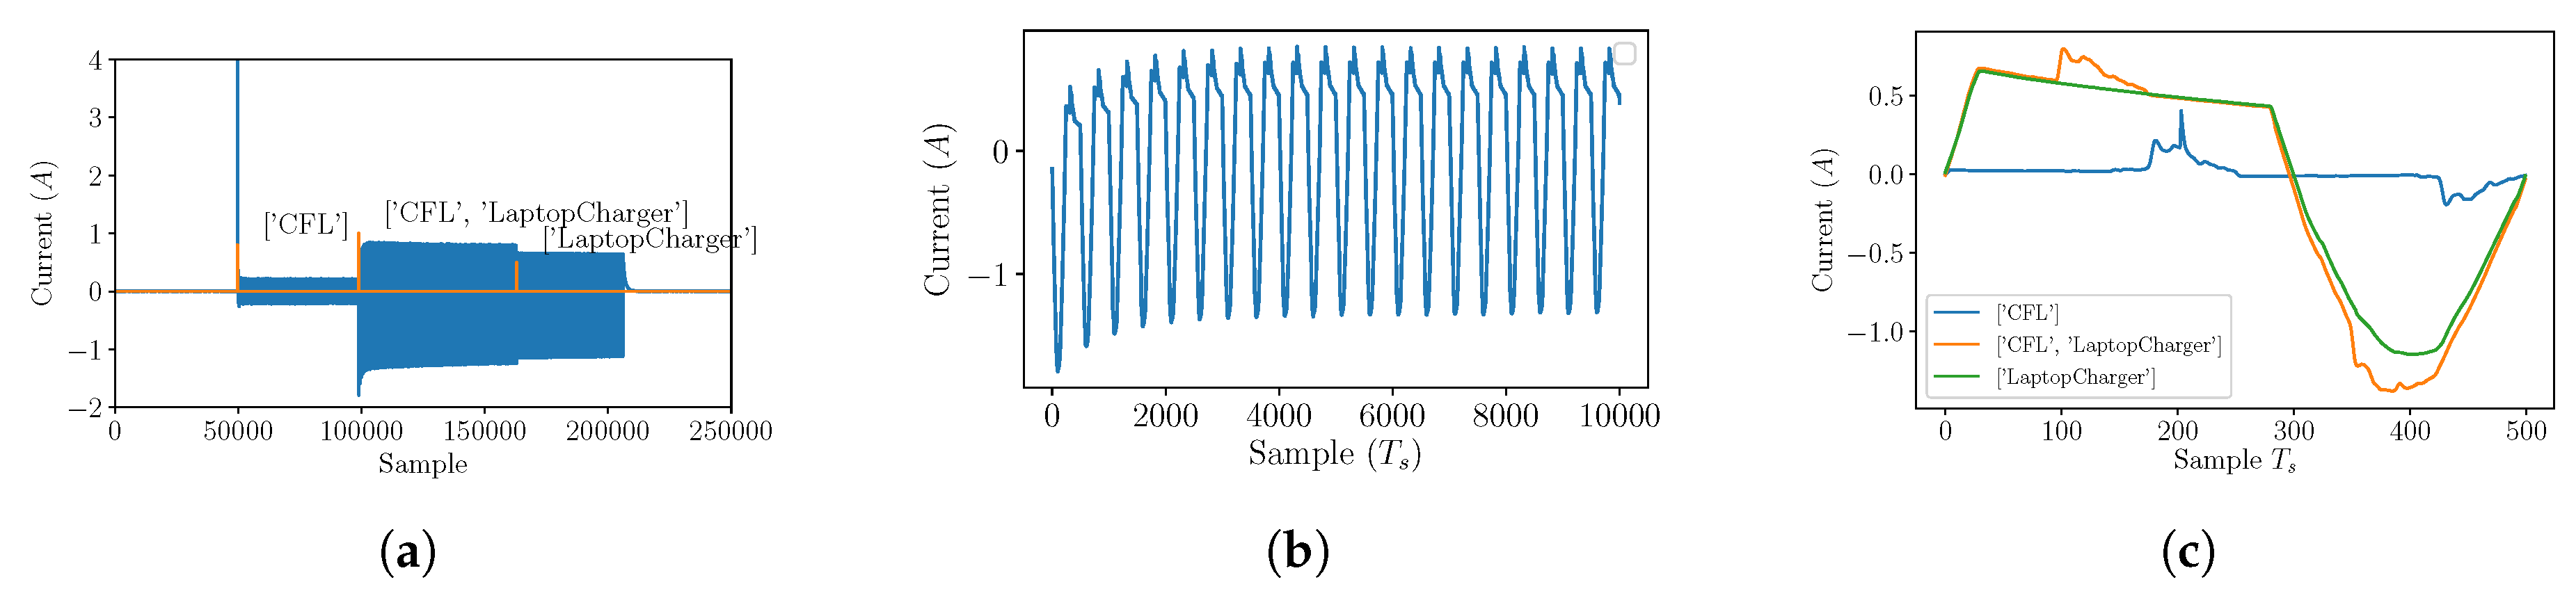
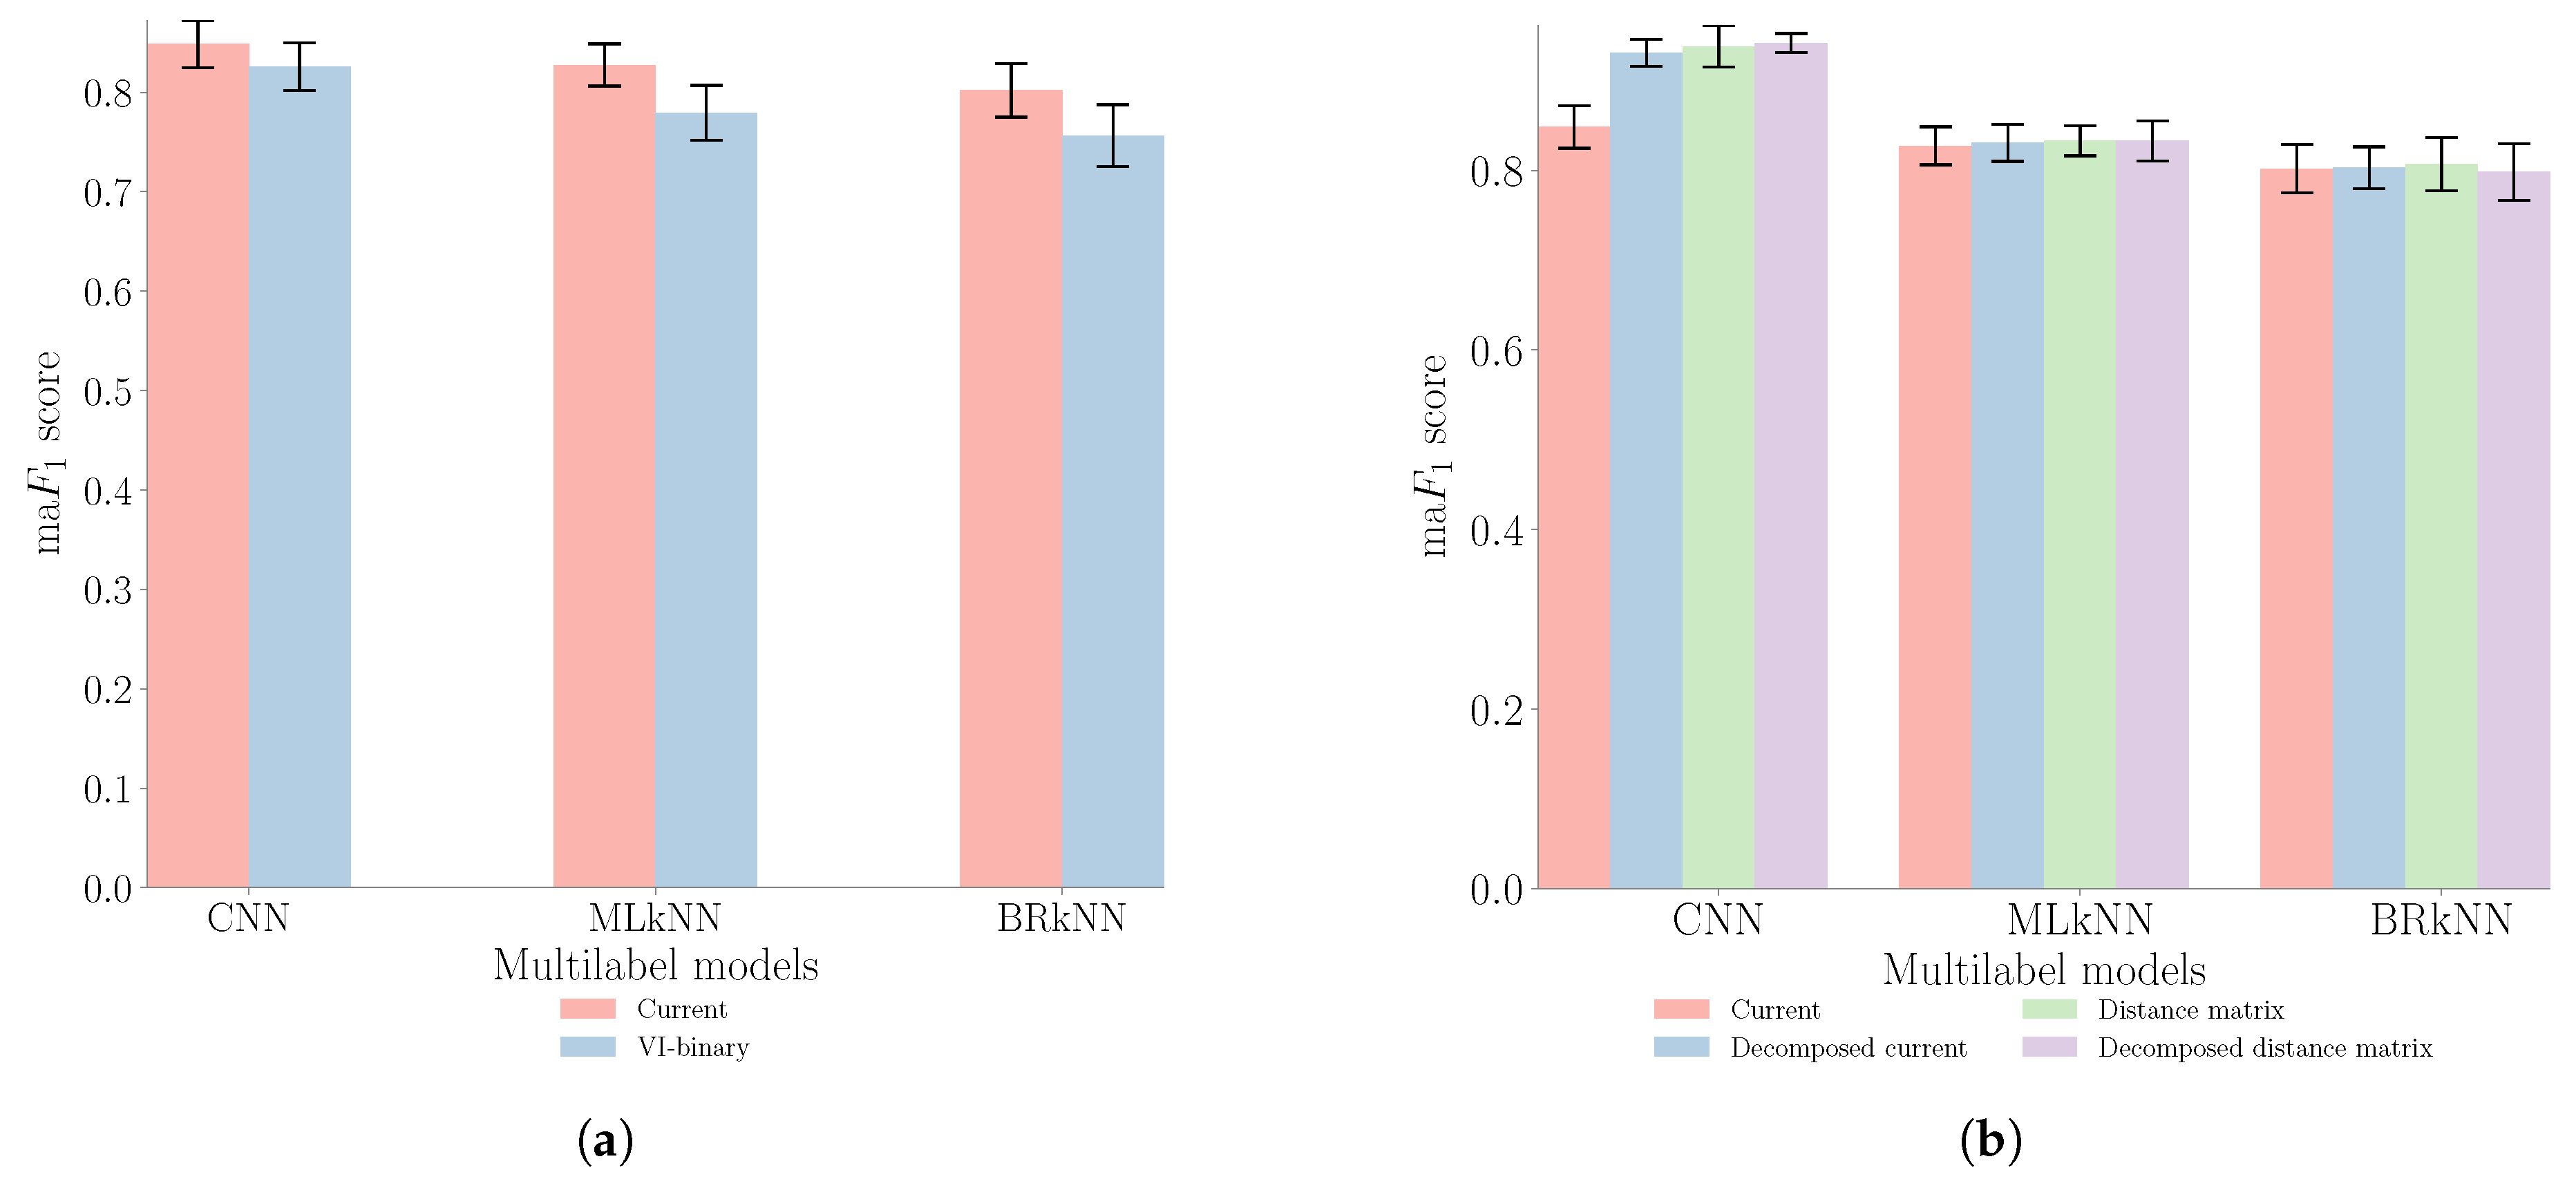
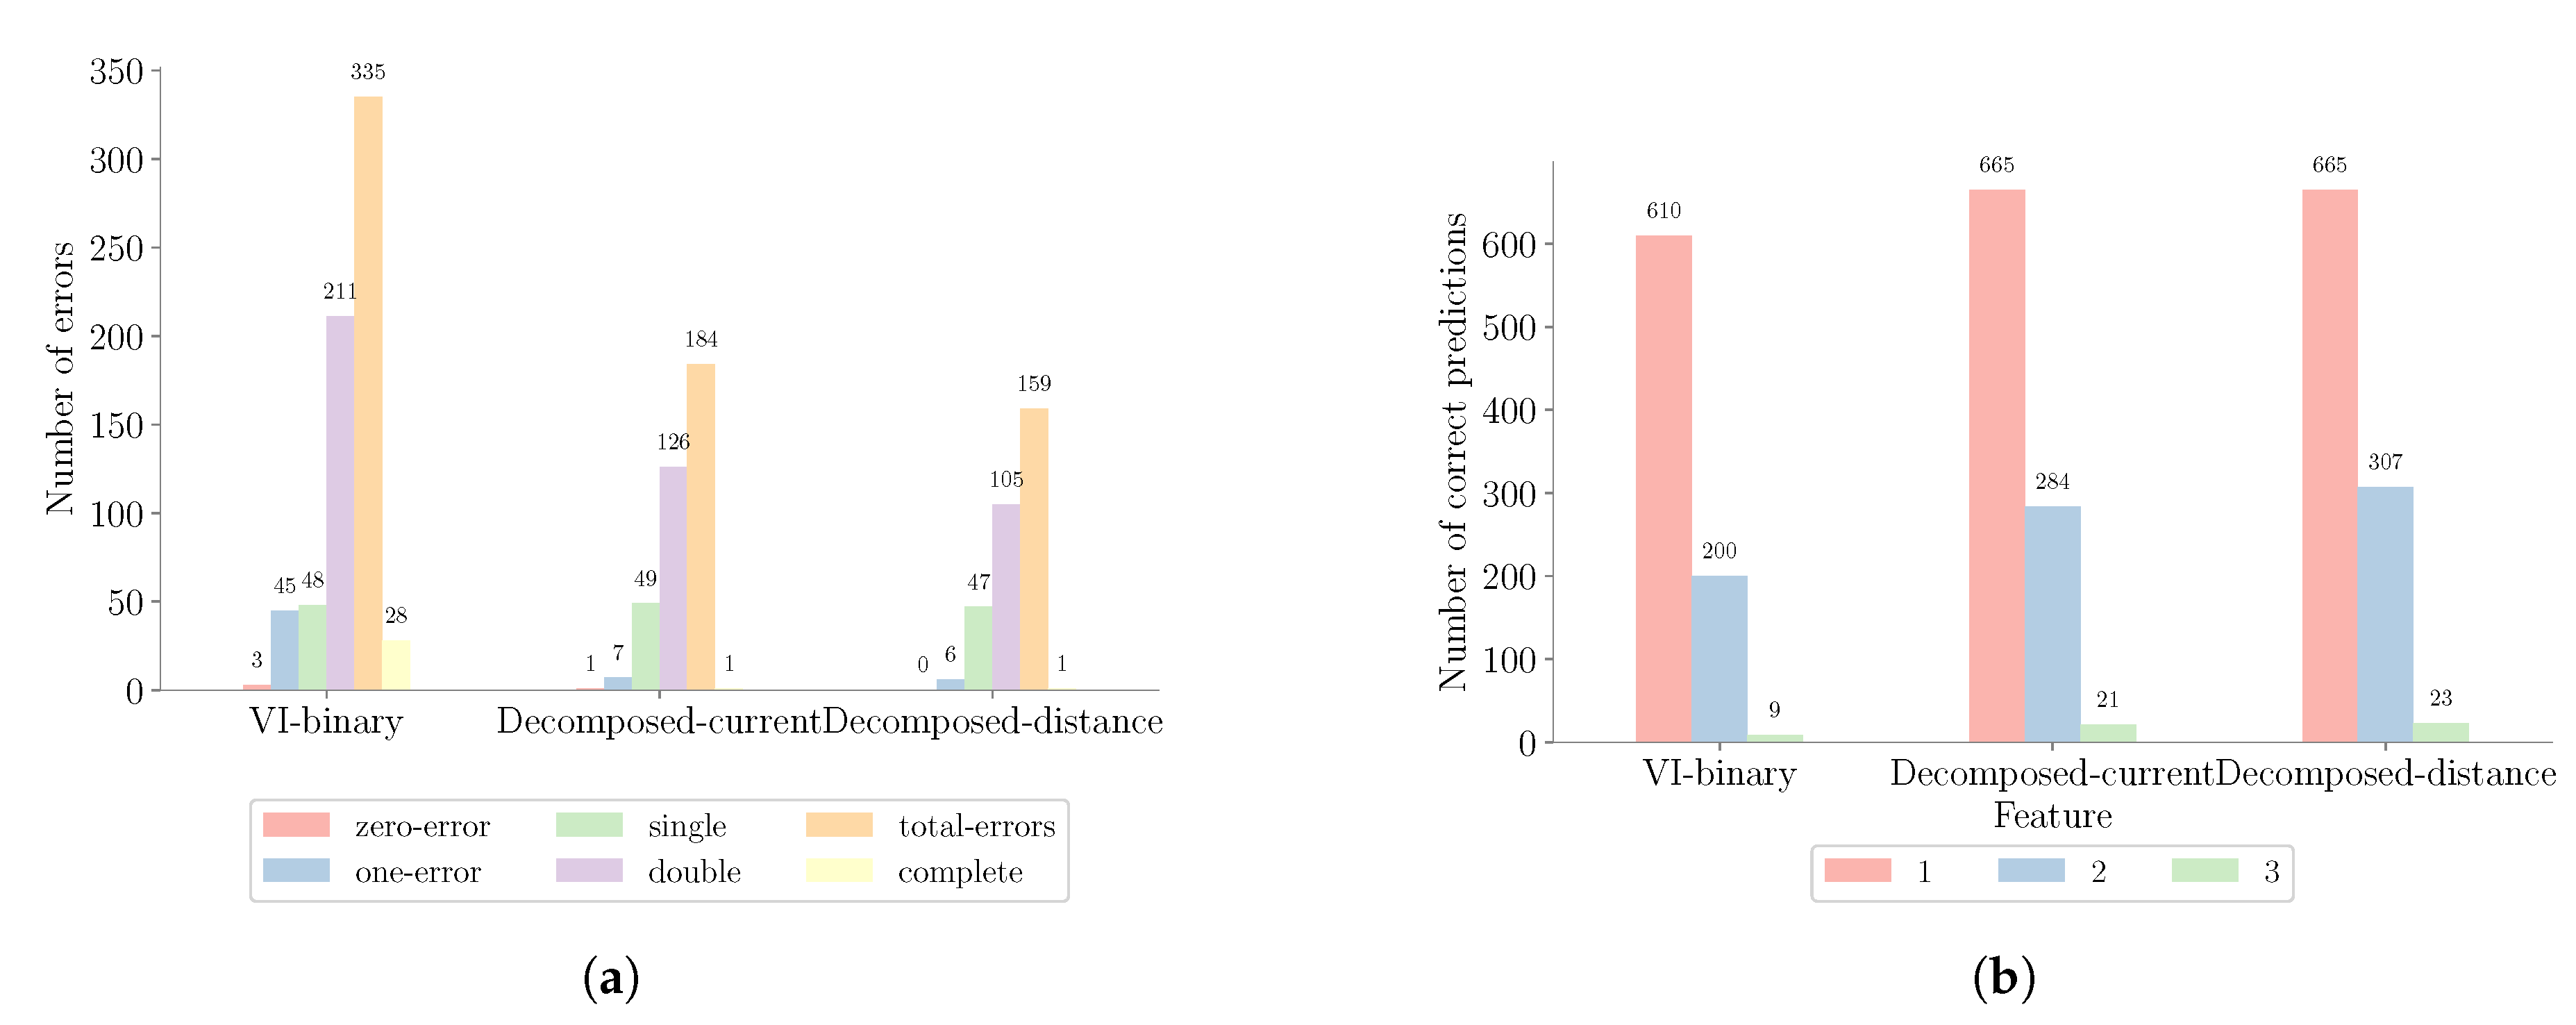
- We first demonstrate that for aggregated measurements, the use of activation current as an input feature offers improved performance compared to the regularly used V-I binary image feature.
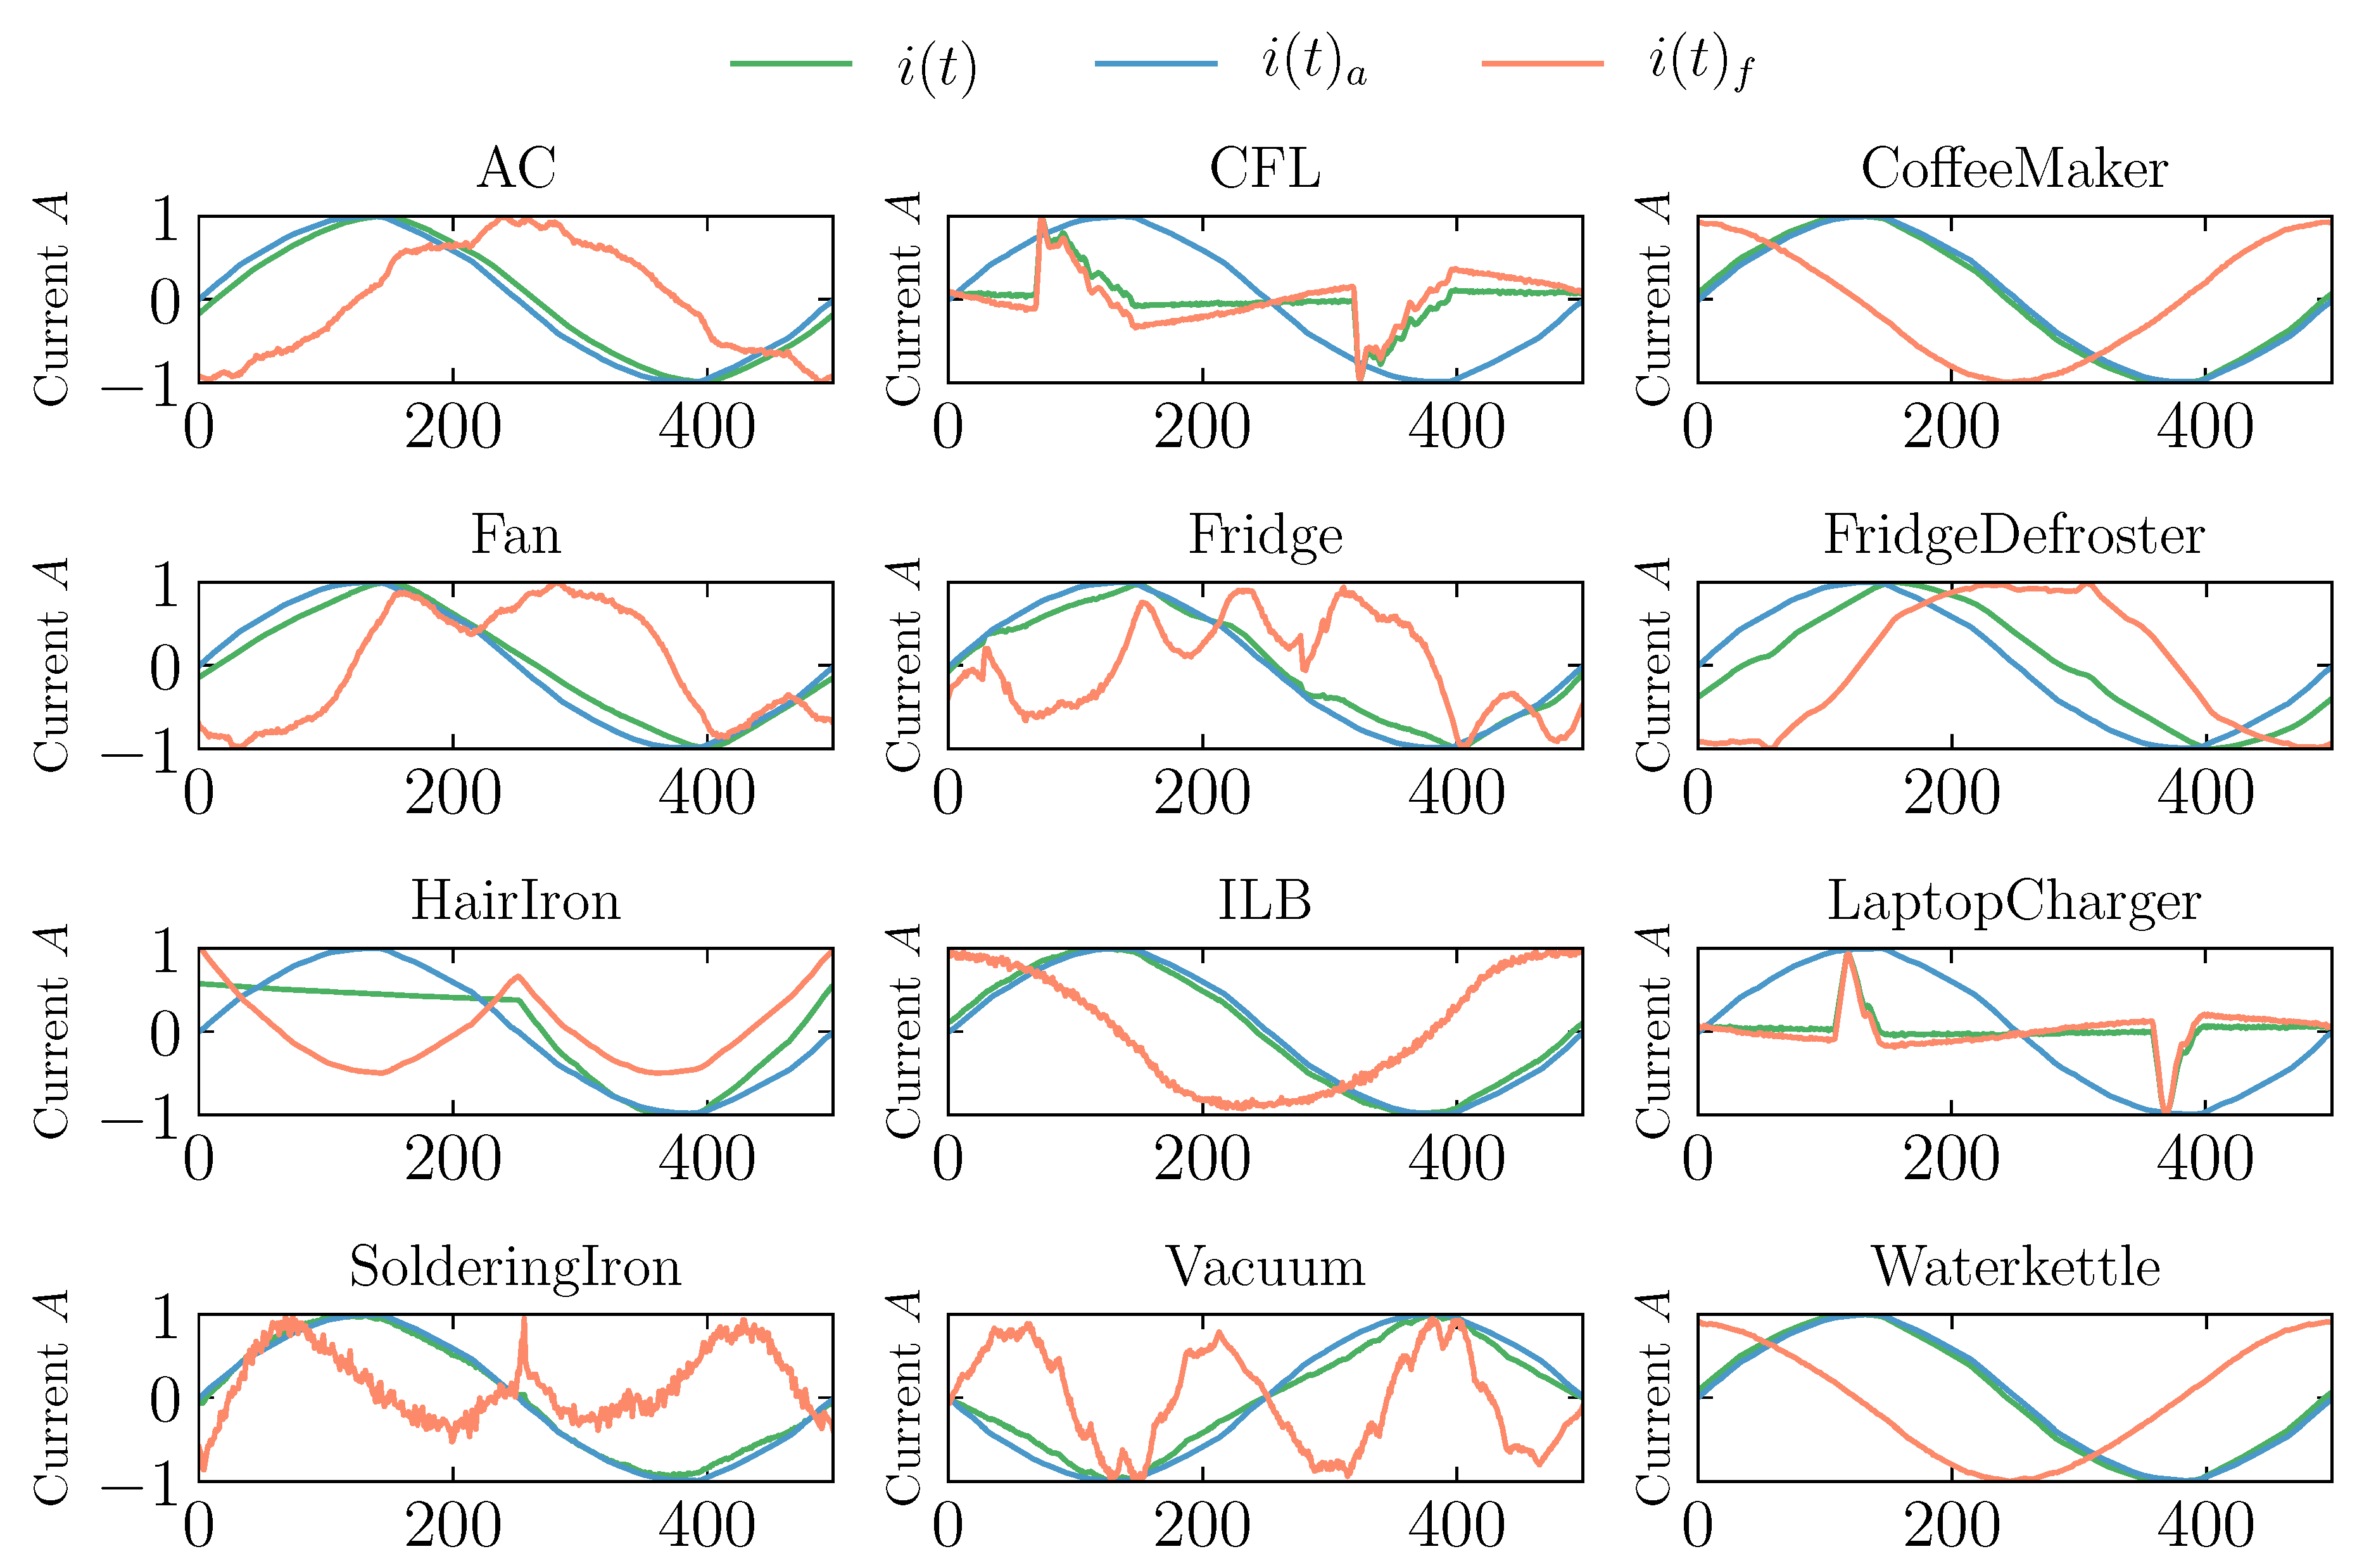
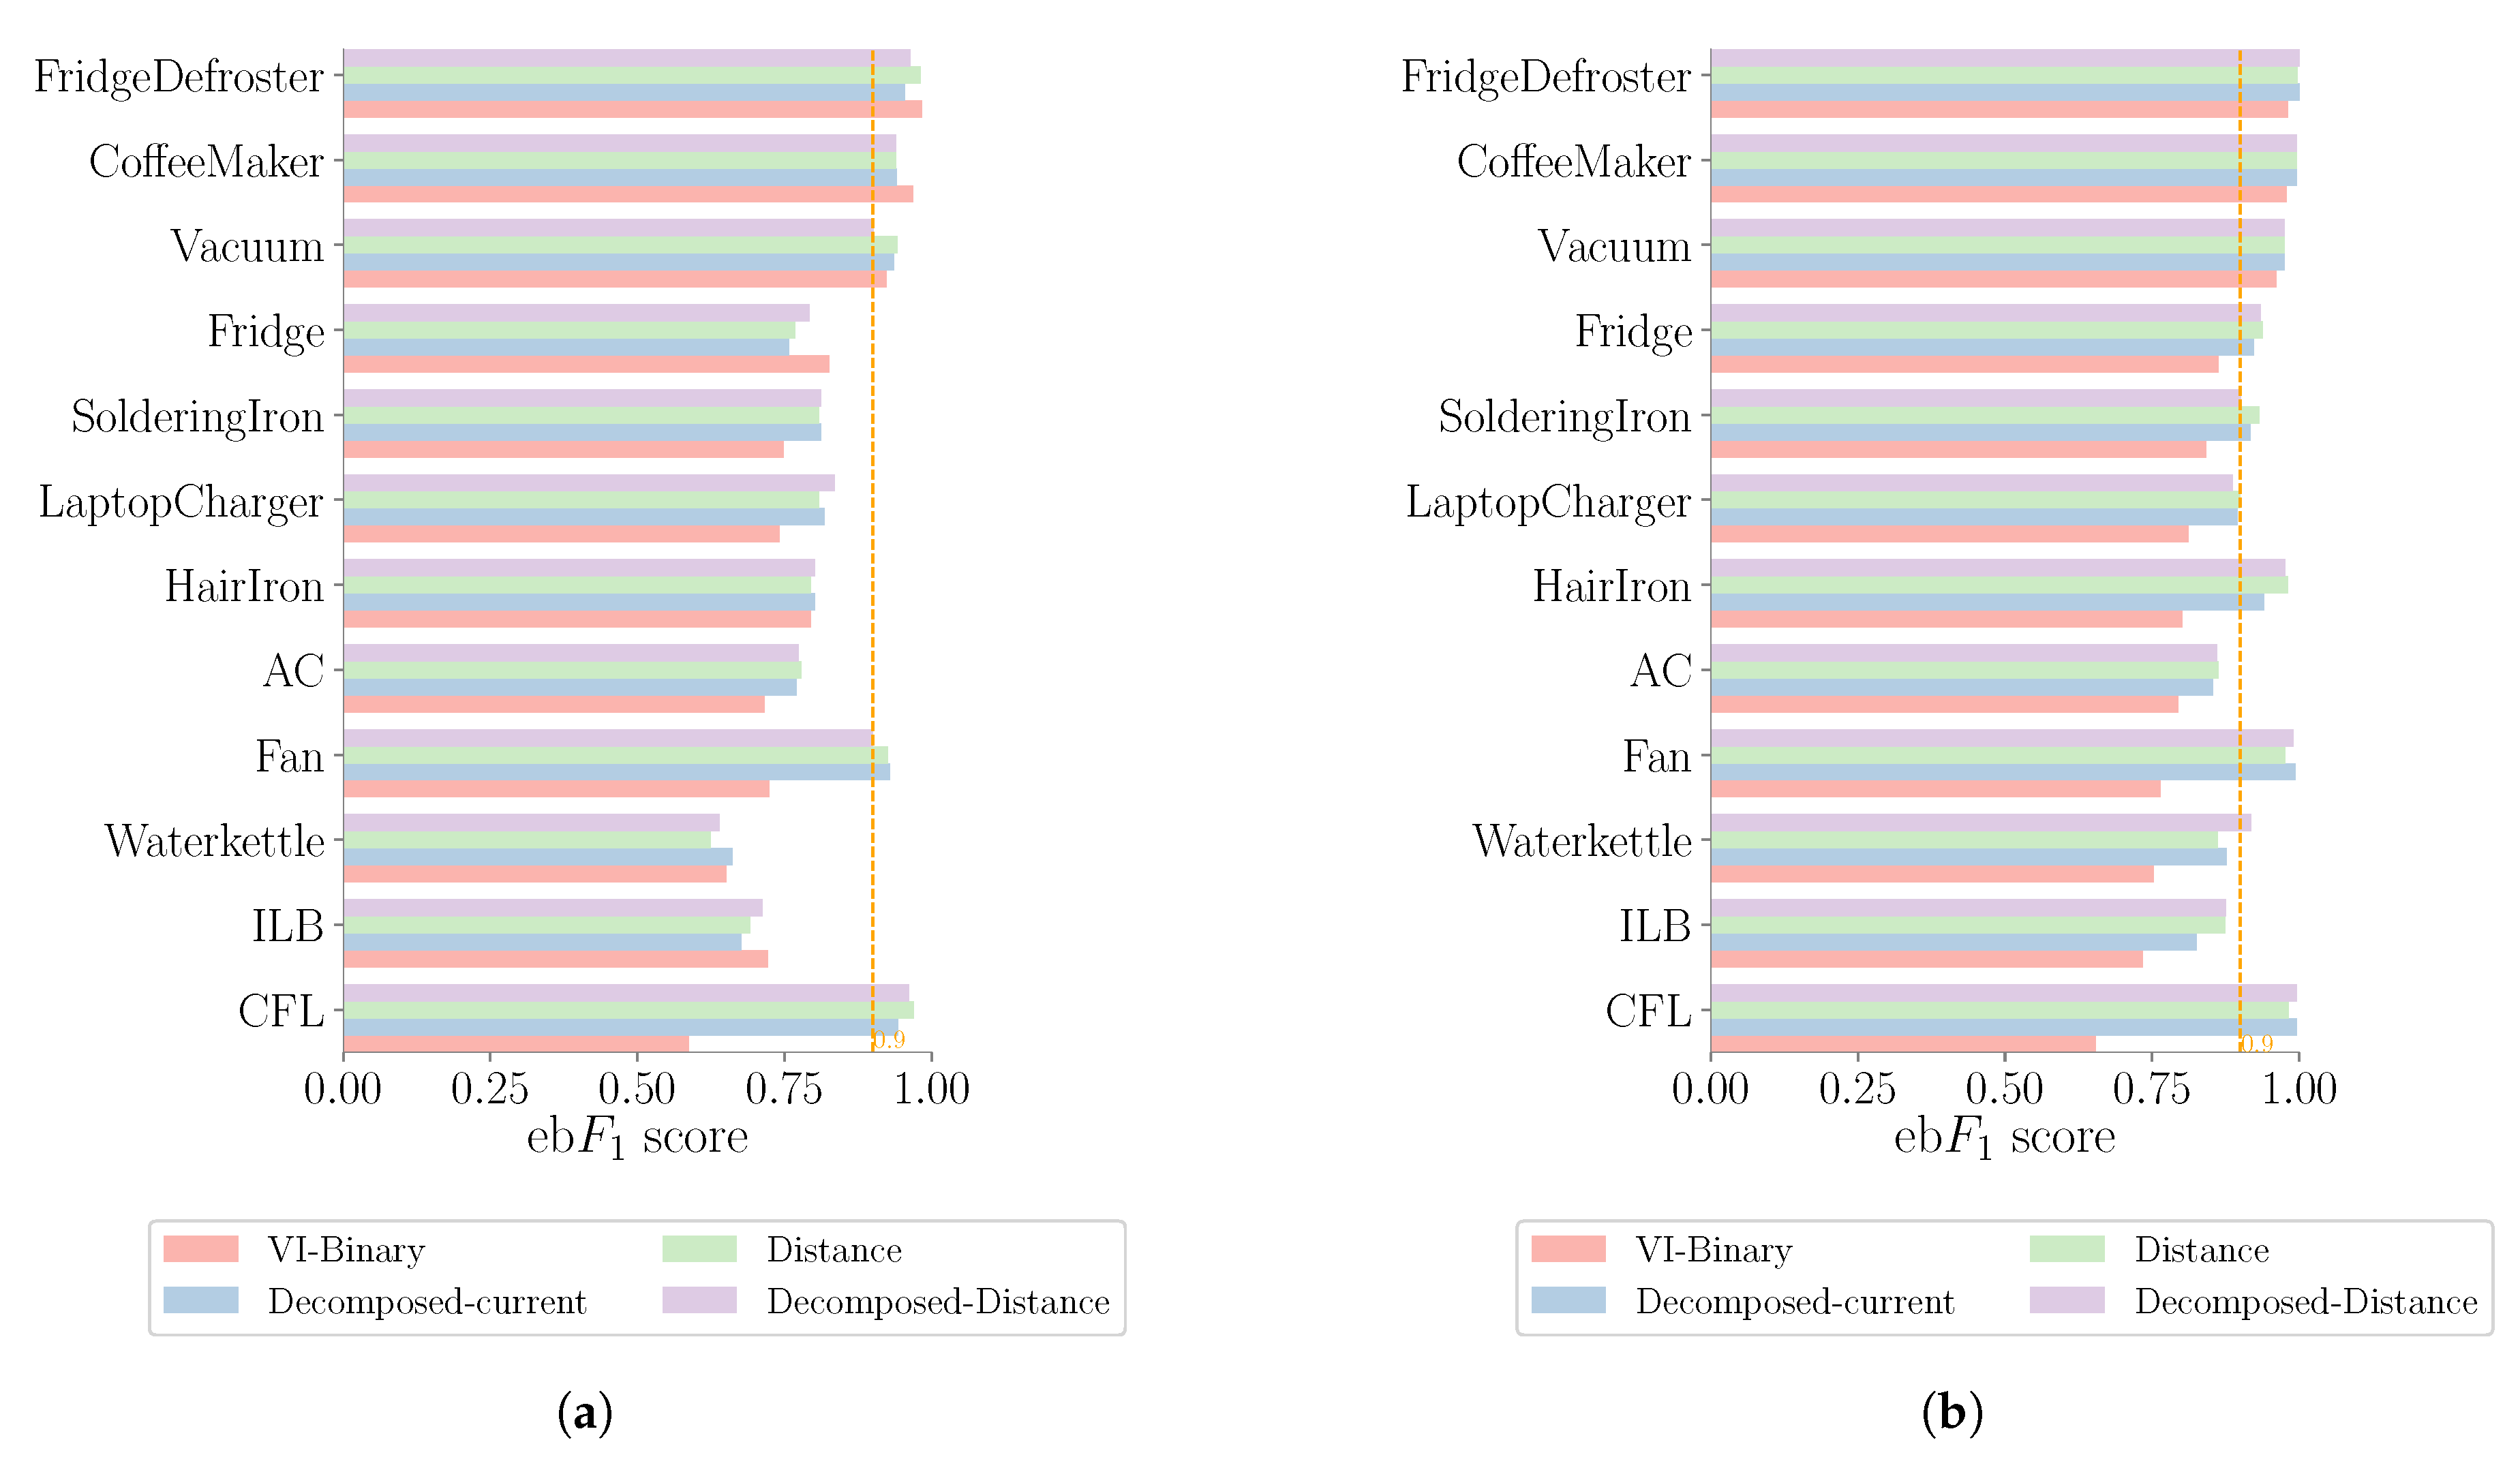
- Second, we apply the Fryze power theory and Euclidean distance matrix as pre-processing steps for the multi-label classifier. This pre-processing step improves the appliance feature’s uniqueness and enhances the performance of the multi-label classifier.
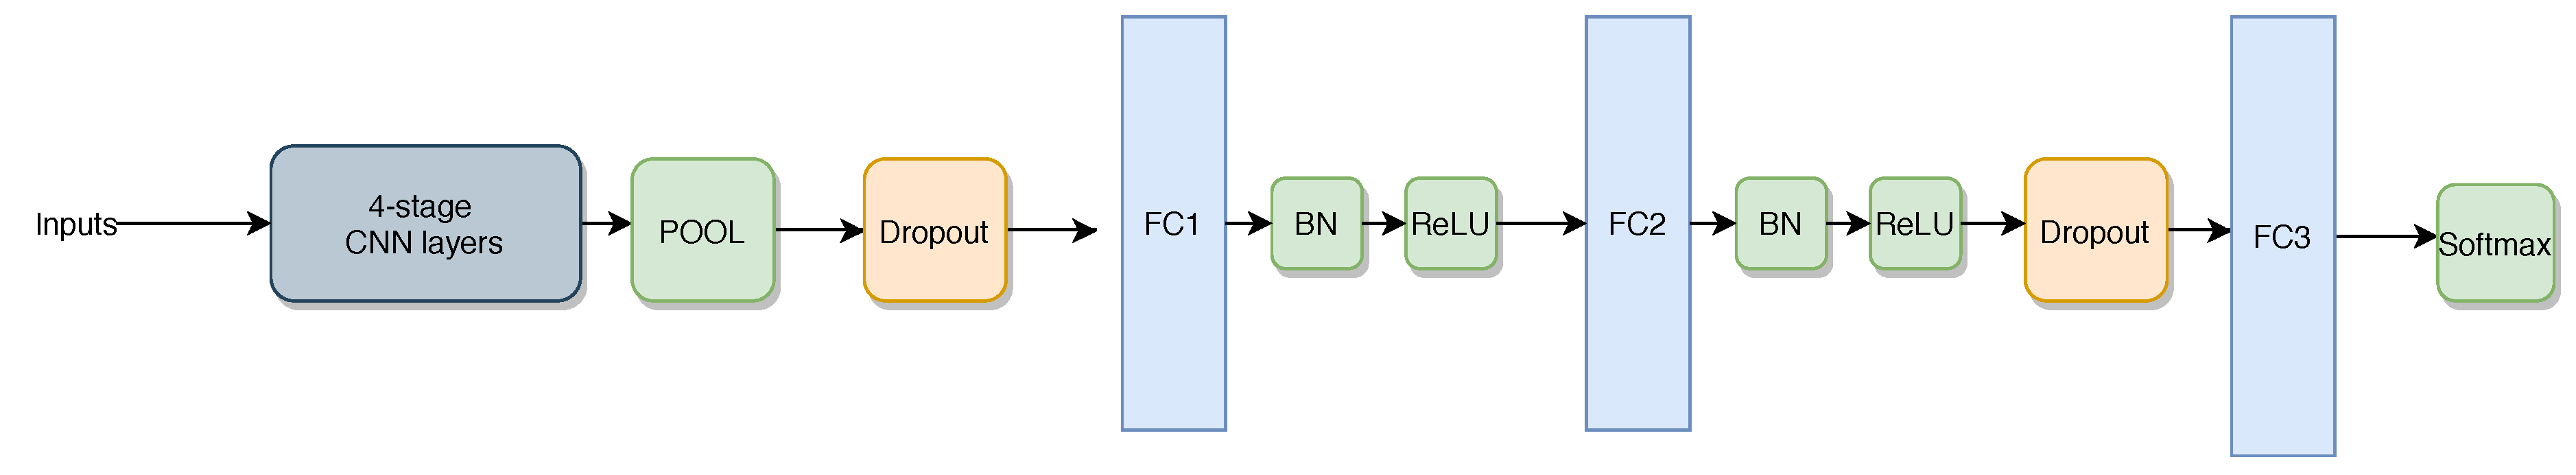
- Third, we propose a CNN multi-label classifier that uses softmax activation to capture the relations between multiple appliances implicitly.
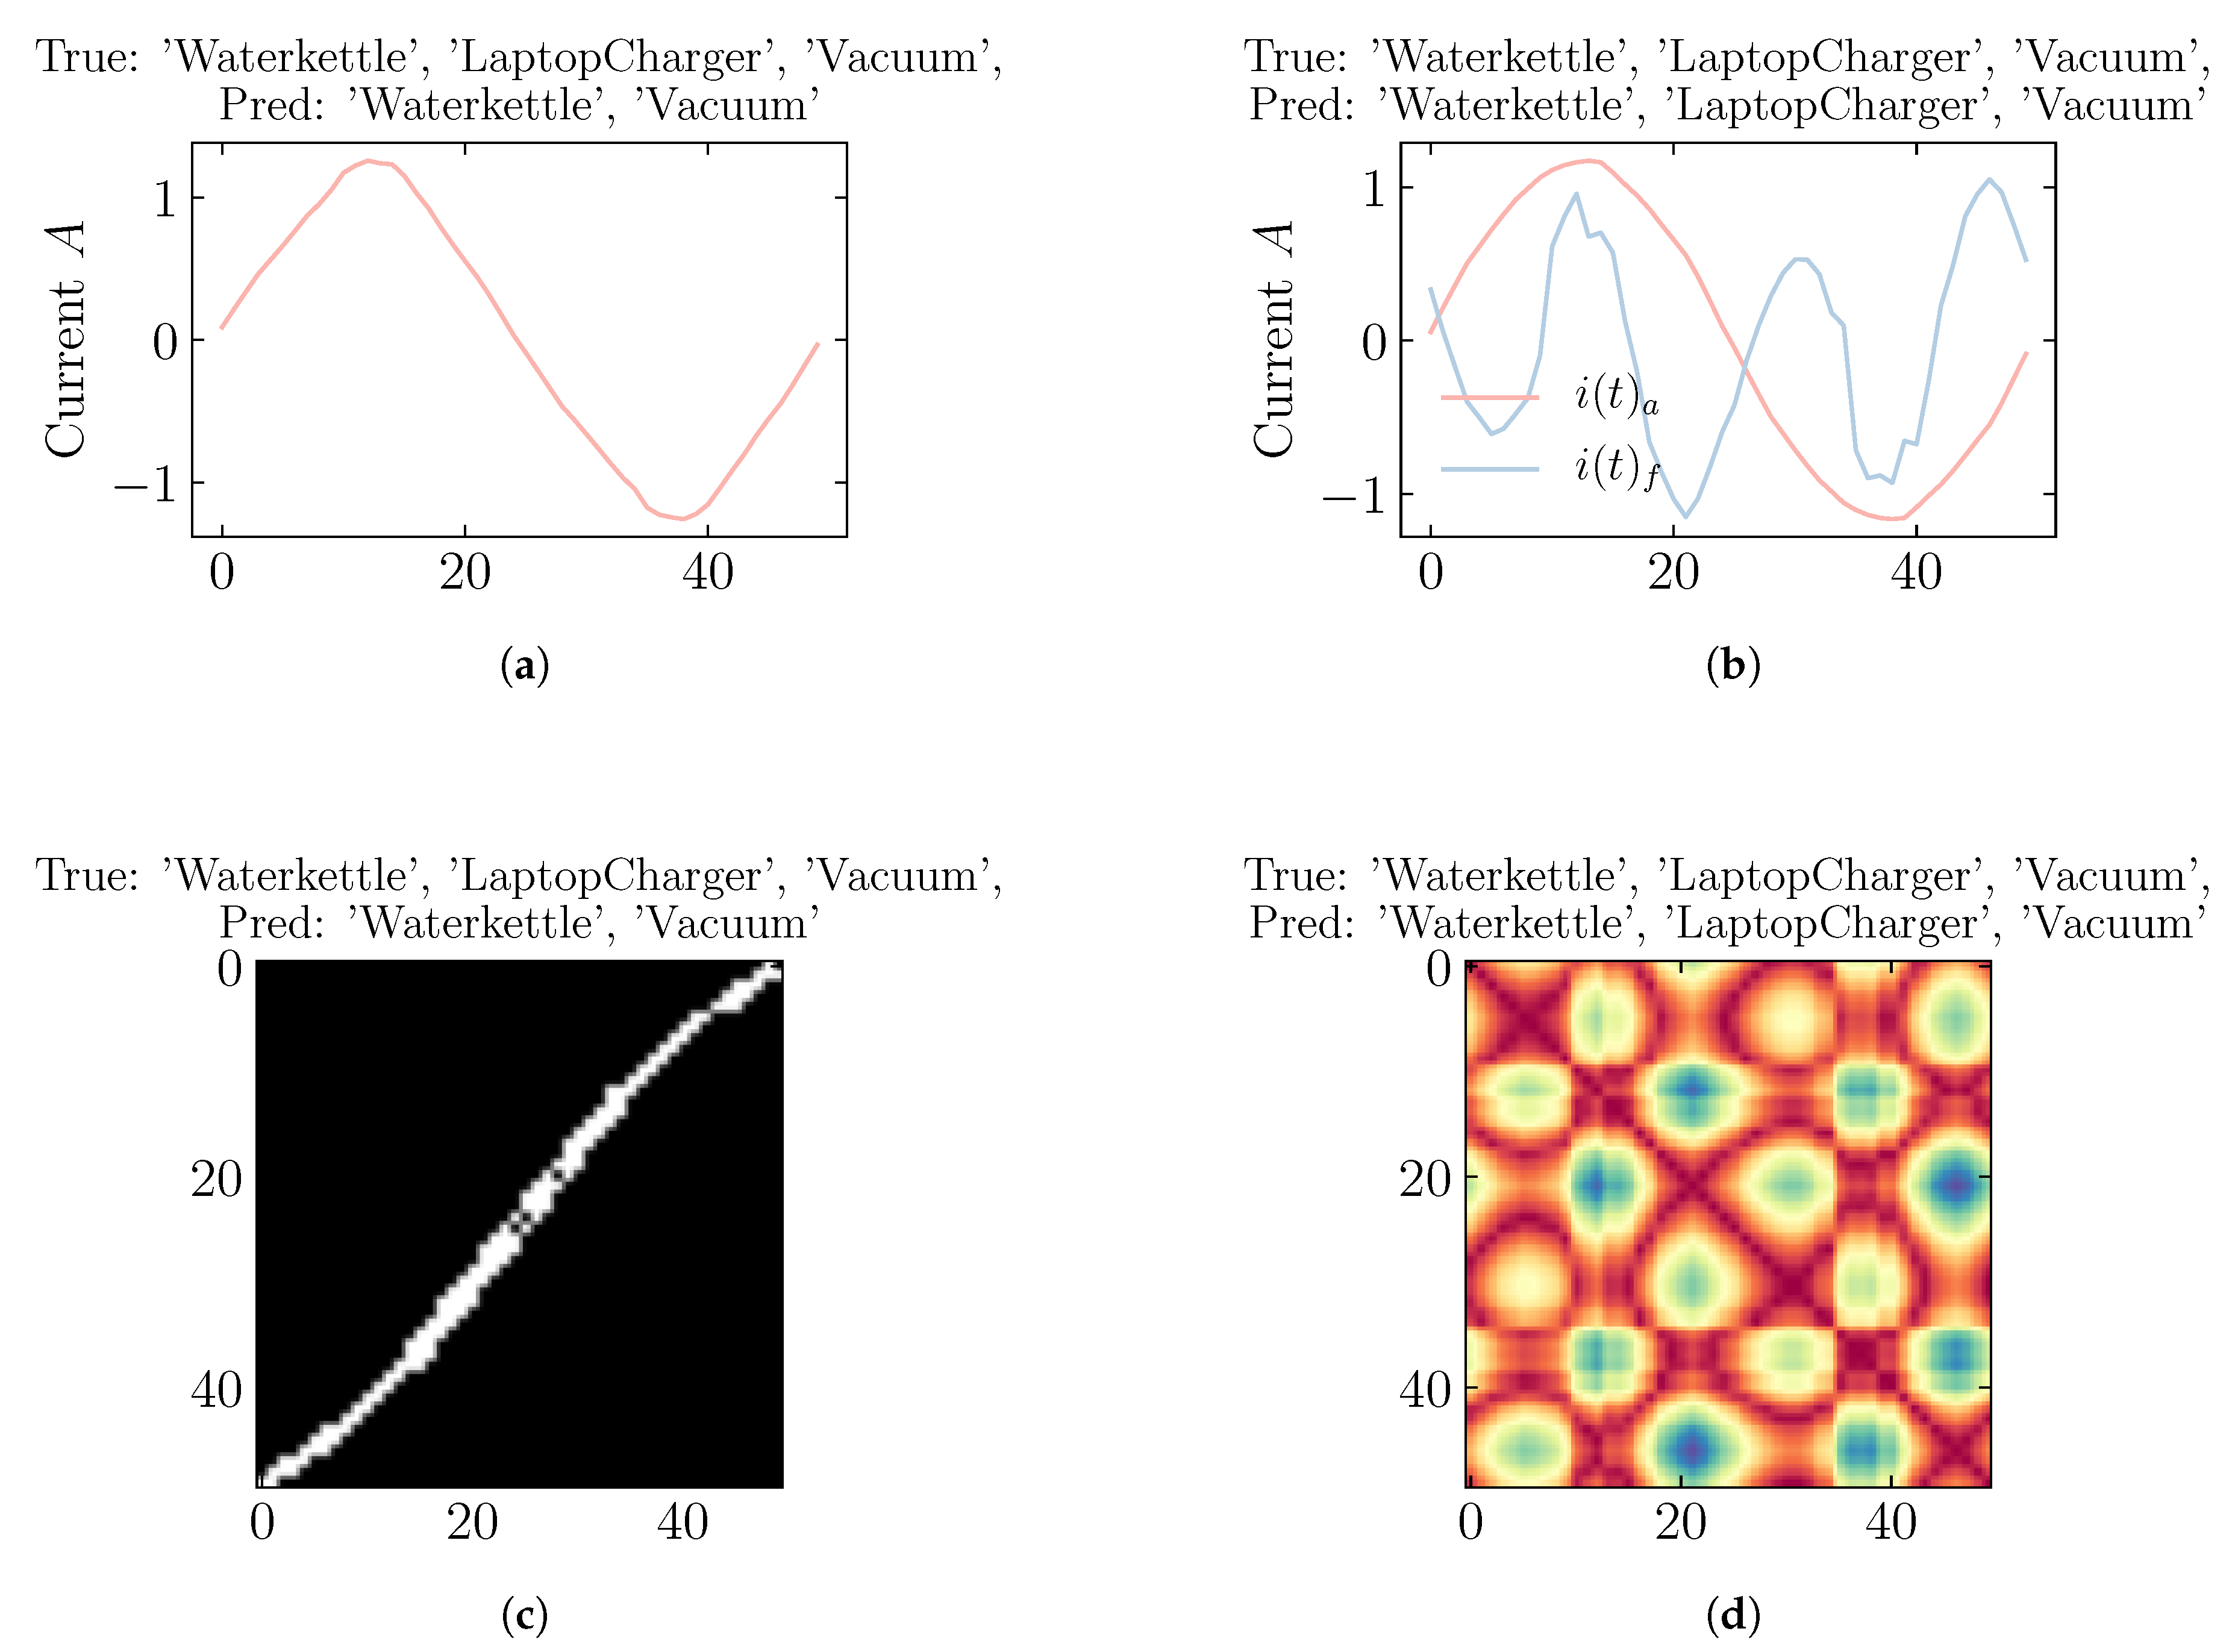
- Fourth, we conduct an experimental evaluation of the proposed approach on an aggregated public dataset and compare the general and per-appliance performances. We also provide an in-depth error analysis and identified three types of errors for multi-label appliance recognition in NILM. Finally, a complexity analysis of the proposed approach method is also presented.
2. Related Works
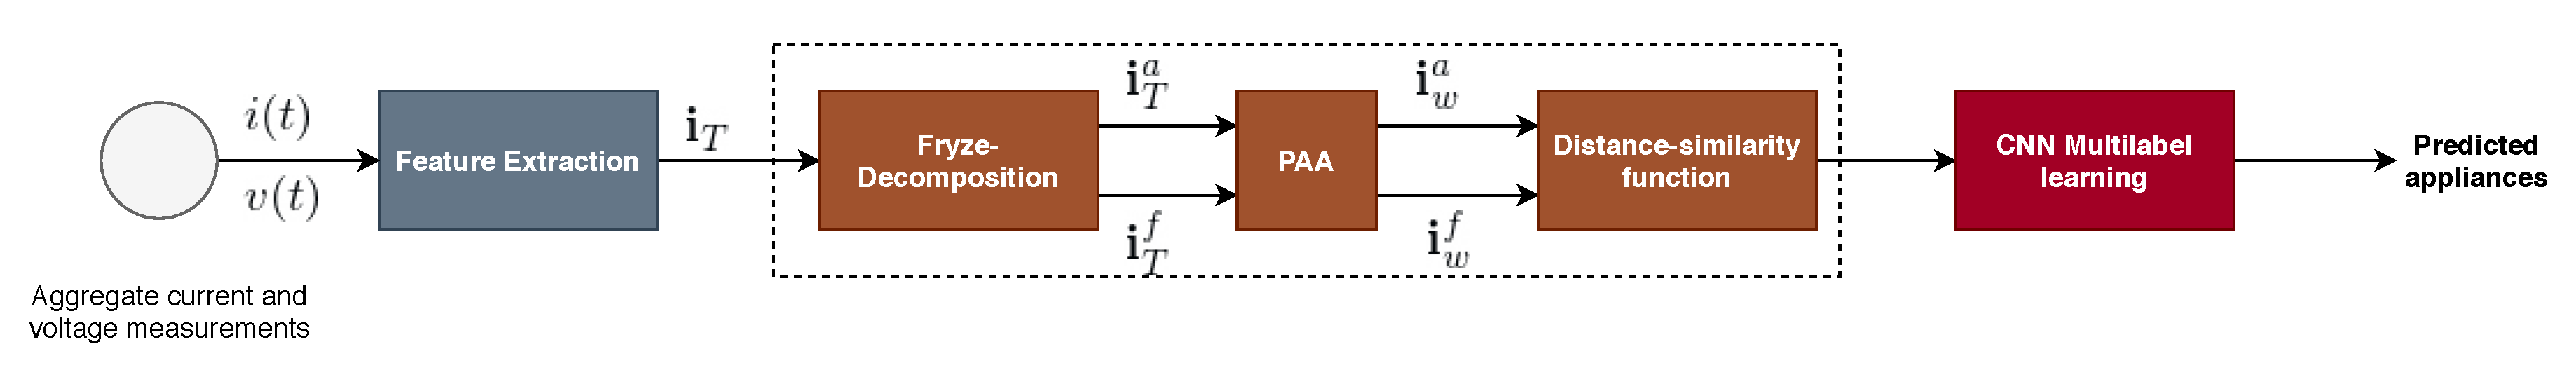
3. Proposed Methods
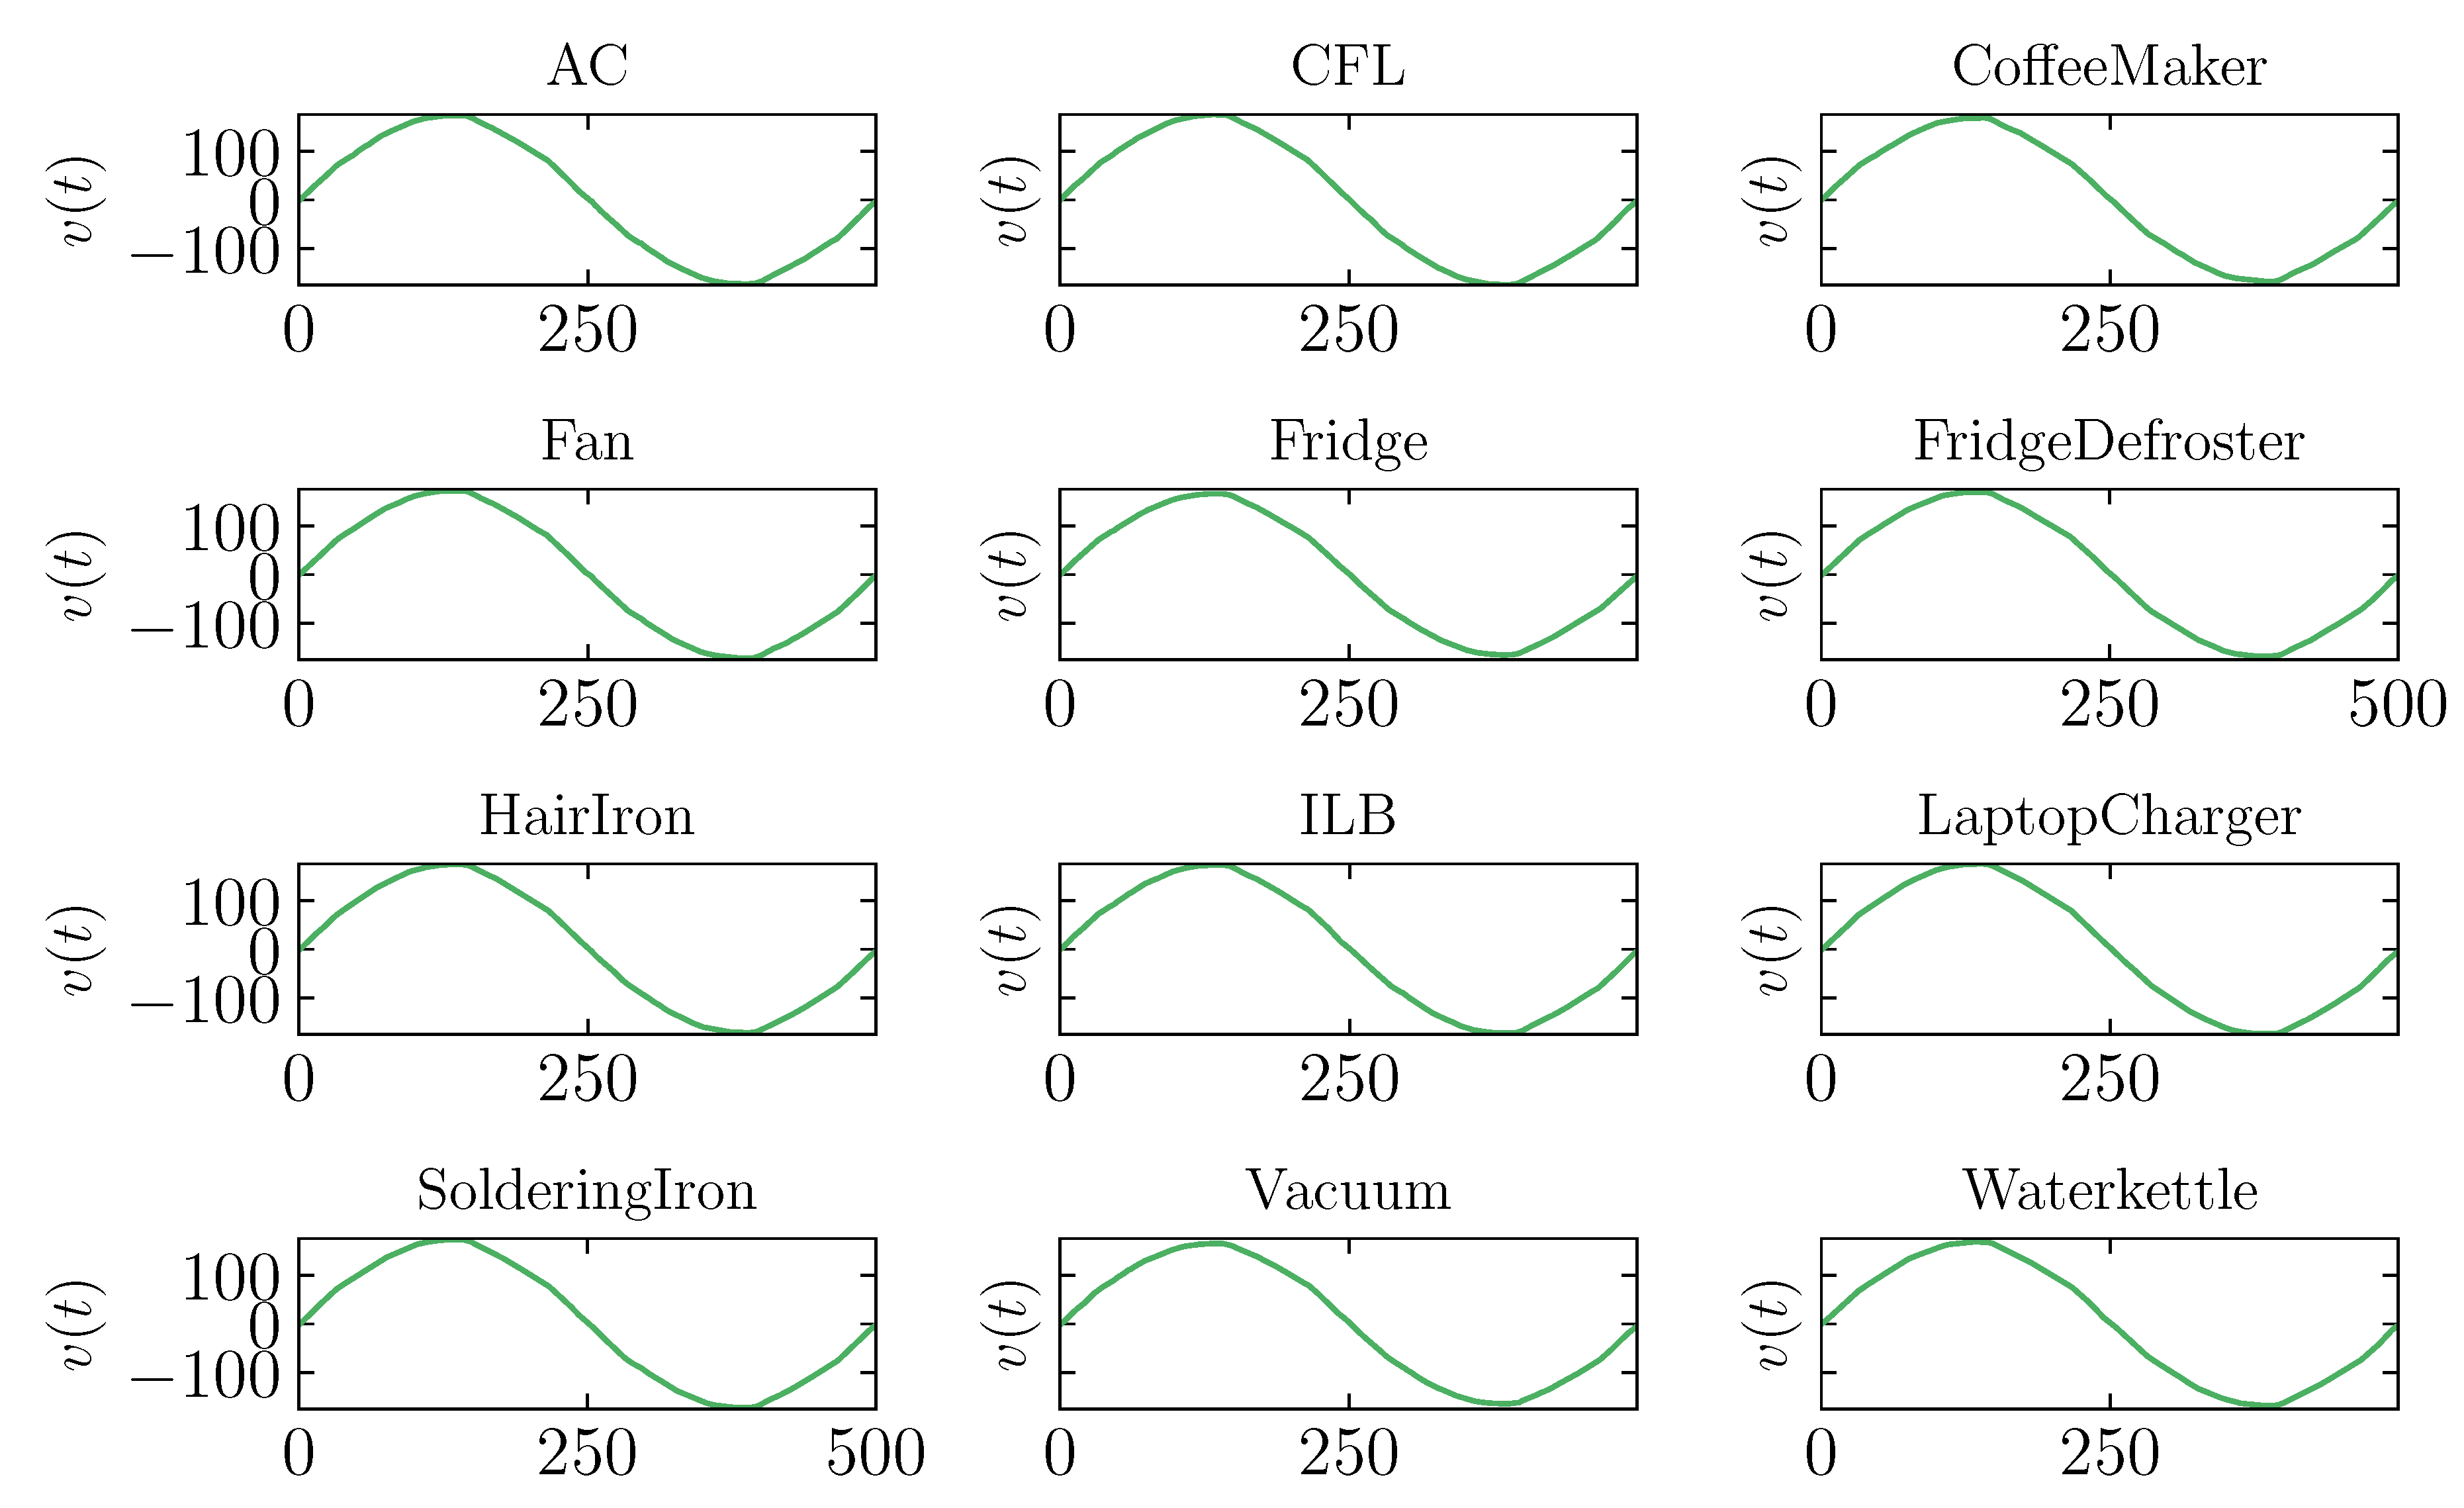
3.1. Feature Extraction from Aggregate Measurements
3.2. Feature Pre-Processing
3.3. Multi-Label Modeling
4. Evaluation Methodology
4.1. Dataset
4.2. Performance Metrics
4.3. Experiment Description
5. Results and Discussion
5.1. Comparison with Baseline
5.2. Error Analysis
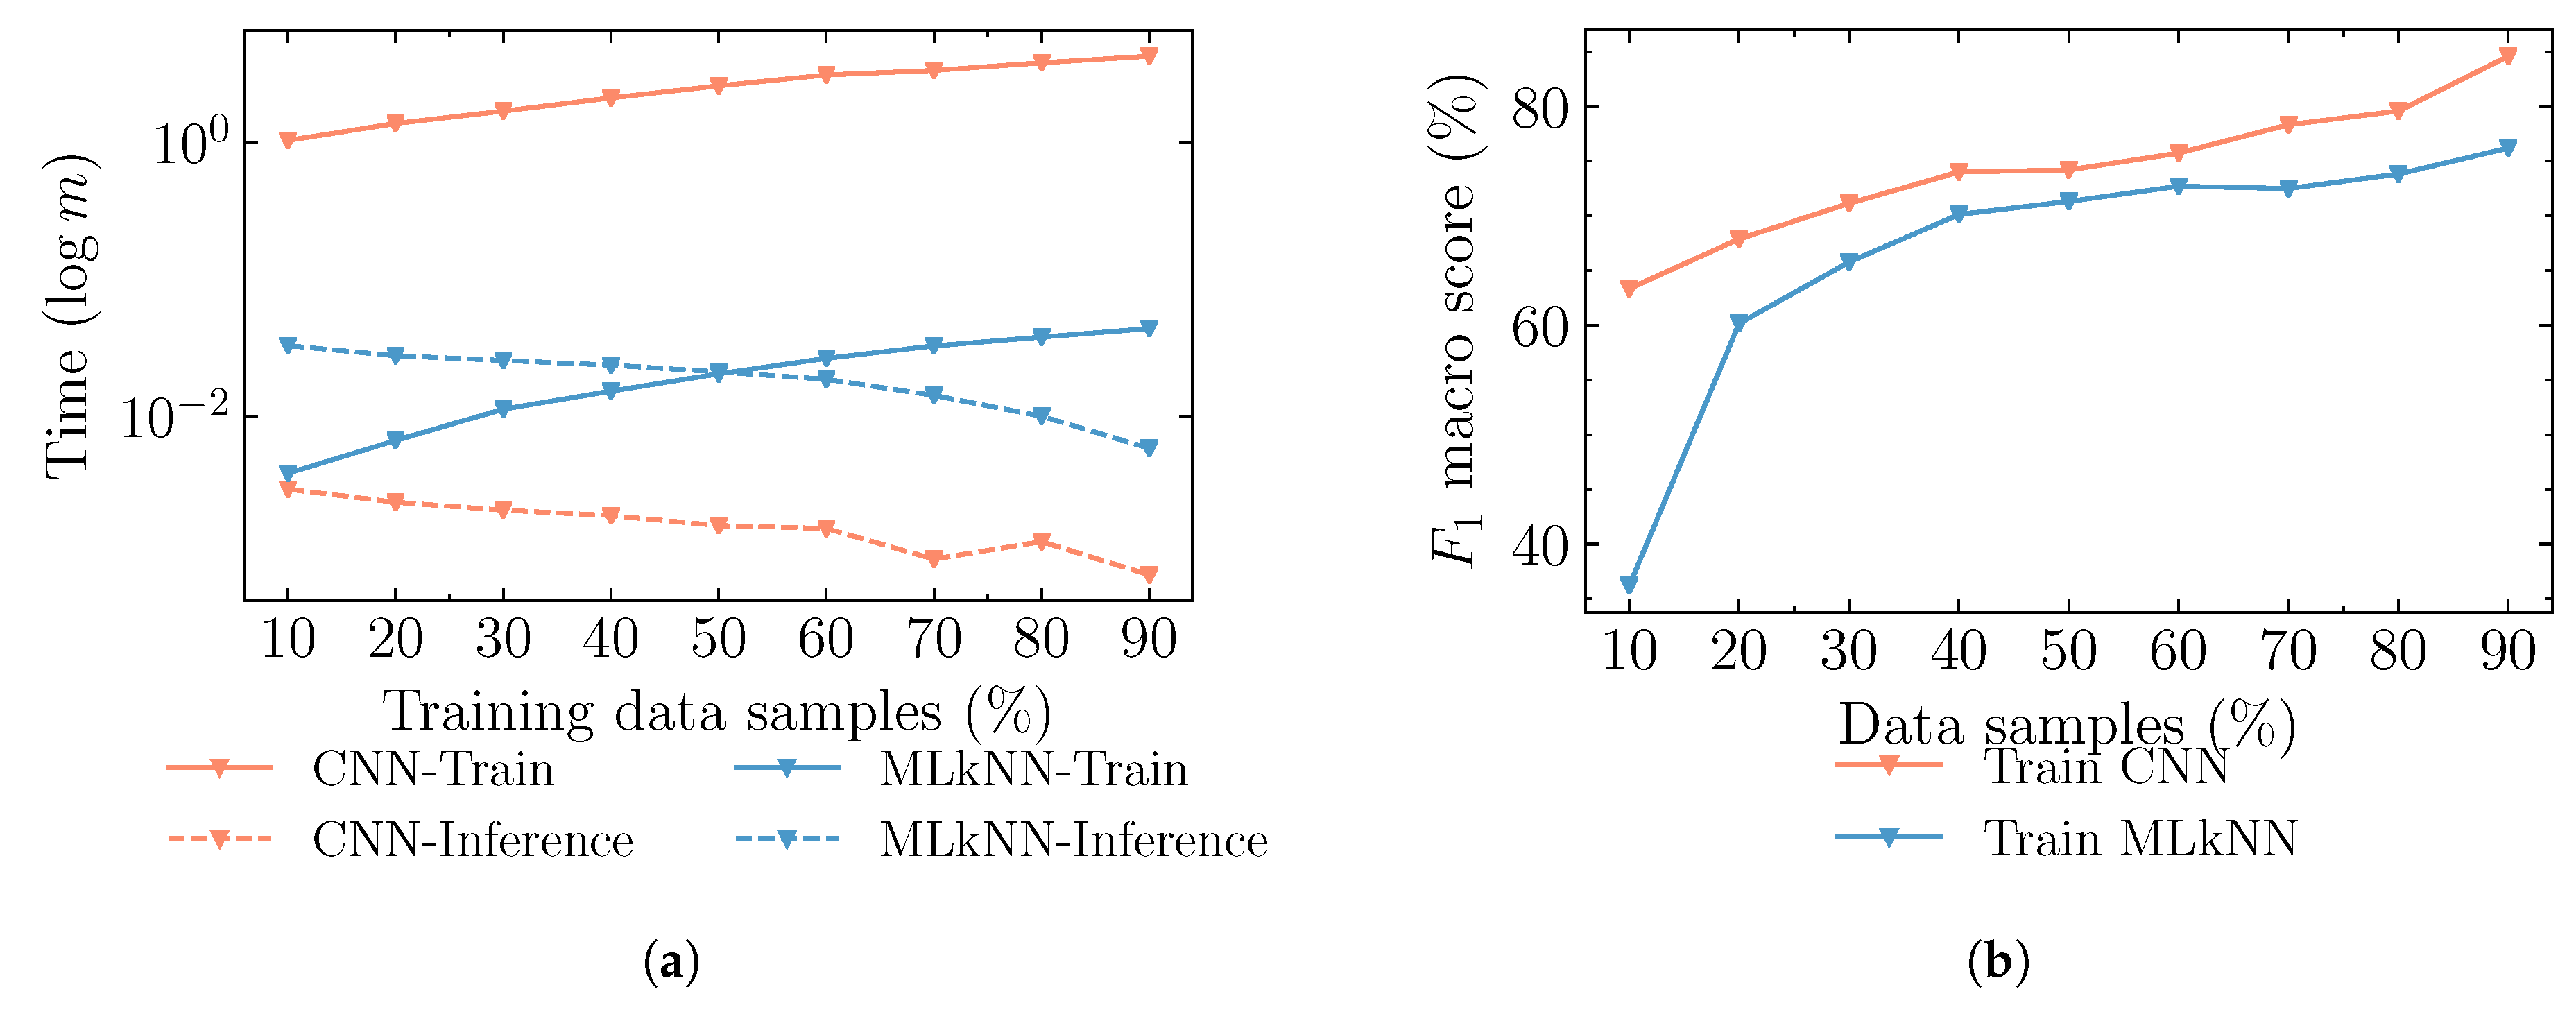
5.3. Complexity Analysis
5.4. Comparison with State-of-the-Art Methods
6. Conclusions and Future Work Directions
Author Contributions
Funding
Acknowledgments
Conflicts of Interest
References
- Monacchi, A.; Versolatto, F.; Herold, M.; Egarter, D.; Tonello, A.M.; Elmenreich, W. An Open Solution to Provide Personalized Feedback for Building Energy Management. CoRR 2015, abs/1505.0, 1–28. [Google Scholar] [CrossRef]
- Batra, N.; Singh, A.; Whitehouse, K. If You Measure It, Can You Improve It? Exploring The Value of Energy Disaggregation. In Proceedings of the 2nd ACM International Conference on Embedded Systems for Energy-Efficient Built Environments—BuildSys ’15, Seoul, Korea, 4–5 November 2015; pp. 191–200. [Google Scholar] [CrossRef]
- Froehlich, J.; Larson, E.; Gupta, S.; Cohn, G.; Reynolds, M.; Patel, S. Disaggregated end-use energy sensing for the smart grid. IEEE Pervasive Comput. 2011, 10, 28–39. [Google Scholar] [CrossRef]
- Reyes Lua, A. Location-aware Energy Disaggregation in Smart Homes. Master’s Thesis, Delft University of Technology, Delft, The Netherlands, 2015. [Google Scholar]
- Klemenjak, C.; Jost, S.; Elmenreich, W. Yomopie: A user-oriented energy monitor to enhance energy efficiency in households. In Proceedings of the 2018 IEEE Conference on Technologies for Sustainability (SusTech), Long Beach, CA, USA, 11–13 November 2018; IEEE: Piscataway, NJ, USA, 2018; pp. 1–7. [Google Scholar]
- Hart, G. Nonintrusive appliance load monitoring. Proc. IEEE 1992, 80, 1870–1891. [Google Scholar] [CrossRef]
- Zeifman, M.; Roth, K. Nonintrusive appliance load monitoring: Review and outlook. IEEE Trans. Consum. Electron. 2011, 57, 76–84. [Google Scholar] [CrossRef]
- Zoha, A.; Gluhak, A.; Imran, M.A.; Rajasegarar, S. Non-intrusive Load Monitoring approaches for disaggregated energy sensing: A survey. Sensors 2012, 12, 16838–16866. [Google Scholar] [CrossRef]
- Klemenjak, C.; Elmenreich, W. On the applicability of correlation filters for appliance detection in smart meter readings. In Proceedings of the 2017 IEEE International Conference on Smart Grid Communications (SmartGridComm), Dresden, Germany, 23–27 October 2017; IEEE: Piscataway, NJ, USA, 2017; pp. 171–176. [Google Scholar]
- Nalmpantis, C.; Vrakas, D. Machine learning approaches for non-intrusive load monitoring: From qualitative to quantitative comparation. Artif. Intell. Rev. 2018, 52, 217–243. [Google Scholar] [CrossRef]
- Faustine, A.; Pereira, L. Improved Appliance Classification in Non-Intrusive Load Monitoring Using Weighted Recurrence Graph and Convolutional Neural Networks 2019. Energies 2020, 13, 3374. [Google Scholar] [CrossRef]
- Gomes, E.; Pereira, L. PB-NILM: Pinball Guided Deep Non-Intrusive Load Monitoring. IEEE Access 2020, 8, 48386–48398. [Google Scholar] [CrossRef]
- Faustine, A.; Pereira, L.; Klemenjak, C. Adaptive Weighted Recurrence Graphs for Appliance Recognition in Non-Intrusive Load Monitoring. IEEE Trans. Smart Grid 2020, 1. [Google Scholar] [CrossRef]
- De Baets, L.; Ruyssinck, J.; Develder, C.; Dhaene, T.; Deschrijver, D. Appliance classification using VI trajectories and convolutional neural networks. Energy Build. 2018, 158, 32–36. [Google Scholar] [CrossRef]
- Lam, H.Y.; Fung, G.S.K.; Lee, W.K. A Novel Method to Construct Taxonomy Electrical Appliances Based on Load Signaturesof. IEEE Trans. Consum. Electron. 2007, 53, 653–660. [Google Scholar] [CrossRef]
- Wang, A.L.; Chen, B.X.; Wang, C.G.; Hua, D. Non-intrusive load monitoring algorithm based on features of V–I trajectory. Electr. Power Syst. Res. 2018, 157, 134–144. [Google Scholar] [CrossRef]
- Du, L.; He, D.; Harley, R.G.; Habetler, T.G. Electric Load Classification by Binary Voltage–Current Trajectory Mapping. IEEE Trans. Smart Grid 2016, 7, 358–365. [Google Scholar] [CrossRef]
- Gao, J.; Kara, E.C.; Giri, S.; Bergés, M. A feasibility study of automated plug-load identification from high-frequency measurements. In Proceedings of the 2015 IEEE Global Conference on Signal and Information Processing (GlobalSIP), Orlando, FL, USA, 14–16 December 2015; pp. 220–224. [Google Scholar] [CrossRef]
- De Baets, L.; Dhaene, T.; Deschrijver, D.; Develder, C.; Berges, M. VI-Based Appliance Classification Using Aggregated Power Consumption Data. In Proceedings of the 2018 IEEE International Conference on Smart Computing (SMARTCOMP), Sicily, Italy, 18–20 June 2018; pp. 179–186. [Google Scholar] [CrossRef]
- Liu, Y.; Wang, X.; You, W. Non-Intrusive Load Monitoring by Voltage–Current Trajectory Enabled Transfer Learning. IEEE Trans. Smart Grid 2019, 10, 5609–5619. [Google Scholar] [CrossRef]
- Baptista, D.; Mostafa, S.; Pereira, L.; Sousa, L.; Morgado, D.F. Implementation Strategy of Convolution Neural Networks on Field Programmable Gate Arrays for Appliance Classification Using the Voltage and Current (V-I) Trajectory. Energies 2018, 11, 2460. [Google Scholar] [CrossRef]
- Yeh, C.K.; Wu, W.C.; Ko, W.J.; Wang, Y.C.F. Learning Deep Latent Spaces for Multi-Label Classification. In Proceedings of the Thirty-First AAAI Conference on Artificial Intelligence (AAAI-17), San Francisco, CA, USA, 4–9 February 2017; pp. 2838–2844. [Google Scholar]
- Yang, Y.; Zhong, J.; Li, W.; Gulliver, T.A.; Li, S. Semi-Supervised Multi-Label Deep Learning based Non-intrusive Load Monitoring in Smart Grids. IEEE Trans. Ind. Inform. 2019, 10, 1. [Google Scholar] [CrossRef]
- Massidda, L.; Marrocu, M.; Manca, S. Non-Intrusive Load Disaggregation by Convolutional Neural Network and Multilabel Classification. Appl. Sci. 2020, 10, 1454. [Google Scholar] [CrossRef]
- Basu, K.; Debusschere, V.; Bacha, S.; Maulik, U.; Bondyopadhyay, S. Nonintrusive Load Monitoring: A Temporal Multilabel Classification Approach. IEEE Trans. Ind. Inform. 2015, 11, 262–270. [Google Scholar] [CrossRef]
- Tabatabaei, S.M.; Dick, S.; Xu, W. Toward Non-Intrusive Load Monitoring via Multi-Label Classification. IEEE Trans. Smart Grid 2016, 8, 26–40. [Google Scholar] [CrossRef]
- Buddhahai, B.; Wongseree, W.; Rakkwamsuk, P. A non-intrusive load monitoring system using multi-label classification approach. Sustain. Cities Soc. 2018, 39, 621–630. [Google Scholar] [CrossRef]
- Teshome, D.F.; Huang, T.D.; Lian, K. Distinctive Load Feature Extraction Based on Fryze’s Time-Domain Power Theory. IEEE Power Energy Technol. Syst. J. 2016, 3, 60–70. [Google Scholar] [CrossRef]
- Dokmanic, I.; Parhizkar, R.; Ranieri, J.; Vetterli, M. Euclidean Distance Matrices: Essential theory, algorithms, and applications. IEEE Signal Process. Mag. 2015, 32, 12–30. [Google Scholar] [CrossRef]
- Medico, R.; De Baets, L.; Gao, J.; Giri, S.; Kara, E.; Dhaene, T.; Develder, C.; Bergés, M.; Deschrijver, D. A voltage and current measurement dataset for plug load appliance identification in households. Sci. Data 2020, 7, 49. [Google Scholar] [CrossRef] [PubMed]
- Verma, S.; Singh, S.; Majumdar, A. Multi Label Restricted Boltzmann Machine for Non-intrusive Load Monitoring. In Proceedings of the ICASSP 2019—2019 IEEE International Conference on Acoustics, Speech and Signal Processing (ICASSP), Brighton, UK, 12–17 May 2019; IEEE: Piscataway, NJ, USA, 2019; pp. 8345–8349. [Google Scholar]
- Buddhahai, B.; Wongseree, W.; Rakkwamsuk, P. An Energy Prediction Approach for a Nonintrusive Load Monitoring in Home Appliances. IEEE Trans. Consumer Electron. 2019, 66, 96–105. [Google Scholar] [CrossRef]
- Singh, S.; Majumdar, A. Non-intrusive Load Monitoring via Multi-label Sparse Representation based Classification. IEEE Trans. Smart Grid 2019, 11, 1799–1801. [Google Scholar] [CrossRef]
- Kongsorot, Y.; Horata, P. Multi-label classification with extreme learning machine. In Proceedings of the 2014 6th International Conference on Knowledge and Smart Technology (KST), Chonburi, Thailand, 30–31 January 2014; IEEE: Piscataway, NJ, USA, 2014; pp. 81–86. [Google Scholar]
- Li, D.; Dick, S. Residential household non-intrusive load monitoring via graph-based multi-label semi-supervised learning. IEEE Trans. Smart Grid 2018, 10, 4615–4627. [Google Scholar] [CrossRef]
- Singhal, V.; Maggu, J.; Majumdar, A. Simultaneous detection of multiple appliances from smart-meter measurements via multi-label consistent deep dictionary learning and deep transform learning. IEEE Trans. Smart Grid 2018, 10, 2269–2987. [Google Scholar] [CrossRef]
- Nalmpantis, C.; Vrakas, D. On time series representations for multi-label NILM. Neural Comput. Appl. 2020. [Google Scholar] [CrossRef]
- Li, L.; Zhao, Y.; Jiang, D.; Zhang, Y.; Wang, F.; Gonzalez, I.; Valentin, E.; Sahli, H. Hybrid Deep Neural Network–Hidden Markov Model (DNN-HMM) Based Speech Emotion Recognition. In Proceedings of the 2013 Humaine Association Conference on Affective Computing and Intelligent Interaction, Geneva, Switzerland, 2–5 September 2013; pp. 312–317. [Google Scholar] [CrossRef]
- Hassan, T.; Javed, F.; Arshad, N. An Empirical Investigation of V-I Trajectory Based Load Signatures for Non-Intrusive Load Monitoring. IEEE Trans. Smart Grid 2014, 5, 870–878. [Google Scholar] [CrossRef]
- Klemenjak, C.; Makonin, S.; Elmenreich, W. Towards Comparability in Non-Intrusive Load Monitoring: On Data and Performance Evaluation. In Proceedings of the 2020 IEEE Power & Energy Society Innovative Smart Grid Technologies Conference (ISGT), The Hague, The Netherlands, 25–28 October 2020; IEEE: Piscataway, NJ, USA, 2020. [Google Scholar]
- Staudt, V. Fryze-Buchholz-Depenbrock: A time-domain power theory. In Proceedings of the 2008 International School on Nonsinusoidal Currents and Compensation, Lagow, Poland, 10–13 June 2008. [Google Scholar] [CrossRef]
- Keogh, E.J.; Pazzani, M.J. Scaling Up Dynamic Time Warping for Datamining Applications. In Proceedings of the 6th ACM SIGKDD International Conference on Knowledge Discovery and Data Mining; ACM: New York, NY, USA, 2000; KDD ’00; pp. 285–289. [Google Scholar] [CrossRef]
- Ontañón, S. An overview of distance and similarity functions for structured data. Artif. Intell. Rev. 2020. [Google Scholar] [CrossRef]
- Mahajan, D.; Girshick, R.; Ramanathan, V.; Paluri, M.; Li, Y.; Bharambe, A.; Maaten, L.v.d. Exploring the Limits of Weakly Supervised Pretraining. In Computer Vision—ECCV 2018; Springer: Berlin/Heidelberg, Germany, 2018. [Google Scholar] [CrossRef]
- Lanchantin, J.; Sekhon, A.; Qi, Y. Neural Message Passing for Multi-Label Classification. In Machine Learning and Knowledge Discovery in Databases; Brefeld, U., Fromont, E., Hotho, A., Knobbe, A., Maathuis, M., Robardet, C., Eds.; ECML PKDD 2019, Lecture Notes in Computer Science; Springer: Cham, Switzerland, 2019; Volume 11907. [Google Scholar] [CrossRef]
- Sechidis, K.; Tsoumakas, G.; Vlahavas, I. On the Stratification of Multi-label Data. In Machine Learning and Knowledge Discovery in Databases; Gunopulos, D., Hofmann, T., Malerba, D., Vazirgiannis, M., Eds.; Springer: Berlin/Heidelberg, Germany, 2011; pp. 145–158. [Google Scholar]
- Zhang, M.L.; Zhou, Z.H. ML-KNN: A lazy learning approach to multi-label learning. Pattern Recognit. 2007, 40, 2038–2048. [Google Scholar] [CrossRef]
- Spyromitros, E.; Tsoumakas, G.; Vlahavas, I. An Empirical Study of Lazy Multilabel Classification Algorithms. In Artificial Intelligence: Theories, Models and Applications; Springer: Berlin/Heidelberg, Germany, 2008; pp. 401–406. [Google Scholar] [CrossRef]
- Lai, Y.X.; Lai, C.F.; Huang, Y.M.; Chao, H.C. Multi-appliance recognition system with hybrid SVM/GMM classifier in ubiquitous smart home. Inf. Sci. 2013, 230, 39–55. [Google Scholar] [CrossRef]
- Kolter, J.Z.; Johnson, M.J. REDD: A Public Data Set for Energy Disaggregation Research. In Proceedings of the 1st KDD Workshop on Data Mining Applications in Sustainability (SustKDD’11), San Diego, CA, USA, 21 August 2011; pp. 1–6. [Google Scholar]
- Kelly, J.; Knottenbelt, W. The UK-DALE dataset, domestic appliance-level electricity demand and whole-house demand from five UK homes. Sci. Data 2015, 2, 150007. [Google Scholar] [CrossRef]
- Pereira, L.; Nunes, N. Performance evaluation in non-intrusive load monitoring: Datasets, metrics, and tools—A review. Wiley Interdiscip. Rev. Data Min. Knowl. Discov. 2018, 8, e1265. [Google Scholar] [CrossRef]
- Klemenjak, C.; Reinhardt, A.; Pereira, L.; Makonin, S.; Bergés, M.; Elmenreich, W. Electricity Consumption Data Sets: Pitfalls and Opportunities. In Proceedings of the 6th ACM International Conference on Systems for Energy-Efficient Buildings, Cities, and Transportation, BuildSys ’19, New York, NY, USA, 13–14 November 2019; ACM: New York, NY, USA, 2019. [Google Scholar] [CrossRef]
- Pereira, L. Developing and evaluating a probabilistic event detector for non-intrusive load monitoring. In 2017 Sustainable Internet and ICT for Sustainability (SustainIT); IEEE: Funchal, Portugal, 2017; pp. 1–10. [Google Scholar] [CrossRef]
- De Baets, L.; Ruyssinck, J.; Develder, C.; Dhaene, T.; Deschrijver, D. On the Bayesian optimization and robustness of event detection methods in NILM. Energy Build. 2017, 145, 57–66. [Google Scholar] [CrossRef]
- Houidi, S.; Auger, F.; Sethom, H.B.A.; Fourer, D.; Miègeville, L. Multivariate event detection methods for non-intrusive load monitoring in smart homes and residential buildings. Energy Build. 2020, 208, 109624. [Google Scholar] [CrossRef]


| Approach | Learning Strategy | Model | Dataset | Sampling Frequency | Results (Metric) |
|---|---|---|---|---|---|
| De Baets et al. [19] | single | CNN | PLAID [30] | High | 88.0% ( macro) |
| Faustine et al. [13] | single | CNN | PLAID [30] | High | 97.77% ( macro) |
| Tabatabaei et al. [26] | multi | MLkNN | REDD-House1 [50] | Low | 61.90% ( macro) |
| Lai et al. [49] | multi | SVM/GMM | Private | - | 90.72% (Accuracy) |
| Yang et al. [23] | multi | FCNN | UK-DALE-house 1 [51] | Low | 93.8% ( score) |
| Nalmpantis and Vrakas [37] | multi | TCNN | UK-DALE-house 1 [51] | Low | 92.5% ( score) |
| Proposed approach | multi | CNN | PLAID [30] | High | 94.0% ( score) |
© 2020 by the authors. Licensee MDPI, Basel, Switzerland. This article is an open access article distributed under the terms and conditions of the Creative Commons Attribution (CC BY) license (http://creativecommons.org/licenses/by/4.0/).
Share and Cite
Faustine, A.; Pereira, L. Multi-Label Learning for Appliance Recognition in NILM Using Fryze-Current Decomposition and Convolutional Neural Network. Energies 2020, 13, 4154. https://doi.org/10.3390/en13164154
Faustine A, Pereira L. Multi-Label Learning for Appliance Recognition in NILM Using Fryze-Current Decomposition and Convolutional Neural Network. Energies. 2020; 13(16):4154. https://doi.org/10.3390/en13164154
Chicago/Turabian StyleFaustine, Anthony, and Lucas Pereira. 2020. "Multi-Label Learning for Appliance Recognition in NILM Using Fryze-Current Decomposition and Convolutional Neural Network" Energies 13, no. 16: 4154. https://doi.org/10.3390/en13164154
APA StyleFaustine, A., & Pereira, L. (2020). Multi-Label Learning for Appliance Recognition in NILM Using Fryze-Current Decomposition and Convolutional Neural Network. Energies, 13(16), 4154. https://doi.org/10.3390/en13164154