Article

Full Surface Heat Transfer Characteristics of Stator Ventilation Duct of a Turbine Generator

1
School of Mechanical Engineering, Pusan National University, Busan 46241, Korea
2
Department of Mechanical Engineering, Virginia Polytechnic Institute and State University, Blacksburg, VA 24061, USA
3
Doosan Heavy Industries & Construction, Changwon 51711, Korea
*
Author to whom correspondence should be addressed.
Energies 2020, 13(16), 4137; https://doi.org/10.3390/en13164137
Submission received: 8 July 2020 / Revised: 31 July 2020 / Accepted: 5 August 2020 / Published: 10 August 2020

Abstract

:
Turbine generators operate with complex cooling systems due to the challenge in controlling the peak temperature of the stator bar caused by Ohm loss, which is unavoidable. Therefore, it is important to characterize and quantify the thermal performance of the cooling system. The focus of the present research is to investigate the heat transfer and pressure loss characteristics of a typical cooling system, the so-called stator ventilation duct. A real scale model was built at its operating conditions for the present study. The direction of cooling air was varied to consider its operation condition, so that there are: (1) outward flow; and (2) inward flow cases. In addition, the effect of (3) cross flow (inward with cross flow case) was also studied. The transient heat transfer method using thermochromic liquid crystals is implemented to measure full surface heat transfer distribution. A series of computational fluid dynamics (CFD) analyses were also conducted to support the observation from the experiment. For the outward flow case, the results suggest that the average Nusselt numbers of the 2nd and 3rd ducts are at maximum 100% and 30% higher, respectively, than the inward flow case. The trend was similar with the effect of cross flow. The CFD results were in good agreement with the experimental data.

1. Introduction

The increasing demand for electric energy drives the need for bigger power generation systems, in general. It continuously requires larger capacity turbine generators with higher efficiency. The turbine generator is simple in its principle but is also a very complicated machine to meet the requirements for performance and reliability. One of the key challenges is to control the peak temperature of the generator caused by Ohmic loss, which is unavoidable. The peak temperature of a generator should typically be maintained below 130 ℃. Depending on overall heat removal and installation requirement, air or hydrogen is used for the cooling medium. Often, air is preferred for its availability and safety to handle compared to hydrogen. However, hydrogen offers much higher heat capacity, so it is the choice for the requirements of the highest heat removal.
Figure 1 shows the typical cooling system of a turbine generator. Cooling air pumped by a fan feeds into rotor ventilation duct and the spent air (hotter) mixes with the air through stator ventilation ducts in the air gap. The stator cooling circuit consist of radially inward and outward flows, while the rotor only implements radially outward flow cooling. The cooling circuit shown in Figure 1 is often called forward cooling with a multiple radial system. The reverse cooling circuit circulates the flow in the opposite direction so that the fan pumps air (or Hydrogen) towards the cooler (heat exchanger). Hence, cooler cooling air can be fed to improve heat transfer in the stator (via the stator ventilation duct). The multiple radial system means that the directions of the cooling flow through the stator ventilation duct are the combination of radially inward and outward flows, as shown in Figure 1. An alternative approach is to form a simple radial system which means the flow direction is either radially inward or outward. Therefore, designer should build an appropriate cooling circuit to meet the specific requirements [1,2]. For the complex cooling system implemented for the turbine generator, it is important to characterize and quantify the heat transfer and pressure loss to meet the required performance and reliability.
There was much effort to investigate the complex cooling system of the turbine generator. Han et al. [3] analyzed the flow field of a sectional ventilation model of fan, rotor, air gap, and stator applying CFD. The predicted results highlight the flow interaction in the air gap and the formation of swirling flow. Yoo et al. [4] reported the detailed heat transfer and pressure loss characteristics of a rotor ventilation duct applying experimental and CFD approaches. The stationary measurements were also compared with CFD prediction in a rotating frame showing Coriolis force-induced secondary flow in the rotor ventilation duct. In the air gap, the spent cooling air from rotor and stator meets and interacts with rotating and stationary surfaces of rotor and stator, respectively. It forms so-called Taylor-Couette flow. Tang et al. [5] focused on the flow and heat transfer in the air gap region, but the approach was limited in the 2D annular model. Mayle et al. [6] conducted numerical and also experimental study using a model generator with and without rotor cooling flow injection. They reported that the tangential velocity of the flow in the air gap is only half of the rotor speed, and also confirmed good agreement between the numerical and experimental data. The end winding has a complicated configuration connecting the stator bars in multiple locations. Tong [7] applied CFD to understand the complicated flow and pressure field of a realistic geometry of end winding and came up with optimized cooling flow path configuration. Klomberg et al. [8] took a similar approach to model the domain around a real end winding and proposed convective heat transfer coefficient against the rotational speed and radial velocity. Furthermore, they also reported CFD application to evaluate the influence of various ventilation schemes on heat transfer of the stator bar of a hydrogenator [9]. The computational domain included fan, end winding, and stator ventilation system. For the stator ventilation duct, much of the effort was focused on measuring flow field and pressure loss, and predicting flow and heat transfer by applying CFD. Carew and Freeston [10] reported an early work measuring the pressure loss through the duct considering the inlet cross flow effects. They showed that the total pressure loss is largely occurring near the wedge region. There are further reports on the detailed velocity and pressure variations in the stator ventilation duct applying CFD [11,12], as well as experiments [13,14,15]. To represent more realistic geometry and interface around stator ventilation duct, Schirittweiser [16] predicted the velocity distribution and heat transfer coefficient of sectional models of a stator ventilation duct using CFD. The computational model included the air gap so that the cross flow is also simulated. Li et al. [17] investigated the influence of the axial velocity of the air gap on the axial flow rate distribution of a stator ventilation system by applying experiments and Finite Element Method analysis. Liang and Bian [18], and Wang et al. [19] predicted the effect of the radial gap on that stator bar temperature and flow filed of a stator ventilation duct. Further study is being performed in design improvement. Zhao et al. [20] reported an optimization study on ventilation spacer of a stator ventilation duct using CFD and experiments. Xiong et al. [21] also applied CFD and experiments to redesign the cross-bow support steel in a radial ventilation channel to improve the stator cooling capacity. The simulation results show that improvements in the height of the radial ventilation duct, the material of cross-bow support components, and the structure of support components can lead to decreases of the stator part temperature rise. The coupled CFD approach is being applied to resolve the fluid and solid domain. Fan et al. [22] and Liu et al. [23] demonstrated a coupled CFD approach to resolve the flow and temperature fields of the stator cooling system. Ujiie et al. [24] conducted a simple smaller scale model test for CFD validation and applied a coupled CFD approach to predict the flow and temperature field of the realistic model representing the axial half of one pole pitch of a real ventilation configuration. So far, the research efforts on stator ventilation ducts have been focused on analytic approaches. Yet, there is no experimental report on detailed heat transfer measurement, which will be very useful for CFD validation and provide further insights on design improvement.
The present study focuses on evaluating the full surface heat transfer and pressure loss of stator ventilation ducts of air-cooled turbine generators using experimental and CFD approaches. Since most of the heat is generated in the stator bar, its cooling system, the so-called stator ventilation duct, plays a very important role in achieving the reliability and efficiency of a turbine generator. The real geometry and operating condition of the stator ventilation duct of an air-cooled turbine generator (200MVA) were modelled to investigate the characteristics of heat transfer and pressure loss. The annular section of a 24° of stator ventilation duct was selected for modelling using an experimental rig and CFD analysis. The experimental rig was developed to simulate the radially (1) outward flow and (2) inward flow conditions. In addition, the (3) inward flow condition with cross flow was also investigated to represent the effect of the cross flow in the air gap. These classifications depend on flow directions, and interaction with cross flow in the air gap can be seen in Figure 1.
Firstly, the full surface heat transfer distribution was measured by applying the transient heat transfer tests using thermochromic liquid crystals (TLC). During the heat transfer measurement, local static pressures were also measured to evaluate pressure loss of the stator ventilation duct. Then the exact geometries were modelled for analysis. A series of computational fluid dynamics (CFD) analyses were conducted to support the observations from the experiment.

2. Experimental and Computation Approaches

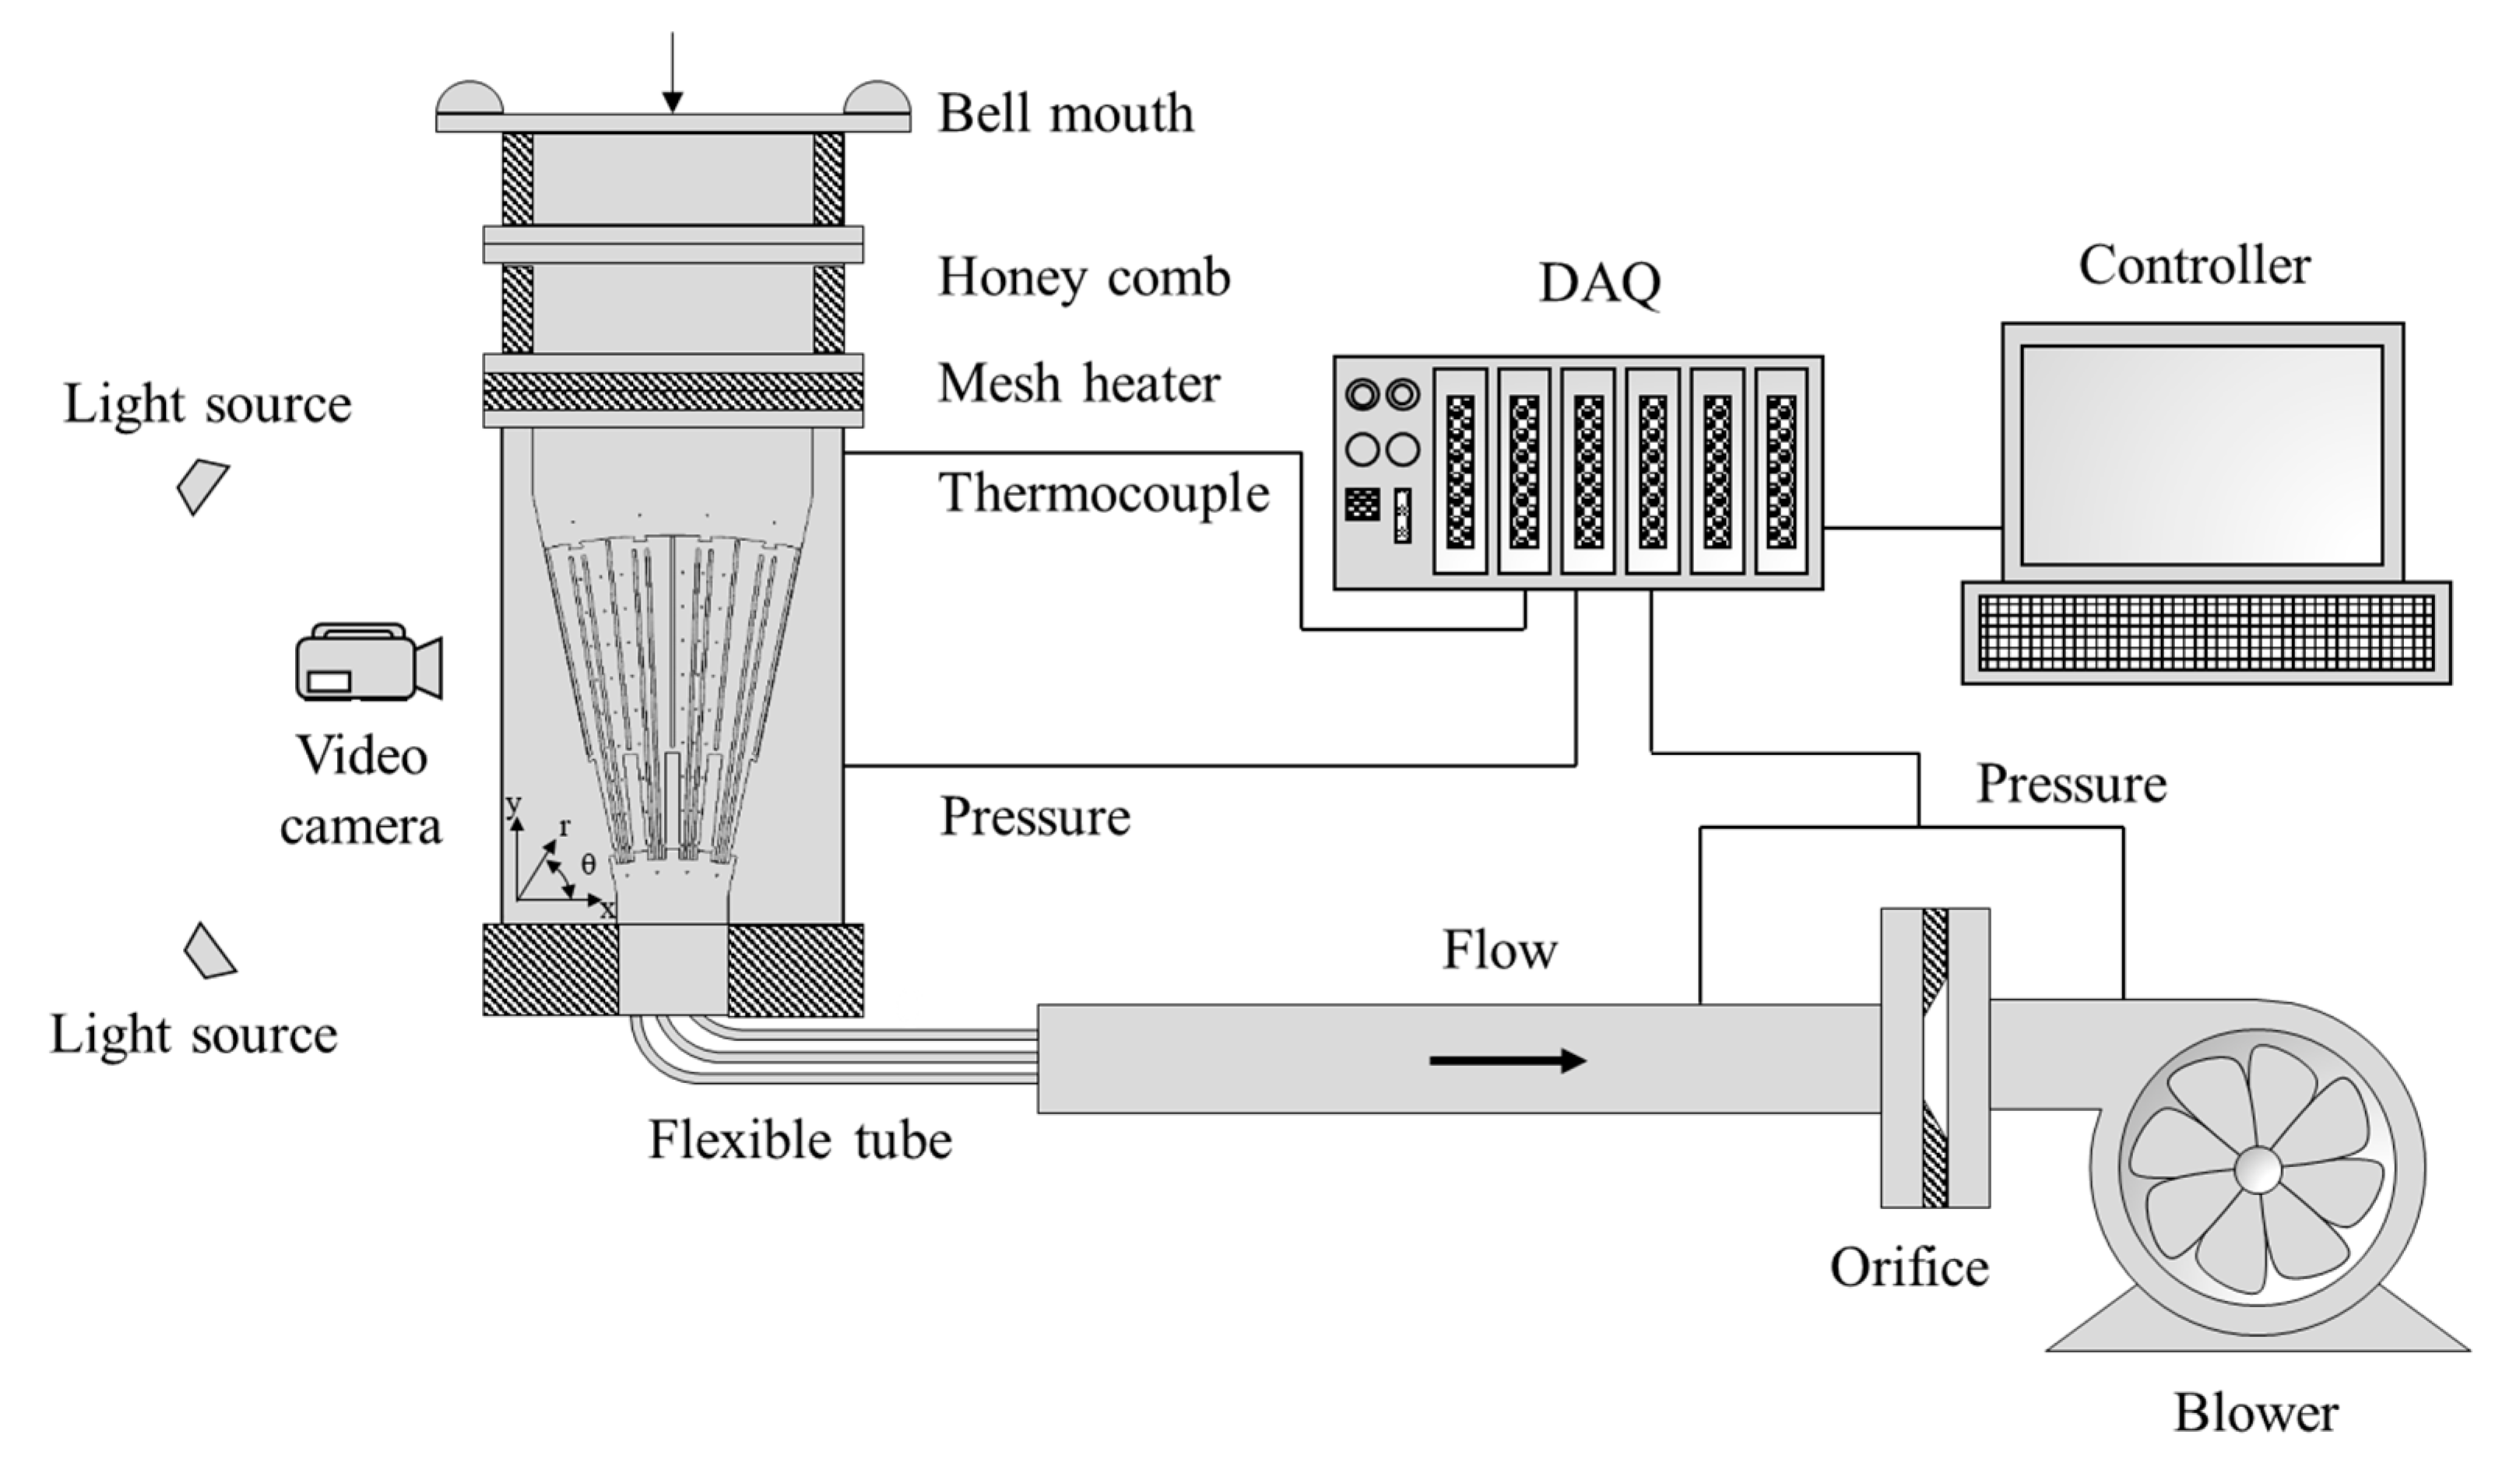
2.1. Experimental Model and Approach

In Table 1, the selected annual section (24°) of the stator ventilation cooling system is shown. Referring to model (1), the selected annular section includes four repeated passages. Each passage is divided into three individual ducts, so-called stator ventilation ducts. The middle duct (2nd duct) has simple diffuser-shaped geometry ( θ = 1 ° ) as the cross-sectional area increases along the radial direction. The other two ducts are symmetric (for example, 3rd and 4th ducts, θ = 2 ° ). The cooling air through these two symmetric ducts is in direct contact with the stator bar, which is the main source of the heat due to Ohmic loss. The wedge is to hold the position between stator bar and stator ventilation duct. It should be noted that the cross-sectional area is minimum at the wedge. The key bar installed in the end of the 4th~6th ducts is to hold the stator ventilation ducts in the axial direction. There were three different flow configurations to be tested: (1) outward flow; (2) inward flow; and (3) inward with cross flow, as shown in Table 1. Those represent all possible flow conditions depends on the location of the stator ventilation duct (refer to Figure 1).
The 2nd and the 3rd ducts were selected for detailed analysis because those configurations are repeated geometries. Figure 2 shows the detailed geometry of the ducts and its cross-sectional shape at each end. In addition, the two distinguishing geometric features, the wedge (a) and stator bar (b), are shown in detail. In the 3rd duct, the wedge is located at r/R ~ 0.11 and the region of 0.11 < r/R < 0.3 is in contact with stator bar. The variation of its cross-sectional area is shown in Figure 3. As noted, there are two abrupt changes in cross-sectional area of the 3rd duct due to the presence of the wedge and stator bar. In contrast, the area variation of the 2nd duct is continuous as the radius increases.
To characterize the detailed heat transfer and pressure loss, the corresponding local Reynolds numbers are defined based on the inlet hydraulic diameter and aerothermal condition for each cooling flow direction. However, the average Reynold numbers were used to compare the overall heat transfer and pressure loss values. In Table 2, local and average Reynold numbers were reported as the test matrix.
The schematics of the test facility, including pump, orifice, honeycomb, test model with bell mouth, are shown in Figure 4. For the experiment, a real scale model was made from Perspex. The detailed heat transfer was measured applying thermochromic liquid crystals to the internal surfaces of stator ventilation ducts. A fast response heater mesh developed by Gillespie [25] was used to provide the step change in air temperature at the inlet of the test model.
A data acquisition system recorded all of the thermocouple and other voltage channels during the experiment. The system is capable of logging 32 channels at a sampling rate of 250 Hz. A program written in National Instrument LabVIEW 2009 controls the data acquisition hardware and allows the temperature and voltage measurements. The upstream and downstream pressure differences across the orifice flow meter [26] were measured using pressure transducers (SENSORTECHNICS, HDI Series). All pressure transducers were calibrated using a pressure calibrator (FLUKE, 718 1G). The same pressure transducers were also used to measure the local static pressure of the stator ventilation duct.
The local static pressure distributions of the stator ventilation ducts were measured using the radially distributed pressure taps. Figure 5a shows the radial coordinates of ten pressure taps. Air temperature signals were recorded at two measurement planes. The positions of the air thermocouples are also shown in Figure 5b,c, respectively. The thermocouples (T-type) were calibrated against an Resistance Temperature Detectors sensor (Omega, PT100 RTC Probe) using a temperature calibrator (Beames, MC5). The typical junction bead diameter was about 0.3 mm.
The transient heat transfer technique using thermochromic liquid crystals (TLC) was applied to measure the fill surface heat transfer distribution. The experimental technique has been developed over decades and documented [4,27]. The one-dimensional semi-infinite heat conduction equation was used to evaluate the local surface temperature; suitable boundary conditions must be applied for the heat conduction model to be valid. The entire model must be isothermal at the beginning of each test to satisfy the boundary condition. Thus, before each experiment, the test surface was allowed to settle to the unheated flow temperature to satisfy the isothermal condition. The test surface was exposed to heated flow with a near-step increase in temperature, which resulted in a monotonic increase in surface temperature. The heat must not penetrate the full depth of the test surface during the experiment to satisfy the semi-infinite solid assumption. The use of a material of low thermal diffusivity (α), e.g., Perspex, α = 1.0 × 10 7   m 2 / sec   , increases the test time and also limits the lateral conduction (Schultz and Jones [28]). Perspex is frequently used because it is optically clear and has accurately known thermal properties (Ireland et al. [29]). For the current test rig, a minimum thickness of Perspex of 15 mm was used. This implies a penetration time (τpenetration) through the thinnest point of the test surface of approximately 140 seconds. From the color change of TLC, the local surface temperature was inferred indirectly as the heat transfer coefficient value was searched. For each stator ventilation duct heat transfer experiment, the color change of TLC was recorded using three digital full HD video cameras (JVC-GZ-HD6KR). Light emitting diodes (LEDs) were connected to the heater mesh power supply to indicate the start of heating and to match the start time of each camera. The uncertainty in measured heat transfer coefficient, ± 7.3%, was calculated according to the procedure proposed by Kline and McClintock [30] and Moffat [31].

2.2. Computational Approach

The CFD model representing the computational domains of the test model was built using a commercial code, FLUENT 14.0. The computational domain and the detail of mesh (18M cells) are shown in Figure 6. The cell growth ratio was limited to 1.2 to avoid large jumps in cell size, which may deteriorate numerical diffusion. The boundary layer through which the heat is transmitted in convective heat transfer must be modelled accurately in the simulation. The height of the first element adjacent to the wall Δy should be as small as possible to minimize y+. A fine prism layer of 15 was generated to achieve a non-dimensional wall distance (y+) below 1 to allow the validity of using the enhanced wall treatments with the chosen turbulence model in the solver, where the viscous sub-layer and buffer zone were discretized.
The Reynolds-averaged Navier-Stokes (RANS) equations are time-averaged equations to describe turbulent flows. The choice of the appropriate turbulence model has a major effect on the results. A comparison of various turbulence models is shown in Figure 7. It turns out that the k-ε turbulence model with enhanced wall treatment fits best to the both pressure and heat transfer coefficient measurement results. Consequently, all simulations in this paper have been carried out using the k-ε model with enhanced wall treatment.
For setting boundary conditions of the computation domain, the exact measurements made in the experiments were applied. Pressure inlet and outlet conditions were applied with constant wall temperature, reflecting the transient heat transfer test condition.

3. Results

3.1. Detailed Flow Filed Analysis

Figure 8 shows the predicted velocity distributions of the three different flow configurations. For more detailed observation of the flow characteristics, the local velocity profiles are presented in Figure 9. The h is representing the height of the duct, which is constant along the radial direction while the width of the duct, w, varies (refer to Figure 2). Each axis of the plot was normalized by the value at r/R = 0.05, which is the very beginning of the stator ventilation ducts. In comparison of outward and inward flow cases of the 2nd duct (Figure 9a,b versus c,d), flow deceleration and acceleration depending on its flow direction were clearly observed. When the cross flow is introduced to the inward flow case, Figure 9e shows the distorted velocity profile at the exit plane of the 2nd duct (r/R = 0.05) as it was shown in Figure 8c. The velocity profiles in the 3rd duct, Figure 9f–h, look more complicated, as they are influenced by the variation in the cross-sectional area (refer to Figure 3). Compared to the 2nd duct (Figure 9b), the peak velocity (at r/R = 0.09) of the 3rd duct of outward flow case (Figure 9f), is about 3.5 times higher, so that it results the higher dynamic head loss at the entry region, as shown in Figure 10b. For the inward flow case of the 3rd duct, the peak velocity occurs at the exit, r/R = 0.05 and the similar distorted velocity profile is observed by introducing the cross flow, Figure 9g,h.

3.2. Local Static Pressure Distribution

Figure 10 shows the local static pressure distributions of the 2nd and 3rd ducts. The radial locations of the static pressure taps are shown in Figure 5. The local static pressure was normalized by inlet static pressure at r/R = 0 or 1 depending on its flow direction. For the outward case, the 2nd and 3rd ducts can be considered as a diffuser. Therefore, local static pressure will be recovered while there is still frictional loss due to the effect of viscosity. In Figure 10a,b, it can be observed that most of the pressure loss occurred at the entrance region of the two ducts. The 3rd duct has a wedge soon after the sharp edge inlet region, resulting in higher pressure loss than the 2nd duct. In addition, there is also the stator bar which occupies the region of 0.11 < r/R < 0.3. As a result, the full recovery of local static pressure was observed in the downstream of the region.
For the same 2nd and 3rd ducts, there was change in flow direction so that the Figure 10c,d shows the local static pressure distribution of the inward cases. Now the two ducts can be regarded as a nozzle or a contracting duct. The flow velocity accelerated as the cross-sectional area decreased with no adverse pressure gradient. In the 3rd duct (Figure 10d), the effect of abrupt change in the cross-sectional area is clearly shown in the region of 0.11 < r/R < 0.3. Flow velocity accelerated further in the region, which can cause a sudden increase in pressure loss. After the entrance, flow passes the wedge region where the cross-sectional area is at minimum, so that most of the pressure drop occurs.
Introducing the cross-flow, the difference in local static pressure distribution of inward flow cases can be observed in Figure 10e,f. The local static pressure in the exit region was influenced by cross flow, which reflects the effect of the rotating flow in the air gap between the rotor and stator. For the 3rd duct, the accelerated flow velocity due to the wedge prevented such a cross flow ingestion. The recognizable difference can be seen in the exit region of the 2nd duct where the recovery of local static pressure can be observed.

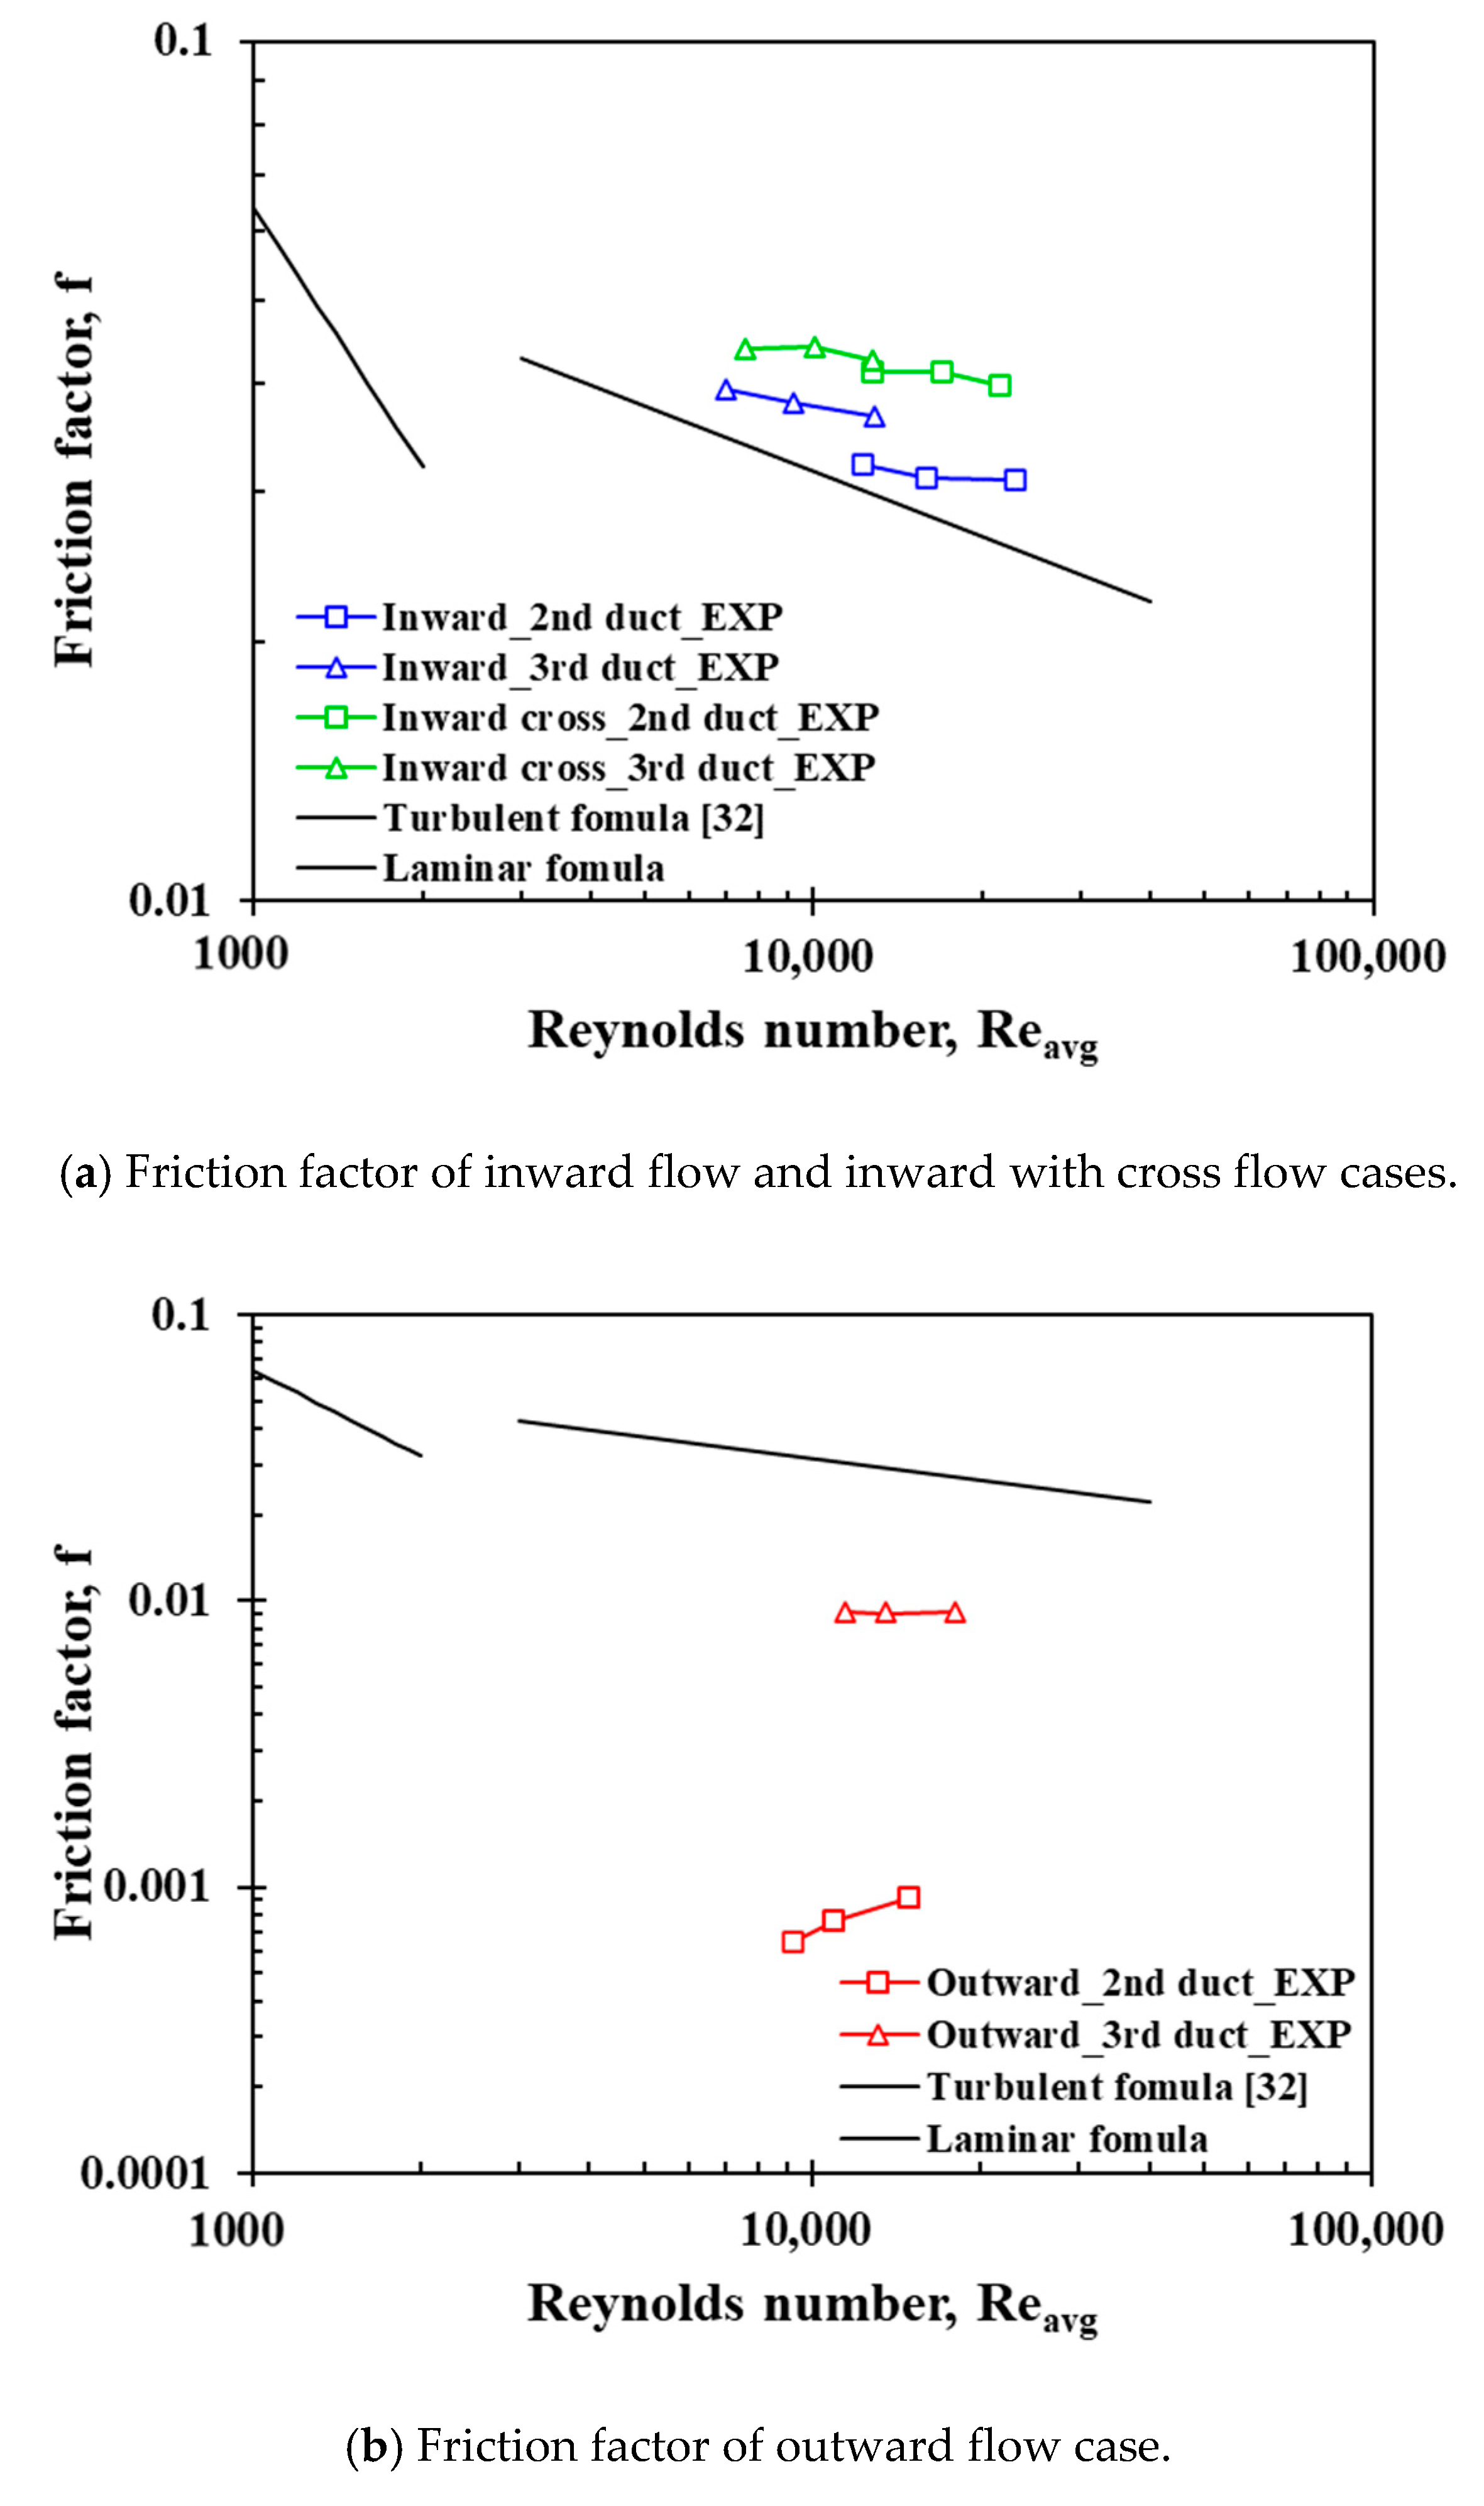
3.3. Overall Frictional Loss (Exclude Entrance Effect)

Figure 11 shows the friction factor distribution of the outward flow, inward flow, and inward with cross flow cases. The friction factor is calculated from the static pressure difference (excluding entrance effect), Δp = p19−p11 for outward flow case, Δp = p11−p19 for inward and inward with cross flow cases as
f = Δ p D h R 2 ρ v 2
where, ρ is density; Dh is average hydraulic diameter; R is the radial distance of pressure measurement locations (p19 and p11); v is inlet velocity.
f from the Blasius formula [32] for turbulent flow in smooth pipes with 4 × 10³ < R e D h < 105 is shown in the results for a reference.
f = 0.316 R e D h 1 / 4
As the flow of the inward, and the inward with cross flow cases continuously accelerated, the effect of frictional pressure loss was higher than the Blasius formula. The effect of cross flow to the friction factor is clearly seen in the comparison. For the outward flow case, Figure 11b, the friction factor of the 2nd and 3rd ducts are much lower than Blasius formula as it behaves as a diffuser.

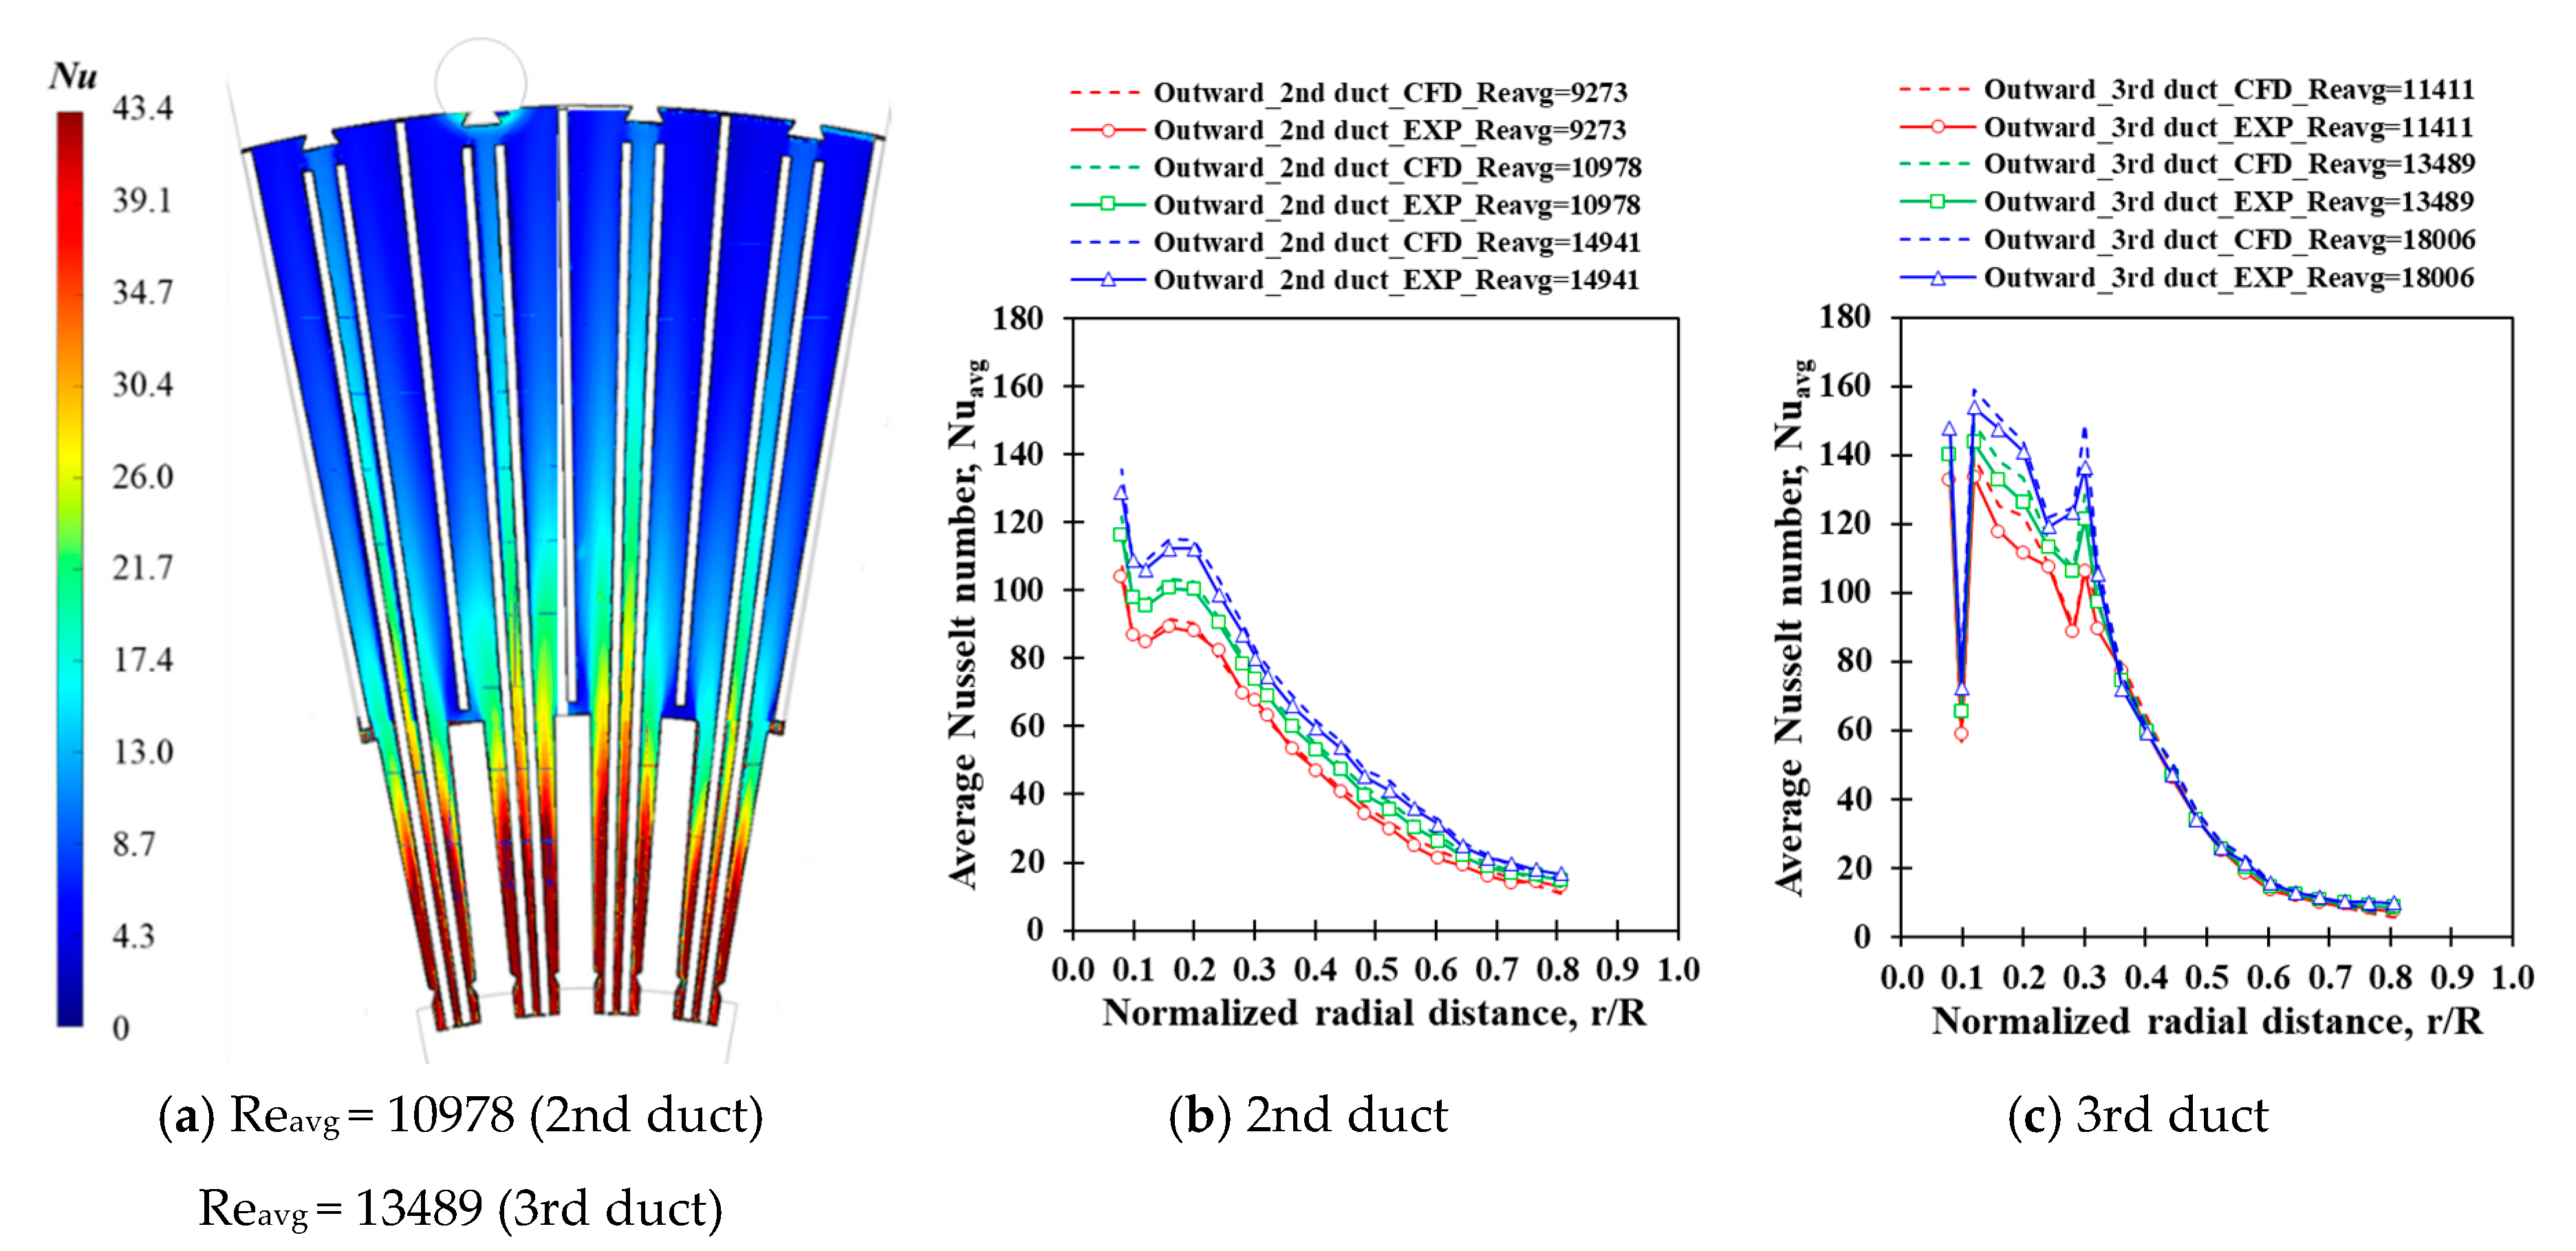
3.4. Heat Transfer Characteristics

Figure 12 shows the detailed Nusselt number distribution of the outward case at three different Reynold numbers. The highest Nusselt number values were observed in the entrance regions as expected. In the entrance region of the 3rd duct, there is a wedge which has minimum cross-sectional area. Therefore, it suppressed the flow through the duct, while there was no such a restriction in the 2nd duct. It resulted in the difference in the comparison of Nusselt number distributions of the two ducts: the Nusselt number of the 3rd duct decreased rapidly through the stator bar region (0.11 < r/R < 0.30). The detailed Nusselt number distributions of the inward case are presented in Figure 13. It shows the highest heat transfer in the entrance regions of the 2nd and 3rd ducts. Especially for the 3rd duct, higher heat transfer region around the stator bar (0.11 < r/R < 0.30) was observed. This is due to the accelerated flow around the stator bar as the cross-sectional area decreased. For the same reason, a higher heat transfer region is shown in the downstream of the wedge. For the 2nd duct, as it has a nozzle-like geometry, the heat transfer increased smoothly as the flow accelerated. The detailed Nusselt number distribution of the inward with cross flow case was similar to the inward flow case, as shown in Figure 14. The heat transfer coefficient of the second duct gradually decreased along the flow direction, while the that of the third duct had a peak value in the wedge region (r/R = 0.1). The peak heat transfer was due to the thin thermal boundary layer at the beginning of the entrance. Then, the heat transfer coefficient decayed rapidly as the thermal boundary layer developed toward the downstream. The predicted heat transfer values from CFD showed good alignment with the measurements.

3.5. Overall Area Averaged Heat Transfer

Figure 15 shows a comparison of overall area averaged Nusselt number. The trend of the outward flow case Figure 15a showed different gradients compare to the inward and inward with cross flow cases. The effect of the cross flow was more dominant for the 2nd duct compare to the 3rd duct values. This is mainly because of the abrupt changes in local heat transfer due to the wedge and stator bar of the 3rd duct. In addition, toward the downstream of stator bar (r/R > 0.3), the local heat transfer distribution of the 3rd duct was very sharply decreasing, as shown previously in Figure 12a. Because of no interference and a constant decreasing cross-sectional area, the flow through the 2nd duct accelerated so that it exhibited higher heat transfer than the Dittus–Boelter correlation. For the outward flow case, the cross-sectional area increased in the radial direction. As the result, the flow decelerated so that it did not promote heat transfer. While there was no useful reference to compare the overall area averaged heat transfer, the Dittus–Boelter correlation (Equation (3)) [33] was added for reference.
N u D B = 0.243 R e 0.8 P r 0.4
where, Pr is Prandtl number.
Since the heat transfer correlation representing the stator ventilation duct (often called wedge-shaped duct) is rarely available, it will be worthwhile to report the experimental correlations from the present work. Equations (4) and (5) are the new correlations based on the outward and inward flow cases of the 2nd duct, as they represent generic configurations. Depending on flow directions, each case represents the heat transfer in a simple diffuser or nozzle geometry with an angle of 1°. The comparison between the measured data, new correlations, and the Dittus–Boelter correlation are shown in Figure 15b. It should be noted that inward with cross flow of the 2nd duct and the cases for the 3rd duct are for very specific applications, so that correlation was not produced for the reason.
Inward   flow   correlation   N u θ = 1 ° = 0.00286 R e a v g 0.98 P r 0.4
Outward   flow   correlation   N u θ = 1 ° = 0.5197 R e a v g 0.49 P r 0.4
In comparison of the three cooling configurations, (1) outward flow, (2) inward flow, and (3) inward with cross flow, the research aim will be to evaluate the heat transfer around the stator bar. Nusselt number distribution of outward flow in the vicinity of stator bar (0.11 < r/R < 0.3) is in the range of 110~150 (Figure 12b), while the peak values of the other two (Figure 13b and Figure 14b) were less than 45. This is true even considering the fact that the average Reynold numbers of the outward flow cases are also 1.5 times higher than the other two. Therefore, the outward flow configuration performed better in terms of promoting heat transfer of the stator bar. This can be also seen in Figure 15a where the overall heat transfer is compared.

4. Conclusions

This paper presents experiments and CFD analysis to investigate the full surface heat transfer coefficient and pressure loss characteristics of the stator ventilation duct of a turbine generator. Real scale models were developed for the present study.
The measured heat transfer and pressure data was used to selected promising mesh type and turbulence models for CFD prediction. The sensitivity study on mesh and turbulence models presented will be a useful guideline for other researchers. In general, tetra mesh performs poorly in predicting pressure variation of the duct. In terms of the turbulence model and wall function, the predictions from SST and k-ε realizable with enhanced wall function followed the pressure variation better than other models. CFD underpredicted average heat transfer coefficients, but the selected model (Hexa mesh, k-ε realizable with enhanced wall function) followed the local heat transfer distribution well enough to represent the pressure and flow characteristics. The velocity profiles predicted using the validated CFD model provide insights to understand the pressure loss and heat transfer mechanism observed from the measured data. Since the model represents a real geometry, there was a strong entrance effect on the velocity profile and local static pressure distribution of all cases. The effect of cross flow reduces average heat transfer as it builds extra pressure in the mixing zone. These findings were also observed in the measured full surface heat transfer distributions.
Detailed heat transfer data is rarely available for wedge-shaped ducts. The measured local and area-averaged Nusselt number distributions characterize the heat transfer through the stator ventilation duct and also provide useful design data. The configuration and flow directions of the 2nd duct ( θ = 1 ° ) represent simple diffuser and also nozzle flows. The 3rd duct is more complicated and applied geometry, as it has wedge and a stator bar. For the outward flow case, the average Nusselt number of the 2nd duct was higher than the 3rd duct. Compared to the inward flow case, the results suggest that the average Nusselt numbers of the 2nd and 3rd ducts were at maximum 100% and 30% higher, respectively. The trend was similar with the effect of cross flow. Since the 2nd duct can represent the generic geometry of wedge-shaped duct, two heat transfer correlations were developed for future reference and application. To the best of the authors’ knowledge, the present results are the first measured data on full surface heat transfer coefficient of a stator ventilation duct. Hence the findings and proposed new correlation will be a useful reference.
For future study, the unsteady interaction between the air gap and stator ventilation duct is a challenging but interesting area. Taylor–Couette flow can be observed in this region, so the flow and heat transfer coupling between the air gap and stator cooling system will provide useful insights for designers, and also findings for academic research.

Author Contributions

S.J. conducted experiment and CFD, and wrote the draft paper. C.S. supervised the research project and revised the paper. J.Y. supervised experiments and CFD. S.H. and K.H. coordinated the project and provided technical requirements. All authors have read and agreed to the published version of the manuscript.

Funding

The authors would like to thank Doosan Heavy Industries & Constructions for the sponsorship on this project, and special thanks to Daihyun Ahn, Sunghan Lee, Gyounggu Cho and Myungduk Seo for their guidance and encouragement. Furthermore, this work was supported by the Korea Institute of Energy Technology Evaluation and Planning (KETEP) and the Ministry of Trade, Industry & Energy (MOTIE) of the Republic of Korea (No.20181110100400).

Conflicts of Interest

The authors declare no conflict of interest.

References

  1. Zhou, G.-H.; Han, L.; Fan, Z.-N.; Zhang, H.-B.; Dong, X.-C.; Wang, J.; Sun, Z. Ventilation Cooling Design for a Novel 350-MW Air-Cooled Turbo Generator. IEEE Access 2018, 6, 62184–62192. [Google Scholar] [CrossRef]
  2. Fechheimer, C.J. Turbine Generator Ventilation. J. Frankl. Inst. 1933, 216, 505–532. [Google Scholar] [CrossRef]
  3. Han, J.D.; Hong, G.Y.; Tang, L.; Lu, Y.P. Numerical Studies on the Flow Field of Stator and Air Gap for Large Air-Cooled Turbo-Generator. In Advanced Materials Research; Trans Tech Publications Ltd.: Stafa-Zurich, Switzerland, 2012; Volume 516, pp. 970–975. [Google Scholar]
  4. Yoo, W.; Jeon, S.; Son, C.; Yang, J.; Ahn, D.; Kim, S.; Hwang, K.; Ha, S. Full Surface Heat Transfer Characteristics of Rotor Ventilation Duct of a Turbine Generator. Appl. Therm. Eng. 2016, 94, 385–394. [Google Scholar] [CrossRef]
  5. Tang, L.; Lu, Y.P.; Deng, H.Y.; Wang, Z.M. Research of Flow Field and Temperature Field in 2D Annular Space of Air-Gap. In Applied Mechanics and Materials; Trans Tech Publications Ltd.: Stafa-Zurich, Switzerland, 2012; Volume 214, pp. 76–81. [Google Scholar]
  6. Mayle, R.E.; Hess, S.; Hirsch, C.; Van Wolfersdorf, J. Rotor-Stator Gap Flow Analysis and Experiments. IEEE Trans. Energy Convers. 1998, 13, 101–110. [Google Scholar] [CrossRef]
  7. Tong, W. Numerical Analysis of Flow Field in Generator End-Winding Region. Int. J. Rotat. Mach. 2008, 2008, 692748. [Google Scholar] [CrossRef] [Green Version]
  8. Klomberg, S.; Farnleitner, E.; Kastner, G.; Bíró, O. Characteristics of the Convective Heat Transfer Coefficient at the End Winding of a Hydro Generator. J. Therm. Sci. Eng. Appl. 2015, 7, 011011. [Google Scholar] [CrossRef]
  9. Klomberg, S. Numerical Study of the Cooling Air Flow in a Hydro Generator with Various Ventilation Systems. In Proceedings of the European Conference on Computational Fluid Dynamics, Barcelona, Spain, 20–25 July 2014. [Google Scholar]
  10. Carew, N.J.; Freeston, D.H. Paper 12: Fluid Flow Losses in AC Generator Stator Ventilating Ducts. In Proceedings of the Institution of Mechanical Engineers, Conference Proceedings; SAGE Publications Sage UK: London, UK, 1967; Volume 182, pp. 87–95. [Google Scholar]
  11. Ding, S.; Liu, H.; Sun, Z.; Ge, Y. Notice of Retraction: Research of Fluid Flow Characteristic inside Radial Ventilation Duct for Large Generator. In Proceedings of the 2010 Asia-Pacific Power and Energy Engineering Conference, Chengdu, China, 28–31 March 2010; IEEE: Piscataway, NJ, USA, 2010; pp. 1–4. [Google Scholar]
  12. Hribernik, A.; Fike, M.; Gregorc, B. Investigating the Malfunction of a Hydrogenerator’s Cooling-System. In Proceedings of the TMT 2011 15th International Research/Expert Conference” Trends in the Development of Machinery and Associated Technology, Prague, Czech Republic, 12–18 September 2011; pp. 861–864. [Google Scholar]
  13. Gunabushanam, N.; Suresh, J. Experimental and CFD Analysis of Hydrogenerator Ventilation Components. Proc. CIGRE Sess. 2006. [Google Scholar]
  14. Pasha, A.A.; Hussain, M.; Gunubushanam, N. Experimental and CFD Analysis of Hydrogenerator Stator. In Proceedings of the 37th National and 4th National Conference on Fluid Mechanics and Fluid Power, IIT Madras, Chennai, India, 16–18 December 2010. [Google Scholar]
  15. Chella, R.G.; Govinda, R.K.; Gunabushanarn, N. Design and Analysis of Hydro Generator Ventilation System Using Experimental and CFD. In Proceedings of the World Academy of Science, Engineering and Technology, Paris, France, 14–16 November 2011; Volume 75, pp. 277–280. [Google Scholar]
  16. Schrittwieser, M.; Marn, A.; Farnleitner, E.; Kastner, G. Numerical Analysis of Heat Transfer and Flow of Stator Duct Models. IEEE Trans. Ind. Appl. 2013, 50, 226–233. [Google Scholar] [CrossRef]
  17. Li, Y.; Li, W.; Su, Y. Sensitivity of Axial Velocity at the Air Gap Entrance to Flow Rate Distribution at Stator Radial Ventilation Ducts of Air-Cooled Turbo-Generator with Single-Channel Ventilation. Energies 2019, 12, 3442. [Google Scholar] [CrossRef] [Green Version]
  18. Liang, Y.; Bian, X. Influence of Stator Ventilation Channel Cutting Length on the Multi-Physics in Air-Cooled Hydro-Generator. In Proceedings of the 2012 Sixth International Conference on Electromagnetic Field Problems and Applications, Dalian, Liaoning, China, 19–21 June 2012; IEEE: Piscataway, NJ, USA, 2012; pp. 1–4. [Google Scholar]
  19. Wang, J.; Li, G.Q.; Xu, G.J.; Li, H.B.; Yuan, X. Structural Optimization for Stator Radial Ventilation Cooling System of Turbo Generator. In Advanced Materials Research; Trans Tech Publications Ltd.: Stafa-Zurich, Switzerland, 2014; Volume 1039, pp. 65–68. [Google Scholar]
  20. Zhao, X.; Fan, Y.; Li, W.; Li, D.; Cao, J.; Zhang, Y. Optimization of Ventilation Spacer for Direct-Drive Permanent Magnet Wind Generator. Energies 2019, 12, 1430. [Google Scholar] [CrossRef] [Green Version]
  21. Xiong, B.; Gu, G.B.; Ruan, L.; Li, Z.G.; Fu, D.P.; Cao, R.; Guo, S.Q.; Gao, J.S. Studies on the Structure of Radial Ventilation Channel to Improve the Cooling Capacity of Large Turbo Generator Stator. In Proceedings of the 2014 17th International Conference on Electrical Machines and Systems (ICEMS), Hangzhou, China, 22–25 October 2014; IEEE: Piscataway, NJ, USA, 2014; pp. 354–357. [Google Scholar]
  22. Fan, X.; Qu, R.; Li, J.; Li, D.; Zhang, B.; Wang, C. Ventilation and Thermal Improvement of Radial Forced Air-Cooled FSCW Permanent Magnet Synchronous Wind Generators. IEEE Trans. Ind. Appl. 2017, 53, 3447–3456. [Google Scholar] [CrossRef]
  23. Liu, Y.; Li, C.; Fu, G.; Gao, S.; Tian, Y.; Zhai, Y. Study of Three-Dimensional Temperature Field with Changed Structures of Air-Cooled Turbo Generator Stator. Int. J. Control Autom. 2015, 8, 37–42. [Google Scholar] [CrossRef]
  24. Ujiie, R.; Arlitt, R.; Etoh, H. Application of Computational Fluid Dynamics (CFD) on Ventilation-Cooling Optimization of Electrical Machines. Rev. Energy Technol.-Gener. Transm. Distrib. Electr. Therm. Energy (Icemenerg) 2006, 4, 17–22. [Google Scholar]
  25. Gillespie, D.R. Intricate Internal Cooling Systems for Gas Turbine Blading. Ph.D. Thesis, University of Oxford, Oxford, UK, 1998. [Google Scholar]
  26. STANDARD, B.; ISO, B. Part 2: Orifice Plates; ISO: Switzerland, 2003. [Google Scholar]
  27. Jeon, S. A Study on the Cooling Performance of a Turbine Generator Stator Ventilation Duct System. Master’s Thesis, Pusan National University, Busan, South Korea, 2015. [Google Scholar]
  28. Schultz, D.L.; Jones, T.V. Heat-Transfer Measurements in Short-Duration Hypersonic Facilities; Advisory Group for Aerospace Research and Development: Paris, France, 1973. [Google Scholar]
  29. Ireland, P.T.; Wang, Z.; Jones, T.V. Measurement Techniques: Liquid Crystal Heat Transfer Measurements. Von Karman Inst. Fluid Dyn. Lect. Ser. 1995, 1, 1–67. [Google Scholar]
  30. Kline, S.J. Describing Uncertainty in Single Sample Experiments. Mech. Eng. 1953, 75, 3–8. [Google Scholar]
  31. Moffat, R.J. Describing the Uncertainties in Experimental Results. Exp. Therm. Fluid Sci. 1988, 1, 3–17. [Google Scholar] [CrossRef] [Green Version]
  32. Blasius, H. Das Aehnlichkeitsgesetz Bei Reibungsvorgängen in Flüssigkeiten. In Mitteilungen über Forschungsarbeiten auf dem Gebiete des Ingenieurwesens; Springer: Berlin/Heidelberg, Germany, 1913; pp. 1–41. [Google Scholar]
  33. Dittus, F.W.; Boelter, L.M.K. Heat Transfer in Automobile Radiators of the Tubular Type. Int. Commun. Heat Mass Transf. 1985, 12, 3–22. [Google Scholar] [CrossRef]
Figure 1. Cooling system of turbine generator and cooling system circuit.
Energies 13 04137 g001
Figure 2. The geometrical details of the stator ventilation ducts (plane and cross-sectional views).
Energies 13 04137 g002
Figure 3. The variation in the cross-sectional area of the 2nd and 3rd ducts.
Energies 13 04137 g003
Figure 4. Schematic of test facility (set-up for inward flow).
Energies 13 04137 g004
Figure 5. The measurement locations of static pressure and temperature.
Energies 13 04137 g005
Figure 6. Computational domain and detail mesh.
Energies 13 04137 g006
Figure 7. Mesh type and turbulence model sensitivity study.
Energies 13 04137 g007aEnergies 13 04137 g007b
Figure 8. Comparison of velocity distributions at z/h = 0.5 plane.
Energies 13 04137 g008
Figure 9. Comparison of local velocity profiles.
Energies 13 04137 g009aEnergies 13 04137 g009b
Figure 10. Comparison of local static pressure distribution.
Energies 13 04137 g010aEnergies 13 04137 g010b
Figure 11. Comparison of Friction factor (exclude entrance effect).
Energies 13 04137 g011
Figure 12. Nusselt number distribution of outward flow case
Energies 13 04137 g012
Figure 13. Nusselt number distribution of inward flow case.
Energies 13 04137 g013
Figure 14. Nusselt number distribution of inward with cross flow case
Energies 13 04137 g014
Figure 15. Comparison of overall area averaged Nusselt numbers
Energies 13 04137 g015
Table 1. The details stator ventilation duct and real scale test models.
Model(1) Outward Flow(2) Inward Flow(3) Inward with Cross Flow
Energies 13 04137 i001 Energies 13 04137 i002 Energies 13 04137 i003 Energies 13 04137 i004
Table 2. Test matrix and Reynold numbers based on inlet as well as average hydraulic diameters.
Duct TypeReOutward FlowInward FlowInward with Cross Flow
2nd ductDhDh,in = 8.5, Dh,avg = 10.7 (mm)Dh,in = 12.9, Dh,avg = 10.7 (mm)Dh,in = 12.9, Dh,avg = 10.7 (mm)
Rein11,67113,81718,80510,15713,17918,98310,56914,08317,894
Reavg927310,97814,94112,24415,88822,88412,74116,97721,571
3rd ductDhDh,in = 9.0, Dh,avg = 13.9 (mm)Dh,in = 18.8, Dh,avg = 13.9 (mm)Dh,in = 18.8, Dh,avg = 13.9 (mm)
Rein17,60220,80727,774515967859520557374529460
Reavg11,41113,48918,0066973917212,868753310,07212,787
Rein and Reavg are representing the Reynolds numbers based on inlet hydraulic diameter (Dh,in) and average hydraulic diameter (Dh,avg), respectively.

