Abstract
This paper presents a multi-objective optimization strategy for pump-as-turbines (PAT), which relies on one-dimensional theory and analysis of geometrical parameters. In this strategy, a theoretical model, which considers all possible losses incurred (mainly by the components of pipe inlet, impeller and volute), has been put forward for performance prediction of centrifugal pumps operating as turbines (PAT). With the established mathematical relationship between the efficiency of PAT (both at pump and turbine mode) and the impeller controlling variables, the geometric optimization of the PAT impeller is performed with constant rotational speed. Specifically, the optimization data consist of 50 sets of impellers generated from Latin Hypercube Sampling method with its corresponding efficiencies calculated. Subsequently, the pareto-based genetic algorithm (PBGA) was adopted to optimize the geometic parameters of the impellers through the theoretical model. To validate the theoretical optimization results, the high-fidelity Computational Fluid Dynamics (CFD) simulation and the experimental data are employed for comparison of the PAT performance. The findings show that the efficiencies of both the pump and PAT optimized variables increased by 0.27% and 16.3% respectively under the design flow condition. Based on the one-dimensional theoretical optimization results, the geometry of the impeller is redesigned to suit both pump and PAT mode operations. It is concluded that the chosen design variables (b2, β1, β2, and z) have a significant impact on the PAT efficiency, which demonstrates that the optimization scheme proposed in this study is practicable.
1. Introduction
The global electricity production poses several problems that have been resolved over the years by different approaches to reduce its effect on the environment and operating costs. The generation of electricity using fossil fuels has significant implications for CO2 pollution and depletion of the ozone layer. These pollution of CO2 cause global warming, which is harmful to aquatic life and habitats as a whole [1]. The best solution for these environmental issues is definitely renewable energy which includes solar and wind power, biofuels and hydropower. However, the hydropower presents a desirable source of energy in all the renewable energy sources. Hydropower generates energy from water sources such as the ocean, rivers and waterfalls by hydraulic turbines. Hydraulic turbines are known for their high energy efficiency, but are relatively unattractive because of their high purchasing costs for small hydropower [2]. Pump-as-turbine (PAT), as an alternatively, is a conventional hydraulic pump that can be used in reversed mode to generate electricity in small hydropower plants. A PAT has many outstanding advantages when compared to hydraulic turbines. The PAT is a simple machine, easy to operate, with mass production, convenient maintenance and easily accessible [3,4]. The capital payback period of PAT has been estimated to be within two years in the range of 5–50 kW [5,6], which makes it a cost-effective alternative to hydraulic turbines. PAT is also applicable in many areas, such as the field of fertilizer production, water distribution network, water desalination, petro-chemical industry, and many other processes for energy production [7].
PAT provides technical solution for both economic suitability and system flexibility [8,9]. The introduction of PAT in the water-energy network has large potential in promoting energy savings practices [10]. A PAT can also be used for energy storage which function similarly to hydropower plants for pumped storage. According to Førsund [11], power can be produced by pumping water into a reservoir and then circulating it through a turbine components. The two-mode of operation in PAT or hydraulic power recovery turbine (HPRT) are applicable in the chemical process. First, the operation of the turbine decreases fluid pressure and at the same time permits the HPRT to retrieve part of the liquid energy and second, with a better design of the system, the pump mode operation will control the chemical process if the main pump is damaged [12].
As depicted in Figure 1, the flow direction shows the pump and PAT mode operations. The pump mode is a diffuse flow channel, which is due to the increase in flow area, thus from the tongue region to the exit area of the volute, while PAT mode is a contract flow channel, which is also due to the decrease in flow channel, thus from the throat area to the tongue of the volute. The contract flow channel hydraulic losses should be less than the diffuse flow channel, but the efficiency of the PAT is low when compared to the pump mode at off design flow conditions. Yang et al. [13] have reported that more than 50% of the total hydraulic losses in the PAT are attributed to the PAT impeller. As the pump is not suitable for operation in the PAT mode, its impeller are designed for forward rotation without taking the reverse mode operation into account.
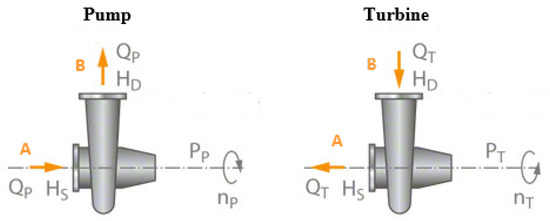
Figure 1.
Flow direction of PAT operating in pump and turbine mode.
In addition to PAT issues, pump manufactures do not generally offer the performance curves of their pumps running in PAT mode, since this involves experimental testing of the pump in PAT mode, thus a considerable increase in the investment and testing costs [14]. The prediction of performance of a pump running in reverse mode is a current topic, which involves many research groups. In the recent years, different analyses have been carried out considering the losses inside the different components of this machine in reverse mode [15,16]. Some of these studies have proposed linkage for the prediction of PAT characteristics either by efficiency or specific speed of the pump, and some have also been experiments based on their relationships. Nevertheless, the results of these studies revealed an average deviation of ±20% from experimental data [17], with deviations in certain specific speed recoding more than 40% [18]. Many predictive techniques have been published until now, as reported by Ramos and Borga [19], Wang et al. [20], Derakhshan et al. [21], Li et al. [22], Sharma [23], Alatorre-Frenk [24], and Stepanoff [25]. In parallel with these studies, researchers like [23,26,27,28,29] proposed a theoretical model based on experimental data and concluded that PAT efficiency at the best efficiency point (BEP) in turbine mode is the same as in pump mode operating under the same working conditions. Practically these formulas enable the user to determine the flow rate and the head used by the PAT at the BEP.
Since the pump is not perfectly designed to work in reverse mode, the optimization based on the PAT flow zone is required to improve the hydraulic machine performance. Furthermore, it should also be noted that the change of rotional speed of the pump under PAT mode can have significant influences on output performances of the machinery by comparison to the original pump mode since the best efficiency point of the pump and PAT mode may have a large discrepancy. However, there has been little research that focused on PAT optimization. Yang et al. [30] demonstrated that it would be more effective if the blade inlet angle value is within the range of 25–35° to ensure good performance. Derakhshan et al. [21,31] put forward a theoretical analysis to modify the geometry of the impeller and showed that it does directly affect the overall performance of the PAT. Furthermore, is highly expensive and time-consuming in pump design and optimization based on trial-and-error approach [32]. The combination of an optimization approach with CFD numerical simulation can, however, reduce the sequence of development and also reduce computational and experimental resources for performance enhancement.
For optimization procedures, theoretical 1-D calculations have proven to be extremely important tools for pump designers; they are useful in the measurement of geometric parameters in the very early stages in line with the requirements. Such measurements can easily decide whether the geometrical parameters selected are rational or not. Pump manufacturers, who desire to analyze their pump in details, in PAT mode, need tools that can enable them to predict the PAT mode geometric components and their influence on performance. Even though many researchers have worked on the energy prediction of PAT, very few researchers have worked on the theoretical optimization of PAT performance prediction. This study contributes to literature, by examining the geometrical parameters of the pump and PAT modes simultaneously to help explain the anomalous operation of PAT.
In this study, a theoretical attempt is made to optimize and predict the performance of centrifugal pump operating as PAT by modeling and analyzing all the various flow losses in the pump at each operating mode under constant rotational speed. The pareto-based genetic algorithm (PBGA) models were constructed to optimize the PAT and pump mode efficiencies. The design variables, i.e., the blade outlet width, blade exit angles, and the blade number, (b2, β1, β2, and z) were used as input parameters and the efficiencies of both pump and PAT at the design flow rate as the output parameters. In the following discussion, the theoretical model and flow losses of the pump and PAT are presented in detail. Afterwards, the PBGA algorithm was used to optimize the objective functions to identify the optimal parameters known as the pareto-frontiers solutions. In the end, the optimized values of the impeller is used to design new impeller that will suit both working conditions.
2. Theoretical Modeling of Pump and PAT
Here, 1-dimensional (1-D) theory is introduced for the description of the PAT working mechanism and further to formulate the realistic PAT working performance considering the head losses for the theoretical optimization study.
2.1. Ideal Pump and PAT Performance
The ideal theoretical head Hth, which is defined as the loss-free performance of a pump or turbine can be defined by means of Euler’s equation and velocity triangles [26]. The pump and turbine velocity triangles as illustrated in Figure 2 are determined by the inlet and outlet geometry of the pump. The velocity triangle is made up of three velocities, namely absolute velocity, relative velocity and tangential velocity of the fluid and are denoted by v, w and u respectively. The absolute velocity of the fluid can be determined by the sum of the relative velocity and the tangential. For both operating mode, subscript 2 indicates the tip of the impeller and 1 the eye of the impeller. The flow angles α and β describe the relative and absolute velocity angles compared to the tangential velocity, respectively.
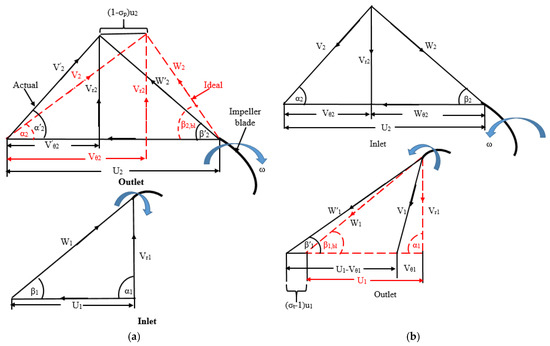
Figure 2.
Inlet and outlet velocity triangles in (a) pump mode (b) turbine mode.
The theoretical head in both pump and turbine mode can be determined by Euler’s equation for turbomachinery which is expressed as:
where u (ms−1) is the impeller (blades) longitudinal velocity, vθ (ms−1), is the tangential component of the absolute velocity, g (ms−2), is the gravitational acceleration and Hth is the theoretical head (m).
In addition, the flow leaving the impeller of the machine is not correctly guided by the blades due to the slip phenomenon, which involves the reduction of the Euler’s work. The slip factor in a pump and in a PAT is different due to opposite flows. The slip factor is defined as the ratio of actual and ideal values of the whirl velocity components at the outlet section of the impeller and it is expressed mathematically Equation (2) [33]:
By applying basic trigonometrical principles to Euler’s equation for turbomachinery and velocity triangles, the theoretical head for both pump and turbine modes can be expressed as Equations (3) and (4) respectively:
where vr (ms−1) is the radial velocity of the fluid, u (ms−1) is the impeller longitudinal velocity, β° and α° are the flow angles and σ is the slip factor, where subscripts 1, 2, t and p depict the inlet, outlet, PAT mode and pump mode, respectively.
2.2. Pump and PAT Model
A centrifugal pump was employed as turbine in this study. The pump consists of six straight impeller blades and a spiral volute with a rectangular section. The pump design flowrate Q in pump mode is 25 m3/h, and head is 8.5 m, with a rotating speed of 1450 r/min. The operational conditions of the pump mode is applied in the PAT mode. This pump operating as PAT is mainly composed of impeller with inlet and outlet diameter of 74 mm and 174 mm, respectively, and outlet width of 12 mm, with exit angles of 30°on the hub and shroud. The volute base diameter is 184 mm with inlet width of 20 mm. A summary of design parameters of the selected PAT model under study is listed in Table 1 and Figure 3 shows a sectional view of the pump impeller and volute in 2D while Figure 4 shows the actual pump structure.

Table 1.
Geometrical and operational parameters of the studied Pump and PAT in pump mode.
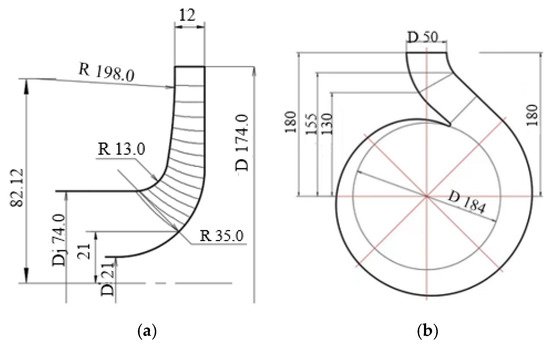
Figure 3.
Sectional view of (a) Impeller (b) Volute.
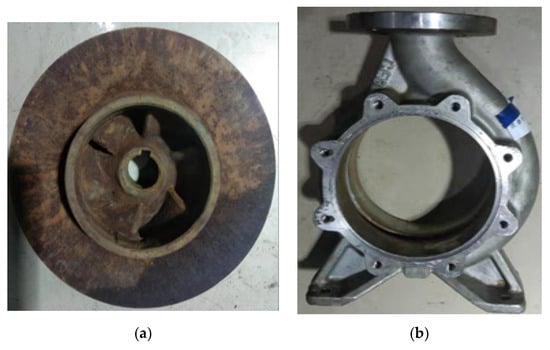
Figure 4.
Pump model: (a) Impeller (b) Volute.
2.3. Pump and PAT Head Losses
The geometrical parameters of the pump do not change when it works as turbine, only the flow and rotation direction changes. In addition, with the same rotational speed the mechanical losses, power losses due to leakage in turbine and pump modes are the same as stated by Derakshan et al. [34]. The PAT behavior is very complex and it is difficult to find a unique correlation for all pumps in reverse mode [34]. Furthermore, several expressions have to be solved to compute the hydraulic losses in the volute, impeller and outlet pipe. Therefore, since computing of hydraulic losses in PAT mode is somehow complex, these losses were estimated using pump mode.
2.3.1. Pipe Inlet Losses
The inlet pipe in pump mode is used as the PAT outlet pipe and its hydraulic friction loss can be expressed as:
where lin and Din are the length and hydraulic diameter of the inlet pipe, λ denotes the friction coefficient depending on the Reynolds number, where v0 denotes the axial velocity in the inlet pipe and is formulated as:
where Dj denotes the inlet pipe diameter, Djh denotes the impeller inlet hub diameter, Q denotes the flow rate. The friction coefficient λ is calculated on the basis of the Reynolds number and is defined as:
2.3.2. Impeller Losses
Incidence Loss
The flow angle at the blade inlet is usually equal to the blade angle under design flow rate which can meet the design specifications of no incidence inlet. Generally, when the flow rate varies, the flow angle at the blade inlet is not equal to the blade angle. And this could result in flow separation on the blade surface resulting in loss of incidence. Under off-design flow condition the relative velocity w1 decomposed into two relative velocity components w10 and Δw1 as presented in Figure 5. Under designed flow rate the imaginary relative velocity w10 has the same direction of current from the no incidence inlet. The difference of the relative velocity Δw1 is along the circumferential direction, representing the inlet incidence level. Thus, the incidence loss of blade inlet is defined as:
where finc denotes the coefficient of the incidence loss with a value between of 0.5–0.8, w (ms−1) is the relative velocity of the flow, g (ms−2) is the gravitational acceleration and Δhinc is the incidence head loss (m) [35]. This effect is noticeable in both pump and PAT modes.
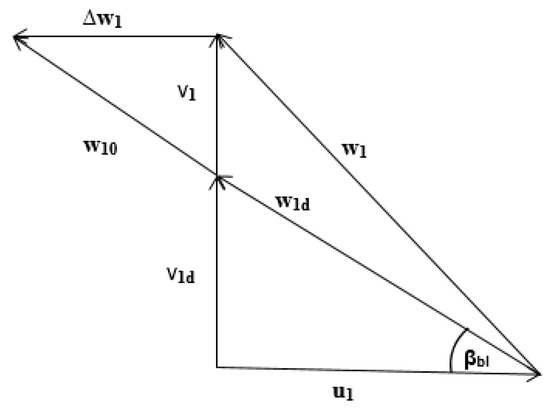
Figure 5.
Velocity triangle under off-design condition (pump-mode) at impeller inlet.
The value of Δw1 can be obtained by applying the triangle similarity theory with the velocity triangle in Figure 5, where the absolute velocity v1 is proportional to the flow rate as expressed in Equation (9):
where subscript d denotes under design flow rate, Qd (m3h−1) is the design flow rate and v1d (ms−1) is the absolute flow velocity under design flow rate.
Sharma [23] put forward Equation (9) to predict the PAT mode design flow rate and head:
where Ht (m) is the pressure head in turbine mode, Hp (m) is the pressure head in pump mode, ηt is the efficiency of the turbine mode, ηp is the efficiency of the pump mode, Qt (m3h−1) is the design flow rate of the turbine mode, Qp (m3h−1) is the design flow rate of the pump mode, Pp (W) is the power of the pump mode and Pt (W) is the power of the turbine mode.
Surface Frictional Loss
In both pump and PAT modes the friction is known as a linear loss due to the fluid viscosity effects of the wall boundary layer of the blade, impelling chamber etc. The impeller hydraulic friction head loss Δhsfl is calculated by the flow theory via pipes and is given by [36]:
where D (mm) is the impeller diameter, w (ms−1) is the relative velocity of the fluid, β° is the blade angle, Δhsfl is the surface frictional head loss in meter (m), C denotes the corresponding wetted perimeter, S denotes the impeller passage sectional area and Dhyd denotes the hydraulic diameter of impeller passage. Substrcipt 1 and 2 denote inlet and outlet of the impeller.
The hydraulic diameter and the average relative velocity are given, respectively, as, Gülich [36]
The blade length is given as:
The impeller dissipation coefficient is given as, Gülich [36]
The impeller friction coefficient fi is function of the average impeller Reynolds number Re and the roughness κ [37]:
where κ denotes roughness factor as:
Blade Loading Loss
The blades loading loss originates from the pressure differential between the pressure and the suction side of the impeller, which affects the separation of the secondary flow and the boundary layer within the pump and PAT modes. Lieblein, Schwenk [38], Coppage and Dallenbach [39] have developed the calculation equation of the diffuser factor and the calculation equation of the blade loading loss as:
where u2 is the average circumferential velocity at impeller outlet, g (ms−2) is the gravitational acceleration, Δhbl is the blade loading head loss (m) and Df is the diffuser factor and is formulated as:
where w1t (ms−1) is the relative velocity at tip of impeller inlet, w (ms−1) is the relavity velocity of the impeller outlet, Hth (m) is a theoretical head, Djt (mm) is the diameter at the tip of the inlet, D2 (mm) is the average diameter of the outlet, z, is the blade number and u (ms−1) is the impeller (blades) longitudinal velocity.
The flow in the rotor is increased with a positive pressure gradient in PAT mode and therefore separation, wake mixing, and recirculation can therefore be ignored in PAT mode because its influence on the hydraulic performance is insignificant. Therefore the separation, wake mixing and recirculation flow losses discussed are for the pump mode operation.
Separation Loss
The separation may occur in the impeller at any point. According to Tuzson [40], if the ratio of the relative velocity at the inlet w1 and the outlet w2 exceeds a value of 1.4, a portion of the velocity head difference is lost, and is expressed as:
where w1 and w2 are the relative velocity of the inlet and outlet respectively, Δhsl (m), is the separation head loss and g (ms−1) is the gravitational acceleration. Subscript 1 and 2 denote the inlet and outlet of the impeller.
Recirculation Loss
Impellers with relatively large inlet diameters are mostly likely to recirculate and are usually found in high specific pumps. The appearance of inlet recirculation results in parasitic power demand. The recirculation power loss can be formulated as, [41]:
where Q* (m3/h) is the ideal flow rate; D (mm) is the diameter of the impeller; α2 denotes the impeller outlet absolute flow angle under pump mode; ΔQlk is the leakage flow rate; ΔPrec (W) is the recirculation power loss.
Wake Mixing Loss
The jet/wake phenomenon occurs at the impeller outlet, which results in wake mixing loss. This phenomenon takes place due to the divergent shape and abrupt expansion on the trailing edge of the impeller. The wake mixing loss is formulated by [42] as:
where b2 denotes the impeller outlet blade width, b3 denotes the volute width, Δhmix (m) is the wake mixing head loss and εwake, denotes the wake coefficient, which is formulated as:
Disk Friction Loss
When calculating the shaft power demand, the disk friction power is divided by the flow rate and the pressure head, which is added to the theoretical head. [43] formulated the disk friction loss as expressed in Equation (19), which is applicable in both pump and PAT operations.
where fdf, denotes the coefficient of the disk friction loss which can be formulated as:
and Redf is the Reynolds number, which can be calculated as:
where fdf, is the loss coefficient of the disk friction, ΔPdf (W) is the disk friction power loss and μ is the dynamic viscosity of the medium.
Leakage Loss
In both pump and PAT mode operations, the leakage flow, which is induced by the gap between impeller and casing is defined by [40] as:
where Clkf denotes the leakage flow rate coefficient, Xlk and Ylk denote the axial and radial distance of ring clearance respectively, λlk is hydraulic resistance coefficient within clea flow in the range of 0.04–0.06, ηlk denotes the rounded coefficient at the inlet of ring clearance in the range of 0.5–0.9.
2.3.3. Volute Losses
The volute component direct the flow from the impeller exit and leads it into the discharge area, converting the kinetic energy into pressure energy in pump mode and vice-versa in PAT mode [44]. The flow enters the volute with a through velocity v3, which is decomposed into a velocity parallel to the direction of the volute v3p, and tangential to the direction of the impeller v3d. The flow then exits the volute with a velocity v4 = Q/Ath [45], which is given as:
where:
where ηv is the volumetric efficiency, ε is blade thickness coefficient, d2 (mm) is the diameter of the impeller outlet, d3 (mm) is the base circle diameter of the volute, b3 (mm) is the volute inlet width, b2 (mm) is the blade outlet width, αv is the volute angle, v3 (ms−1) is the volute inlet velocity, v4 (ms−1) is the volute outlet velocity, v3d (ms−1) is the circulation velocity of the flow in the volute, v3p (ms−1) is the volute flow velocity and vθ (ms−1) is the tangential absolute velocity of the flow in the impeller and Avth is the volute throat inlet area.
Incidence Loss of Spiral Part
The incidence loss of the spiral part inlet can be determined by:
where klv denotes the coefficient of the incident mix loss, which is 0.45 [46], vth (ms−1) is the velocity of the flow inside the sections that connect the volute spiral part and diffuser part together, vr (ms−1) is the radial velocity in the impeller, g (ms−2) is the gravitional acceleration and vθ (ms−1) is the tangential absolute velocity of the flow in the impeller.
Friction Loss of Spiral Part
Volute friction loss is determined by using the theory of flow through pipes, which can be formulated in both pump and PAT modes as [47]:
where d3 (mm) is the base circle diameter of the volute, b3 (mm) is the volute inlet width, v4 (ms−1) is the volute outlet flow velocity, g (ms−1) is the gravitational acceleration, dh is the average volute hydraulic diameter, and f is the volute friction loss coefficient, which is a function of both volute roughness ε and Reynolds number Re:
where (ms−1) is the arithmetic average between the relative velocities and ν (m2s−1) is the kinetic viscosity of the fluid, αv is the volute angle and z is the blade number.
Friction Loss of Diffuser Part
The diffuser component divergent structure can lead to separation of the boundary layer and can cause losses in pump mode. In PAT mode diffuser, part of the volute serves as a contraction flow passage and is expressed mathematically as:
where kvdiff denotes the diffuser loss coefficient, which is 6.5 [46], A5 (m2) denotes the diffuser outlet area, A4 (m2) denotes the volute inlet (volute throat) area, ldiff denotes the diffuser passage length and v4 denotes the velocity at the outlet and θ° correspond to the diffuser angle.
As already meantioned, under PAT mode operation, the diffuser part of the volute will serve as a contraction part and in pump mode acts as diffusion part, thus, the separation loss can be neglected in PAT mode and be considered in pump mode operation only.
Separation Loss of Diffuser Part
2.4. Realistic PAT Performance
The losses in the inlet and outlet pipe, impeller, and volute have been modeled, and the total hydraulic loss and efficiency for both pump and PAT can be determined by adding up all the losses above. The total head loss, the actual pump head and pump efficiency have been expressed in Equations (45)–(47):
The actual head Hp under pump mode can be expressed as:
where Hp (m) denotes the actual head loss under pump mode, ΔhTOT (m) denotes the total head loss and Hth,p (m) denotes the theoretical head loss in pump mode.
Additional losses, which includes the disk friction power loss, leakage loss and the recirculation power loss, are added into the expression to calculate the total efficiency of the pump as expressed in Equation (47) as:
where ρ (kgm−3) is the density of the fluid, g (ms−s) is the gravitational acceleration, Q (m3h−1) is the flow rate, HP (m) is the actual head loss under pump mode, ΔPdf (W) is the disk friction power loss, ΔPlk (W) is the leakage power loss, ΔPrec (W) is the recirculation power loss and Hth,p (m) is the theoretical head in pump mode.
According to the above study, the theoretical model for the PAT mode performance is established in Equations (48)–(50):
where HT (m) denotes the actual head loss under PAT mode, ΔhTOT (m) denotes the total head loss and Hth,t (m) denotes the theoretical head loss under PAT mode.
The expression for calculating the total PAT efficiency, ηt, is presented as:
where ρ (kgm−3) is the density of the fluid, g (ms−2) is the gravitational acceleration, Q (m3h−1) is the flow rate, HT (m) is the actual head loss under PAT mode, ΔPdf (W) is the disk friction power loss, ΔPlk (W) is the leakage power loss and Hth,t (m) is the theoretical head in PAT mode.
Table 2 lists the necessary input parameters that are needed for the theoretical model. The appropriate velocity may be calculated from the hydraulic equations according to the parameters specified, and then the hydraulic losses can be determined.

Table 2.
Theoretical model input parameters.
Figure 6 displays the theoretical model’s performance curves for the pump and turbine modes. Under turbine mode the BEP switches to a higher flow rate than the pump mode. Under turbine mode, the maximum efficiency of 75.48% was below 79.82% under pump mode. The pump and turbine heads are 9.60 m and 9.14 m respectively under the best efficiency point. The turbine performance characteristic curve is almost flat in comparison with pump mode under high flow rates. This high efficiency region under turbine mode is essential for the safe and stable operation. Both the pressure head of the pump and turbine modes decrease and increase respectively with the increase in flow rate, and also show a linear correlation with the flow rate.
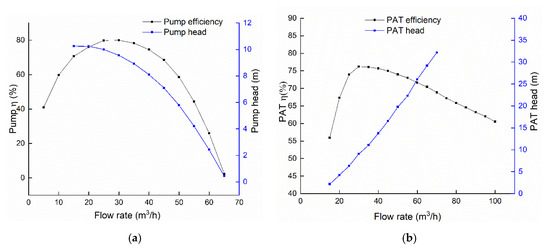
Figure 6.
Performance curve of pump and PAT: (a) pump mode (b) PAT mode.
3. Optimization Procedure
The procedure for optimization is shown in Figure 7. This comprises of 4 steps in all: the design of method (DoE) of Latin hypercube sampling (LHS), 1-D calculation procedure, Pareto-Based Genetic Algorithm, and result verification by CFD.
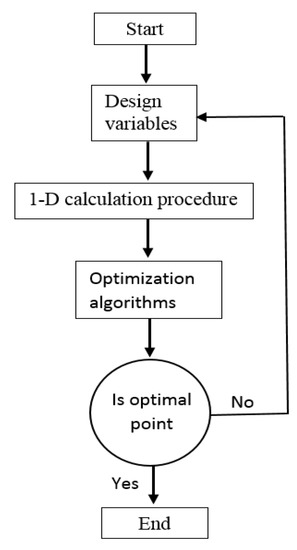
Figure 7.
Flowchart of the optimization process.
The initial process is to sample the input variables based on design of experiment method. The input variables were chosen according to the respective design targets and the importance level of the design variables on the targets themselves. Secondly, a series of impellers were modelled theoretically by considering all flow losses inside the hydraulic machinery (PAT) with Matlab programming code (R2016a, MathWorks, USA). This model allows user to predict the efficiencies of the pump and turbine mode simultaneously under design flow condition by means of varying the design variables. The efficiencies obtained from the pump and PAT modes were selected as objective functions. The fourth part was to solve the models using the Pareto-Based Genetic algorithm to obtain 2D Pareto solutions. Finally, the optimized cases were verified by a computational fluid dynamic CFD model to improve the reliability of the results.
3.1. Objective Functions
The objective of this study is to simultaneously maximize the efficiency of pump and PAT modes (ηp and ηt, respectively) at the design flow rate. The objective functions are defined as follows:
where g, ρ, Q, H, P and Δh are representing the acceleration caused by gravity, fluid density, flow rate, pressure head, power and change in hydraulic head loss, respectively. Subscript p, t, th, rec, df, lk are pump mode, turbine mode, theoretical, recirculation loss, disk frictional loss and leakage loss respectively.
3.2. Decision Variables
In order to achieve the optimization, realistic design points must be specified within the range of design variables. Four design points were therefore selected with the Latin hypercube sampling method (LHS) [48]. According to the study concerning the effect of various parameters on the performance of PAT, the geometric parameters including blade outlet width b2, blade inlet and exit angles β1 and β2 on the hub and shroud, and the blade number z were selected as the input design variables. Table 3 presents a summary of the design variables.

Table 3.
Range of design variables.
The Latin Hypercube Sampling Method [49], which is a very useful experiment design method was applied to establish a discrete points in the design space, 50 cases of the impeller were created randomly due to the requirement of sufficient data for the construction of nonlinear operation. Some of the designed variables combination are listed in Table 4, which shows the target values at the design point in the optimization process calculated by the theoretical model.

Table 4.
Some of the 50 impellers and calculated efficiencies.
3.3. Orthogonal Test
The orthogonal array design of four factors signifying the number of design variables and twelve runs L12 is established in Table 5. This test is very significant because it reveals the level of influence each design variables that have on the objective function.

Table 5.
Orthogonal array design.
Investigations were performed at the design flow rate according to the objective functions of the optimization. The results from the orthogonal test are offered in Table 6. From a direct analysis, it was observed that the majority of the combinations can satisfy the individual objectives, however, deciding the best scheme from the orthogonal results became problematic. It is, therefore, necessary to conduct a range analysis to understand the extent to which each design variable affects the optimization target. To determine the variance, R, the difference between the maximum and minimum values was analyzed for each factor at all levels. The mathematical relation for the range analysis [50,51] is expressed as:
where, Ki is the sum of the values of the levels for each factor, ki is the average value, yi,j is performance value for the factor, and i and j are the number of levels and number of factors, respectively.

Table 6.
Orthogonal test.
It can be seen from Table 7 and Figure 8 that the order of influence of the parameters is β1 > z > β2 > b2. This means that for a single objective of maximizing only PAT efficiency, β1 has a primary influence on the target. The trend was however different for the objective of the pump efficiency. It is seen from Table 8 and Figure 9 that the order of influence of the parameters is β2 > b2 >β1 > z.

Table 7.
Range analysis of PAT efficiency.
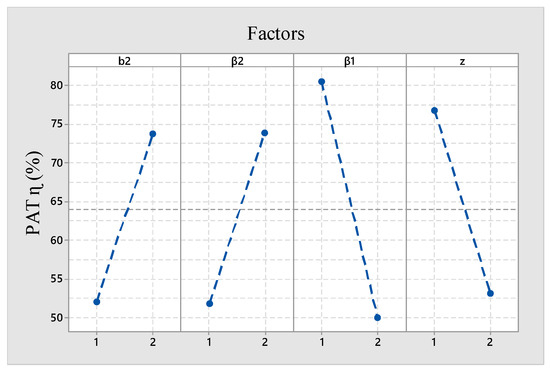
Figure 8.
Level of influence of each parameter on PAT efficiency.

Table 8.
Range analysis of pump efficiency.
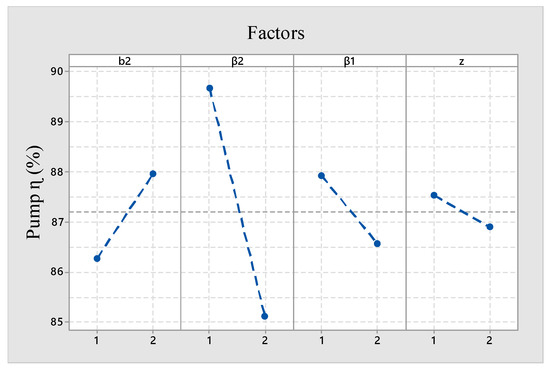
Figure 9.
Level of influence of each parameter on pump efficiency.
This implies that for a single objective of maximizing the pump efficiency, β2 has a high influence on the target space. The two parameter combinations are both not the optimum parameters since it is obvious that any attempt to improve one parameter makes at least one of the parameters worse off. The problem is therefore a multi-objective problem and would require a multi-objective approach to obtain a parameter combination that would increase both the efficiency of pump and PAT simultaneously.
3.4. Multi-Objective Optimization Design
A multi-objective optimization is applied to maximize or minimize objective functions when there are two or more objective functions under the same variable constraints. A Pareto-optimal approach, also called the Pareto frontiers, is applied to elucidate problems of this nature, since it is basically not possible to obtain a solution that would optimized all objective functions. This is because one parameter usually gets worse when any other parameter is enhanced. Under such conditions, the Pareto frontier, which is an efficiency solution, is used to control optimal combinations of parameters which would better solve the problem. The Pareto-based genetic algorithm (PBGA) was applied [52] in the study to obtain the global Pareto frontier of the two objective functions expressed in Equation (56). The Matlab function codes gamultiobj [53] was applied for the implementation of the multiobject algorithm. This approach has the potential to use a controlled elitist, which gives it an advantage over the simple genetic algorithm and has been successfully employed in other optimization works [54,55,56].
Since the objective functions are more than one, it is not possible to use the value of each function to determine the individual efficiencies. The expression in Equation (57) was introduced to determine the individual efficiency and solve the problem:
where, x: indicates any single population individual; y: indicates the Pareto efficient individual closet to x and indicates the Euclidean distance between x and y. In the construction of the Pareto-optimal solutions the following input parameters were applied. This means population size of 100, Pareto-front population of 0.8, crossover fraction of 0.85, 1000 generations, and function tolerance of 10.
4. Results and Discussions
4.1. Validation of the Theoretical Results
4.1.1. CFD Simulation of PAT Model
Numerical investigation was considered as a first method of validation of the proposed theoretical model in absence of experimental measurements. The numerical methods and boundary condition settings were chosen based on the steps outlined by Yang et al. [13]. Figure 10 shows the computational flow domain of the PAT model. It depicts the six blades impeller, inlet and outlet pipe with radial volute.
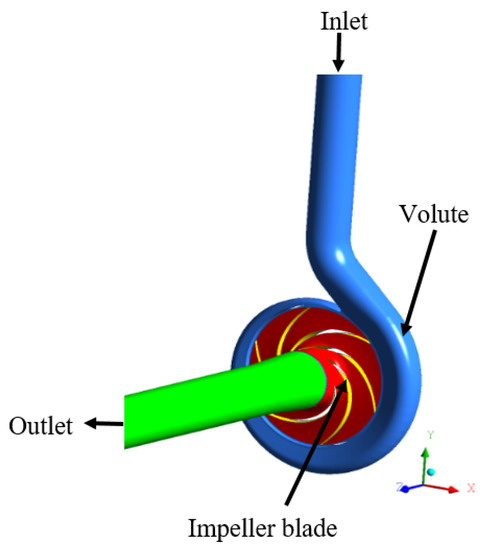
Figure 10.
Flow domain of the baseline PAT model.
The numerical methods and boundary condition settings were chosen based on the steps outlined in the reference [57]. Hexahedron structured mesh was generated for all the domains, the mehsed impeller blades and the volute have been depicted in Figure 11. Before for optimization process the mesh quality, mesh number and numerical simulations are crucial. A structured grid for the computational domain was used to build by using ANSYS-ICEM. The grids are defined in the near-wall flow regions and the grid numbers was used to check the mesh independence performed. When the grid number is about 2.9 million, the variation of head was within 0.2% as indicated in Figure 12. Therefore, the total number of grids was set to be 2.9 million to save computing time.
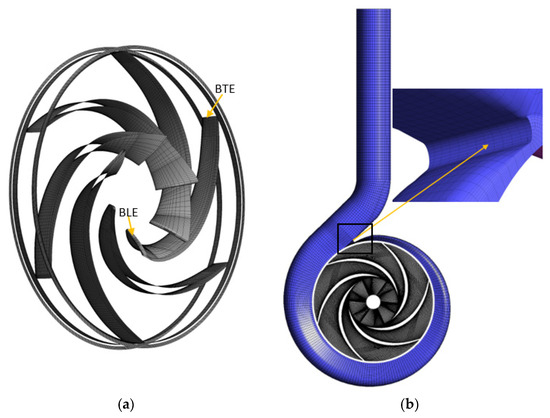
Figure 11.
Mesh of (a) impeller blades with (BLE denoting blade leading edge and BTL denoting blade trailing edge (b) volute with volute tongue enlargement.
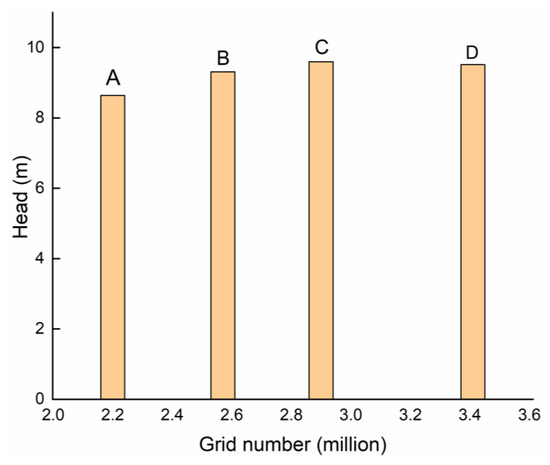
Figure 12.
Grid-sensitivity analysis.
In both pump and PAT modes the steady state numerical calculations are set as follows. The Reynolds-averaged Navier–Stokes (RANS) equations are solved using CFX software (19.0, ANSYS, USA) at different operating conditions. The steady state simulations were performed with interface model set to frozen rotor. The fluid material was water at 25 °C. The boundary condition of the suction pipe inlet was defined as static pressure of 1atm while the discharge pipe outlet was defined as mass flow. For the steady state simulations, a convergence criterion of 1.0 × 10⁻⁶ was selected. In order to predict the highly turbulent flow patterns within the pump, the SST k-ω is implemented for the numerical simulations with a 5% turbulent intensity. The wall roughness of every boundary of each domain was set as “smooth wall”, while the mass and momentum setting was set to “no slip wall”. The impeller was set to operate at 1450 r/min for the PAT mode. Though we fix the rotational speed of the impeller for facilitating the research, it should also be noted that the change of rotional speed of the pump under PAT mode can have significant influences on output performances of the machinery when compared to the original pump mode since the best efficiency point of the pump and PAT mode may have a large discrepancy. By changing flow conditions, both pump and PAT modes characteristic curves were obtained.
In order to predict the pressure head and efficiency at each flow condition, these variables were evaluated by averaging all values at each iteration from the steady numerical simulations. The efficiency of the pump and PAT was evaluated using Equations (58) and (59) respectively:
where T (Nm), is the torque on the shaft, ω (rad/s) is the angular velocity of the impeller.
The head was subsequently evaluated using Equation (60):
where P (m) denotes the pressure head of the pump and subscript in and out denote the inlet and the outlet of the pump.
4.1.2. Experimental Test of PAT on Pump Mode
The centrifugal pump performance curves are measured in a closed test rig, at National Research Center of Pumps (Jiangsu University) as presented in Figure 13. The geometrical and operational parameters of the PAT are listed in Table 1. The flow rate is measured by LWGY-65 turbine flowmeter with accuracy of 0.2%. The inlet and outlet pressure is tested using static pressure sensor produced by WIKA and both of the accuracy are 0.25%. The torque is measured with SGDN-50 torque sensor with a high accuracy of 0.05%. The performance data is acquired with LabView from a NI USB- 6343 data acquisition card. With a 10 times repeated experiemental measurement of the performance at design point, the total uncertainty is ±0.56%.
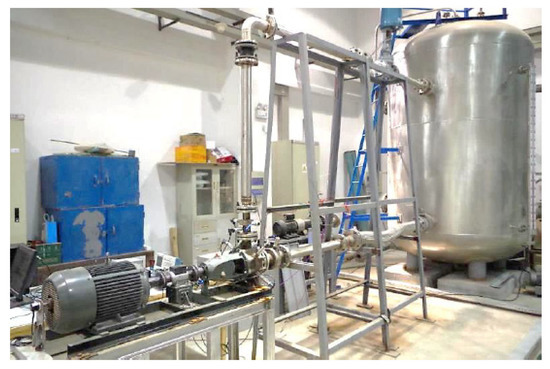
Figure 13.
The closed test rig of PAT on pump mode.
4.1.3. Validation of PAT Model
In order to justify the validity of our 1-D theoretical model, Figure 14a–c depicts the comparison of the pressure head loss in both CFD and theoretical model of the pump and turbine modes. Different components of the PAT including the volute, impeller and outlet are presented separately. The pressure head loss curves of the CFD and theoretical model show a similar characteristic trend with minimal deviation. As established in Figure 14, the magnitude of the head losses is not the same in both pump and turbine modes. The pressure head is observed to decrease from the part load to the design flow rate region and to increase afterward at the overload region as the flow rate increases. In the volute geometry, the magnitude of the pressure head loss in the pump mode is greater than that of turbine mode as the flow rate increases. However, in turbine mode the magnitude of the pressure head loss that occures in the impeller and the outlet pipe (inlet pipe in pump mode) geometry is higher than in pump mode. These variations of the pressure head loss exist because the energy transfer from the rotating impeller to the fluid or vice-versa is not achieved in the same way.
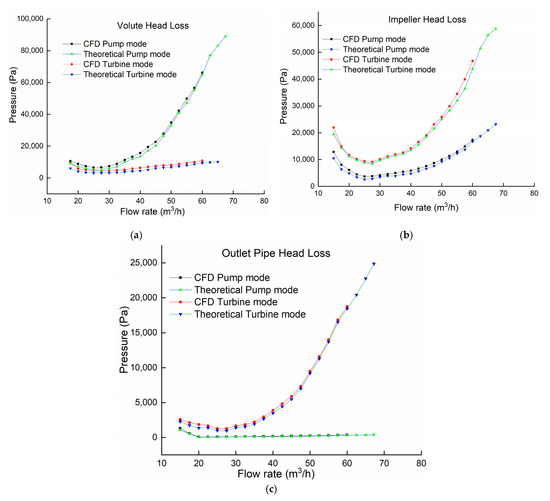
Figure 14.
Magnitude of pressure head loss: (a) Volute (b) Impeller (c) Outlet pipe.
Figure 15 shows the numerical simulated results of PAT in pump mode, theoretical predicted model and the experimental results. The results show that the tendency of characteristic curves is accurately predicted by the proposed theoretical model. The experimental, CFD and theoretical model characteristic curves show a similar tendency of a quadratic curve. The efficiency curves increased from the part-load region to the BEP and thereafter decreased towards the overload region. The pressure heads also showed a decreased trend as the flow rate increases. The simulated head and efficiency at the best efficiency point are 9.62 m and 80.2% and it occurred at a flow rate of 27.5 m3/h. The deviations of head and efficiency at BEP are 4.4% and 0.69% respectively with respect to the CFD results, and the discrepancy increases with the increasing flow rate. Therefore, the optimization on performance improvement based on numerical simulations can be reliable.
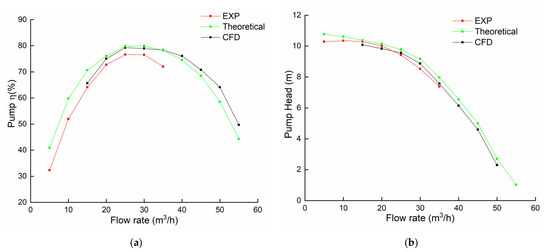
Figure 15.
Prediction performance of PAT for (a) pump mode efficiency (b) pump mode head.
Figure 16 shows the comparison results of the theoretical model and simulation of PAT efficiency and head in the turbine mode. The error of the theoretical PAT efficiency is less than 2% at the BEP. The simulated efficiency is 75.42% at the best efficiency point (BEP). The error of the theoretical PAT head at the BEP is less than 3% and the simulated head is 9.8 m. The BEP of PAT occurred at a flow rate of 30 m3/h respectively on both theoretical and CFD characteristics curves. The results of the theoretical characteristic curves show that the prediction accuracy meets the simulation standards. Also, it can be established that the efficiency of the curves varies throughout the operating range. Both the CFD and theoretical model characteristic curves show a similar tendency of a quadratic curve. The efficiency of both curves increased from the part-load region to the BEP and thereafter decreased towards the overload region. The predicted flow rate at the BEP under PAT mode by Sharma [23] prediction equation as expressed in Equation (9) is 32.47 m3/h, which is quite close to 30 m3/h of the numerical simulations, with a relative deviation of 7.6%.
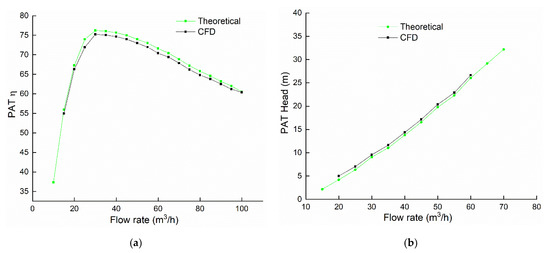
Figure 16.
Prediction performance of PAT for (a) turbine mode efficiency (b) turbine mode head.
When the PAT impeller rotate with the fluid, the pressure energy of the fluid is converted into mechanical energy on the impeller shaft. This mechanical energy is expressed as the product of the impeller rotating shaft torque and rotational angular velocity. Equation (61) is a mathematical expression used to calculate the mechanical energy. Figure 17 shows the energy conversion of the impeller to the shaft at different flow rates. It can be observed that as the flow rate increases the output power increases along. Both the CFD and theoretical model characteristic curves shows a similar increasing tendency:
where T is the torque and ω is the impeller rotation angular velocity.
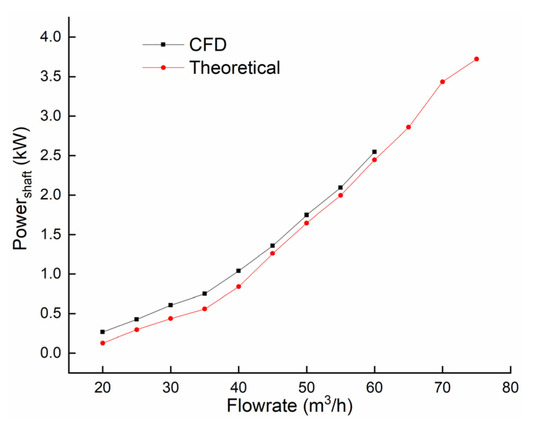
Figure 17.
Power generated by the PAT.
4.2. Theoretical Optimization Results
The Pareto-Based Genetic Algorithm was used to obtain an optimization model. The 2D Pareto frontiers from PBGA from the two objective functions are shown in Figure 18. A set of 1000 Pareto optimal combinations was presented in a Pareto solution set which satisfied both objective functions.
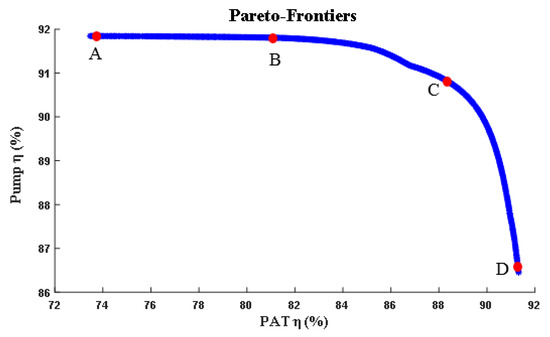
Figure 18.
Pareto-frontiers.
The Pareto optimal set is a set of non-dominated solutions with respect to one another. When going from one Pareto solution to another, there is always a certain amount of loss in one target to accomplish any gain in the other. Pareto optimal solution sets are often compared to single solutions because they can be realistic in circumstances of real life. In real pump usage, there is a need to maximize economic benefits. Four points were selected from the Pareto optimal solution set as depicted in Figure 18 with red dots highlighted, to investigate the objectives set for these studies.
The four points selected from the Pareto optimal solution set were compared with the theoretical model in Figure 19 and Figure 20. A new impeller was modeled with the theoretical model in reference to the optimum decision variables in Table 9. The theoretical model efficiencies and the predicted results from the four optimal cases at the design flow rate were compared. Though the head is not an optimization objective, it should not be made poorer. In case A, the pump efficiency increased by 3.9% with 2.43% dropped in efficiency at turbine mode, the pressure head drops by 14.1% in pump mode and 31.5% increase in turbine mode. The efficiency of case B increased by 2.38% in pump mode and dropped by 2% in turbine mode. The pressure head in pump mode drops by 2.5% but the turbine mode witnessed an increase of 47.2%. The case C recorded a negative pressure head of about 5.8% in pump mode with a 70% increase in turbine mode, the efficiencies of both pump and turbine modes recorded an increase of 0.18% and 17% respectively. The case D also recorded a negative pressure head of about 10.6% in pump mode with a 26% increase in turbine mode, the efficiency of the pump drooped by 5.6% and increased by 25.4% in turbine mode. Since all the cases are the optimal solutions to the objective functions. the summarization of the optimized case deviations have been presented in Table 10.
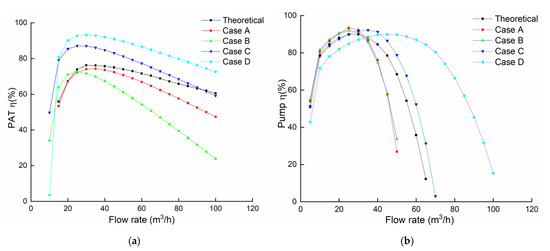
Figure 19.
Optimized efficiencies of (a) PAT and (b) pump respectively.
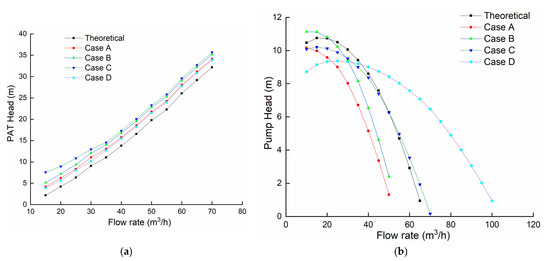
Figure 20.
Optimized head of (a) PAT and (b) pump respectively.

Table 9.
Variables for optimal cases.

Table 10.
Summarization of the optimized case deviations.
Even though case D had a better efficiency performing than cases C and A in turbine mode, in pump mode case A and B efficiencies were slightly better than case D and C at design flow rate. The pressure head should not be made worse off by the optimized parameters, as a result, case C is selected because it generated a pump mode efficiency increase of 0.18% and a head reduction of 5.8% while in turbine mode, the efficiency and head increase by 17% and 70% respectively at the design flow condition. Therefore optimized case C would be best suited for the multi-objective optimization since it increases in efficiencies for both pump and turbine modes with a suitable pressure head.
The numerical simulation and the theoretical model of case C in both pump and PAT modes are presented in Figure 21. In both modes, the results show that the proposed theoretical model accurately predicts the tendency of characteristic curves. The average relative deviations between the theoretical model and numerical simulations is 0.89% in PAT mode and 2.65% in pump mode at the BEP.
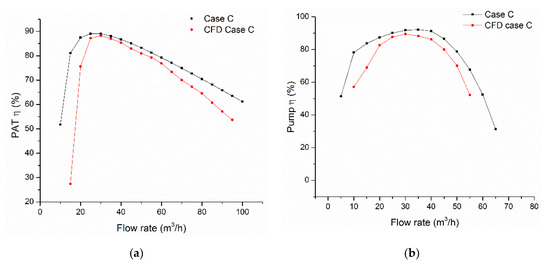
Figure 21.
Prediction of energy performance in (a) under PAT mode (b) under pump mode.
5. Conclusions
In this study, a theoretical attempt is made to optimize and predict the performance of a centrifugal pump operating as PAT by modeling and analyzing all the various flow losses in the pump at both pump and turbine operating modes.
It has been established that the proposed theoretical model can predict the general characteristics of the PAT performance well. Based on the theoretical optimization results, the geometry of the impeller is redesigned to suit both pump and PAT mode operations. It was also established that the chosen design variables (b2, β1, β2, and z) have a significant influence on the output parameters based on the orthogonal test. The result shows that the efficiencies of the optimized PAT under both pump and turbine modes have improved by 0.27% and 16.3% respectively at the design condition.
The validation of the theoretical model is mandatory, owing to which a numerical investigation was performed to confirm the proposed theoretical performance curves. It has been proven that the predicted results agree well with simulated results, which authenticates the accuracy and reliability of the proposed theoretical model of the performance prediction, under pump and PAT modes. After the optimization, the average relative deviations between the theoretical model and numerical simulations in both PAT and pump efficiencies are 0.89% and 2.65% respectively at the BEP.
As the hydraulic loss model is subject to limitations, it is advisable to further investigate the parameters experimentally and numerically, as the theoretical optimization has given a fair idea of the effect of the chosen parameters on the hydraulic performance in both pump and PAT mode operations [58,59,60]. This approach will extensively save time and other resources. For future research work, it is recommended that there should be continuous evaluation of test data with the aid of design variables to further extend the catalogue when designing new impellers and volutes [61,62]. Moreover, the pump volute should be extensively researched to help broaden our knowledge on how it affects the overall performance [63]. The pump volute model should be expanded to cover the pump tongue distance and mismatch between the impeller and the volute flow angle.
Author Contributions
Conceptualization, L.W. and J.Y.; methodology, L.W. and S.N.A.; data curation, S.N.A.; writing—original draft preparation, S.N.A.; writing—review and editing, L.W.; software, D.A.; funding acquisition, J.Y. All authors have read and agreed to the published version of the manuscript.
Funding
This study is financially supported by the China Postdoctoral Science Foundation (Grant No. 2018M632244), Natural Science Foundation of Jiangsu Province (Grant No. BK20180879), High-level Talent Research Foundation of Jiangsu University (Grant No. 18JDG012).
Acknowledgments
The everlasting love and support from the first author’s fiancé Lei Wang are gratefully acknowledged, and moreover this work is a gift of proposal to her.
Conflicts of Interest
The authors declare no conflict of interest.
Nomenclature
| Symbols | ||
| ΔhT | total head loss | (m) |
| Δhinlet | pipe inlet head loss | (m) |
| Δhoutlet | pipe outlet head loss | (m) |
| Δhinc | incidence head loss | (m) |
| Δhsfl | surface frictional head loss | (m) |
| Δhbl | blade loading head loss | (m) |
| Δhsl | separation head loss | (m) |
| Δhrec | recirculation power loss | (W) |
| Δhmix | wake mixing head loss | (m) |
| Δhdf | diskfriction power loss | (W) |
| Δhlk | leakage power loss | (W) |
| Δhvl | spiral part incidence head loss | (m) |
| Δhvfl | spiral friction head loss | (m) |
| Δhvdiff | diffuser part friction head loss | (m) |
| Δhvsl | diffuser part separation head loss | (m) |
| H | head | (m) |
| D | diameter | (m) |
| Dj | inlet diameter | (m) |
| Q | flow rate | (m3/h) |
| η | efficiency | |
| ρ | density of the liquid | (kg/m3) |
| P | power | (W) |
| ns | specific speed | |
| C | conversion factors | |
| ε | blade thickness coefficient | |
| ω | angular velocity | (rads−1) |
| n | rotational speed | (rpm) |
| z | blade number | |
| σ | slip factor | |
| Δh | head loss | (m) |
| u | impeller periphery velocity | |
| w | relative velocity | (ms−1) |
| v | absolute velocity | (ms−1) |
| α | absolute flow angle | (°) |
| β | relative angle | (°) |
| γ | specific weight of fluid | (Nm−3) |
| λ | friction coefficient | |
| A | area | (ms−2) |
| T | torque on the shaft | (Nm) |
| Subscripts | ||
| Max | maximum | |
| Min | minimal | |
| 1 | impeller inlet | |
| 2 | impeller outlet | |
| 3 | volute section | |
| 4 | volute throat section | |
| 5 | volute discharge section | |
| r | radial | |
| t | turbine | |
| p | pump | |
| θ | tangential direction | |
| in | pump inlet | |
| out | pump outlet | |
| Abbreviations | ||
| BEP | best efficiency point | |
| SST | shear stress transport | |
| 1D | 1-dimensional | |
| 3D | 3-dimensional | |
| N-S | Navier-Stokes | |
| CFD | computational fluid dynamics | |
| PAT | Pump-as-turbine | |
| W | Watt | |
References
- Smith, K.A.; Gupta, J.N.; Smith-Miles, K. Neural networks in business: Techniques and applications for the operations researcher. Comput. Oper. Res. 2000, 27, 1023–1044. [Google Scholar] [CrossRef]
- Tamm, A. Analysis of a standard pump in reverse operation using CFD. In Proceedings of the 20th IAHR Symposium, Charlotte, NC, USA, 6–9 August 2000. [Google Scholar]
- Derakhshan, S.; Nourbakhsh, A. Theoretical, numerical and experimental investigation of centrifugal pumps in reverse operation. Exp. Therm. Fluid Sci. 2008, 32, 1620–1627. [Google Scholar] [CrossRef]
- Asomani, S.N.; Yuan, J.; Wang, L.; Appiah, D.; Zhang, F. Geometrical effects on performance and inner flow characteristics of a pump-as-turbine: A review. Adv. Mech. Eng. 2020, 12, 1687814020912149. [Google Scholar] [CrossRef]
- Carravetta, A.; Del Giudice, G.; Fecarotta, O.; Ramos, H. PAT Design Strategy for Energy Recovery in Water Distribution Networks by Electrical Regulation. Energies 2013, 6, 411–424. [Google Scholar] [CrossRef]
- Carravetta, A.; Del Giudice, G.; Fecarotta, O.; Ramos, H. Pump as Turbine (PAT) Design in Water Distribution Network by System Effectiveness. Water 2013, 5, 1211–1225. [Google Scholar] [CrossRef]
- Carravetta, A.; Del Giudice, G.; Fecarotta, O.; Ramos, H.M. Energy Production in Water Distribution Networks: A PAT Design Strategy. Water Resour. Manag. 2012, 26, 3947–3959. [Google Scholar] [CrossRef]
- Strategen Consulting, L. DOE Global Energy Storage Database; Sandia National Laboratories: Livermore, CA, USA, 2016.
- Morabito, A.; Hendrick, P. Pump as turbine applied to micro energy storage and smart water grids: A case study. Appl. Energy 2019, 241, 567–579. [Google Scholar] [CrossRef]
- Gimeno-Gutiérrez, M.; Arántegui, R.L. Assessment of the European potential for pumped hydropower energy storage based on two existing reservoirs. Renew. Energy 2015, 75, 856–868. [Google Scholar] [CrossRef]
- Polák, M. The Influence of Changing Hydropower Potential on Performance Parameters of Pumps in Turbine Mode. Energies 2019, 12, 2103. [Google Scholar] [CrossRef]
- Rossi, M.; Nigro, A.; Renzi, M. Experimental and numerical assessment of a methodology for performance prediction of Pumps-as-Turbines (PaTs) operating in off-design conditions. Appl. Energy 2019, 248, 555–566. [Google Scholar] [CrossRef]
- Yang, S.-S.; Kong, F.-Y.; Chen, H.; Su, X.-H. Effects of Blade Wrap Angle Influencing a Pump as Turbine. J. Fluids Eng. 2012, 134, 061102. [Google Scholar] [CrossRef]
- Yang, S.-S.; Derakhshan, S.; Kong, F.-Y. Theoretical, numerical and experimental prediction of pump as turbine performance. Renew. Energy 2012, 48, 507–513. [Google Scholar] [CrossRef]
- Capurso, T.; Stefanizzi, M.; Pascazio, G.; Ranaldo, S.; Camporeale, S.M.; Fortunato, B.; Torresi, M. Slip Factor Correction in 1-D Performance Prediction Model for PaTs. Water 2019, 11, 565. [Google Scholar] [CrossRef]
- Capurso, T.; Stefanizzi, M.; Pascazio, G.; Camporeale, S.M.; Torresi, M. Dependency of the slip phenomenon on the inertial forces inside radial runners. In Proceedings of the Second International Conference on Material Science, Smart Structures and Applications: ICMSS-2019, Erode, India, 21–22 November 2019; AIP Publishing: New York, NY, USA, 2019; Volume 2191, p. 020034. [Google Scholar]
- Williams, A. Prelims-Pumps as Turbines. In Pumps as Turbines: A Users Guide; Practical Action Publishing: Warwickshire, UK, 1995; pp. i–x. [Google Scholar]
- Singh, P.; Nestmann, F. An optimization routine on a prediction and selection model for the turbine operation of centrifugal pumps. Exp. Therm. Fluid Sci. 2010, 34, 152–164. [Google Scholar] [CrossRef]
- Ramos, H.M.; Borgå, Å. Pumps as turbines: An unconventional solution to energy production. Urban Water 1999, 1, 261–263. [Google Scholar] [CrossRef]
- Wang, X.H.; Jun, H.Y.; Feng, X.S.; Ren, H.Z. Theoretical and Numerical Study of Performance Prediction of Centrifugal Pumps as Turbines. In Applied Mechanics and Materials; Trans Tech Publ.: Stafa-Zurich, Switzerland, 2014; Available online: https://www.scientific.net/AMM.444-445.579 (accessed on 1 June 2020).
- Derakhshan, S.; Mohammadi, B.; Nourbakhsh, A. Efficiency Improvement of Centrifugal Reverse Pumps. J. Fluids Eng. 2009, 131, 021103. [Google Scholar] [CrossRef]
- Li, Y.G.; Ghafir, M.F.A.; Wang, L.; Singh, R.; Huang, K.; Feng, X. Nonlinear Multiple Points Gas Turbine Off-Design Performance Adaptation Using a Genetic Algorithm. J. Eng. Gas Turbines Power 2011, 133, 071701. [Google Scholar] [CrossRef]
- Sharma, K.J.K.E.C. Small Hydroelectric Project-Use of Centrifugal Pumps as Turbines; Kirloskar Electric. Co.: Bangalore, India, 1985. [Google Scholar]
- Alatorre-Frenk, C. Cost Minimisation in Micro-Hydro Systems Using Pumps-as-Turbines; University of Warwick: Coventry, UK, 1994. [Google Scholar]
- Stepanoff, A.J.J.T. Centrifugal and Axial Flow Pumps: Theory, Design, and Application; John Wiley & Sons: New York, NY, USA, 1957. [Google Scholar]
- Williams, A.A. The Turbine Performance of Centrifugal Pumps: A Comparison of Prediction Methods. Proc. Inst. Mech. Eng. Part A J. Power Energy 1994, 208, 59–66. [Google Scholar] [CrossRef]
- Nelik, L. Centrifugal & Rotary Pumps: Fundamentals with Applications; CRC Press: Boca Raton, FL, USA, 1999. [Google Scholar]
- Krivchenko, G.J.T. Hydraulic Machines Turbines and Pumps; CRC-Press: Florence, KY, USA, 1994; pp. 368–369. [Google Scholar]
- McClaskey, B.; Ja, L. Can you justify hydraulic turbines. Hydrocarb. Process. 1976, 55, 163–169. [Google Scholar]
- Yang, S.; Kong, F.; Chen, H.; Su, X. Effects of blade inlet angle on performance of pump as turbine. J. Cent. South Univ. 2013, 1. [Google Scholar]
- Zhang, J.; Appiah, D.; Zhang, F.; Yuan, S.; Gu, Y.; Asomani, S.N. Experimental and numerical investigations on pressure pulsation in a pump mode operation of a pump as turbine. Energy Sci. Eng. 2019, 7, 1264–1279. [Google Scholar] [CrossRef]
- Wang, L.; Tan, A.; Cholette, M.; Gu, Y. Comparison of the effectiveness of analytical wake models for wind farm with constant and variable hub heights. Energy Convers. Manag. 2016, 124, 189–202. [Google Scholar] [CrossRef]
- Stodola, A. Steam and Gas Turbines: With a Supplement on the Prospects of the Thermal Prime Mover; McGraw-Hill: New York, NY, USA, 1927; Volume 2. [Google Scholar]
- Derakhshan, S.; Nourbakhsh, A. Experimental study of characteristic curves of centrifugal pumps working as turbines in different specific speeds. Exp. Therm. Fluid Sci. 2008, 32, 800–807. [Google Scholar] [CrossRef]
- Conrad, O.; Raif, K.; Wessels, M. The Calculation of performance maps for centrifugal compressors with vane-island diffusers. In Performance Prediction of Centrifugal Pumps and Compressors; NASA Astrophysics Data System: Cambridge, MA, USA, 1979; Available online: https://ui.adsabs.harvard.edu/abs/1979ppcp.proc..135C/abstract (accessed on 1 June 2020).
- Gülich, J.F. Pump Hydraulics and Physical Concepts. In Centrifugal Pumps; Springer: Berlin/Heidelberg, Germany, 2010; pp. 69–144. [Google Scholar]
- Hodge, B.K. Analysis and Design of Energy Systems. 1984. Available online: https://www.researchgate.net/publication/236401810_Analysis_and_Design_of_Energy_Systems (accessed on 1 June 2020).
- Lieblein, S.; Schwenk, F.C.; Broderick, R.L. Diffusion Factor for Estimating Losses and Limiting Blade Loadings in Axial-Flow-Compressor Blade Elements; National Advisory Committee For Aeronautics: Cleveland Oh Lewis Flight: Cleveland, OH, USA, 1953.
- Coppage, J.; Dallenbach, F. Study of supersonic radial compressors for refrigeration and pressurization systems. Inf. Process. Lett. 1956, 1, 157–163. [Google Scholar]
- Tuzson, J. Centrifugal Pump Design; John Wiley & Sons: Hoboken, NJ, USA, 2000. [Google Scholar]
- Djebedjian, B.J.M.E.J. Theoretical model to predict the performance of centrifugal pump equipped with splitter blades. Mansoura Eng. J. 2009, 34, 50–70. [Google Scholar]
- Johnston, J.P.; Dean, R.C. Losses in Vaneless Diffusers of Centrifugal Compressors and Pumps: Analysis, Experiment, and Design. J. Eng. Power 1966, 88, 49–60. [Google Scholar] [CrossRef]
- Thin, K.C.; Khaing, M.M.; Aye, K.M. Design and performance analysis of centrifugal pump. World Acad. Sci. Eng. Technol. 2008, 46, 422–429. [Google Scholar]
- Omar, A.K.; Khaldi, A.; Ladouani, A. Prediction of centrifugal pump performance using energy loss analysis. Aust. J. Mech. Eng. 2016, 15, 210–221. [Google Scholar] [CrossRef]
- El-Naggar, M.A. A One-Dimensional Flow Analysis for the Prediction of Centrifugal Pump Performance Characteristics. Int. J. Rotating Mach. 2013, 2013, 1–19. [Google Scholar] [CrossRef]
- Tan, L. Modeling and experiment of the hydraulic losses of centrifugal pump with inlet guide vanes. Shuili Fadian Xuebao/J. Hydroelectr. Eng. 2011, 30, 191–196. [Google Scholar]
- Huang, S.; Qiu, G.; Su, X.; Chen, J.; Zou, W. Performance prediction of a centrifugal pump as turbine using rotor-volute matching principle. Renew. Energy 2017, 108, 64–71. [Google Scholar] [CrossRef]
- Wyss, G.; Jorgensen, K. A Users Guide to LHS: Sandias Latin Hypercube Sampling Software; Sandia National Labs.: Albuquerque, NM, USA, 1998. [CrossRef]
- Jin, R.; Chen, W.; Simpson, T. Comparative studies of metamodelling techniques under multiple modelling criteria. Struct. Multidiscip. Optim. 2001, 23, 1–13. [Google Scholar] [CrossRef]
- Pei, J.; Yin, T.; Yuan, S.; Wang, W.; Wang, J. Cavitation optimization for a centrifugal pump impeller by using orthogonal design of experiment. Chin. J. Mech. Eng. 2017, 30, 103–109. [Google Scholar] [CrossRef]
- Zhou, L.; Shi, W.; Wu, S. Performance Optimization in a Centrifugal Pump Impeller by Orthogonal Experiment and Numerical Simulation. Adv. Mech. Eng. 2013, 5, 385809. [Google Scholar] [CrossRef]
- Gen, M.; Cheng, R. Genetic Algorithms and Engineering Optimization; John Wiley & Sons: Hoboken, NJ, USA, 2000; Volume 7. [Google Scholar]
- Matlab. The Language of Technical Computing-Release 14; The MathWorks Inc.: Natick, MA, USA, 2004. [Google Scholar]
- Afzal, A.; Kim, K.-Y. Multi-Objective Optimization of a Passive Micromixer Based on Periodic Variation of Velocity Profile. Chem. Eng. Commun. 2014, 202, 322–331. [Google Scholar] [CrossRef]
- Kulkarni, K.; Afzal, A.; Kim, K.-Y. Multi-objective optimization of solar air heater with obstacles on absorber plate. Sol. Energy 2015, 114, 364–377. [Google Scholar] [CrossRef]
- Shim, H.-S.; Kim, K.-Y.; Choi, Y.-S. Three-Objective Optimization of a Centrifugal Pump to Reduce Flow Recirculation and Cavitation. J. Fluids Eng. 2018, 140, 091202. [Google Scholar] [CrossRef]
- Asomani, S.N.; Yuan, J.P.; Wang, L.Y.; Appiah, D. The Impact of Surrogate Models on the Multi- Objective Optimization of Pump-As-Turbine (PAT). Energies 2020, 1–30. [Google Scholar]
- Jiang, X.P.; Liu, S.H.; Wang, Y. Effect of outlet back pressure on performance of twin-screw pump as turbine. J. Drain. Irrig. Mach. Eng. 2017, 35, 1042–1047. [Google Scholar]
- Bai, Y.X.; Liu, Y.Y.; Kong, F.Y. Influence of impeller diameter on mixed flow pump as turbine. J. Drain. Irrig. Mach. Eng. 2019, 37, 284–288. [Google Scholar]
- Luo, B.; Wang, C.L.; Xia, Y. Numerical simulation of flow-induced vibration of double-suction centrifugal pump as turbine. J. Drain. Irrig. Mach. Eng. 2019, 37, 313–318. [Google Scholar]
- Yang, S.S.; Shao, K.; Dai, T. Influence of blade wrap angle on characteristics of mixed flow pump as turbine. J. Drain. Irrig. Mach. Eng. 2019, 37, 475–479. [Google Scholar]
- Liu, Y.Y.; Yang, S.S.; Kong, F.Y. Numerical simulation of hydraulic turbines with forward-curved blades. J. Drain. Irrig. Mach. Eng. 2018, 36, 21–27. [Google Scholar]
- Yang, S.S.; Dai, T.; Chen, Z. Influence of volute tilted outlet on performance of mixed-flow pump as turbine. J. Drain. Irrig. Mach. Eng. 2020, 38, 451–456. [Google Scholar]
© 2020 by the authors. Licensee MDPI, Basel, Switzerland. This article is an open access article distributed under the terms and conditions of the Creative Commons Attribution (CC BY) license (http://creativecommons.org/licenses/by/4.0/).