Abstract
This paper presents the application of Internet of Things (IoT) Technology and Building Energy Management System (BEMS) within the Marylebone Campus of the University of Westminster, located in central London, to improve the environmental performance of the existing building as well as enhance the learning experience on energy and sustainability. Sixty IoT sensors connected to minicomputers were planned to be deployed within three floors of the building to continuously measure the real-time environmental parameters, such as dry-bulb temperature, relative humidity, illuminance level, carbon dioxide, and sound levels. Experimental workshops were also arranged with undergraduate and post-graduate students at their classrooms using IoT sensors, portable Bluetooth sensors and online questionnaires to increase awareness of the effect of environmental and behavioural changes on energy saving through real-time visualisation. Users’ subjective feedback on their workplace was also collected through Post Occupancy Evaluation (POE) questionnaire surveys. The results show the effectiveness of IoT systems and BEMS in supplying the building users and management with high-resolution, low-cost data acquisition systems highlighting the existing challenges and future scopes. The study also documents the process and the improvement in students’ awareness of environmental and energy performance of their building through IoT data visualizations and POE.
1. Introduction
The application of Internet of Things (IoT), the wireless sensors and computers network, has enhanced the concept of smart city environment in the current ‘revolutionary era of technologies’ [1]. Recently, the technology of IoT has been widely developed and its usage has been extended to social networks, infrastructure, security, business, and healthcare [2,3]. The technologies combining the IoT-based smart monitoring, such as environmental and energy monitoring, with human participation, have made a significant prospect within the smart city context to help improve human health and wellbeing [1].
Previous studies showed many successful deployments of IoT enabled environmental monitoring systems in various locations in the world as a significant feature of the smart city concept [4,5,6,7]. In particular, there are several successful case studies of integrating Building Energy Management System (BEMS) with IoT sensors to monitor the indoor environment and optimise energy usage in residential buildings [8,9]. Along with real-time data monitoring, dynamic data visualisation on dashboards became an effective method of enhancing the interaction between visualising data gathered from IoT-enabled sensors and occupants. Lehrer and Vasudev [10] also demonstrated the effectiveness of real-time data monitoring and interactive data visualisation in commercial buildings to improve the cost and energy efficiency of workplaces. Minoli [8] also showed in their research that the use of IoT sensors can help in achieving ‘smart building’ status through improving the functionality, efficiency, and cost-effectiveness of buildings.
Li and Xu [3] showed a comparative analysis on communication technologies in IoT and revealed that Wi-Fi has a higher transmission range of up to 100 m compared to that of other technologies, such as range of 10 m of Bluetooth and ZigBee. However, recent studies also highlighted the challenges and issues of integrating the IoT in smart cities in terms of security, privacy, data quality, reliability, budget, and scalability [3,11,12,13,14]. Kelly et al. [15] demonstrated an efficient method of integrating the IoT for indoor environmental monitoring in residential buildings through low-cost solutions, such as internet using ‘Internet Protocol’ (IP) connectivity. Although the reliability of IoT enabled data is high, they also highlighted the issue of Internet Protocol version 6 (IPv6) connectivity while implementing the IoT in their projects [15].
The above studies were mainly focused on either residential or commercial buildings where cost-effectiveness and commercial gains were the key objectives of integrating IoT, BEMS systems, and other smart technologies. Stavropoulos et al. [16] have shown the theoretical concept of a smart university building with a real-time monitoring system to improve energy-awareness and sustainability among users within an educational building. However, there are limited empirical research and case studies that demonstrate the application of IoT for data visualization for educational purpose, and integrations of IoT with BEMS systems and existing technologies [17]. Hence, this research adopted an empirical approach to demonstrate the reliability, challenges, and limitations of using existing BEMS systems and deploying IoT sensors for educational purpose within a university setting. Thus, this original research contributes to existing knowledge towards smart-university buildings through the feasibility of the methods, the empirical data, and analysis results.
This empirical work of this research was conducted in an educational case study building, the Marylebone building of the University of Westminster, located in central London, and demonstrates a methodology for integrating IoT sensors within the existing building’s internet network. The empirical study framework revolves around the importance of understanding two types of variables: the ‘environmental variables’ as well as the ‘human variables’ [18]. The main research question is:
‘To what extent applications of IoT and BEMS are viable in terms of visualising the environmental performance and improving the learning experience within a university campus?’
As a first part of the empirical work, the data collected by the IoT sensors pertains to the environmental variables of the teaching and office spaces and included primarily dry bulb temperature (DBT) in °C, relative humidity (RH) in %, illuminance levels in lux, carbon dioxide (CO2) levels in ppm and sound pressure levels in dB. The IoT data was validated with data obtained from pre-existing sensors from the building’s BEMS. The second part involves gathering ‘human variables’ including feedback from students and staff-member to observe the usefulness of gathering and real-time visualising the above environmental variables. The study shows how real-time data visualisation from IoT sensors can be utilised for educational purposes, improving students’ awareness of environmental parameters and realising sustainability. Thus, this article represents the overall methodology for integrating IoT into the existing infrastructure of the Marylebone campus and highlights the limitations and mitigation strategies of existing challenges for the application of IoT buildings in educational buildings.
2. Materials and Methods
Based on the literature review on methods of studies using IoT and BEMS as well as taking into consideration the constraints on facilities within the university, the research methodology was developed. Figure 1 illustrates the overall methodology adopted. In collaboration with the Estates Planning & Services department of the Marylebone campus, locations (Section 2.1) were selected and data collection for principal investigation was scheduled. As mentioned in Section 1, the research framework of the principle investigation has two parts. Based on the nature and objective of the investigation [19] (p. 205), [20,21], both objective and subjective data covering the environmental and human variables, respectively, were gathered (as shown in Figure 1) to ensure the validity and reliability of data collected through IoT and BEMS sensors [18].
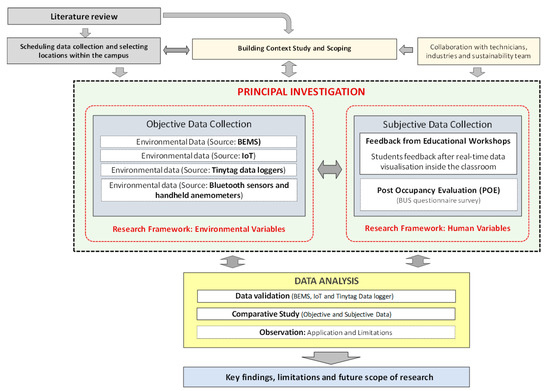
Figure 1.
Flowchart showing the empirical research framework and the overall methodology.
2.1. Schedules and Areas of Investigation
As a part of the ‘Realising Sustainability’ research project’s contract, the study focused on the ‘7-storey educational building, referred to as the ‘Marylebone Block’, located within the Marylebone Campus of the University of Westminster and beside the Marylebone Road, coordinates 51.522 North, 0.155 West (Figure 2). The building consists of a total 10 floors, i.e., 3 floors below the ground level and 7 floors above the ground level. Hence, the initial data collection took place at selected locations such as Basement 1 level (Fabrication Lab) and Levels 1−7 (ground floor to 6th floor), representing BEMS assisted air-conditioned and naturally ventilated zones respectively (see Section 2.2). Data collection methods were designed and set up from November 2018 to May 2019 with simultaneous data collections scheduled from January to July 2019 covering both spring and summer weather of the UK. However, due to technical difficulties and security issues of the deployments, these environmental data could not be collected continuously as planned. For instance, Section 3.2 and Section 3.3 are unable to present the data from BEMS and IoT during May–June 2019. Section 2.2 will explain more about both variables.
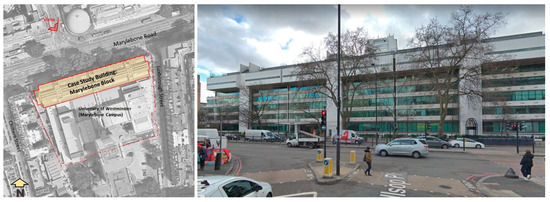
Figure 2.
Location of the case study building (source: google maps, edited by author).
2.2. Methods of Objective Data Collections and Validations
As shown in Figure 1 and Figure 3, objective data collection methods include spot measurements and continuous monitoring of environmental data, including DBT in °C, RH in %, CO2 level in ppm, Illuminance level in lux and Sound Pressure Levels in dB using handheld anemometers, IoT sensors, existing BEMS sensors and Tinytag data loggers, as shown in Figure 3. Smart Bluetooth based environmental sensors were also used to collect data during education workshops to support subjective feedback, which is explained in Section 2.3.
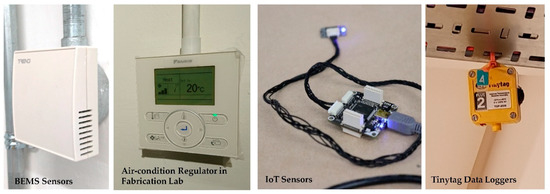
Figure 3.
Images of existing Building Energy Management (BEMS) sensors, air-condition regulators, Tinkerforge Bricklets with Internet of Things (IoT) and Tinytag sensor.
Table A1 in Appendix A provides the detailed specifications highlighting the measurement range and accuracy of handheld equipment, BEMS, IoT, Bluetooth sensors, and other accessories based on the manufacturers’ technical datasheets available on the internet.
As shown in Figure 4, spot measurements within the case study building were only conducted following 17 and 30 grid points on the 4th and 5th floors, respectively, at 1 m and 2 m level from the floors in November 2019 to investigate the deviations of DBT, CO2 and illuminance (lux level) within the zone 3 of the floor plates. Since all the existing BEMS sensors have fixed positioned on the wall at 2 m height from the floor levels and may not represent the environmental performance of the total indoor space, this exercise tried to justify the reliability of monitoring the BEMS sensors for indoor spaces.
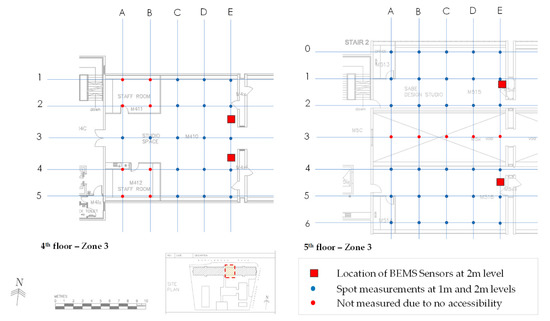
Figure 4.
Grids showing the location of spot measurements on the 4th and 5th floors.
Figure 5 shows the locations of the BEMS, IoT and Tinytag data loggers within the selected university premises. Over 60 IoT sensors with 30 Tinkerforge Bricklets (Appendix A) were planned to be deployed in Fabrication Lab, 4th floor and 5th floor levels within the scope of the project, and the overall methods of IoT integration methods were shown in Appendix B. Figure A1 elaborates the four steps of deployment, e.g., environment, sensing, network, and application, revealing the locations of each IoT Sensor Hub with mini Personal Computer (PC), execution of the python script, Hotspot connection options, and tools involves from server to end-users.
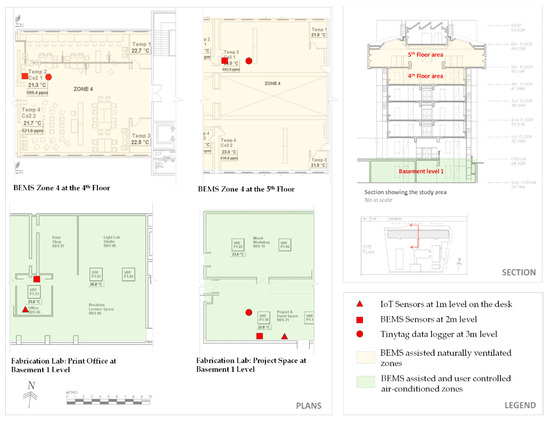
Figure 5.
Studied areas for BEMS, IoT and Tinytag sensors.
However, for data validation and visualisation, IoT sensors were initially located in the Fabrication Lab’s Print Office and Project Space at 1 m level suspended from the shelves on the desk levels as shown in Figure 5. Two sets of IoT sensors were also deployed in two lecture rooms during the educational workshop sessions (see Section 2.3). As a limitation of this research, these IoT sensors could not be deployed from the ceiling on a free space due to security, power source, and handling issue. However, the Tinytag data loggers were positioned at 3-meter level suspended from the ceiling and service trays, as shown in Figure 3 and Figure 5.
As an established method, the mini Personal Computers (PCs) were connected to Wireless Access Point (WAP) through the University wireless network. The reason for selecting the existing Wi-Fi network is the higher transmission range and rate compared to other technologies such as Bluetooth [3]. Tinkerforge IoT sensors measuring DBT (°C), RH (%), Illuminance (lux) and Sound Pressure Level (dB) were integrated into Microcontrollers named ‘Tinkerforge Bricklets’ and connected to Mini PCs, i.e., ‘Raspberry PI Zero’ (specifications are included in Appendix A). Based on an initial market survey, 5v USB adapter and Power over Ethernet (PoE) adapters were chosen to provide power to the Mini PCs. It was found that the initial cost for battery-powered Mini PC is relatively high and have a high-risk factor within a university premise as per the author’s risk assessment. This should be further explored in future studies.
A desktop computer located in the Fabrication’s Lab Print Office was used as a local server to write the data directly to the ‘InfluxDB’ database with written coding [2]. Grafana Lab tool (https://grafana.com/) was used to visualise the live IoT data and to evaluate the reliability of using university ‘Eduroam’ Wi-Fi network for this purpose. For the analysis, the database was converted from InfluxDB to *.csv files. ‘Microsoft Excel’, with add-in ‘Pivot’ and ‘Data Analysis’ tools, were used to retrieve the data from over 7.8 million rows for each parameter for cross-tabulations. ‘IBM SPSS Statistics—version no. 24′ software was also utilised for managing and analysing database [22].
The existing BEMS interface of the case study building was located at a specific and static Internet Protocol (IP) address hosted on ‘TREND 963’ server [23]. The same computer used for IoT data visualisation was validated by the IT security team of the university to direct access to the graphical interface of BEMS. Screenshots of the graphical interfaces showing the thermostats, indoor and outdoor DBTs, CO2, rain, and wind sensors were recorded daily during weekdays and a few weekends from March 2019 to July 2019. The useful data of the studied floors (see Section 2.1) were transferred manually to Excel sheets and SPSS database for comparative analyses and cross-tabulations [22]. Figure 5 shows the locations of the BEMS sensors at 2 m level that were used for data validations. Tinytag DBT and RH sensors were also deployed at 3 m above the floor plate and 3 m away from the BEMS sensors simultaneously during July 2019 to cross tabulate the reliability of BEMS sensors in both BEMS assisted naturally ventilated and air-conditioned zones, as shown in Figure 5.
Portable Bluetooth sensors (Appendix A) were also used to record DBT and RH at work desks during the students’ workshops to cross tabulate between the overall environmental data of the lecture room (Figure 6), and data collected at students’ desks and students’ online feedback (see Section 2.3).
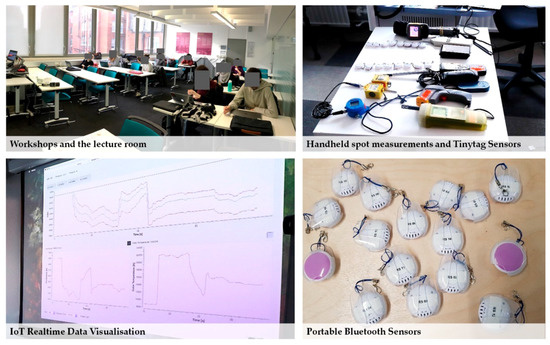
Figure 6.
Use of IoT data visualisation, portable Bluetooth sensors and other equipment for educational workshops (source: photo archive of ‘Realising Sustainability Project’).
2.3. Educational Workshops and Post Occupancy Evaluation
The educational workshops were conducted during February and April 2019 as a collaboration between ‘Realising Sustainability’ project and students from the undergraduate and postgraduate courses. The collaboration not only allowed useful data to be collected for the project, but highly enhanced the students’ learning experience and educational value of the teaching activities.
Figure 6 shows selected images from the educational workshops and provides examples of the classroom, IoT data visualisation, portable Bluetooth sensors and other equipment. Through these workshops, students were exposed to the cutting-edge technology of recording and visualising real-time environmental data, which are usually invisible to them, through utilising IoT sensors in addition to conventional data logging sensors and hand-held equipment (Figure 6). After the workshop, it was expected that the students would improve their perception of the effect of environmental factors, e.g., DBT, RH etc., and personal factors, e.g., Clothing insulation (CLO) and Metabolic Equivalent of Task (MET) value, on human thermal comfort. Anonymous Online Structured Questionnaire, based on google drive, as shown in Appendix C, was provided to the students for their instant feedback on their thermal comfort through the Thermal Sensation Vote (TSV) in 7-point scale and Thermal Preference Vote (TPV), in 5-point scale, so that they could relate their real-time thermal perception with data visualization (Table A2 and Table A3, Figure A2). An answer with a 5-point scale (−2 to +2) was also gathered at the end of the workshop to quantify their self-assessed improvement on their perception of the indoor environment using IoT (See Table A4 in Appendix C).
As a well-recognised method for post-occupancy evaluation (POE) [24], the Building Use Studies (BUS) Questionnaire survey method was selected to collect subjective data at the Marylebone Block.
Specifically, the Workplace Questionnaire that has been developed and licensed by the Usable Building Trust [25] was used for the evaluation. Leaman [26] described the BUS occupant questionnaire and methodology, which has been extensively employed in hundreds of buildings studies around the world. Results from the BUS licenced building studies over the years converge into the database forming the basis for benchmark and comparison of each new survey. The survey comprehensively evaluates the users’ perceptions of the building, questioning the ‘historic’ memory of the building since the first occupation, and does not question the perception of their environment at the present moment only [27]. Due to copyright restrictions, the BUS questionnaire was not attached to this paper.
The questionnaire queries occupants on environmental parameters, namely: lighting, airflow and air quality, the temperature during summer and winter, noise, as well as on other parameters of subjective satisfaction such as the design perceptions, health, perceived productivity etc. The occupants’ cumulative response for each parameter is indicated through a mean value and this can be evaluated in the context of the parameter’s specific 1 to 7 scale and benchmark of the BUS database. The 1 to 7 scale expresses responses in the spectrum of unsatisfactory to satisfactory, respectively, and is graphically represented by shaped symbols and a traffic light colour code (green, amber and red). On the top scale of each parameter, the benchmarks are represented by the small rectangles [27].
The survey was conducted during the period of June–July 2019. Although the main objective of conducting the ‘BUS Questionnaire’ survey among both students and staff members was to benchmark the environmental performance of the Marylebone block by questioning their memory of the space, the survey outcome within this study was also used to investigate and cross-reference the students’ improved perception and awareness on their indoor environmental after the workshops during February–April 2019. As suggested by Gossauer and Wagner in 2007 [28], sample size and their characteristics were maintained while distributing the questionnaire. All the ethical procedures and risk assessments were followed and practised. The survey was conducted among 83 staff members and 57 students of the Marylebone Block representing 60% of the staff and student population during the summer term.
3. Results and Discussions
3.1. Outcome of Spot Measurements
Figure A3, Figure A4, Figure A5, Figure A6, Figure A7 and Figure A8 in Appendix D provide graphical representations of average results from the spot measurements and highlight the variations of indoor DBTs, CO2 and Lux levels at the 4th and 5th floors during November 2018. The results from spot measurements of indoor DBT, CO2 and Lux levels reveal there were variations of 0.4 °C, 62 ppm, and 130 lux, respectively, within highest and lowest values at the 4th floor study area. Again, there were variations of 1.4 °C, 207 ppm, and 1630 lux of indoor DBT, CO2, and Lux levels, respectively, within highest and lowest values at the 5th floor study area. The main reasons behind the deviations of spot measured values were the location of the floor plates and the configuration of the spaces, as shown in Figure 5. While validating the data collected at 1 m and 2 m levels, the results revealed that the deviations of indoor DBT between these two levels at both study areas were not significant. However, CO2 levels were recorded slightly lower at 2 m level than that at the 1 m level at both study areas. In contrast, Illuminance levels were recorded slightly higher at 2 m level than that at the 1 m level at both study areas. These results also indicated the importance of locating the BEMS and IoT sensors close to the work-plane level, i.e., 0.8 m–1 m high from the floor plate, within a workspace area while considering the CO2 and illuminance levels that users usually experienced at their sitting position.
Given that the existing BEMS system is assisted by mainly DBT sensors at all floors and CO2 sensors are only used on the 4th and 5th floors for manoeuvring ventilation outlets on the roof, the further investigations were focused on only indoor DBTs as a common environmental parameter within the study areas.
3.2. Results from IoT and BEMS Sensors
Figure 7 illustrates the measured DBT data from IoT and BEMS sensors located at the air-conditioned spaces of Fabrication Lab named ‘Project Space’ and ‘Print Office’ during March and April 2019. The figure reveals that there were significant differences in indoor DBT profiles between weekdays office hours, weekdays unoccupied hours and weekends. Since both spaces are air-conditioned, scheduled and assisted by BEMS, indoor DBTs recorded by BEMS sensors decreased to its lowest at 8 am and increased after 6 pm during each weekday. During weekdays and weekends, the diurnal range of indoor DBTs fluctuated by values of 6.2 °C and 1.5 °C, respectively, deviating by a maximum of 18 °C from the outdoor DBT. The fluctuations of indoor DBT did not respond to outdoor DBT and was governed by schedules set by BEMS.
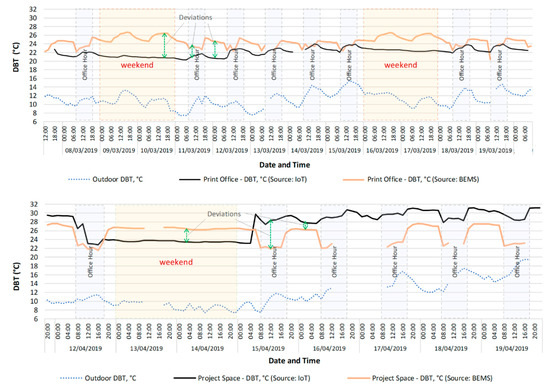
Figure 7.
Recorded dry bulb temperatures (DBTs) in Print Office and Project Space (source: IoT and BEMS sensors, outdoor DBT collected from BEMS outdoor space sensor).
In Figure 7, the recorded indoor DBT data reveal that there were significant deviations, i.e., from 2.5 °C to 6 °C, between the IoT and BEMS sensors during the weekdays and weekends. Figure 8 and Table 1 also show the comparative study of maximum, minimum, mean, median and standard deviations (SDs) of indoor DBT recorded from IoT and BEMS sensors.
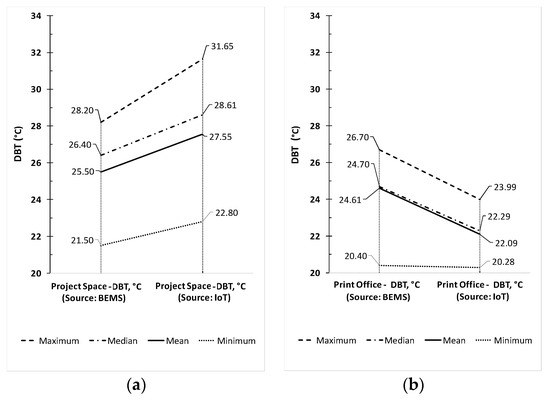
Figure 8.
Validation and Deviations between IoT and BEMS data in (a) Project Space in March 2019 and (b) Print Office in April 2019.

Table 1.
Descriptive Statistics of Recorded Data from IoT and BEMS Sensors in Fabrication Lab.
Figure 8 reveals that deviations between BEMS and IoT data slightly differ in Project Space and Print Office, considering they were recorded during the periods of April and March, respectively. In particular, the mean indoor DBTs recorded from IoT sensors in Project Space and Print Office were 2.05 °C higher and 2.52 °C lower respectively than BEMS data. Standard deviations (as shown in Table 1) were also higher in Project Space and lower in Print Office. Considering Figure 3 and Figure 5, these deviations could be the result of the slightly different location of the BEMS and IoT sensors being placed on walls near air-conditioner blowers and work-plane levels, respectively, in addition to the varying size of the volume of these spaces.
Figure 5, Figure 7, and Figure 8, and Table 1 indicate that the location of the BEMS sensors may have an impact on the users’ experience as users usually control their indoor heating and cooling setpoints during office hours based on the reading shown on the controller displays. Hence, the reliability of real-time indoor DBT readings and visualisation should be ensured during office hours. While indoor DBTs recorded from IoT sensors represent the thermal environment around the work-plane area with less fluctuation, these data can be utilised subject to further testing of validations and can be integrated with BEMS systems so that air-conditioned spaces could be effectively controlled.
3.3. Results from BEMS and Tinytag Sensors
Figure 9 illustrates the measured DBTs from BEMS and Tinytag sensors located at the air-conditioned Fabrication Lab—‘Project Space’—as well as the design studio areas on the 4th and 5th floors during July 2019. The latter two areas were BEMS assisted for heating and natural ventilation. The figure reveals that there were significant differences in indoor DBT profiles between weekdays office hours, weekdays unoccupied hours and weekends, similarly to the scenario illustrated in Figure 7. Since ‘Project Space’ is air-conditioned, which is also scheduled and assisted by BEMS, indoor DBTs recorded by BEMS sensors decreased to its lowest after 8 am and increased after 6 pm during each weekday, when uncontrolled. The diurnal range of indoor DBTs fluctuated by a maximum value of 5.5 °C and 0.3 °C during the weekdays and weekends respectively, keeping a deviation of up to 9 °C from the outdoor DBT. The fluctuations of indoor DBT did not respond to outdoor DBT and was governed by schedules set by BEMS.
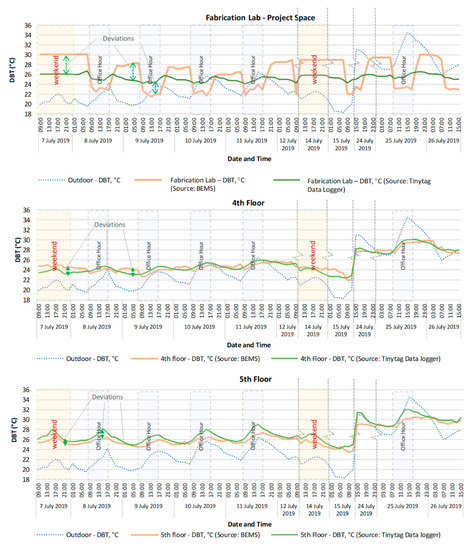
Figure 9.
Recorded DBTs using BEMS and Tinytag sensors (source: BEMS sensors and Tinytag data loggers, outdoor DBT collected from BEMS outdoor space sensor).
In contrast, Figure 9 also shows that indoor DBTs were relatively responsive to outdoor DBT. Due to the unavailability of the staff member and a technical issue, data could not be collected continuously during the whole month of July. Indoor DBTs recorded by both BEMS and Tinytag sensors escalated to its peak value after 3 pm and decreased to its lowest after 1 am during each weekday. This relationship between indoor and outdoor DBT was observed to be more pronounced on the 4th and 5th floors where greater coupling with the outdoor exists by the adoption of a natural and mixed-mode ventilation strategy. The diurnal range of indoor DBTs fluctuated by the maximum values of 2.5 °C and 0.8 °C during the weekdays and weekends, respectively, keeping a deviation from the outdoor DBT of up to 5.6 °C.
In Figure 9, the recorded indoor DBT data revealed that there were significant deviations, i.e., from 1.2 °C to 5.6 °C, between the BEMS and Tinytag sensors at the Project Space during the weekdays and weekends. In contrast, the recorded indoor DBT data revealed that there were minor deviations, i.e., from 0.2 °C to 1.9 °C, between the BEMS and Tinytag sensors at the Project Space during the weekdays and weekends. Figure 10 and Table 2 also show the comparative study of maximum, minimum, mean, median and SDs of indoor DBT recorded from BEMS and Tinytag sensors.
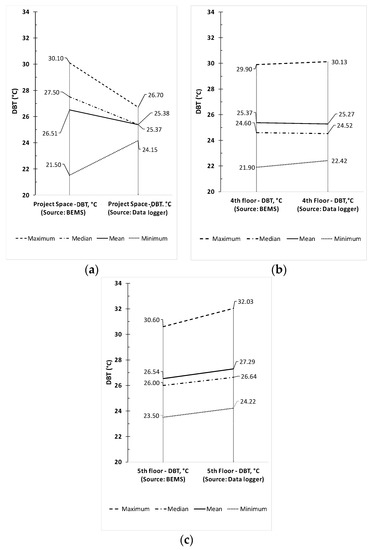
Figure 10.
Validation and Deviations between BEMS and Tinytag data in (a) Project Space, (b) 4th Floor and (c) 5th floor.
Table 2.
Descriptive Statistics of recorded data from BEMS and Tinytag Sensors.
Figure 10 explicitly demonstrates that the deviation between BEMS and Tinytag sensors is significant in the basement Project Space compared to the studio spaces on the 4th and 5th floors considering they were all recorded during the same period of July 2019. In particular, the mean indoor DBT recorded from BEMS sensors in Project Space was 1.13 °C higher than that from Tinytag sensors. Maximum and minimum values recorded by BEMS sensors also indicate its higher diurnal range compared to those values from Tinytag data loggers. Standard deviations (as shown in Table 2) were also higher in Project Space and lower in the 4th and 5th floors. Considering Figure 3 and Figure 5, the deviations in Project Space could be the result of the location of the BEMS and Tinytag sensors positioned on the walls near air-conditioner blowers, and 2 m above the floor plate, respectively. This validation process indicates that the BEMS data in 4th and 5th floors are more reliable than that located in the air-conditioned Project Space.
Figure 5, Figure 9, and Figure 10, and Table 2 indicate that the location of the BEMS sensor may have an impact on the users’ experience, as found in Section 2.2. While indoor DBTs recorded from BEMS sensors located on the 4th and 5th represented relatively accurate and valid thermal environments, these data can be utilised for real-time data-visualisation integrated with the planned deployment of IoT sensors (Appendix B).
3.4. IoT Data Visualisation and Its Application
Despite the challenges associated with the internet privacy protocol and the dynamic IP address of ‘Eduroam’ Wi-Fi at the University of Westminster, the environmental data (i.e., DBT, RH, illuminance, and sound level) from Tinkerforge IoT sensors were successfully visualised and displayed using the web tool, Grafana (see Section 2.2). Both the real-time and historic data visualisations from IoT sensors were available for students and staff members in the Fabrication Lab at Print Office and Project Space as a test run. Figure 11 provides a snapshot of the different matrices of the real-time visualisations of the above environmental parameters in addition to at least 24-h historic data. A few informal feedbacks from the users revealed that the data in the templates of the circular dashboard located at the right-hand side of the figure were easy to perceive in terms of understanding the real-time environmental data and targeted comfort ranges of their environment.
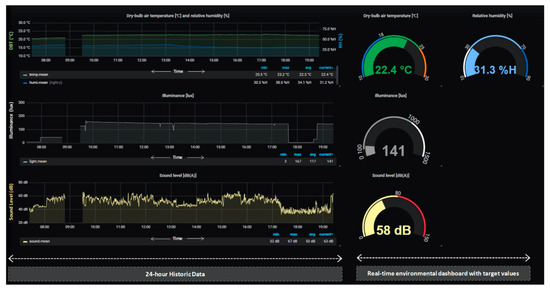
Figure 11.
DBT, relative humidity (RH), Illuminance and Sound levels—Real-time IoT data visualisation in the Print Office (source: IoT data display in Grafana tool, edited by the author).
Figure 12 illustrates the historic data visualisations at the ‘Print Office’ utilising the Grafana tool, which enabled users to improve their perception of the environmental and energy performance of the Fabrication Lab. The highlights of the disruptions in continuous data monitoring show the lack of reliability of recording continuous IoT data by utilising solely the university Wi-Fi networks with dynamic IP addresses which changes almost every week for university’s security reasons. This indicated that IoT should be set up with a static IP address especially permitted by the university’s IT team and that daily scheduled monitoring is required to avoid loss of data.
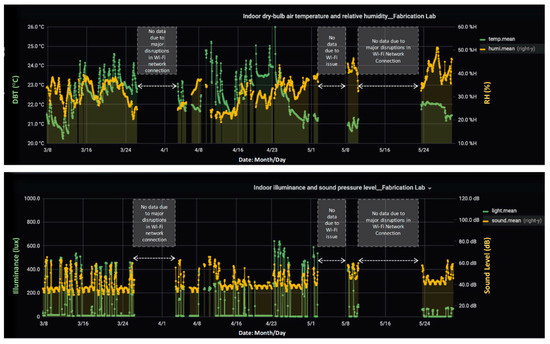
Figure 12.
DBT, RH, Illuminance and Sound levels—Historic Data Visualisation at the Print Office (source: IoT data display in Grafana tool, edited by the author).
In addition to the real-time data-visualisation, Figure 13 shows the maximum, minimum and average values of environmental parameters recorded at the Project Space and Print Office by using IoT sensors during April 2019. Figure 13 demonstrated that the average values of DBT, Illuminance and Sound level, recorded by sensors located at the work-plane level, were 4.5 °C, 150 lux, and 3.6 dB higher in the Project Space than in the Print Office. In contrast, the average value recorded by the RH IoT sensors in Project Space was 1.4% lower than that in Print Office. This summary data for each month for all workspaces is useful for a comparative analysis of the environmental and energy performance with the air-conditioned working environment. These data could also be used to keep a comfortable working environment for users. For instance, from Figure 13, the maximum noise level of 71.5 dB was identified in Project Space, which is located near metal and wood labs producing high noise levels from the machine. The historic data of Figure 12 could help identify the date and time of the high sound level, e.g., 8 April, 2019, to investigate the source of the noise and find possible solutions for avoiding such noise pollution.
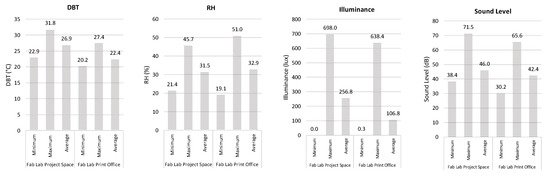
Figure 13.
Minimum, maximum and average values recorded in Fabrication Lab (Source: IoT sensors during April 2019).
Figure 11, Figure 12 and Figure 13 indicated that IoT data collection and visualisation can be useful for both users including students, staff, managers, lab assistants and researchers for improving their perception of the indoor workspace environment. Moreover, building managers can utilise both real-time and historic IoT data-visualisation for monitoring and improving the existing working environments by synchronising them with recorded BEMS data and energy bills, and, thus, improving energy use efficiency.
3.5. Application of IoT in Educational Workshops
As part of an evidence-informed approach, IoT sensors were used to help students visualise the real-time indoor DBT and RH data through projection (Figure 6) during educational workshops for undergraduate and postgraduate students of environmental design. To crosscheck the data that were collected from IoT with that from Tinytag and portable Bluetooth sensors, the descriptive statistics of 117 data of each parameter, i.e., indoor DBT and RH from each source were plotted (Figure 14).
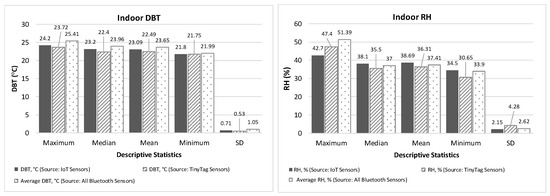
Figure 14.
Comparison of statistical values of DBT and RH recorded at the lecture room during a workshop (source: data collected from IoT, TinyTag, and portable Bluetooth sensors).
Figure 14 revealed that indoor DBT displayed from IoT sensors were reliable with the mean deviations of 0.6 °C and 0.54 °C from that collected from Tinytag and Bluetooth sensors, respectively. Similarly, indoor RH displayed from IoT sensors were reliable with the mean deviations of 2.38% and 1.28% from that collected from Tinytag and Bluetooth sensors respectively. These results validated the reliability of integrating IoT sensors in educational workshops for not only displaying invisible environmental data to students but also getting students involved in the real-time online survey for their subjective feedback on thermal comfort based on portable Bluetooth sensors on their workstations or desks.
Figure 15 shows the average DBT and RH recorded in the students’ lecture room during one of the workshops and indicates the key period of changed physical and environmental parameters, such as students’ physical exercise, switching on an electric heater, opening/closing windows for ventilation, which have direct impacts on the students’ thermal comfort experience [28,29,30,31]. The subjective feedback was also observed keeping the changes of conditions in mind in addition to recorded DBT values.
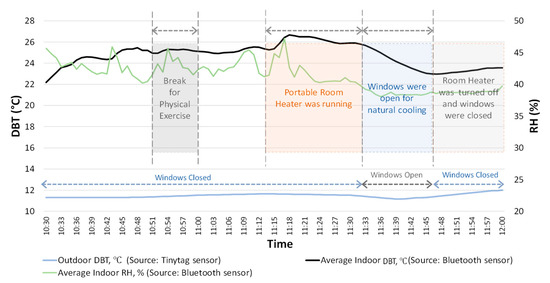
Figure 15.
Recorded Average indoor DBT and RH and change of thermal comfort parameters during a workshop (source: Portable Bluetooth sensors).
Figure 16 provides students’ TSVs against the indoor DBT values recorded from the portable Bluetooth sensors located on individual students’ desks during the workshop run in February 2019. Comparing Figure 15 and Figure 16, it was revealed that TSVs from the students were found as predicted during the periods of 10:50–11:00, 11:15–11:29, 11:30–11:45, and after 11:45. For instance, most of the students’ TSVs increased after 11:00 due to their metabolic gain and were relatively high in their peaks during 11:15–11:29 while the heater was turned on. Similarly, their TSVs dropped after 11:30 while the windows were open and cold draughts were entering the room. Along with real-time IoT data for DBT and RH visualisation, these workshops helped students to perceive the factors that had effects on their overall thermal comfort experience at their educational workspaces.
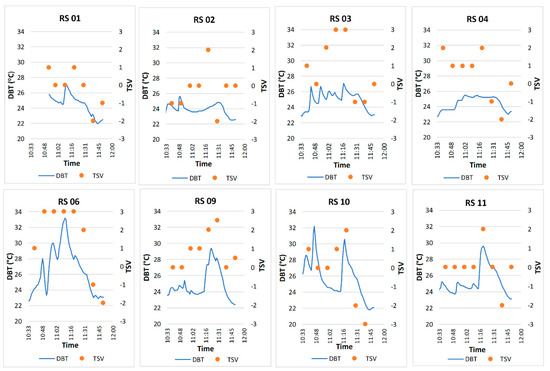
Figure 16.
Profile of measured DBT and Thermal Sensation Vote (TSV) (source: Bluetooth sensors and real-time questionnaire answers from the students).
Figure 17 illustrates the overall feedback from students on their learning experience during workshop with IoT data visualization. Figure 17 reveals that at least a total of (38.5% + 38.5%) = 77% students agreed, and strongly agreed, that the workshops helped students to have a better understanding about invisible thermal data, i.e., DBT and RH, and their overall thermal environment.
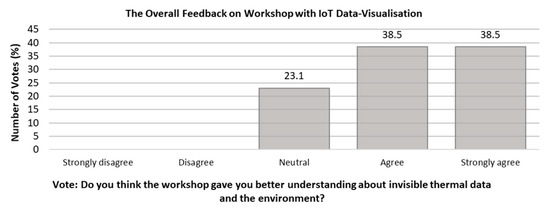
Figure 17.
Overall feedback from students on workshop with IoT data visualisation (source: real-time questionnaire data from students).
The above results indicated that IoT can be applied and integrated successfully to improve the learning experience of students and help them realise sustainability through educational workshops.
3.6. Evidence from the Post Occupancy Evaluation Survey
As mentioned in Section 3.3, the POE workplace questionnaire was administered to staff located in the basement (Fabrication laboratory) and on the 1st, 2nd, 4th, and 5th floors. The majority of the staff are academics and work in cellular offices, which are usually shared with at least one colleague. Some of them have access to openable windows, some others are in mechanically ventilated spaces and a small portion of the surveyed population have no access to a view to the outside. Of the 57 students, the majority are instead located on the 4th, 5th, and 6th floors where they learn within an architectural studio (open plan) environment. The same questionnaire (see Section 2.3) was administered to both groups during the same period (June–July 2019) with the intent of appreciating staff and students’ subjective perception of the building performance, environmental comfort and their health and productivity. The questionnaire was administered to the students after they attended the educational workshops described in Section 3.5, whereas staff was not involved in any workshop or given any specific extra knowledge on the environmental performance of the building.
At a glance, the results show that although the overall perception of the building is not markedly better than the sector’s benchmark in any of the two groups, there is a greater level of satisfaction amongst the students than the staff, with 91% of students’ responses in the satisfactory/neutral band as opposed to 58% of staff in the same band. This is particularly evident for parameters such as Health and Productivity, which are rated better than the benchmark and scale midpoint for the students and worse than the benchmark and below scale midpoint for staff (Figure 18 and Figure 19). Other notable differences are the unsatisfactory perception of summer thermal conditions and winter ventilation by staff. From students and staff’s comments, it is possible to deduce that one of the reasons for this dissatisfaction is related to lack of environmental control in workspaces [26] where the opportunities for adaptation and control are limited. Moreover, given that the students, unlike staff, were exposed, through the workshops (see Section 3.5), to a greater level of understanding of the way the building works and of the role of their behaviour in achieving comfort and influencing the performance of the building, this could have influenced their overall perception of the building as documented in other studies [32].
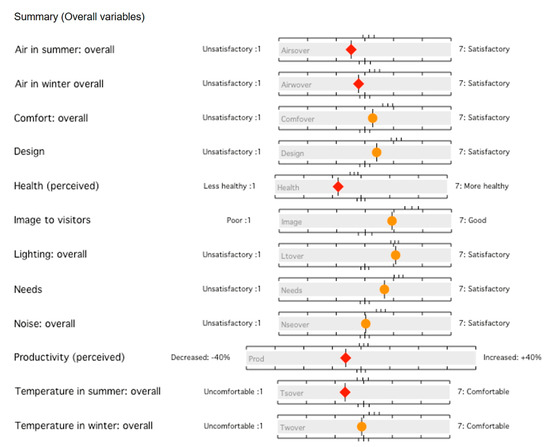
Figure 18.
Post Occupancy Evaluation summary chart for staff (source: Building Use Studies).
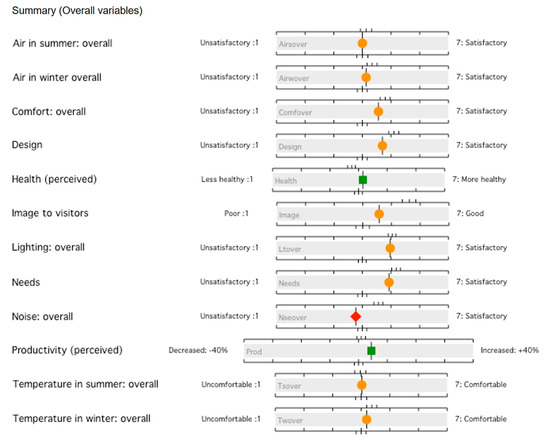
Figure 19.
Post Occupancy Evaluation summary chart for students (source: Building Use Studies).
Figure 18 shows the summary chart of the staff satisfaction survey. The staff expressed satisfactory responses (above midpoint in a 1 to 7 scale) for parameters such as Comfort (overall), Design, Image to Visitors, Lighting (overall), Needs. Parameters such as Noise and Temperature in winter are at scale midpoint and indicate a neutral perception by the respondents (i.e., not unsatisfactory nor satisfactory). The responses to these parameters are indicated in amber, as they do not exceed the sector’s benchmark but are similar to responses in other comparable buildings. The staff provided responses gravitating towards unsatisfactory perception for 5 out of 12 parameters and specifically, these are (in increasing order of dissatisfaction): Air in winter, Air in summer, Productivity, Temperature in Summer, and Health.
Figure 19 shows the summary chart of the students’ satisfaction survey. The students expressed satisfactory or neutral responses (at or above midpoint in a 1 to 7 scale) for the majority of the enquired parameters. A notable exception was the slightly unsatisfactory perception of noise, which although scoring an overall average of 3.77, it is below the sector’s benchmark. This is clearly determined by the open plan configuration of the Marylebone Architectural studios and it is a well-known issue in the space. Other notable exceptions were the scores for Health and Productivity, which resulted higher than both midpoint and benchmark. This is an encouraging overall result, which from the students’ comments it is evidence of their adaptive and modified behaviour as a result of understanding building performance and operability. This is evidenced in comments such as “I use more layers of clothes for winter, and I use earphones to block noise’, ‘Wearing warm clothes or not taking off jacket + have hot drinks (in the case of cold winter) or Open window. Close/open blinds”.
3.7. Existing Challenges and Future Scope
Due to the limited timeframe and resources of the ‘Realising Sustainability’ project (August 2018 to July 2019), numerous challenges emerged in the effective application and troubleshooting of BEMS and IoT technologies to the Marylebone building. Table 3 shows the key advantages and limitations identified during the empirical work of this research.
Table 3.
Advantages and limitation of utilising BEMS and IoT sensors in the case study building.
Although the ‘Estate Planning and Services Department’ as well as the IT Network Team collaborated with the research team throughout the tenure of the project, the first challenge was the strict security policy of Wi-Fi networks with dynamic IP addresses set for UK educational buildings, such as those at the University of Westminster. As mentioned in Section 3.4 and shown in Figure 12, it was not feasible to get uninterrupted data visualisation from IoT sensors by using University Wi-Fi. The university would not allow installing a separate Wi-Fi network within the university area since this could interfere with the existing wireless network.
The second challenge was to continuously monitor and visualise historic data from BEMS sensors using the existing ‘TREND 963’ server. The hardware of the BEMS server did not support the smart technology apart from providing a graphical interface and the server speed was too slow to cope with two-way data traffics [23]. The third challenge was experienced in the attempt to install new smart energy meters to monitor electricity consumption in various zones of the university, to be correlated with environmental data from IoT and BEMS sensors simultaneously. Apart from budget constraints in the installation of a sufficient number of smart meters and sub-meters to provide a meaningful resolution, it was also not viable to integrate them in the existing building considering the complexity of electric wiring of busbars and disruptions involved. All these new technologies would also be consuming additional energy, which required negotiation with (and approval by) building management, increasing the timeframe of the project.
However, as a result of the positive collaboration between the RS project team and the IT Network team, the University is currently working on adopting 5G Long Range (LoRa) network devices as a part of future technology and strategy for Low Power Wide Area Networks (LPWAN) which might be a viable method to integrate IoT at this educational building [33]. It would also expand the scope for installing additional IoT devices along with environmental and energy sensors through hybrid wireless networks [34]. To overcome the limitation of the existing BEMS hardware, the university is in the process of upgrading the existing ‘TREND 963′ with the new IQ®VISION [35] platform, which offers more comprehensive and intelligent building system control functions enabling wide database management and integration of smart software including IoTs and mobile devices. This could also partially resolve the issue of integrating smart energy meters within the existing building. These extendable technologies could expand the scope of application of IoT and BEMS within existing educational buildings.
4. Conclusions
This article demonstrated a range of applications of IoT and BEMS within an educational case study building in London. While addressing the main research question, it is partially viable to utilised the IoT and BEMS for visualising the environmental performance and very effective for improving the learning experience within a university campus. However, the research also encountered some challenges and limitations. The summary findings are as below.
- Spot measurement results showed the importance of locating the BEMS and IoT sensors above the work-plane level, i.e., 0.8 m–1 m high from the floor plate while considering the CO2 and Illuminance levels to obtain valid environmental data.
- Deviations between DBT values from IoT, BEMS, and Tinytag sensors also indicated that it is important to locate the BEMS sensors suspended and close to the work desk to represent the indoor environment that users experienced in both air-conditioned and naturally ventilated spaces assisted by BEMS.
- Considering the wide transmittance range of Wi-Fi network, the total number of IoT sensors can be reduced and thus IoT may be utilised as a cost-effective solution to validate the real-time environmental data. However, the energy consumption of IoT solutions should be further explored to establish this statement. Moreover, existing BEMS servers have to be updated to a higher Specification to expand its compatibility with IoT for synchronising these data effectively.
- BEMS sensors located on the 4th and 5th floors showed valid DBT values with minor deviations. However, other environmental sensors such as illuminance and sound level should be validated and integrated with the BEMS to improve the indoor environmental performance and energy efficiency.
- Both historic and real-time data-visualisation from IoT sensors may be useful not only to users for better understanding their working environment but also to building managers for regulating the BEMS system to improve environmental and energy performance.
- The educational workshop with students’ feedback demonstrated that IoT and real-time visualisation of environmental data were beneficial in improving their perception of the indoor thermal environment. These methods also enhanced students’ overall learning experience within the university.
- The POE results indicated that students have a more positive perception of the building performance, which could be linked to their improved understanding of their workspace environment as a positive effect of the educational workshops with IoT data visualisation.
The challenges of effective application of IoT and BEMS in an educational building can be mitigated by adopting advanced technologies such as 5G LoRa networks and IQ®Vision BEMS platforms which are scalable for various smart applications. The methodology of this research can be adopted and extended in future studies through long-term deployments and validations of IoT and BEMS sensors for the improved environmental performance of working and educational spaces, students’ learning experience and energy efficiency of the educational buildings. Bluetooth options can be investigated in the future to overcome the challenges of Wi-Fi in terms of security and energy consumption. Further quantitative analysis on the cost-effectiveness of IoT deployments in terms of energy consumptions should be explored further in future research. If the IoT solutions are battery-powered, further investigation on the battery lifetime and battery replacement can be done in future research. In this research, the results and measurement differences between various types of sensors were expected due to positional and hardware differences. Since this is one of the limitations of this research, the future studies may consider exploring user perceivable environmental improvements, such as alertness to noise, temperature, lighting or CO2 levels, and use of the distributed sensor data for controlling environmental parameters.
Author Contributions
Conceptualization, R.S.-P. and D.S.; methodology, R.S.-P., M.H., and Z.W.; software, M.H. and Z.W.; validation, M.H. and Z.W.; formal analysis, M.H.; investigation; M.H. and Z.W.; resources, R.S.-P. and D.S.; workshop facilitation, M.H., Z.W., B.L., and R.S.-P.; data curation, M.H.; writing—original draft preparation, M.H.; writing—review and editing, R.S.-P., D.S., and B.L.; data visualization, Z.W. and M.H.; supervision, R.S.-P., D.S. and B.L.; project administration, R.S.-P. and D.S.; funding acquisition, R.S.-P. and D.S. All authors have read and agreed to the submitted version of the manuscript.
Funding
This research was funded by QUINTIN HOGG TRUST (Project number: QHT/2018/DACQ0030).
Acknowledgments
Authors would like to acknowledge the financial support from the Quintin Hogg Trust to undertake the ‘Realising Sustainability’ project activities reported in this paper. They also thank the ‘Estate Planning and Services Department’ and the IT network team of the University of Westminster, Fabrication Laboratory, and the industrial partner ARUP for their technical support.
Conflicts of Interest
The authors declare no conflict of interest.
Appendix A
Table A1.
Specifications of BEMS, IoT Sensors and other equipment (source: manufacturers’ technical datasheets).
Table A1.
Specifications of BEMS, IoT Sensors and other equipment (source: manufacturers’ technical datasheets).
| Equipment Type | Name | Measurement Range | Specification |
|---|---|---|---|
| Hand-held Equipment for Spot Measurement | Testo 625—Thermo Hygrometer | DBT: −10 to + 60 °C; RH: 0.0 to 100.0% | Accuracy: ±0.5 °C (DBT); ±2.5% (5 to 95%RH) Resolution: 0.1 °C (DBT); 0.1% (RH) |
| Testo 535 CO2 meter | 0 to 9,999 ppm (0 to 0,999 vol.% CO2) | Accuracy: 0 to 5000 ppm: (at 23 °C) ± (75 ppm +3 % of m.v.) 5000 to 9999 ppm: ±(150 ppm + 5% of m.v.) Resolution: 1 ppm or 0.001 vol.% [36] | |
| The Hagner Digital Lux Meter EC1 | 0.1–200,000 lux | Accuracy: 0.1–200,000 lux | |
| BEMS (Trend) | Trend CO2, Temperature Space Sensors | DBT range: −20 °C to +40 °C; CO2 range: 0 to 2000 ppm | Accuracy: ±0.3 °C (DBT); ±50 ppm +2% of measured value (CO2); Specification web-link: [37] |
| Tinytag Data Loggers/Sensors | Tinytag Plus 2 | DBT: −25° C to +85 °C; RH: 0% to 100% | Accuracy: 0.01 °C or better (DBT); Better than 0.3% (RH) |
| IoT Sensors (Tinkerforge) and Accessories | Raspberry Pi zero Minicomputer | NA | Configuration: 1 GHz, Single-core CPU; 512 MB RAM; Mini HDMI and USB On-The-Go ports; Micro USB power; HAT-compatible 40-pin header; Composite video and reset headers; 802.11n wireless LAN; Bluetooth 4.0. |
| Humidity Bricklet 2.0 | DBT: 20 °C to 85 °C in 0.01 °C steps, 14 bit resolution RH: 0% to 100% in 0.01% steps. | Accuracy: ±0.2 °C (typical) for temperature (DBT); ±2% (typical) for humidity (RH) | |
| Colour Bricklet | 0–65,535 Lux | Illuminance Resolution: 16 bit | |
| Sound Pressure Level Bricklet | Sound Pressure Level range: 30 dB–120 dB; Frequency range: 40 Hz to 40,960 Hz | Accuracy: ±5 dB, ±5% maximum full-scale error | |
| Master Brick | NA | Specification web-link: https://www.tinkerforge.com/en/doc/Hardware/Bricks/Master_Brick.html [38] | |
| Portable Bluetooth Sensors (Blue Maestro) | Tempo Disc™ 3 in 1 Bluetooth Environmental Sensor Logger | DBT and Dew Point: −30 °C to +75 °C; RH Range: 0% to 100% | DBT: Typical 0.3 °C with maximum 0.4 °C at −10 °C to +75 °C. Resolution of 0.1 °C, Drift less than 0.01 °C per annum; RH: Typical 3% RH with maximum 4% RH 0−80% RH. Resolution of 0.1 °C. Hysteresis +/− 1% RH. Drift less than 0.25% RH per annum [39] |
Appendix B

Figure A1.
The Overall Planning of the Deployment of IoT sensors in Marylebone Campus (source: composed by the author, a few icons have been used in this figure retrieved from Flaticon.com) [40].
Appendix C
Table A2.
Online Questionnaire during the educational workshops (Part 1).
Table A2.
Online Questionnaire during the educational workshops (Part 1).
| Subject ID | Personal Information | Time | Personal Factor | ||
|---|---|---|---|---|---|
| Gender | Age Group | CLO Value | Activity Level | ||
| (Male/Female) | 15–19 | 20–24 | 25–30 | 30–34 | 35–40 | above | (Between 0–3.5) | Seated | Standing Relaxed | Standing Working | Reclining | Walking | Running | Other | ||
| RS 01A | 10:20 | ||||
| 10:30 | |||||
| 10:40 | |||||
| 10:50 | |||||
| 11:00 | |||||
| 11:10 | |||||
| 11:20 | |||||
| 11:30 | |||||
Table A3.
Online Questionnaire during the educational workshops (Part 2).
Table A3.
Online Questionnaire during the educational workshops (Part 2).
| Subjective Vote | |||||||||||
|---|---|---|---|---|---|---|---|---|---|---|---|
| Thermal Sensation: How Are You Feeling at the Moment? | Preference: What Kind of Improvement You Prefer at the Moment? | ||||||||||
| Cold | Cool | Slightly Cool | Neutral | Slightly Warm | Warm | Hot | Much Warmer | Slightly Warmer | No Change | Slightly Cooler | Much Cooler |
| −3 | −2 | −1 | 0 | 1 | 2 | 3 | −2 | −1 | 0 | 1 | 2 |
Table A4.
Online Questionnaire during the educational workshops (Part 3).
Table A4.
Online Questionnaire during the educational workshops (Part 3).
| Remarks | ||||
|---|---|---|---|---|
| Do You Think the Workshop Gave You Better Understanding about Invisible Thermal Data and the Environment? | ||||
| Strongly disagree | Disagree | Neutral | Agree | Strongly agree |
| −2 | −1 | 0 | 1 | 2 |

Figure A2.
Reference Material as a part of Online Questionnaire during the educational workshops (Part 4).
Appendix D
Figure A3, Figure A4 and Figure A5 and Figure A6, Figure A7 and Figure A8 provide graphical representations of spot measurements highlighting the variations of indoor DBTs, CO2 and Lux levels at the 4th and 5th floors, respectively, during November 2018. Brief findings were also provided in each figure.

Figure A3.
Variations of Indoor DBT levels at the 4th floor studio spaces (source: spot measurements plotted by the author; an icon has been used in this figure retrieved from Flaticon.com) [40].

Figure A4.
Variations of Indoor CO2 levels at the 4th floor studio spaces (source: spot measurements plotted by the author; an icon has been used in this figure retrieved from Flaticon.com) [40].

Figure A5.
Variations of Indoor Lux levels at the 4th floor studio spaces (source: spot measurements plotted by the author).

Figure A6.
Variations of Indoor DBT levels at the 5th floor studio spaces (source: spot measurements plotted by the author; an icon has been used in this figure retrieved from Flaticon.com) [40].

Figure A7.
Variations of Indoor CO2 levels at the 5th floor studio spaces (source: spot measurements plotted by the author; an icon has been used in this figure retrieved from Flaticon.com) [40].

Figure A8.
Variations of Indoor Lux levels at the 5th floor studio spaces (source: spot measurements plotted by the author).
References
- Gaur, A.; Scotney, B.; Parr, G.; McClean, S. Smart City Architecture and its Applications Based on IoT. Procedia Comput. Sci. 2015, 52, 1089–1094. [Google Scholar] [CrossRef]
- Sethi, P.; Sarangi, S.R. Internet of Things: Architectures, Protocols, and Applications. J. Electr. Comput. Eng. 2017, 2017, 1–25. [Google Scholar] [CrossRef]
- Li, S.; Da Xu, L.; Zhao, S. The internet of things: A survey. Inf. Syst. Front. 2014, 17, 243–259. [Google Scholar] [CrossRef]
- Ahmad, M.W.; Mourshed, M.; Mundow, D.; Sisinni, M.; Rezgui, Y. Building energy metering and environmental monitoring—A state-of-the-art review and directions for future research. Energy Build. 2016, 120, 85–102. [Google Scholar] [CrossRef]
- Bui, N.; Castellani, A.P.; Casari, P.; Zorzi, M. The internet of energy: A web-enabled smart grid system. IEEE Netw. 2012, 26, 39–45. [Google Scholar] [CrossRef]
- Shah, J.; Mishra, B. IoT enabled environmental monitoring system for smart cities. In Proceedings of the 2016 International Conference on Internet of Things and Applications (IOTA), Institute of Electrical and Electronics Engineers (IEEE). Pune, India, 22–24 January 2016; pp. 383–388. [Google Scholar]
- Iera, A.; Floerkemeier, C.; Mitsugi, J.; Morabito, G. The Internet of things. IEEE Wirel. Commun. 2010, 17, 8–9. [Google Scholar] [CrossRef]
- Minoli, D.; Sohraby, K.; Occhiogrosso, B. IoT Considerations, Requirements, and Architectures for Smart Buildings—Energy Optimization and Next-Generation Building Management Systems. IEEE Internet Things J. 2017, 4, 269–283. [Google Scholar] [CrossRef]
- Wei, C.; Li, Y. Design of energy consumption monitoring and energy-saving management system of intelligent building based on the Internet of things. In Proceedings of the 2011 International Conference on Electronics, Communications and Control (ICECC), Institute of Electrical and Electronics Engineers (IEEE). Ningbo, China, 9–11 September 2011; pp. 3650–3652. [Google Scholar]
- Lehrer, D.; Vasudev, J. Visualizing Energy Information in Commercial Buildings: A Study of Tools, Expert Users, and Building Occupants. UC Berkeley: Center for the Built Environment. 2011. Available online: https://escholarship.org/uc/item/6vp5m5m3 (accessed on 2 May 2020).
- Janssen, M.; Luthra, S.; Mangla, S.; Rana, N.P.; Dwivedi, Y.K. Challenges for adopting and implementing IoT in smart cities. Internet Res. 2019, 29, 1589–1616. [Google Scholar] [CrossRef]
- Xu, B.; Li, L.; Hu, D.; Wu, B.; Ye, C.; Cai, H. Healthcare data analysis system for regional medical union in smart city. J. Manag. Anal. 2018, 5, 1–16. [Google Scholar] [CrossRef]
- Fernández-Ares, A.; Mora, A.; Arenas, M.G.; García-Sánchez, P.; Romero, G.; Rivas, V.; Castillo, P.; Guervós, J.J.M. Studying real traffic and mobility scenarios for a Smart City using a new monitoring and tracking system. Futur. Gener. Comput. Syst. 2017, 76, 163–179. [Google Scholar] [CrossRef]
- Li, S.; Xu, L.D. Securing the Internet of Things; Syngress Publishing: Rockland, MA, USA, 2017. [Google Scholar]
- Kelly, S.; Suryadevara, N.K.; Mukhopadhyay, S. Towards the Implementation of IoT for Environmental Condition Monitoring in Homes. IEEE Sensors J. 2013, 13, 3846–3853. [Google Scholar] [CrossRef]
- Stavropoulos, T.G.; Tsioliaridou, A.; Koutitas, G.; Vrakas, D.; Vlahavas, I. System Architecture for a Smart University Building. In Proceedings of the International Conference on Artificial Neural Networks, Thessaloniki, Greece, 15–18 September 2010; pp. 477–482. [Google Scholar]
- Jakubiec, J.A.; Doelling, M.C.; Heckmann, O.; Thambiraj, R.; Jathar, V. Dynamic Building Environment Dashboard: Spatial Simulation Data Visualization in Sustainable Design. Technol. Des. 2017, 1, 27–40. [Google Scholar] [CrossRef]
- Groat, L.N.; Wang, D. Architectural Research Methods; Wiley: Hoboken, NJ, USA, 2013. [Google Scholar]
- Guerra-Santin, O.; Tweed, C.A. In-use monitoring of buildings: An overview of data collection methods. Energy Build. 2015, 93, 189–207. [Google Scholar] [CrossRef]
- HEFCE. Guide to Post Occupancy Evaluation. The Higher Education Funding Council for England. The University of Westminster: UK. 2006. Available online: http://www.smg.ac.uk/documents/POEBrochureFinal06.pdf (accessed on 21 April 2020).
- Turpin-Brooks, S.; Viccars, G. The development of robust methods of post occupancy evaluation. Facilities 2006, 24, 177–196. [Google Scholar] [CrossRef]
- Field, A. Discovering Statistics Using IBM SPSS Statistics; Sage Publications: London, UK, 2013. [Google Scholar]
- Aghemo, C.; Virgone, J.; Fracastoro, G.; Pellegrino, A.; Blaso, L.; Savoyat, J.; Johannes, K. Management and monitoring of public buildings through ICT based systems: Control rules for energy saving with lighting and HVAC services. Front. Arch. Res. 2013, 2, 147–161. [Google Scholar] [CrossRef]
- Peretti, C.; Schiavon, S. Indoor Environmental Quality Surveys. A Brief Literature Review. UC Berkeley: Center for the Built Environment. 2011. Available online: https://escholarship.org/uc/item/0wb1v0ss (accessed on 2 May 2020).
- Bordass, W.; Leaman, A.; Eley, J.A. Guide to Feedback and Post-Occupancy Evaluation. The Usable Buildings Trust 2006 [online]. 2006. Available online: https://usablebuildings.co.uk/ (accessed on 25 January 2018).
- Leaman, A. PROBE 10: Occupancy Survey Analysis. Build. Serv. J. 1997, 5, 37–41. [Google Scholar]
- Ford, B.; Schiano-Phan, R.; Vallejo, J.A. The Architecture of Natural Cooling; Routledge: Abingdon, UK, 2019. [Google Scholar]
- Gossauer, E.; Wagner, A. Post-occupancy Evaluation and Thermal Comfort: State of the Art and New Approaches. Adv. Build. Energy Res. 2007, 1, 151–175. [Google Scholar] [CrossRef]
- Humphreys, M.A.; Nicol, J.F.; Raja, I.A. Field Studies of Indoor Thermal Comfort and the Progress of the Adaptive Approach. Adv. Build. Energy Res. 2007, 1, 55–88. [Google Scholar] [CrossRef]
- Hossain, M.; Wilson, R.; Lau, B.; Ford, B. Thermal comfort guidelines for production spaces within multi-storey garment factories located in Bangladesh. Build. Environ. 2019, 157, 319–345. [Google Scholar] [CrossRef]
- Hossain, M.; Lau, B.; Wilson, R.; Ford, B. Effect of changing window type and ventilation strategy on indoor thermal environment of existing garment factories in Bangladesh. Arch. Sci. Rev. 2017, 60, 299–315. [Google Scholar] [CrossRef]
- Schiano-Phan, R. Post-occupancy evaluation of non-domestic buildings using Passive Downdraught Evaporative Cooling (PDEC) in south-west USA. Archit. Sci. Rev. 2012, 55, 320–340. [Google Scholar] [CrossRef]
- Allal, B.; Mongazon-Cazavet, K.; Al Agha, S.S.; Gourhant, Y. A green small cells deployment in 5G—Switch ON/OFF via IoT networks & energy efficient mesh backhauling. In Proceedings of the 2017 IFIP Networking Conference (IFIP Networking) and Workshops, Stockholm, Sweden, 12–15 June 2017; pp. 1–2. [Google Scholar]
- Tian, Y.; Li, T.; Song, W.; Fong, S.; Song, L.; Han, J. Chapter 18: Smart Power Management Internet of Things System with 5G and LoRa Hybrid Wireless Network. In 5G-Enabled Internet of Things; Wu, Y., Huang, H., Wang, C., Pan, Y., Eds.; CRC Press, Taylor and Francis: Boca Raton, FL, USA, 2019. [Google Scholar]
- Trend Control Systems Ltd. IQ®VISION Building Management Supervisor. IQVISION Brochure. 2018. Available online: https://www.trendcontrols.com/en-GB/latestproducts/Documents/IQVISION_Brochure_LR.pdf (accessed on 2 May 2020).
- Instrumart. Testo 535 Ambient CO2 Monitor—Instruction Manual. 2020. Available online: https://www.instrumart.com/assets/testo-535-manual.pdf (accessed on 28 March 2020).
- Trend Control Systems Limited. Data Sheet of TREND CO2, Temperature, Humidity Sensors. 2015. Available online: https://partners.trendcontrols.com/trendproducts/cd/de/pdf/en-ta201169-uk0yr0815g.pdf (accessed on 28 March 2020).
- Tinker Forge. Master Brick. 2020. Available online: https://www.tinkerforge.com/en/doc/Hardware/Bricks/Master_Brick.html (accessed on 2 May 2020).
- Blue Maestro Favicon. Tempo Disc™ Bluetooth Temperature, Humidity and Dew Point Sensor Beacon and Data Logger. 2020. Available online: https://bluemaestro.com/products/tempo-disc-bluetooth-temperature-humidity-sensor-beacon-logger (accessed on 3 April 2020).
- Freepik Company S.L. Flaticon Free Icons. 2018. Available online: https://www.flaticon.com (accessed on 3 December 2018).
© 2020 by the authors. Licensee MDPI, Basel, Switzerland. This article is an open access article distributed under the terms and conditions of the Creative Commons Attribution (CC BY) license (http://creativecommons.org/licenses/by/4.0/).