Composed Index for the Evaluation of the Energy Security of Power Systems: Application to the Case of Argentina


Abstract
1. Introduction
2. Literature Review on Energy Security
2.1. The Concept of Energy Security
2.2. Literature Review
- Analytical soundness: Chosen indicators must pertinently measure a significant condition according to the index scope.
- Measurability: Objective assessment must be possible for values of the treated variable.
- Robustness: The data source must be reputable, well-recognized, and authoritative.
- Accessibility: The data must be publicly available.
- Updatability: Historical data must be able to be replaced with new data outlooks.
- Timeliness: The time between the data becoming available and the phenomenon it describes happening must be as short as possible.
- Coherence: The same methodologies, concepts, and definitions must be applied both over time and across countries.
- Consistency: Data should come from a single, common, unique source to the extent possible.
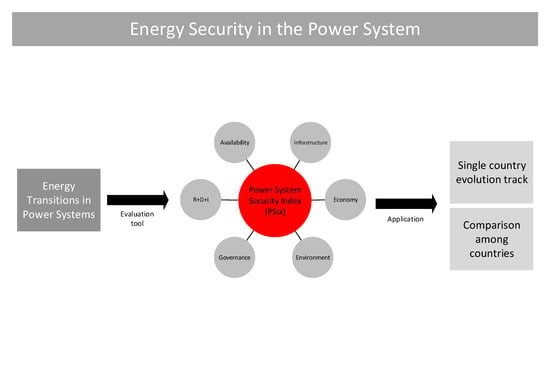
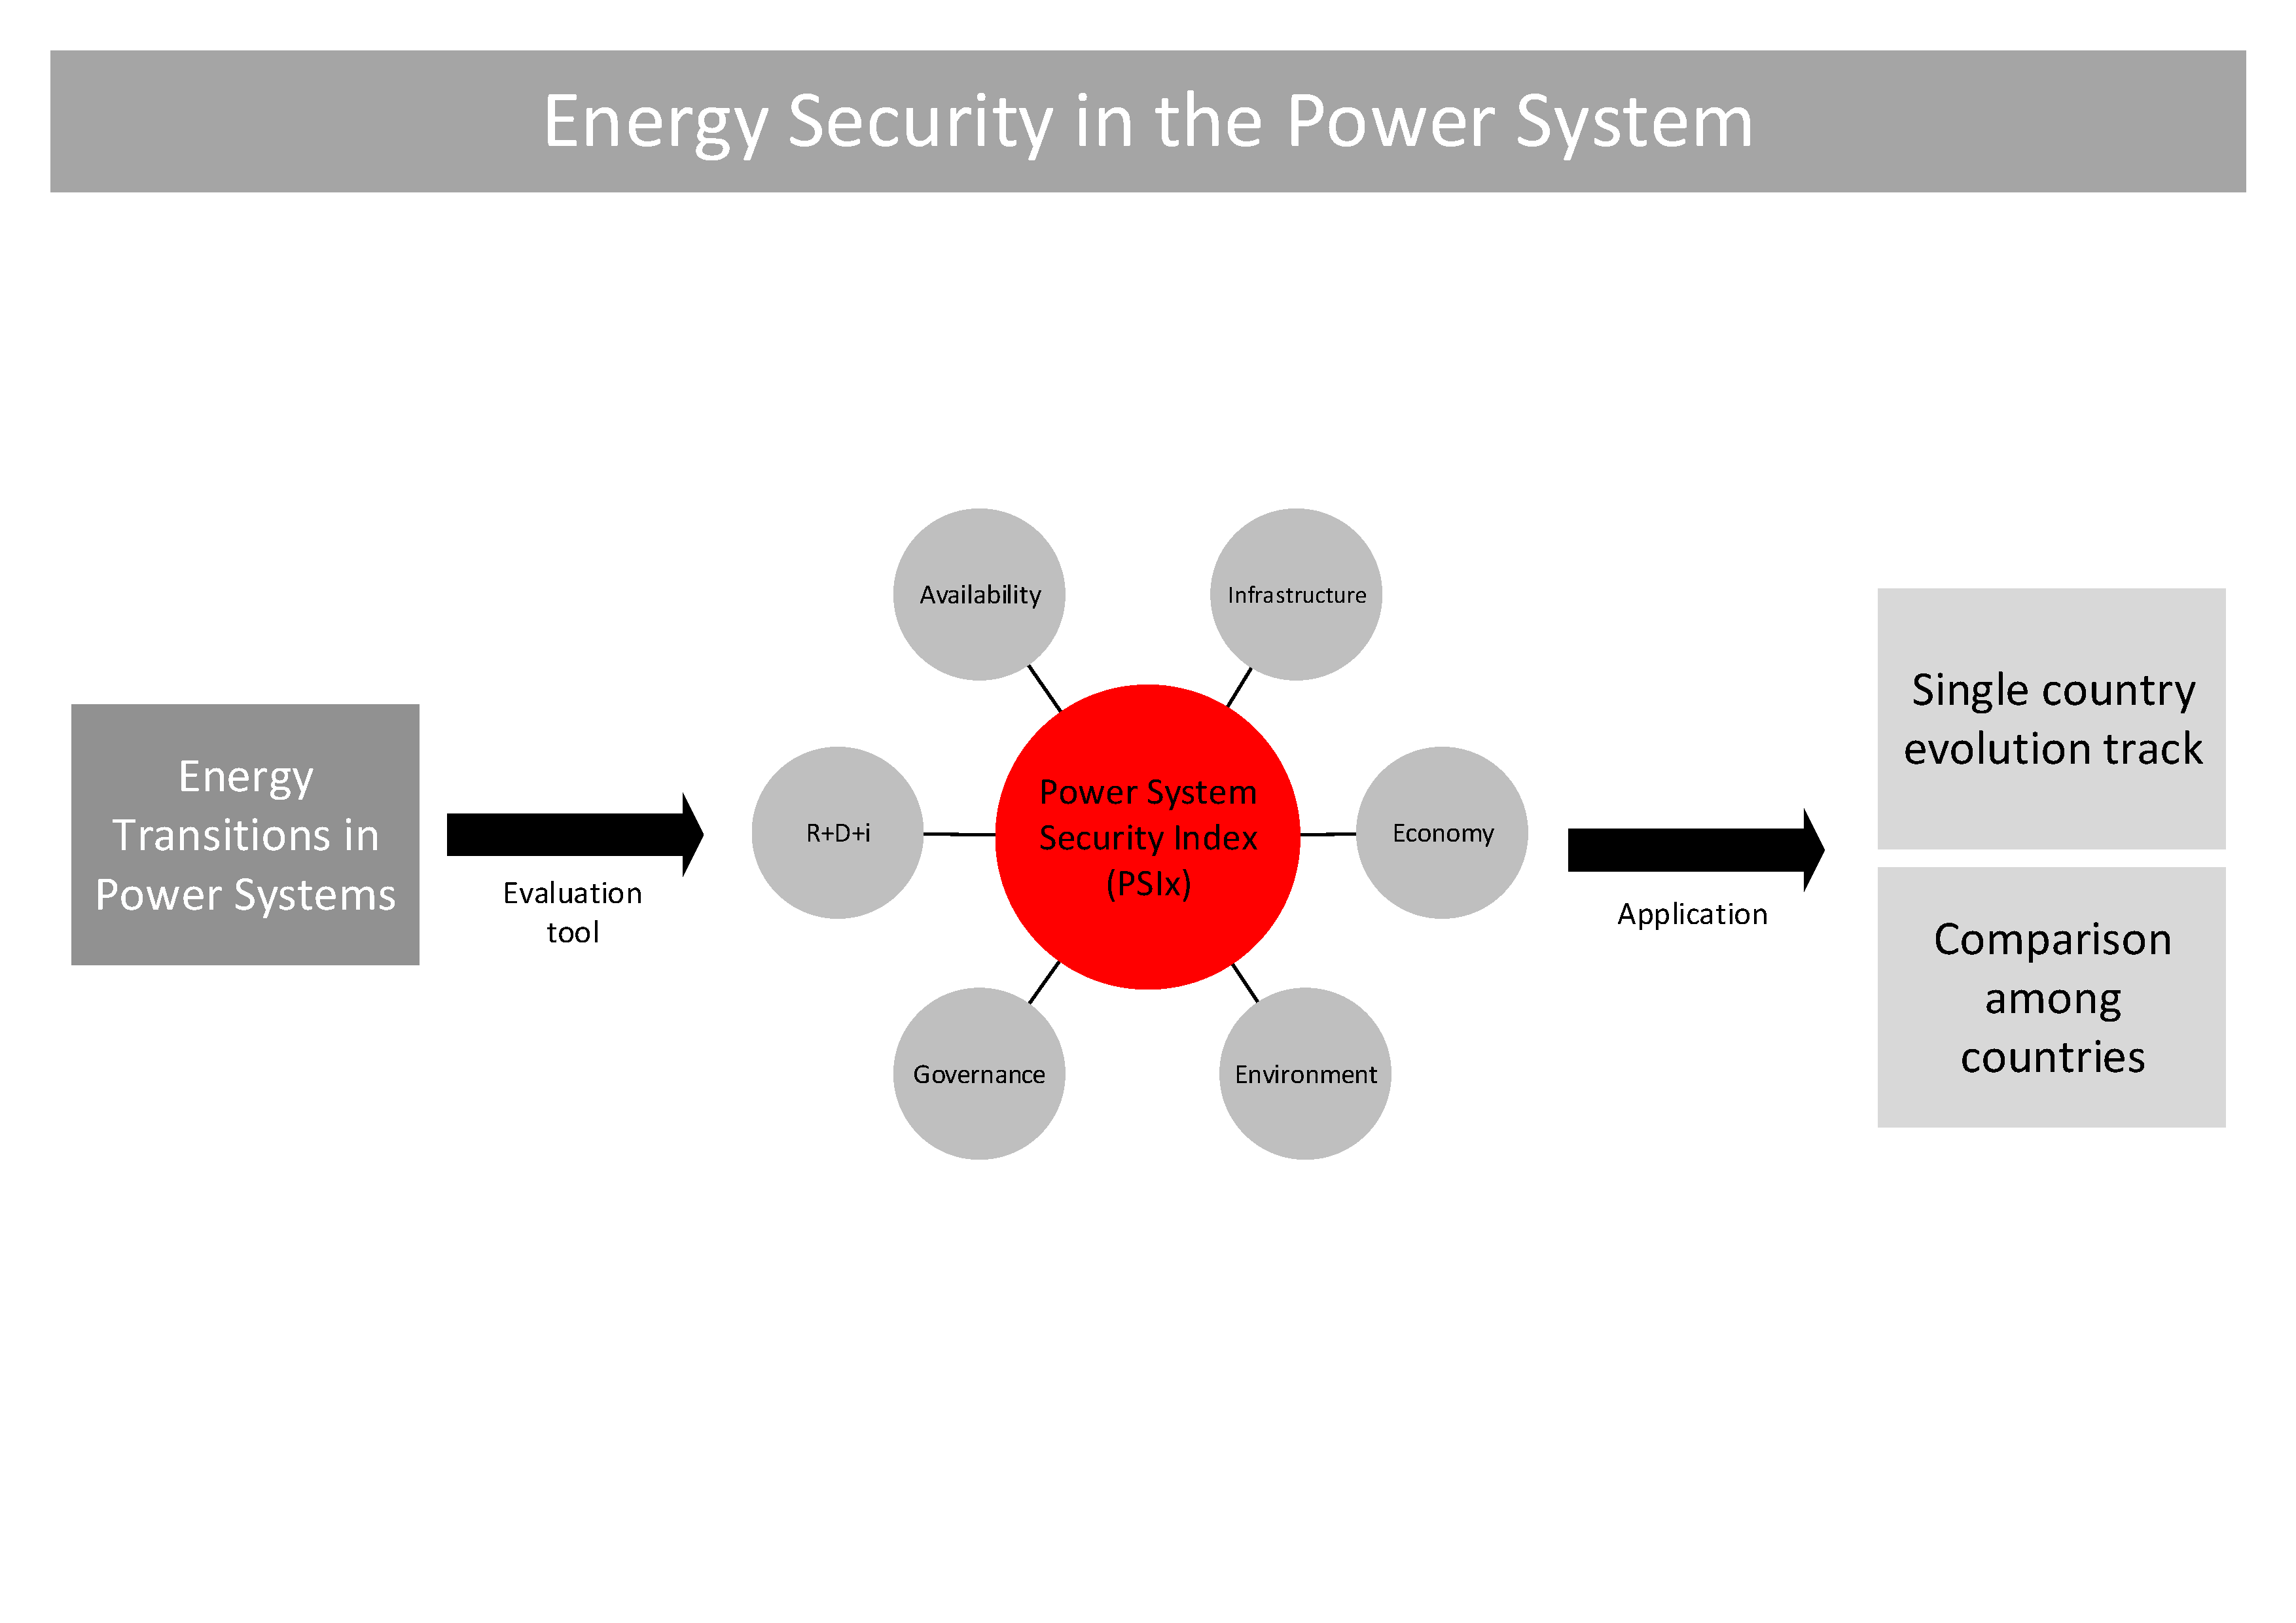
3. Methodology
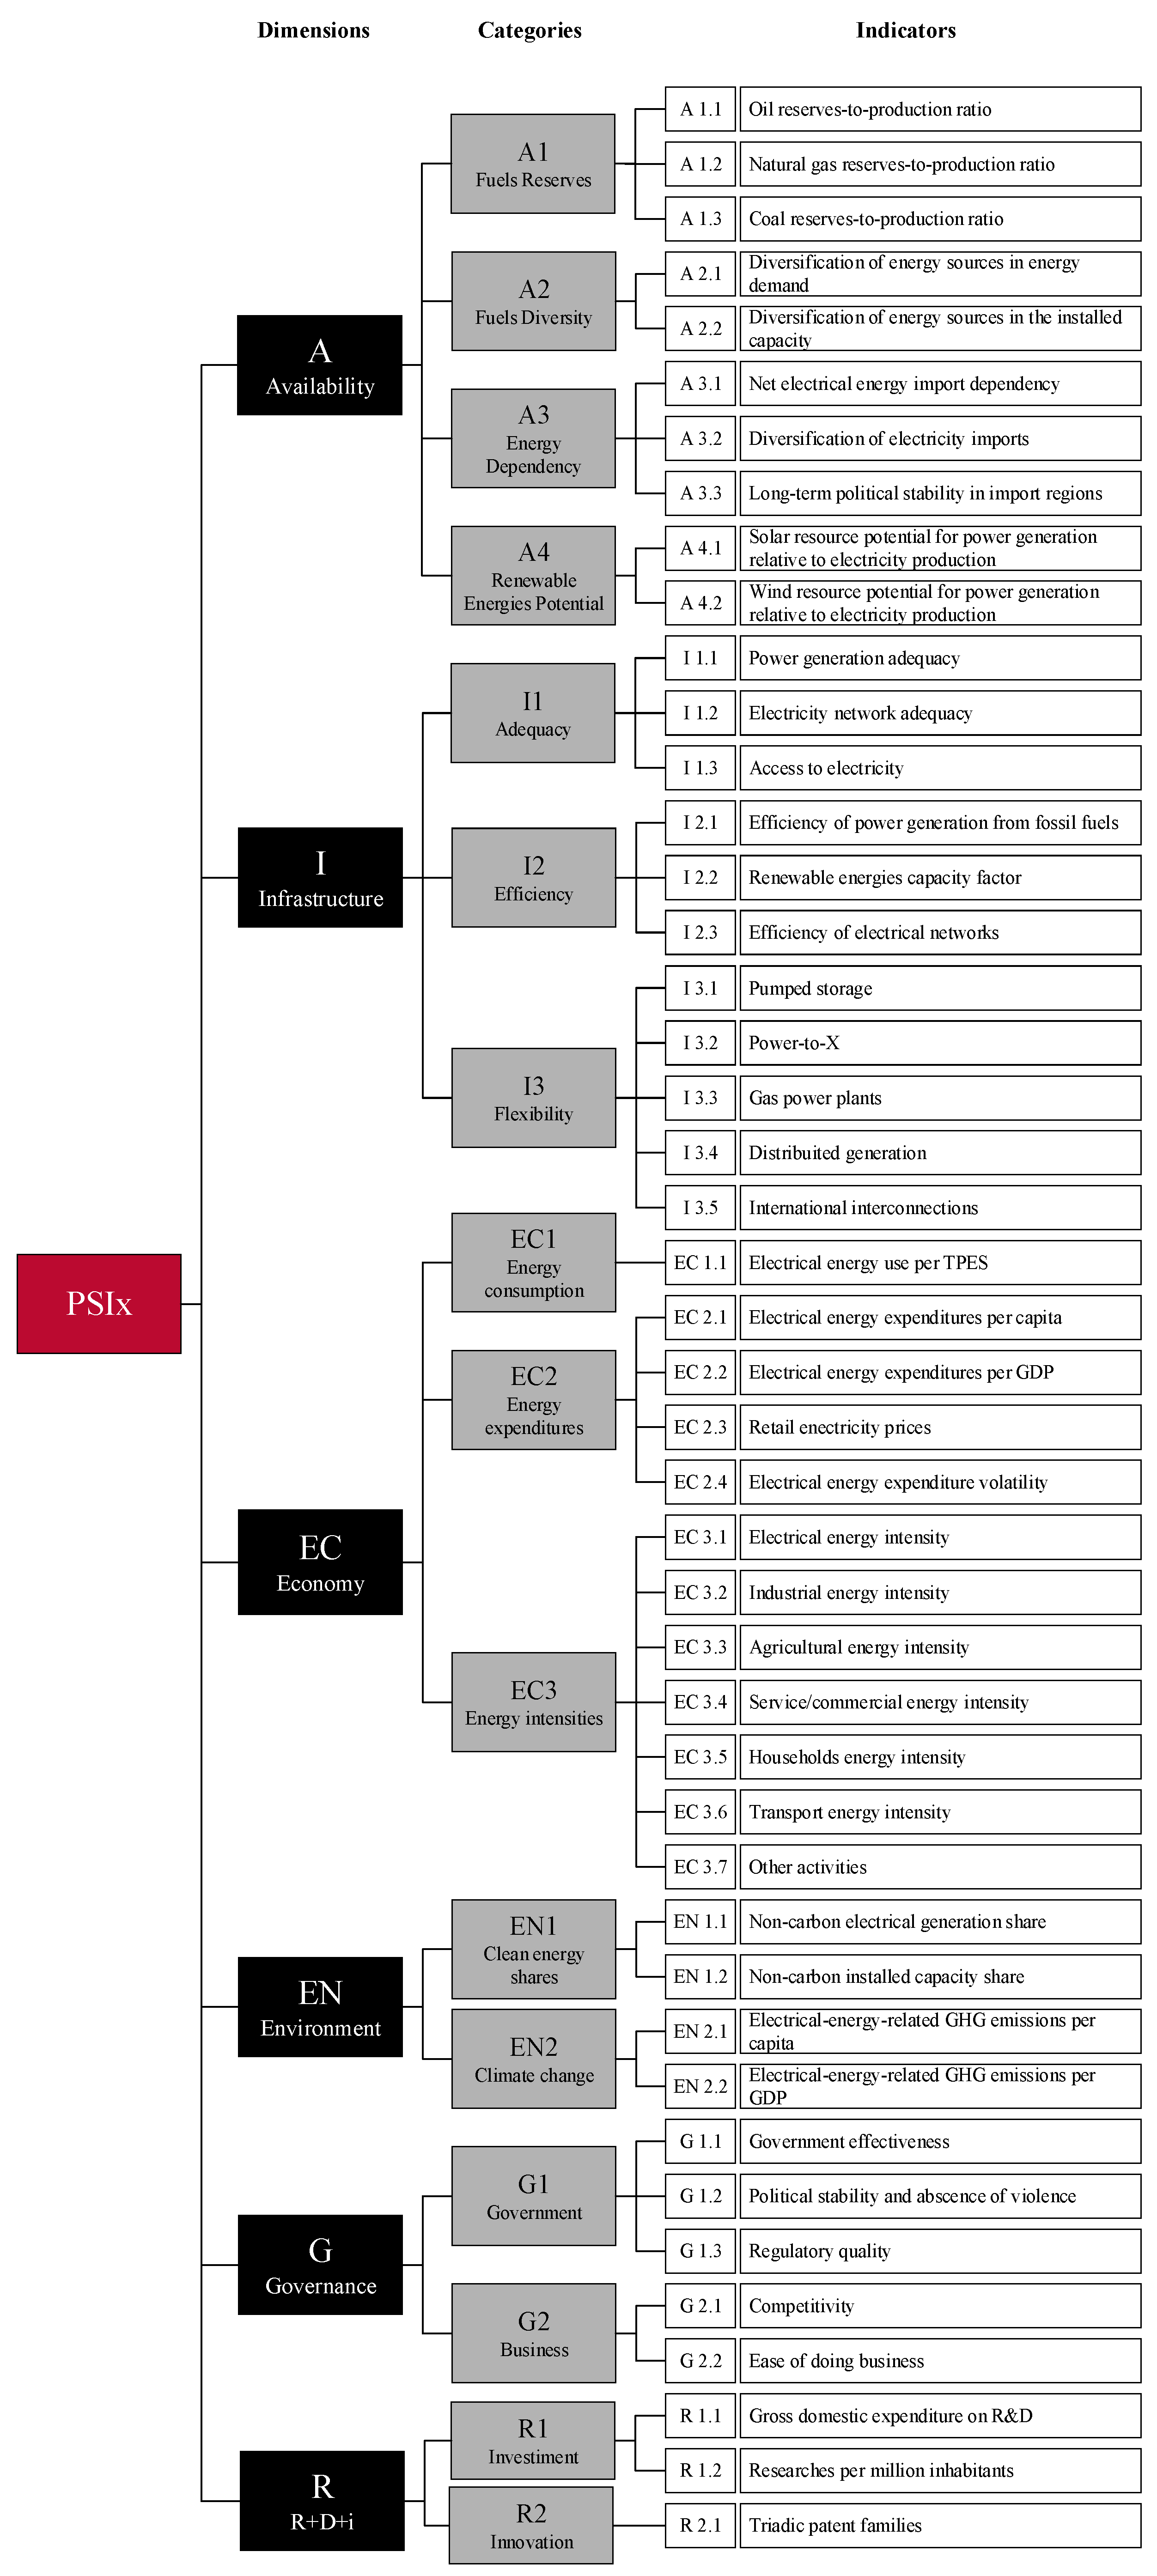
3.1. PSIx Structure
3.1.1. Availability (A)
- Fuel reserves (A1): This category covers the existence of a certain type of fuel relative to its production within national borders. This measure indicates the remaining years of the fuel at current production levels, as proposed by [1]. Since this category deals with the depletion rates of energy fuels, only conventional ones are included in it.
- Fuel diversity (A2): This category covers how different types of fuels are integrated in the electrical energy matrix, both in terms of installed capacity and consumed energy. Both conventional and renewable technologies are included in this category.
- Energy dependency (A3): The extent to which a country relies on alien sources to fulfill its energy needs is examined under this category. This series of measures is particularly important due to the fact that low reliability on energy import and a high diversity of energy import regions mean a lower risk for energy security [35].
- Renewable energy potential (A4): Under this category, the electricity production potential of solar and wind energy sources is measured.
3.1.2. Infrastructure (I)
- Adequacy (I1): This category covers the sufficiency of power generation plants and electrical networks in guaranteeing access to electrical energy to the population. Additionally, the population with access to that energy is included.
- Efficiency (I2): This category deals with power generation plants as well as electrical networks, evaluating how these facilities are able to achieve their maximum productivity in providing electrical energy supply.
- Flexibility (I3): This category includes measures to allow the power system to cope with variability of generation and demand so that the system stays resilient, one of the greatest challenges the energy sector faces globally [37]. Flexibility encompasses energy storage, interconnections, and distributed generation facilities.
3.1.3. Economy (EC)
- Energy consumption (EC1): This category, along with the others, is focused on electrical energy. This measure is contrasted with the total primary energy consumption at the national level.
- Energy expenditures (EC2): This category includes measurements of how much is paid for electrical energy supply, which are contrasted to national income as well as the volatility of the prices of electrical energy.
- Energy intensities (EC3): This category is used as a proxy measure to indicate the efficiency of a country, considering the economic growth generated per unit of used energy. It will be, as proposed by [28], divided into sectors in order to have a benchmark of energy efficiency. This category is a particularly relevant issue for the scope if this work, since efficiency helps to improve energy security by reducing energy needs due to favorable changes in energy technologies, systems, and practices [13].
3.1.4. Environment (EN)
- Electricity shares (EN1): This category covers the share of non-carbon power plants in the total installed capacity on a national basis, as well as the share of their generation in the national production.
- Climate change (EN2): This category deals with GHG emissions per capita and per GDP as a measure of environmental impact of energy-related activities.
3.1.5. Governance (G)
- Government (G1): This category covers data related to governmental development. It includes the performance of the government, the political stability it produces, its regulatory quality, and its ability to ensure the absence of violence; all of these measures are necessary for the proper functioning of the energy system.
- Business (G2): This category considers the economic environment of the country since investments are the lifeblood of the energy system [38].
3.1.6. Research, Development, and Innovation (R)
- Investment (R1): This category is dimensioned by the variables of gross domestic expenditure on R+D+i and the proportional number of researchers in respect to the population.
- Innovation (R2): This category uses the triadic patent families of a country as a proxy variable to measure the innovation level of the country on an annual basis.
3.2. Mathematical Model
3.2.1. Normalization
- Distance to a reference: The first normalization technique to be applied in the index consists of measuring the distance to a base value of an indicator. This distance can be applied either to a maximum or minimum figure, depending on the nature of the indicator in each situation; a maximum value is intended to be reached in cases such as population with access to electricity, while a minimum value is desirable in, for instance, electrical import dependency. Equation (1) illustrates this approach:where the normalized value of the th indicator , associated to a country at a time, is given by the ratio of the indicator to the maximum value given by . Indicators scored under this method are those belonging to the A, I, EN, G, and R dimensions.
- Historical evaluation: The second normalization scope will be used to evaluate historical data, mainly related to economic indicators; this measurement will be performed through percentage of annual differences over years. This technique is described as follows:where the normalized value of the th indicator is given by the ratio of the indicator to the value of the same country but a different time, . Indicators contained in the EC dimension are evaluated according to this second scope.
3.2.2. Weighting and Aggregation
4. The Case of Argentina
5. Results
6. Discussion
7. Conclusions
Author Contributions
Funding
Conflicts of Interest
Appendix A
| ID | Formula | Objective | Source |
| A1.1 | Maximize | OLADE | |
| A1.2 | Maximize | OLADE | |
| A1.3 | Maximize | OLADE | |
| A2.1 | Maximize | OLADE | |
| A2.2 | Maximize | OLADE | |
| A3.1 | Minimize | OLADE | |
| A3.2 | Maximize | CAMMESA | |
| A3.3 | Maximize | CAMMESA | |
| A4.1 | Maximize | World bank | |
| A4.2 | Maximize | World bank | |
| I1.1 | Maximize | CAMMESA | |
| I1.2 | Maximize | CAMMESA | |
| I1.3 | Maximize | OLADE | |
| I2.1 | Maximize | OLADE | |
| I2.2 | Maximize | CAMMESA | |
| I2.3 | Maximize | OLADE | |
| I3.1 | Maximize | CAMMESA | |
| I3.2 | Maximize | CAMMESA | |
| I3.3 | Maximize | CAMMESA | |
| I3.4 | Maximize | CAMMESA | |
| I3.5 | Maximize | CAMMESA | |
| EC1.1 | Maximize | OLADE | |
| EC2.1 | Minimize | OLADE | |
| EC2.2 | Minimize | OLADE | |
| EC2.3 | Minimize | OLADE | |
| EC2.4 | Minimize | OLADE | |
| EC3.1 | Minimize | OLADE | |
| EC3.2 | Minimize | OLADE | |
| EC3.3 | Minimize | OLADE | |
| EC3.4 | Minimize | OLADE | |
| EC3.5 1 | Minimize | OLADE | |
| EC3.6 | Minimize | OLADE | |
| EC3.7 | Minimize | OLADE | |
| EN1.1 | Maximize | CAMMESA | |
| EN1.2 | Maximize | CAMMESA | |
| EN2.1 | Minimize | OLADE | |
| EN2.2 | Minimize | OLADE | |
| G1.1 | Direct value | Maximize | World bank |
| G1.2 | Direct value | Maximize | World bank |
| G1.3 | Direct value | Maximize | World bank |
| G2.1 | Direct value | Maximize | World Economic Forum |
| G2.2 | Direct value | Maximize | World bank |
| R1.1 | Direct value | Maximize | OCDE |
| R1.2 | Direct value | Maximize | OCDE |
| R2.1 | Direct value | Maximize | OECD |
| 1 Proxy measure. Household energy intensity is considered to be domestic electrical consumption per capita. | |||
Appendix B
| Variable | Description | Units | Variable | Description | Units |
| Crude oil reserves | b | Electricity supplied to the power lines | kWh | ||
| Crude oil production | b | Electricity consumption | kWh | ||
| Natural gas reserves | cu m | Power-to-X installed capacity | MW | ||
| Natural gas production | cu m | Installed capacity of gas-fired power plants | MW | ||
| Coal reserves | ton | Installed capacity of distributed generation facilities | MW | ||
| Coal production | ton | International interconnections | MW | ||
| Share of energy source i in the total electricity generation matrix | - | Total primary energy supply | MWh | ||
| Share of energy source i in the total installed capacity matrix | - | Electrical energy expenditures | USD | ||
| Net imported electricity | kWh | Gross domestic product | USD | ||
| Net consumed electricity | kWh | Electricity consumption by industrial activities | kWh | ||
| Share of electrical energy imported from k region | % | Gross domestic product of industrial activities | USD | ||
| Correction factor for pi, political stability | - | Electricity consumption by agricultural activities | kWh | ||
| Total electricity generation | kWh | Gross domestic consumption of agricultural activities | USD | ||
| Potential for power generation from solar sources | MW | Electricity consumption by service/commercial activities | kWh | ||
| Potential for power generation from wind sources | MW | Gross domestic product of service/commercial activities | USD | ||
| Power generation capacity | MW | Household electricity consumption | kWh | ||
| Peak demand | MW | Electricity consumption by transport | kWh | ||
| Total population | people | Number of vehicles | - | ||
| Population with access to electricity | people | Electricity consumption by other activities | kWh | ||
| Produced electricity from fossil-fuel-based installations | kWh | Gross domestic product of other activities | USD | ||
| Maximum possible produced electricity from fossil-fuel-based installations | kWh | Cost of electricity | USD/kWh | ||
| Produced electricity from renewable energy installations | kWh | Electrical energy unit | kWh | ||
| Maximum possible produced electricity from renewable energy installations | kWh | Electricity produced by renewable sources | kWh | ||
| Pumped-storage capacity | MW | Electricity production | kWh | ||
| Maximum generation energy | kWh | Installed capacity of renewable energy facilities | MW | ||
| Transformers power | MW | Greenhouse gases emissions | ton |
References
- Kruyt, B.; van Vuuren, D.P.; de Vries, H.J.M.; Groenenberg, H. Indicators for energy security. Energy Policy 2009, 37, 2166–2181. [Google Scholar] [CrossRef]
- World Energy Council. World Energy Trilemma Index 2018; World Energy Council: London, UK, 2018. [Google Scholar]
- International Energy Agency. Real-World Policy Packages for Sustainable Energy Transitions-Shaping Energy Transition Policies to Fit National Objectives and Constraints; International Energy Agency: Paris, France, 2017. [Google Scholar]
- International Renewable Energy Agency IRENA. Power System Flexibility for the Energy Transition, Part 1: Overview for Policy Makers; International Renewable Energy Agency: Abu Dhabi, UAE, 2018. [Google Scholar]
- Hoggett, R.; Bolton, R.; Candelise, C.; Kern, F.; Mitchell, C.; Yan, J. Supply chains and energy security in a low carbon transition. Appl. Energy 2014, 123, 292–295. [Google Scholar] [CrossRef]
- International Energy Agency IEA World Energy Balances. 2018. Available online: https://webstore.iea.org/world-energy-balances-2018 (accessed on 30 July 2019).
- International Energy Agency. Energy and Climate Change: World Energy Outlook Special Report; International Energy Agency: Paris, France, 2015. [Google Scholar]
- Schröder, T.; Kuckshinrichs, W. Value of Lost Load: An Efficient Economic Indicator for Power Supply Security? A Literature Review. Front. Energy Res. 2015, 3, 55. [Google Scholar] [CrossRef]
- Shivakumar, A.; Welsch, M.; Taliotis, C.; Jakšić, D.; Baričević, T.; Howells, M.; Gupta, S.; Rogner, H. Valuing blackouts and lost leisure: Estimating electricity interruption costs for households across the European Union. Energy Res. Soc. Sci. 2017, 34, 39–48. [Google Scholar] [CrossRef]
- Yusta, J.M.; Correa, G.J.; Lacal-Arántegui, R. Methodologies and applications for critical infrastructure protection: State-of-the-art. Energy Policy 2011, 39, 6100–6119. [Google Scholar] [CrossRef]
- Cox, E. Opening the black box of energy security: A study of conceptions of electricity security in the United Kingdom. Energy Res. Soc. Sci. 2016, 21, 1–11. [Google Scholar] [CrossRef]
- Cherp, A.; Jewell, J. The concept of energy security: Beyond the four As. Energy Policy 2014, 75, 415–421. [Google Scholar] [CrossRef]
- Ang, B.W.; Choong, W.L.; Ng, T.S. Energy security: Definitions, dimensions and indexes. Renew. Sustain. Energy Rev. 2015, 42, 1077–1093. [Google Scholar] [CrossRef]
- Chester, L. Conceptualising energy security and making explicit its polysemic nature. Energy Policy 2010, 38, 887–895. [Google Scholar] [CrossRef]
- Cherchye, L.; Moesen, W.; Rogge, N.; Van Puyenbroeck, T. Constructing composite indicators with imprecise data: A proposal. Expert Syst. Appl. 2011, 38, 10940–10949. [Google Scholar] [CrossRef]
- Winzer, C. Conceptualizing energy security. Energy Policy 2012, 46, 36–48. [Google Scholar] [CrossRef]
- European Commission. Fourth Report on the State of the Energy Union; European Commission: Brussels, Belgium, 2019. [Google Scholar]
- The White House. National Security Strategy of the United States of America; The White House: Washington, DC, USA, 2017. [Google Scholar]
- National Development and Reform Commission. The 13th Five-Year Plan for Economic and Social Development of the People’s Republic of China; National Development and Reform Commission: Beijing, China, 2016. [Google Scholar]
- Jewell, J. The IEA Model of Short-Term Energy Security (Moses) Primary Energy Sources And Secondary Fuels. Int. Energy Agency 2011. Available online: https://www.iea.org/reports/the-iea-model-of-short-term-energy-security (accessed on 1 July 2020).
- Nepal, R.; Jamasb, T. Security of European electricity systems: Conceptualizing the assessment criteria and core indicators. Int. J. Crit. Infrastruct. Prot. 2013, 6, 182–196. [Google Scholar] [CrossRef]
- Kisel, E.; Hamburg, A.; Härm, M.; Leppiman, A.; Ots, M. Concept for Energy Security Matrix. Energy Policy 2016, 95, 1–9. [Google Scholar] [CrossRef]
- Fuentes, S.; Villafafila-Robles, R.; Olivella-Rosell, P. International Tendencies on Energy Security: A review on National Energy Policies in the Electrical Sector. Enerlac 2019, 3, 22–43. [Google Scholar]
- Fischer, W.; Hake, J.-F.; Kuckshinrichs, W.; Schröder, T.; Venghaus, S. German energy policy and the way to sustainability: Five controversial issues in the debate on the “Energiewende”. Energy 2016, 115, 1580–1591. [Google Scholar] [CrossRef]
- International Energy Agency World Final Energy Consumption. Available online: https://www.iea.org/Sankey/#?c=World&s=Finalconsumption (accessed on 27 November 2017).
- OECD. Handbook on Constructing Composite Indicators-Methodology and User Guide; OECD: Paris, France, 2008. [Google Scholar]
- Reddy, B.S.; Ulgiati, S. Energy Security and Development: The Global Context and Indian Perspectives; Springer: Berlin/Heidelberg, Germany; New York, NY, USA, 2015; ISBN 9788132220657. [Google Scholar]
- International Atomic Energy Agency. Energy Indicators for Sustainable Development: Guidelines and Methodologies; International Atomic Energy Agency: Viena, Austria, 2005. [Google Scholar]
- Narula, K.; Reddy, B.S. Three blind men and an elephant: The case of energy indices to measure energy security and energy sustainability. Energy 2015, 80, 148–158. [Google Scholar] [CrossRef]
- Martchamadol, J.; Kumar, S. An aggregated energy security performance indicator. Appl. Energy 2013, 653–670. [Google Scholar] [CrossRef]
- Månsson, A.; Johansson, B.; Nilsson, L.J. Assessing energy security: An overview of commonly used methodologies. Energy 2014, 73, 1–14. [Google Scholar] [CrossRef]
- Sovacool, B.K.; Mukherjee, I.; Drupady, I.M.; D’agostino, A.L.; Kuan, L. Evaluating energy security performance from 1990 to 2010 for eighteen countries. Energy 2011, 36, 5846–5853. [Google Scholar] [CrossRef]
- Chang, Y.; Yong, J. Differing perspectives of major oil firms on future energy developments: An illustrative framework. Energy Policy 2007, 35, 5466–5480. [Google Scholar] [CrossRef]
- Tongsopit, S.; Kittner, N.; Chang, Y.; Aksornkij, A.; Wangjiraniran, W. Energy security in ASEAN: A quantitative approach for sustainable energy policy. Energy Policy 2016, 90, 60–72. [Google Scholar] [CrossRef]
- Global Energy Institute. Index of U.S. Energy Security Risk; Global Energy Institute: Washington, DC, USA, 2017. [Google Scholar]
- Holley, C.; Lecavalier, E. Energy governance, energy security and environmental sustainability: A case study from Hong Kong. Energy Policy 2017, 108, 379–389. [Google Scholar] [CrossRef]
- China National Renewable Energy Centre. Energy Transition Trends 2019; China National Renewable Energy Centre: Beijing, China, 2019. [Google Scholar]
- International Energy Agency; International Renewable Energy Agency. Perspectives for the Energy Transition: Investment Needs for a Low Carbon Energy System; International Energy Agency: Paris, France, 2017. [Google Scholar]
- Institute for the 21st Century Energy. International Index of Energy Security Risk; Institute for the 21st Century Energy: Washington, DC, USA, 2016. [Google Scholar]
- Scheepers, M.; Seebregts, A.; de Jong, J.; Maters, H. EU Standards for Energy Security of Supply-Updates on the Crisis Capability Index and the Supply/Demand Index Quantification for EU-27. Available online: https://inis.iaea.org/search/searchsinglerecord.aspx?recordsFor=SingleRecord&RN=39001606 (accessed on 1 September 2019).
- Wiegers, M.A. Integracioón Energeética en el Cono Sur; Instituto Para La Integracioón De Ameérica Latina Y El Caribe, BID-INTAL: Buenos Aires, Argentina, 1996; ISBN 9789507380532. [Google Scholar]
- Abadie, F.; Lerner, E. Macroeconomic Sustainability of Energy Markets Regulated Through Incentives-The Case of Argentina. Available online: http://biblioteca.olade.org/opac-tmpl/Documentos/hm000020.pdf (accessed on 25 October 2019).
- OPEC. OPEC Annual Statistical Bulletin. Organ. Pet. Export. Ctries. 2019, 108, ISSN 0475-0608. [Google Scholar]
- Ministry of Energy and Mining Energy—2017. The Beginning of the Transformation; Ministry of Energy and Mining Energy: Buenos Aires, Argentina, 2017.
- CAMMESA. Informe Anual 2017 (2017 Annual Report); CAMMESA: Compañía Administradora del Mercado Mayorista Eléctrico S.A. (CAMMESA): Buenos Aires, Argentina, 2018. [Google Scholar]
- OLADE. Sistema de Información Energética de Latinoamérica y el Caribe. Available online: http://sielac.olade.org/ (accessed on 1 July 2020).
- IMF. World Economic Outlook-Growth Slowdown, Precarious Recovery; International Monetary Fund, Publication Services: Washington, DC, USA, 2019. [Google Scholar]
- OECD Real GDP Forecast. Available online: https://data.oecd.org/gdp/real-gdp-forecast.htm (accessed on 1 September 2019).
- Ministry of Energy and Mining. Renewable Energy Argentina-December 2016; Argentina Investment + Trade Promotion Agency Edificio: Buenos Aires, Argentina, 2016. [Google Scholar]
- Law 27191. Régimen de Fomento Nacional para el Uso de Fuentes Renovables de Energía Destinada a la Producción de Energía Eléctrica; Honorable Congreso de la Nación Argentina: Buenos Aires, Argentina, 2015. [Google Scholar]
- Law 27424. Régimen de Fomento a la Generación Distribuida de Energía Renovable Integrada a la Red Eléctrica Pub; Honorable Congreso de la Nación Argentina: Buenos Aires, Argentina, 2017. [Google Scholar]
- The World Bank Worldwide Governance Indicators. Available online: https://databank.worldbank.org/data/source/worldwide-governance-indicators/Type/TABLE/preview/on (accessed on 13 June 2018).
- World Economic Forum. The Global Competitiveness Report 2017–2018. 2019. Available online: http://www3.weforum.org/docs/WEF_TheGlobalCompetitivenessReport2019.pdf (accessed on 1 September 2019).
- Argentine Republic. Intended Nationally Determined Contributions; Argentine Republic: Buenos Aires, Argentina, 2015. [Google Scholar]
- The World Bank. Ease of Doing Business. Available online: https://data.worldbank.org/indicator/ic.bus.ease.xq (accessed on 1 July 2020).


| Author/Institution | Name of Indicator/Index | Energy Source | Dimensions | No. of Indicators |
|---|---|---|---|---|
| Asia Pacific Energy Research Centre | Energy Security Indicators | Primary Energy | Availability; accessibility; acceptability; affordability | 16 |
| International Atomic Energy Agency | Energy Indicators for Sustainable Development | Primary Energy | Social; economic; environmental | 31 |
| World Energy Council | World Energy Trilemma Index | Primary Energy | Energy security; energy equity; environmental sustainability | 35 |
| Global Energy Institute | International Index of Energy Security Risk | Primary Energy | Global fuels; fuel imports; energy expenditures; price and market volatility; energy use intensity; electric power sector; transportations sector; environmental; R&D | 29 |
| Sovacool and Mukherjee | Energy Security Index | Primary Energy | Availability; affordability; technology development and efficiency; environmental sustainability; regulation and governance | 20 |
| Martchamadol and Kumar | Aggregated Energy Security Performance Indicator | Primary Energy | Social; economic; environmental | 25 |
| Kruyt et al. | Security of Supply Indicators | Primary Energy | Availability; accessibility; acceptability; affordability | 22 |
| Scheepers et al. | Supply/Demand index | Primary Energy | Essential energy demand needs; primary energy sources; energy conversions and transport | 19 |
| Jansen et al. | Long-term energy security indicators | Primary Energy | Diversification of energy sources in the energy supply; diversification of imports with respect to imported energy sources; long-term political stability in import regions; the resource base in regions of origin | 4 |
| Dimension | Category | ID | Indicator | 2002 | 2017 | Change |
|---|---|---|---|---|---|---|
| Availability | Fuel reserves | A1.1 | Oil reserves-to-production ratio | 0.41 | 0.47 | 16.01% |
| A1.2 | Natural gas reserves-to-production ratio | 0.65 | 0.54 | −17.07% | ||
| A1.3 | Coal reserves-to-production ratio | 1.00 | 1.00 | 0.00% | ||
| Fuel diversity | A2.1 | Diversification of energy sources in electrical energy demand | 0.44 | 0.37 | −15.27% | |
| A2.2 | Diversification of energy sources in the electrical installed capacity | 0.38 | 0.40 | 5.33% | ||
| Energy dependency | A3.1 | Net electrical energy import dependency | 0.90 | 0.93 | 3.27% | |
| A3.2 | Diversification of electricity imports | 0.31 | 0.71 | 128.19% | ||
| A3.3 | Long-term political stability in import regions | 0.21 | 0.55 | 157.38% | ||
| Renewable energy potential | A4.1 | Solar resource potential for power generation relative to electricity production | 1.00 | 1.00 | 0.00% | |
| A4.2 | Wind resource potential for power generation relative to electricity production | 1.00 | 1.00 | 0.00% | ||
| Infrastructure | Adequacy | I1.1 | Power generation adequacy | 1.00 | 1.00 | 0.00% |
| I1.2 | Electricity network adequacy | 0.71 | 0.87 | 21.93% | ||
| I1.3 | Access to electricity (% of population) | 0.96 | 0.99 | 2.79% | ||
| Efficiency | I2.1 | Efficiency of power generation from fossil fuels | 0.65 | 0.68 | 4.62% | |
| I2.2 | Renewable energy capacity factor | 0.36 | 0.42 | 16.09% | ||
| I2.3 | Efficiency of electrical networks | 0.85 | 0.85 | 0.14% | ||
| Flexibility | I3.1 | Pumped storage | 1.00 | 1.00 | 0.00% | |
| I3.2 | Power-to-X | 0.00 | 0.27 | 100.00% | ||
| I3.3 | Gas power plants | 1.00 | 1.00 | 0.00% | ||
| I3.4 | Distributed generation | 0.00 | 0.18 | 100.00% | ||
| I3.5 | International interconnections | 1.00 | 1.00 | 0.00% | ||
| Economy | Energy consumption | EC1.1 | Electrical energy use per total primary energy consumption | 1.00 | 1.00 | 0.00% |
| Energy expenditures | EC2.1 | Electrical energy expenditures per capita | 1.00 | 1.00 | 0.00% | |
| EC2.2 | Electrical energy expenditures per GDP | 1.00 | 1.00 | 0.00% | ||
| EC2.3 | Retail electricity prices | 0.55 | 0.66 | 19.24% | ||
| EC2.4 | Electrical energy prices volatility | 0.34 | 0.96 | 180.36% | ||
| Energy intensities | EC3.1 | Electrical energy intensity | 1.00 | 1.00 | 0.00% | |
| EC3.2 | Industrial energy intensities | 1.00 | 1.00 | 0.00% | ||
| EC3.3 | Agricultural energy intensities | 1.00 | 0.56 | −43.54% | ||
| EC3.4 | Service/commercial energy intensities | 1.00 | 1.00 | 0.00% | ||
| EC3.5 | Household energy intensities | 1.00 | 0.55 | −45.07% | ||
| EC3.6 | Transport energy intensities | 1.00 | 1.00 | 0.00% | ||
| EC3.7 | Other activities | 1.00 | 1.00 | 0.00% | ||
| Environment | Electricity shares | EN1.1 | Non-carbon electrical energy production share | 0.56 | 0.35 | −37.47% |
| EN1.2 | Non-carbon installed capacity share | 0.45 | 0.37 | −17.92% | ||
| Climate change | EN2.1 | Electrical-energy-related GHG emissions per capita | 1.00 | 1.00 | −0.06% 1 | |
| EN2.2 | Electrical-energy-related GHG emissions per GDP | 1.00 | 1.00 | 0.00% | ||
| Governance | Government | G1.1 | Government effectiveness | 0.47 | 0.60 | 25.64% |
| G1.2 | Political stability and absence of violence/terrorism | 0.22 | 0.53 | 140.00% | ||
| G1.3 | Regulatory quality | 0.19 | 0.41 | 113.26% | ||
| Business | G2.1 | Competitiveness index | 0.31 | 0.57 | 87.43% | |
| G2.2 | Ease of doing business index | 0.58 | 0.58 | 0.22% | ||
| R+D+i | Investment | R1.1 | Gross domestic expenditure on R&D | 0.09 | 0.13 | 47.28% |
| R1.2 | Researchers per million inhabitants (per 1000 employed) | 0.12 | 0.18 | 49.30% | ||
| Innovation | R2.1 | Triadic patent families | 0.00 | 0.00 | 17.78% |
| ID | Category | 2002 | 2017 | Change | ID | Dimension | Weight | 2002 | 2017 | Change | Score 2002 | Score 2017 |
|---|---|---|---|---|---|---|---|---|---|---|---|---|
| A1 | Fuel reserves | 0.26 | 0.25 | −3.79% | A | Availability | 0.22 | 0.00 | 0.01 | 420.73% | 0.29 | 0.02 |
| A2 | Fuel diversity | 0.17 | 0.15 | −10.75% | ||||||||
| A3 | Energy dependency | 0.06 | 0.36 | 506.48% | ||||||||
| A4 | Renewable energy potential | 1.00 | 1.00 | 0.00% | ||||||||
| I1 | Adequacy | 0.68 | 0.86 | 25.33% | I | Infrastructure | 0.24 | 0.14 | 0.21 | 52.42% | ||
| I2 | Efficiency | 0.20 | 0.24 | 21.62% | ||||||||
| I3 | Flexibility | 0.00 | 0.05 | 100.00% | ||||||||
| EC1 | Energy consumption | 1.00 | 1.00 | 0.00% | EC | Economy | 0.27 | 1.00 | 0.02 | −98.36% | ||
| EC2 | Energy expenditures | 1.00 | 0.05 | −94.71% | ||||||||
| EC3 | Energy intensities | 1.00 | 0.31 | −68.98% | ||||||||
| EN1 | Electricity shares | 0.25 | 0.13 | −48.68% | EN | Environment | 0.09 | 0.25 | 0.13 | −48.71% | ||
| EN2 | Climate change | 1.00 | 1.00 | −0.06% | ||||||||
| G1 | Government | 0.02 | 0.13 | 543.06% | G | Governance | 0.11 | 0.00 | 0.04 | 1108.02% | ||
| G2 | Business | 0.18 | 0.33 | 87.86% | ||||||||
| R1 | Investment | 0.01 | 0.02 | 119.88% | R | R+D+i | 0.07 | 0.00 | 0.00 | 158.99% | ||
| R2 | Innovation | 0.00 | 0.00 | 17.78% |
© 2020 by the authors. Licensee MDPI, Basel, Switzerland. This article is an open access article distributed under the terms and conditions of the Creative Commons Attribution (CC BY) license (http://creativecommons.org/licenses/by/4.0/).
Share and Cite
Fuentes, S.; Villafafila-Robles, R.; Lerner, E. Composed Index for the Evaluation of the Energy Security of Power Systems: Application to the Case of Argentina. Energies 2020, 13, 3998. https://doi.org/10.3390/en13153998
Fuentes S, Villafafila-Robles R, Lerner E. Composed Index for the Evaluation of the Energy Security of Power Systems: Application to the Case of Argentina. Energies. 2020; 13(15):3998. https://doi.org/10.3390/en13153998
Chicago/Turabian StyleFuentes, Sergio, Roberto Villafafila-Robles, and Eduardo Lerner. 2020. "Composed Index for the Evaluation of the Energy Security of Power Systems: Application to the Case of Argentina" Energies 13, no. 15: 3998. https://doi.org/10.3390/en13153998
APA StyleFuentes, S., Villafafila-Robles, R., & Lerner, E. (2020). Composed Index for the Evaluation of the Energy Security of Power Systems: Application to the Case of Argentina. Energies, 13(15), 3998. https://doi.org/10.3390/en13153998