Article

Thermogravimetric Kinetics of Selected Energy Crops Pyrolysis

by
Magdalena Matusiak
*,
Radosław Ślęzak
and
Stanisław Ledakowicz
Department of Bioprocess Engineering, Faculty of Process and Environmental Engineering, Lodz University of Technology, Wólczańska 213 str., 90-924 Lodz, Poland
*
Author to whom correspondence should be addressed.
Energies 2020, 13(15), 3977; https://doi.org/10.3390/en13153977
Submission received: 4 June 2020 / Revised: 13 July 2020 / Accepted: 21 July 2020 / Published: 2 August 2020
(This article belongs to the Collection Feature Papers in Bio-Energy)

Abstract

:
The main purpose of this paper was to compare the pyrolysis kinetics of three types of energy crops: Miscanthus giganteus, Sida hermaphrodita, and Sorghum Moench. Studies were conducted in thermobalance. Feedstock samples were heated up from ambient temperature to 600 °C under an inert argon atmosphere. Three heating rates of β = 5, 10, and 20 °C/min were applied. Reactions occurring in the given temperature ranges were grouped together into so-called lumps identified by the deconvolution of derivative thermogravimetry (DTG) curves that corresponded to biomass compositions (hemicellulose, cellulose, and lignin). For the estimation of the activation energy and pre-exponential factor, the Friedman and Ozawa–Flynn–Wall methods were used. The final kinetic parameters were determined by nonlinear regression assuming that thermal decomposition proceeded via three parallel independent reactions of the nth order. The activation energy of hemicellulose, cellulose and lignin was determined to be in the range of 92.9–97.7, 190.1–192.5, and 170–175.2 kJ/mol, respectively. The reaction order was in the range of 3.35–3.99 for hemicellulose, 1.38–1.93 for cellulose, and 3.97–3.99 for lignin. The obtained results allow us to estimate the pyrolytic potential of energy crops selected for this study, and can be used in designing efficient pyrolizers for these materials.

1. Introduction

Continuous technological and industrial development contributes to the growth of global energy demand. Currently, over 80% of the world’s energy is produced from nonrenewable sources, which leads to the depletion of energy resources and the increase in environmental pollution [1,2]. In order to prevent this, it is necessary to increase energy production from renewable energy sources. Among renewable energy sources, biomass is a very promising option, because absorption of CO2 during growth makes the biomass less harmful to the environment than fossil fuels [3]. Biomass is a widely available feedstock for energy production. It can be obtained from many sources, such as from forestry, agriculture, industry, and trade [1]. Resources of biomass comprise numerous natural and derived materials, e.g., municipal solid waste, sewage, animal residue, agricultural crops, and forest wood [4]. Energy from biomass can be generated in the form of electrical power, thermal energy, flammable products, and useful chemicals. Energy crops are fast-growing biomass aimed to generate energy or produce biofuel. Among energy crops, Miscanthus giganteus, Sida hermaphrodita, and Sorghum Moench have high potential for thermochemical processes due to their high calorific value and high cellulose content [5,6,7,8]. Furthermore, the energy crops selected for this study have high resistance to pests and diseases and are rather tolerant of temporary droughts [7,8]. Miscanthus giganteus and Sida hermaphrodita, as perennial crops, do not require intensive workload and provide continuous ground cover for 15–20 years [8,9]. Due to simple cultivation and harvesting, Miscanthus giganteus, Sida hermaphrodita, and Sorghum Moench have high biomass yields on the level of 21–25, 20–25, and 15–18 t/ha, respectively [9]. They can be effectively cultivated under Polish climatic conditions. Among European countries, Poland has the largest area of Sida hermaphrodita plantations [8]. There are many ways to produce fuel from biomass, for example, mechanical (e.g., pelleting, briquetting), resulting in the production of solid fuel for combustion. Liquid and gaseous fuels can be obtained from biomass by biological processes (e.g., alcohol and/or methane fermentation). In turn, thermochemical processes (e.g., combustion, pyrolysis, gasification) result in the production of heat or solid and gaseous fuel [1]. Pyrolysis is the most attractive option to produce energy from biomass, because it makes it possible to use a wide range of biomass feedstocks, even though this is less desirable in other methods [10]. Pyrolysis is the thermochemical decomposition of biomass by the action of heat in an inert atmosphere into a range of valuable products such as tar, char, and flammable gases. During the primary process (char formation, depolymerization, fragmentation), secondary reactions (additional conversions of unstable volatile compounds) occur. Tar is a mixture of complex hydrocarbons with large amounts of oxygen and water that is formed as the result of depolymerization and fragmentation of biomass compounds. Char contains mainly carbon, but it can contain some hydrogen, oxygen, and inorganic ash, and is formed as a result of cracking reactions. Flammable gases (e.g., H2, CO, CO2, CH4, C2H2, C2H4, C2H6, and water vapor) are created in both the primary decomposition and secondary cracking of vapors [11,12]. Tar and gases produced during pyrolysis are mainly used to produce chemicals or as fuel [13]. Char can be used in various major areas such as soil improvement and energy production [14]. The most important factors that affect the yields of pyrolysis products are the design of the pyrolizer, biomass composition (hemicellulose, cellulose, and lignin content), and operating parameters such as heating rate, pyrolysis temperature, residence time in the reaction zone, and the particle size of the substrate [11,12,13]. On the basis of heating rate, pyrolysis can be classified as slow (heating rate of 0.1–0.8 °C/s) and fast (heating rate of 10–200 °C/s) [10,11]. In order to maximize the production of charcoal, slow pyrolysis is applied. The slow pyrolysis process is advantageous due to the small amount of tar formed [15], which is a highly oxygenated and complexed oil showing physicochemical instability [16].
The most widely used technique to analyze the slow-pyrolysis process is thermogravimetry (TG). It is a thermal analytical technique that allows to measure changes in the weight of feedstock as a function of time or temperature in a controlled atmosphere [17,18]. Thermogravimetric measurements can be performed by isothermal, semi-isothermal, or non-isothermal methods. The non-isothermal method is the most attractive option because it is easier to carry out the process at a constant heating rate than to keep an environment at a constant temperature [6,18]. TG analysis provides information that allows researchers, among other things, to determine the initial and final temperatures of decomposition, or the pyrolysis kinetics [19,20]. The study of kinetics is necessary to provide information about the behavior of thermolysis, which is crucial to optimize the process parameters and design necessary equipment [11,21]. Kinetics analysis is expected to determine three kinetic parameters, also called the “kinetic triplet”: activation energy, pre-exponential factor, and the reaction model [21]. For the analysis of biomass–pyrolysis kinetics, we can use three kinds of kinetic method: model fitting, isoconversional, and nonlinear regression [21]. A model giving a satisfactory fit is selected as the appropriate model for the determination of the kinetic parameters [11,22]. In the case of model fitting, pyrolysis is described by a one-step reaction using TG data. In this model, it is assumed that the apparent activation energy remains constant through the whole process. Due to their capability to directly determine the kinetic parameters, model-fitting methods are commonly used [21]. The limitation for the use of these methods is that they are more appropriate for a one-step reaction mechanism [23]. In the case of isoconversional methods, the kinetic parameters at each conversion degree (αi) of a particular heating rate are constant. Activation energy can be estimated without prior knowledge of the reaction model [21,23]. The isoconversional method provides information about predicted kinetic parameters, the mechanism of the thermal degradation, and the type of reaction that occurs during the process (single or multiple reactions) [23]. Isoconversional methods are very popular for evaluating the activation energy of biomass pyrolysis, e.g., Saha et al. [24] found a good estimate for the activation energy of manure-derived hydrochar pyrolysis by Kissinger’s method. For complex processes that run in multiple stages, the nonlinear-regression method is the most appropriate, because it allows one to directly fit the model to the experiment data. In this method, all points on the TG or derivative TG (DTG) curve are used [21].
There are many studies on the kinetics of lignocellulosic biomass pyrolysis in which the reaction mechanisms and general kinetic parameters are determined without examining the kinetics of biomass pseudocomponents [21,22,25,26]. Some authors determined the kinetic parameters of pseudocomponents of lignocellulosic biomass: hemicellulose, cellulose, and lignin [19,23,27]. There are also studies on selected hemicellulose, cellulose, and lignin [28,29]. Among the energy crops selected for this study, Miscanthus giganteus is the best-described in the literature. A kinetic study of Miscanthus giganteus thermal decomposition was described in the literature using various methods, e.g., linear-regression analysis of the half, first, and second order [30], the Friedman method [6,31], the Kissinger–Akahira–Sunose, Ozawa–Flynn–Wall, and Vyazovkin methods [6], and the Coats and Redfern integral method [31]. Some authors characterized the pyrolysis behavior of the cellulose, hemicellulose, and lignin fractions of Miscanthus giganteus, e.g., through the Ozawa–Flynn–Wall method and multivariate nonlinear-regression analysis [5], by independent parallel first-order-reactions model [32] and by the three-independent-parallel-reactions model [33]. Only a few papers reported on Sorghum Moench thermal decomposition, e.g., the kinetic parameters of Sorghum Moench pyrolysis were determined via the Kissinger–Akahira–Sunose and Flynn–Wall–Ozawa methods [34], Ozawa and Starink method [35], and the independent-parallel-reactions model [18,35]. The pyrolysis process of Sida hermaphrodita was studied by Magdziarz et al. [36], but they did not study the kinetics of the process.
Miscanthus giganteus, Sida hermaphrodita, and Sorghum Moench are promising feedstocks for the pyrolysis process with great potential for growth in Poland, and so detailed studies on their thermal decomposition are required. Until now, a comparative study of the energy crops selected for this study has not been performed. Additionally, there is little research in the literature on the kinetics of Sorghum Moench pyrolysis, whereas a kinetic study of Sida hermaphrodita has not been conducted. Thus, the purpose of this work was to provide information about the kinetic parameters of the thermal decomposition of the selected energy crops by nonlinear regression. A comparative evaluation of kinetic parameters enables us to better understand the pyrolysis process, and design an efficient pyrolizer for energy crops. The information presented in this study is useful for increasing the production of energy from renewable sources.

2. Materials and Methods

2.1. Raw Materials

Three energy crops, namely, Miscanthus giganteus, Sida hermaphrodita and Sorghum Moench, were used as the raw material in this study. Energy crops were collected in August 2017 from the Institute of Soil Science and Plant Cultivation, State Research Institute in Puławy, Poland. The representativeness of the samples was reached by taking in total 50 kg of the energy crop from eight different places. The plants were first dried at 105 °C to a constant weight and then ground in a Pulverisette 15 mill Fritzsch with a 0.25 mm sieve. Proximate and ultimate analyses of the energy crops are presented in Table 1.

2.2. Experiment Procedure

Experiments were performed in a Mettler-Toledo TGA/SDTA851 LF thermobalance. In order to restrict the effect of secondary reactions and heat-transfer limitation during the pyrolysis process, it is recommended to apply a small-mass sample and low heating rate [13]. Hence, the slow-pyrolysis experiments were carried out on a sample of 20 ± 0.1 mg of dried biomass. Samples were placed into aluminum pans (150 µL volume) without lids. After placing the sample in the oven, we waited for 30 min to remove the oxygen from the oven by flowing argon gas (with a purity of 99.999%) with a rate 100 NmL/min. Later, the energy crops were heated up from 30 to 600 °C under an inert atmosphere with three heating rates (5, 10, and 20 °C/min). Sample temperature was measured by an S type (Pt-Rh10/Pt) thermocouple placed directly under the sample holder. Indium and aluminum were used to calibrate the furnace. Experiments were performed in triplicate, and the arithmetic average was adopted for data interpretation. Experiment error of the mass-loss measurement was within ±2.0%, and elemental composition was within ±3.0%.

2.3. Analytical Methods

Moisture, volatiles, fixed carbon, and ash contents were determined by TG analysis performed in a Mettler-Toledo TGA/SDTA851 LF thermobalance. Total carbon, hydrogen, nitrogen, and sulfur contents were determined by elemental analyzer CE Instruments, NA 2500. The deconvolution of the DTG curves was carried out using Netzsch Peak Separation software. Information obtained from the pyrolysis of pure hemicellulose (in the form of xylan), cellulose, and lignin was used as the initial parameter during the deconvolution of the DTG curve. The higher heating value (HHV) was determined by a calorimetric method using a PRECYZJA-BIT Calorimeter KL-12Mn. Obtained HHV values did not significantly differ due to the similar CHNS/O composition of the energy crops selected for this study. The HHV results are in good agreement with previously reported values [6,8,35]. Calculations of the kinetic parameters were performed by using Netzsch-Thermokinetics software. Previously obtained parameters of the isoconversional kinetic method were applied in the software as initial parameters for the nonlinear-regression model. The system of differential equations was solved using the 5th-order Runge–Kutta method. The parameters of the model (fraction of the reaction in total mass loss, reaction orders, and the constants in the Arrhenius equation) were calculated from the Levenberg–Marquardt optimization procedure minimizing the error between experiment and calculated data (least-squares method). One-way ANOVA was performed using OrginPro software.

3. Results and Discussion

3.1. TG Results

One-way ANOVA (at the level of 0.05) indicated significant differences between data TG for Miscanthus giganteus, Sida hermaphrodita, and Sorghum Moench. Figure 1 represents the TG and DTG curves for the thermal degradation of Miscanthus giganteus, Sida hermaphrodita, and Sorghum Moench at a heating rate of β = 10 °C/min. As is seen from DTG curves, maximal decomposition intensity for energy crops occurred at temperatures of 334 °C for Miscanthus giganteus, 344 °C for Sida hermaphrodita, and 330 °C for Sorghum Moench. The highest volatile amount was released between 250 and 370 °C. Total weight loss during the pyrolysis of Miscanthus giganteus, Sida hermaphrodita, and Sorghum Moench was 74.12, 76.82, and 70.90 wt%, respectively.
Differences in the position of the maximal decomposition peaks on the DTG curves might have been caused by the interaction of hemicellulose, cellulose, and lignin. The influence of component interaction on biomass pyrolysis is very complex and even slight differences in components fractions can significantly affect pyrolysis behavior. An increase in the cellulose-to-lignin ratio caused the DTG peaks to shift towards higher temperatures [37]. Among the energy crops selected for this study, Sida hermaphrodita had the higher cellulose-to-lignin ratio (3:1), which shifted the position of the maximal decomposition peak on the DTG curve towards a higher temperature in comparison to Miscanthus giganteus and Sorghum Moench, with a cellulose-to-lignin ratio of 2.14:1 and 1.9:1, respectively. Slight differences in total weight loss might have been affected by the composition of the energy crops. Among the selected substrates, Sorghum Moench had the largest lignin content. Lignin was the most thermally resistant biomass component due to its complex structure and high stability [38]. Therefore, the total weight loss was the lowest for Sorghum Moench. In turn, the highest total weight loss occurred for Sida hermaphrodita, which has the smallest lignin content. Burhenne et al. [39] also observed that biomass with higher lignin content requires higher temperature to decompose. Ash content in biomass can affect the total weight loss during pyrolysis. Sorghum Moench, from the selected substrates, had the highest ash content (Table 1). However, various minerals contained in the ash have low impact on the pyrolysis process below 600 °C [13]. The investigated energy crops had a very similar moisture content; thus, its influence on heat transfer during pyrolysis, which can significantly affect product distribution, was negligible [40]. The DTG profiles suggested that the pyrolysis of the selected energy crops was characterized by a three-stage reaction. Decomposition peaks of hemicellulose, cellulose, and lignin overlapped, so it was difficult to distinguish the exact temperature ranges of biomass-pseudocomponent degradation on the basis of the DTG curves.
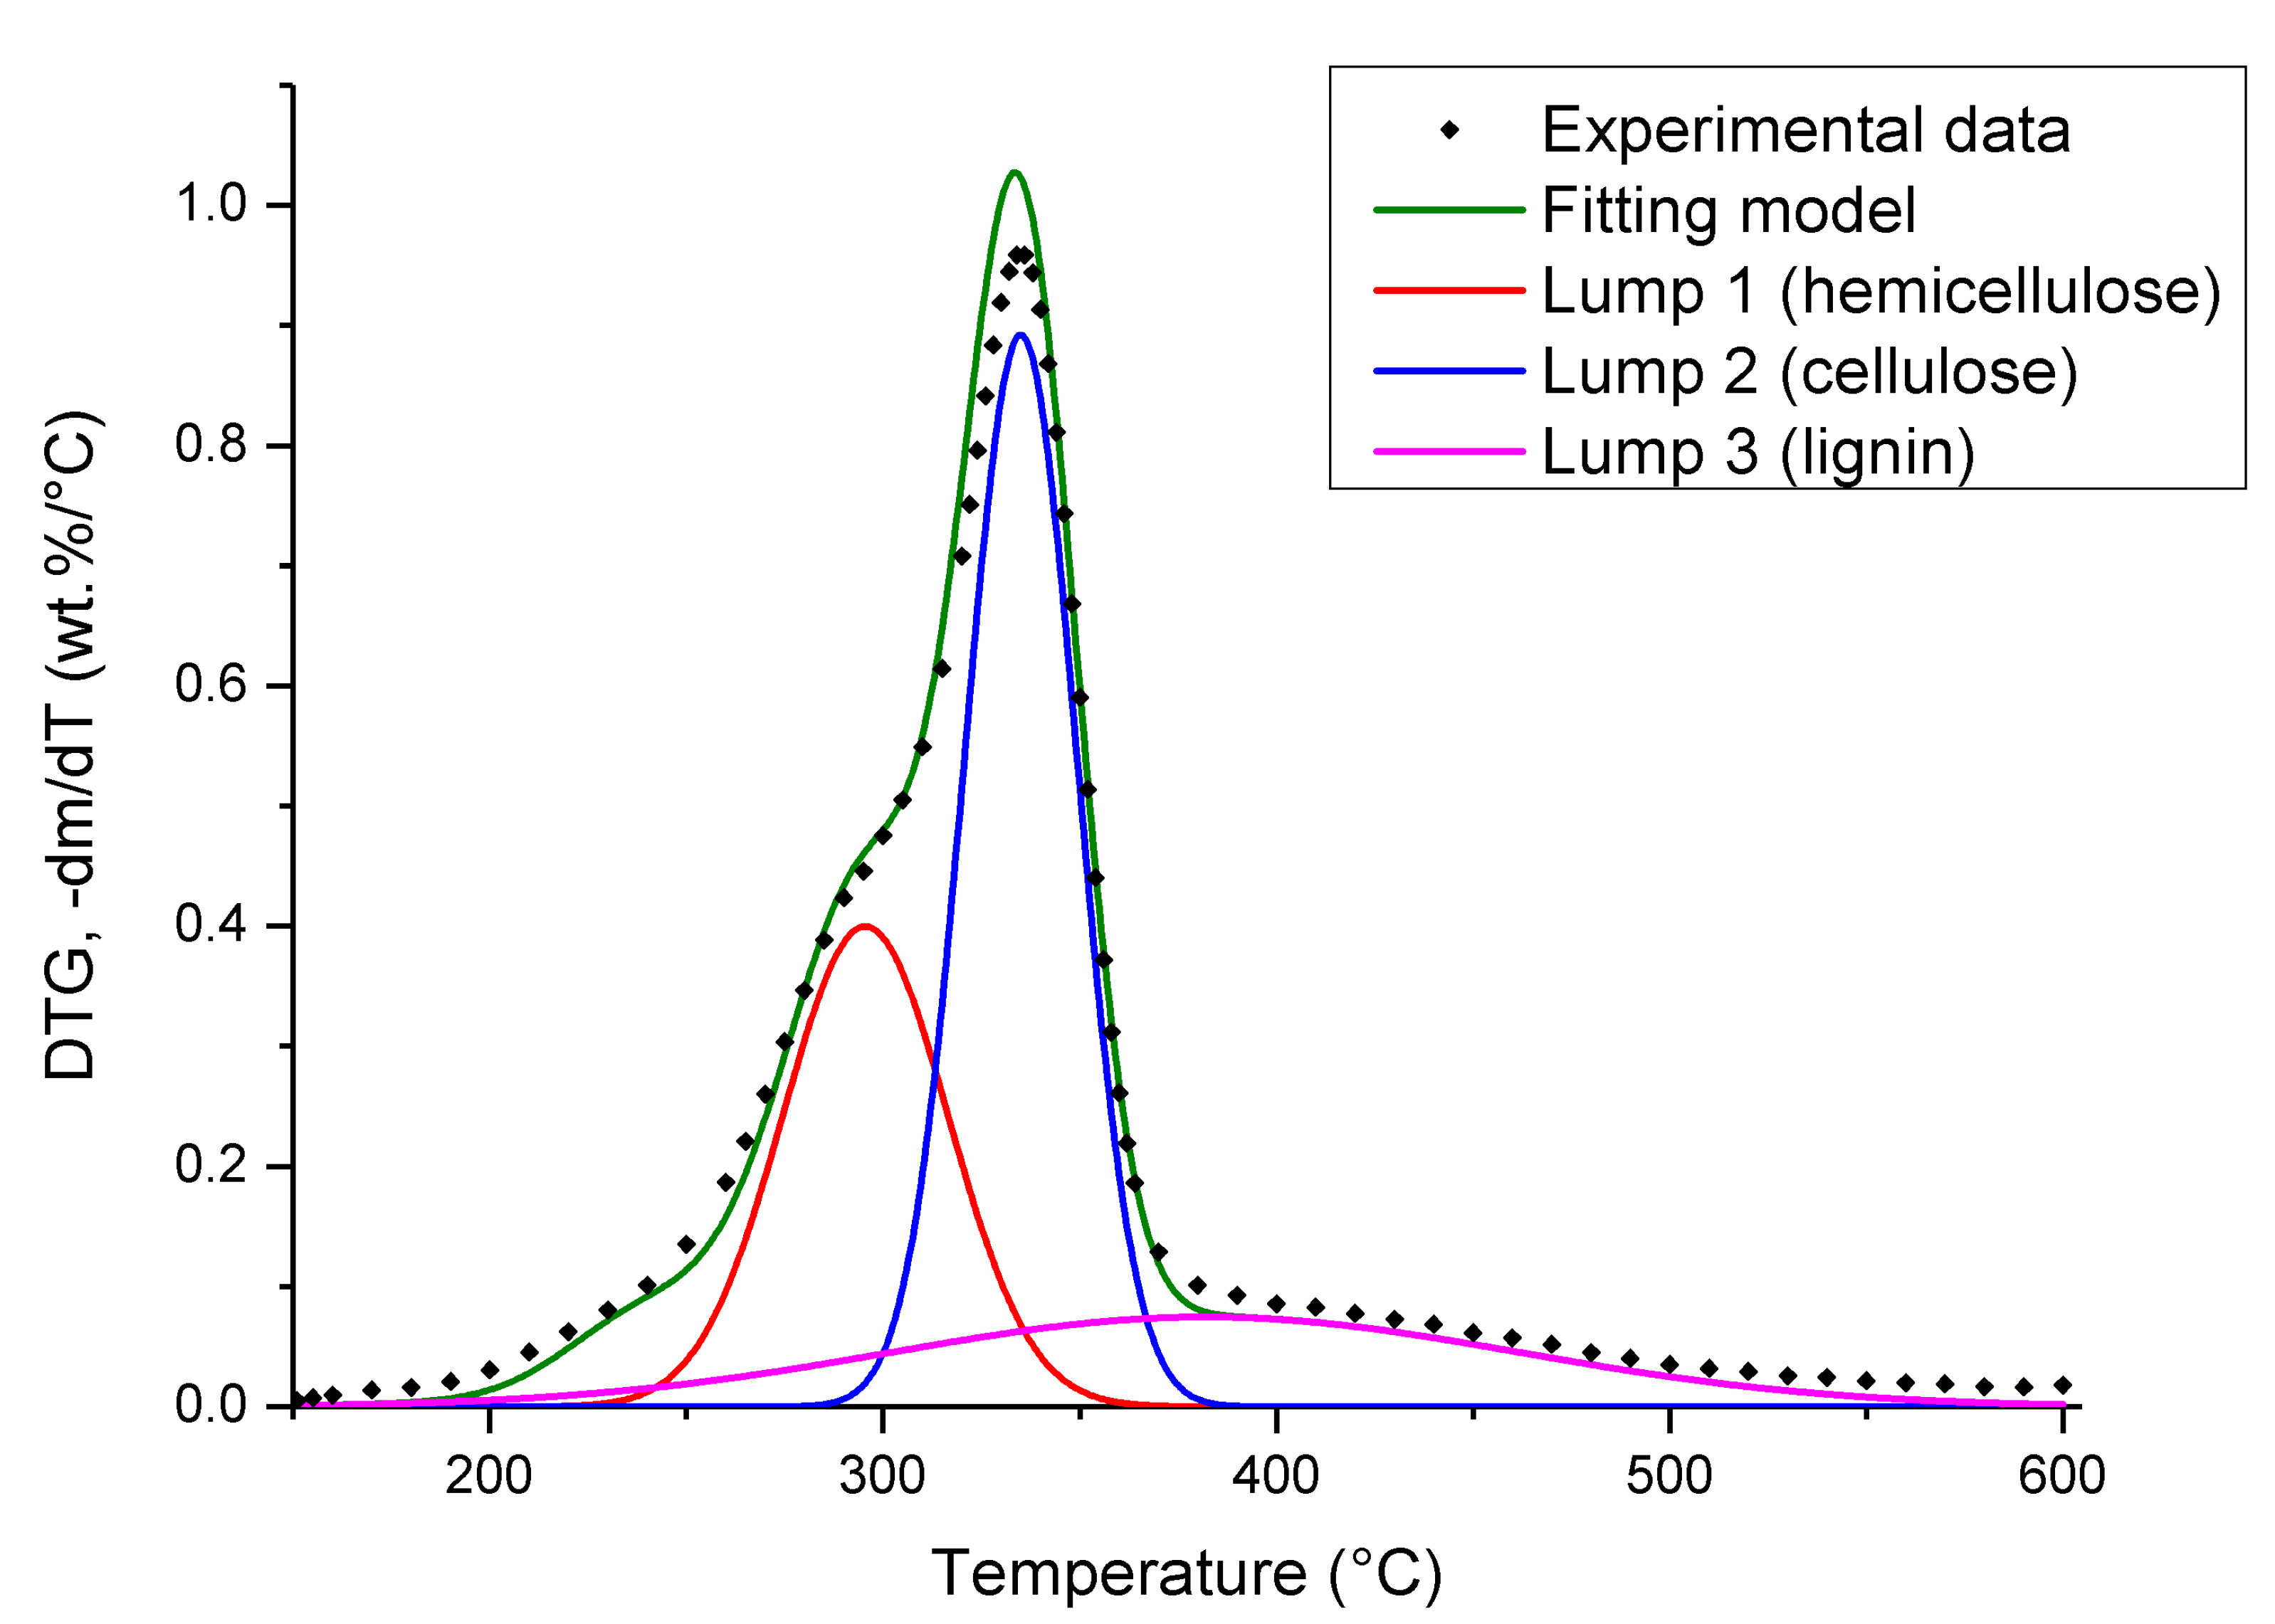
The pyrolysis process of the energy crops involved a multistep-reaction mechanism; therefore, the model-fitting method cannot be used directly. Energy crops are mainly composed of hemicellulose, cellulose, and lignin, which decompose in temperature ranges of 250–350, 325–400, and 200–600 °C, respectively [38]. In order to simplify kinetic analysis and determine the fractions of single reactions in total mass loss, we carried out the deconvolution of DTG curves for three peaks responsible for the degradation of these three constituents. The DTG curves obtained during Miscanthus giganteus, Sida hermaphrodita and Sorghum Moench pyrolysis at a heating rate of β = 10 °C/min were deconvoluted into three pseudocomponents assuming Gaussian distribution. Figure 2 represents the results of the deconvolution of the DTG curve for Miscanthus giganteus. Each peak was described by position (°C), amplitude (wt%/°C), full width at half maximum (°C), and area (wt%) (Table 2).
According to the deconvolution results, the degradation of hemicellulose occurs in the range of 230–360 °C, with a maximal peak around 296 °C. The degradation of cellulose takes place in the range of 285–380 °C with a maximal peak at 335 °C. In turn, the thermal degradation of lignin is slow and occurs in the range of temperature of 200–600 °C, with a maximal peak at 381 °C. These results are in good agreement with previous studies conducted by Ali et al. [23], and Rueda-Ordóñez et al. [27]. The areas of peaks (lumps) 1, 2, and 3 stand for the hemicellulose, cellulose, and lignin fractions, respectively. The fractions of hemicellulose, cellulose, and lignin determined from the peak area are very similar to the composition in Miscanthus giganteus, Sida hermaphrodita and Sorghum Moench, determined in other studies [5,41,42]. The experiment error of hemicellulose, cellulose, and lignin fraction obtained from the deconvolution method was within ±1.49, 1.85, and 0.5, respectively. The determined parameters of the thermal decomposition of hemicellulose, cellulose, and lignin differed for each energy crop due to the overlap of temperature ranges and interactions between biomass components. Lignin has a significant influence on hemicellulose pyrolysis in low-temperature ranges, and lignin and hemicellulose have a joint influence on cellulose pyrolysis. The decomposition of lignin at low temperatures increases the rate of hemicellulose pyrolysis. The melted organic products of hemicellulose decomposition can cover the cellulose surface and, as a result, reduce the volatile amount from cellulose pyrolysis. Interactions between cellulose and lignin lead to an increase in tar yield from the decomposition of cellulose, and a decrease in char formation from lignin [37]. In addition to hemicellulose, cellulose, and lignin, biomass also contains a small amount of extractives composed of nonstructural components, which include waxes, fats, resins, tannins, sugars, starches, and pigments. Due to high volatility, the extractives have an effect on biomass thermal decomposition. Extract content in biomass is very small; thus, their influence is usually negligible. The pyrolysis of biomass extractives, which occurs in the temperature range of 130–550 °C, could affect the results by contributing to the peaks of hemicellulose, cellulose, and lignin thermal degradation [37]. Pyrolysis of biomass is also affected by secondary reactions. There are similarities in products obtained from primary and secondary reactions; hence, it is difficult to determine which pathway is mainly responsible for the formation of products, which creates further complications in determining the kinetic parameters of pyrolysis process. However, for pyrolysis temperatures below 600 °C, the influence of the cracking of volatile compounds on product yields becomes insignificant in thermobalance [12]. In this study, for the experiments performed in thermobalance with a small sample mass, low heating rate, short residence time of gases due to their immediate removal from the furnace, and pyrolysis temperature of 600 °C, the activity of secondary reactions was negligible [12,13].

3.2. Kinetic Analysis

In order to estimate the kinetic parameters of biomass pyrolysis under nonisothermal conditions, a minimum of three heating rates are required [44]. In this study, for each energy crop, three heating rates of β = 5, 10, and 20 °C/min were applied.

3.2.1. Isoconversional Kinetic Method

In order to describe the kinetic parameters, a simplified single-step global reaction mechanism was assumed. In this model, the presence of ash and moisture was neglected:
Biomass → char + volatile.
The reaction mechanism is expressed by Equation (2) according to Arrhenius’ law:
d α d t = k 0 exp ( E a R T ) f ( α ) ,
where α is the degree of conversion (-), t is the pyrolysis time (s), k0 is a pre-exponential factor (1/s), Ea denotes the activation energy (kJ/mol), R is the universal gas constant (8.314 J/mol⋅K), T stands for furnace temperature (K), and f(α) is the reaction model that represents the reaction mechanism. The degree of conversion α was defined by Equation (3):
α = m 0 m i m 0 m f
where m0, mi, and mf are the initial (g), instantaneous (g), and final sample mass (g), respectively.
Activation energy is the minimal amount of energy required for a reaction to occur. If the activation energy of a specific reaction is very high, this means that the reaction is difficult to perform and requires a lot of energy to initiate. The pre-exponential factor is the value that the specific rate constant would have if the activation energy was equal to zero [45]. Therefore, reactions with a lower value of activation energy and a higher value of pre-exponential factor are the most advantageous. For the estimation of the activation energy and pre-exponential factor as a function of conversion degree, two isoconversional kinetic methods were applied: Friedman’s analysis and the Ozawa–Flynn–Wall technique. Those two methods are useful tools in seeing if the process proceeds via single or multiple reactions. If the values of activation energy and pre-exponential factor obtained by these methods are not constant as a function of conversion degree in its entire range, this means that the process should be described by multiple reactions [44]. In order to determine kinetic parameters by the isoconversional method, the assumption of the known reaction model f(α) is necessary. Netzsch-Thermokinetics software uses the first-order reaction model, expressed by Equation (4):
f ( α ) = 1 α .  
Friedman’s analysis is the most commonly used isoconversional kinetic method due to its simplicity and high precision [17]. Friedman’s method is a linear differential calculation based on Equation (5):
ln ( d α d t ) α i = ln [ β i ( d α d t ) α i ] = l n [ k 0 α · f ( α ) ] E a α R T α , i ,
where ( d α d t ) α i , k0, Ea and Tα,i stand for the rate of conversion over time (-), pre-exponential factor (1/s), activation energy (kJ/mol), and temperature at each conversion degree αi (°C), respectively. Eα is calculated from the slope of curve in the plot ( d α d t ) α i versus 1 T α i [21,23,25]. The integral solution of Equation (2) according to Ozawa–Flynn–Wall can be written as in Equation (6):
ln ( β i ) = ln ( k 0 , α E a α R g ( α ) ) 5.331 1.052 E a α R T α , i .
Apparent activation energy Ea is obtained from the slope of the curve in plot ln(βi) versus 1/Tα,i [21,44]. Subscripts α and i in Equations (5) and (6) stand for the given values of conversion and heating rate, respectively. Functions f(α) and g(α) are the reaction model in differential and integral form, respectively [21].
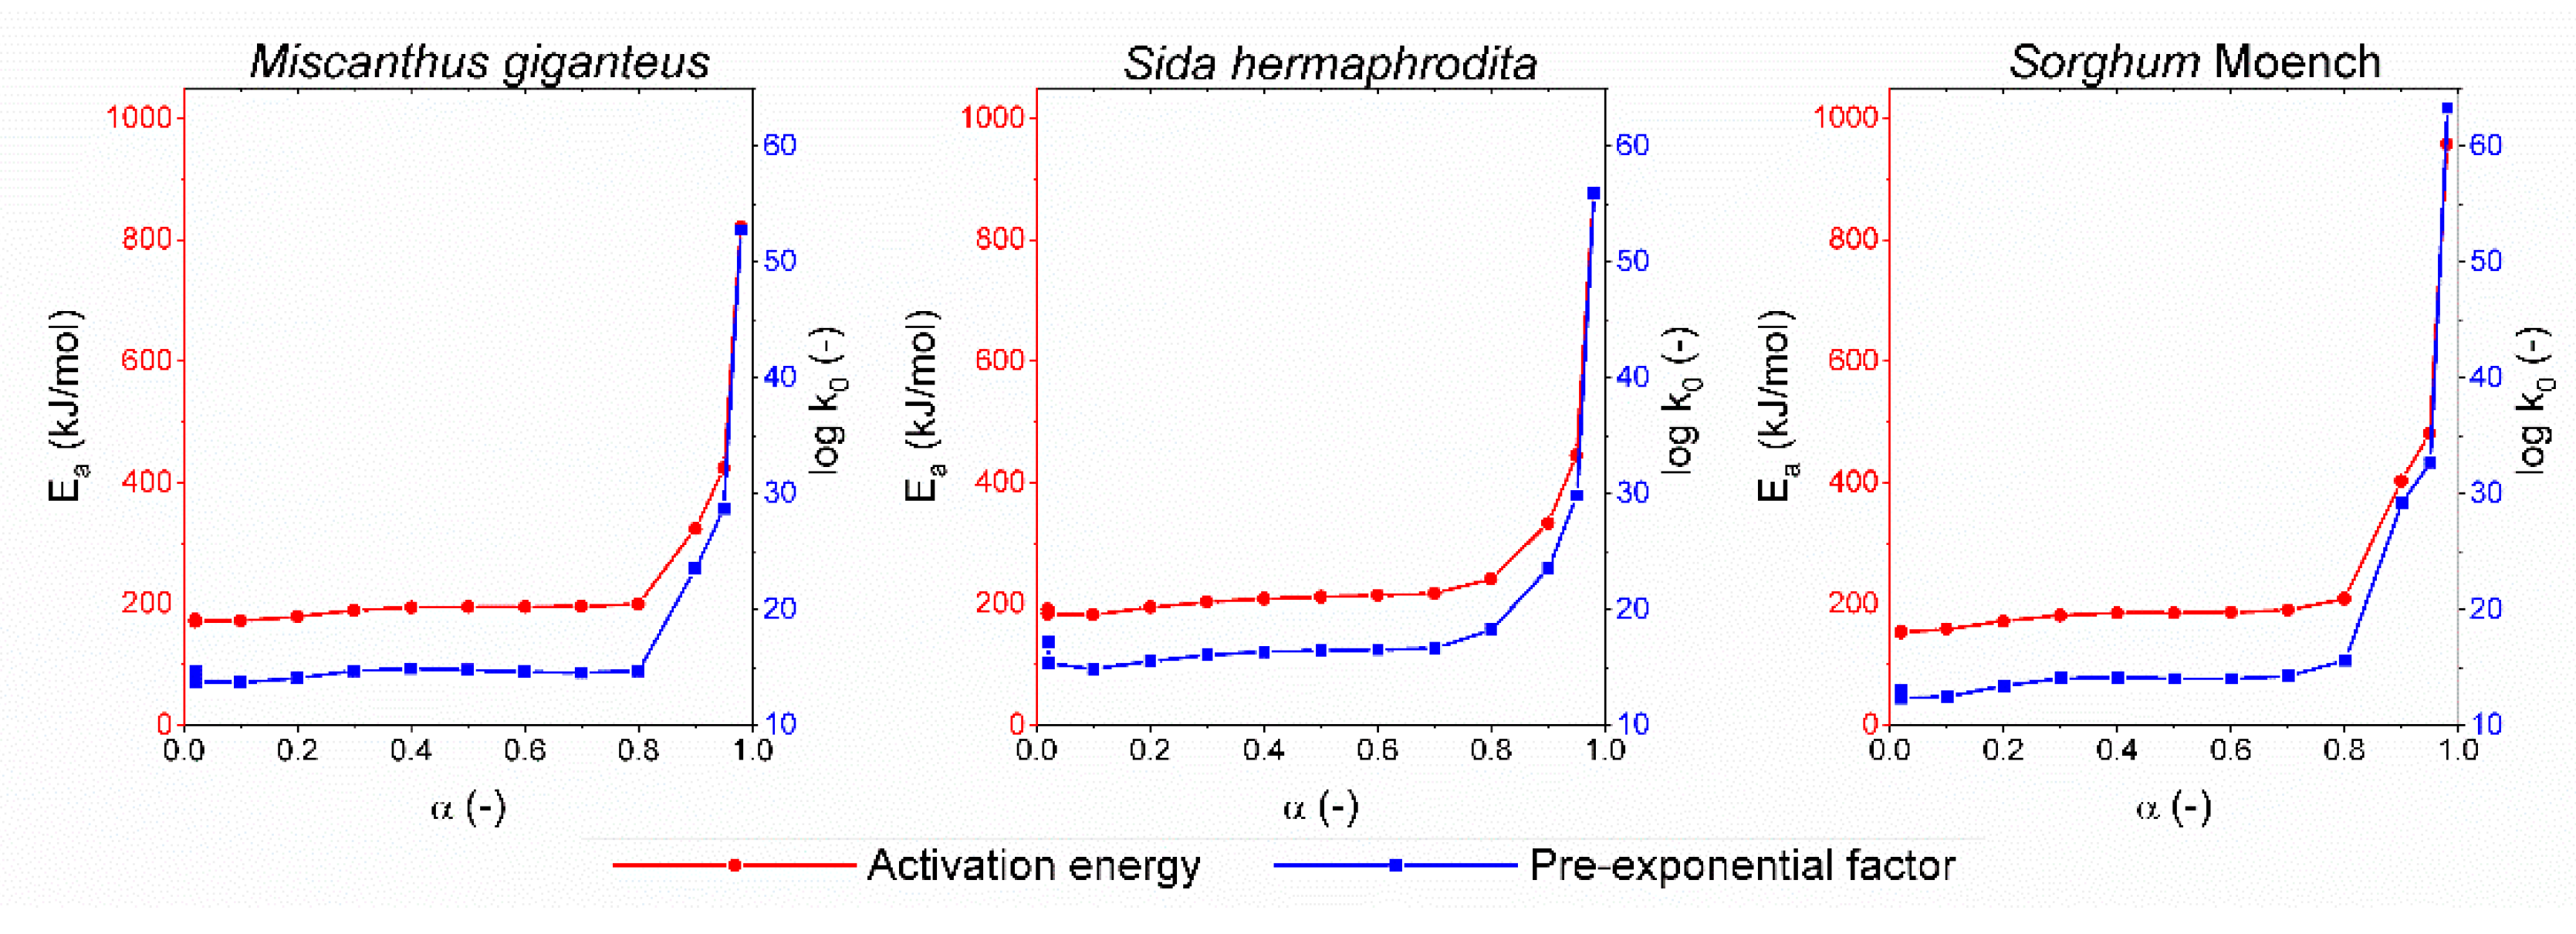
Both Friedmann’s and Ozawa–Flynn–Wall’s analyses are very insensitive for high conversion degrees [44]. Figure 3 and Figure 4 indicate that the values of activation energy and pre-exponential factors for conversion degree α ≥ 0.8 were much higher than those for the lower values of the conversion degree; therefore, they were excluded from further analysis. According to the numerical results of Friedmann’s analysis, the value of activation energy (E) for conversion degree α < 0.8 fluctuated in the ranges of 141.7–202.3, 159.2–209.1, and 170–220.9 kJ/mol for Miscanthus giganteus, Sida hermaphrodita, and Sorghum Moench, respectively. In the case of Ozawa–Flynn–Wall analysis, fluctuations took place in smaller intervals of 153.5–190.5, 171.5–196.3, and 182.6–217.9 kJ/mol for Miscanthus giganteus, Sida hermaphrodita, and Sorghum Moench, respectively. The value of pre-exponential factors (k0) fluctuated slightly for conversion degree α < 0.8 in the range of 109.8–1017.7 1/s for Friedmann’s analysis, and in the range of 1012.4–1017.2 1/s for Ozawa–Flynn–Wall analysis for Miscanthus giganteus, Sida hermaphrodita, and Sorghum Moench.
Similar results can be found in other studies of lignocellulosic biomass pyrolysis. Cai et al. [17] established energy activation of corn-stalk pyrolysis by Friedman’s analysis in the range of 148–186 kJ/mol for the conversion degree from 0.05 to 0.65. Lu et al. [25] found the energy activation of wheat-straw pyrolysis by Friedman’s method differing from 191.6 to 216.4 kJ/mol for conversion degree α = 0.1–0.5. In turn, the results obtained by Wang et al. [26] using the Ozawa–Flynn–Wall method for cotton-stalk pyrolysis show energy activation fluctuating in the range of 170.1–203.8 kJ/mol for the conversion degree from 0.2 to 0.8. It is difficult to indicate a substrate with the highest pyrolytic potential on the basis of results of Friedmann’s and Ozawa–Flynn–Wall’s analyses due to the large fluctuations of the kinetic parameters with the conversion degree and rejection of some results.

3.2.2. Nonlinear Regression

According to the results of isoconversional analysis, both kinetic values (k0 and E) were not constant as a function of conversion degree in the entire range, which confirmed that the pyrolysis of energy crops is a complex process that should be described by multiple reactions. Nonlinear-regression analysis was adopted to determine the final kinetic parameters and reaction mechanisms of energy crop pyrolysis. Due to the increase in activation energy as the conversion degree increased, according to Vyazovkin and Lesnikovich [46], a parallel reaction model was adopted. For nonlinear-regression analysis, the reaction model of the nth order expressed by Equation (7) was applied:
f ( α ) = ( 1 α ) n   .
Three parallel independent reactions responsible for the pyrolysis of hemicellulose, cellulose, and lignin were assumed (Equations (8–10)), as proposed in other studies on biomass pyrolysis [5,25].
Hemicellulose ( H ) char ( H ) + volatile ( H )
Cellulose ( C ) char ( C ) + volatile ( C )
Lignin ( L ) char ( L ) + volatile ( L )
Equations describing the kinetics of the three parallel independent reactions are defined by Equations (11)–(13).
d α H d t = k 0 H   exp ( E H R T ) ( 1 α H ) n H
d α C d t = k 0 C   exp ( E C R T ) ( 1 α c ) n C
d α L d t = k 0 L   exp ( E L R T ) ( 1 α L ) n L
Equations (11)–(13) were solved by using Netzsch-Thermokinetics software.
Miscanthus giganteus had the lowest values of activation energy, according to the results of nonlinear-regression analysis (Table 3), while Sorghum Moench had the highest values of activation energy. These results could be attributed to the composition of energy crops. Sorghum Moench requires the greatest amount of energy to initiate thermal degradation due to the largest lignin content, which has a complex structure and high stability. Sida hermaphrodita had the lowest lignin content between the selected energy crops, but slightly higher values of activation energy than those of Miscanthus giganteus, with a higher lignin content. This might have been caused by the value of the cellulose-to-lignin ratio, which was much higher for Sida hermaphrodita than for Miscanthus giganteus. On the basis of the results of nonlinear-regression analysis, Miscanthus giganteus was the most promising substrate for pyrolysis from the energy crops selected for this study. According to the results of nonlinear-regression analysis, hemicellulose had the lowest value of activation energy on the level of 92.9–97.7 kJ/mol. Hemicellulose has a low degree of polymerization, and decomposes at a lower temperature range than cellulose and lignin do, so the lowest amount of energy is required to initiate its thermal decomposition [37]. The decomposition of cellulose is a complex multistage process; thus, its activation energy is higher and in the range of 190.1–192.5 kJ/mol. The activation energy of lignin is in the range of 170–175.2 kJ/mol, which can be attributed to its complex structure, high stability, and thermal resistance. Generally, heat- and mass-transport limitations affect biomass-pyrolysis kinetics and product yields. However, in our research, a negligible heat- and mass-transfer effect was assumed because investigations were carried out in thermobalance with small sample mass. Slight differences between the activation energy of each biomass component might have been affected by differences in energy crop composition and interactions between hemicellulose, cellulose, and lignin. The largest differences in results were obtained for hemicellulose, which had a very strong interaction with lignin. The presence of lignin increased the rate of hemicellulose pyrolysis, which was caused by the decomposition of lignin in low temperatures. Products of the thermal decomposition of hemicellulose could cover the cellulose surface when temperature ranges were overlapping, which could also distort the results of kinetic analysis [37].
The fitting results of the experiment and the generated DTG curves were satisfactory (Figure 5); the determination coefficient for each energy crop was greater than 0.98. It was observed that the increase in heating rate from 5 to 20 °C/min resulted in the shift of the peak of maximal biomass decomposition towards higher temperatures. This could be ascribed to the shorter residence time of the biomass sample at the given temperature. Similar results were also observed by Ślęzak et al. [13]. A shift of the mass-loss peak to higher temperatures might have also been caused by the effect of heat- and mass-transfer processes. The poor thermal conductivity of lignocellulosic substances inhibits heat transfer, which can result in a particle temperature gradient [47,48]. This phenomenon causes “thermal lag” between the sample and controlling thermocouple. As a result, a shift of the mass-loss peak and an increase in char yields occurs. These effects are notably evident for large-mass samples and for long distances between the sample and controlling thermocouple, particularly for cellulose [47].
Activation energies for the pyrolysis of the pseudocomponents of various lignocellulosic biomass are presented in Table 4. According to the literature, the activation energy for the thermal decomposition of hemicellulose, cellulose, and lignin is in the ranges of 92.9–167.1, 108.6–212.0, and 40–226.5 kJ/mol, respectively. Logarithmic values of the pre-exponential factor for the thermal decomposition for cellulose, hemicellulose, and lignin are, according to the literature, 14–19 [49], 10.13 ± 0.09, and −0.47 ± 0.66 [27], respectively. Discrepancies between the literature data and obtained results are caused by the complex structure of lignocellulosic biomass; thus, the exact mechanism of pyrolysis is unclear. Some authors suggested that the pyrolysis of lignin consists of 2–4 stages [29]. Hemicellulose pyrolysis also contains parallel and successive reactions, e.g., Wang et al. [50] suggested three stages. Depending on the approach, authors obtain divergent results. Chen et al. [28] evaluated the activation energies of separated cellulose, hemicellulose, and lignin using a sinusoidally modulated temperature method. The average values of the activation energies were 112.6, 162.8, and 156.8 kJ/mol for cellulose, hemicellulose, and lignin, respectively. However, the activation energies were not constant as a function of conversion degree in its entire range; therefore, the process had to be described by multiple reactions. Yeo et al. [29] determined the activation energies of separated cellulose, hemicellulose, and lignin by multistep reactions using combined kinetics. The activation energies for cellulose, hemicellulose, and lignin were 199.7, 95.4, and 174.4 kJ/mol, respectively. The values of activation energies for separated lignin, hemicellulose, and cellulose obtained by Yeo et al. [29] were close to the activation energies obtained in this study for energy crop components. Slight differences resulted from the interactions between biomass components during the pyrolysis of the selected energy crops.
The reaction order obtained by nonlinear-regression analysis fluctuated in the ranges of 3.35–3.99 for hemicellulose, 1.38–1.93 for cellulose, and 3.97–3.99 for lignin (Table 3). These values were reasonable for the nth-order-reactions model that was applied. Biomass pyrolysis is not a shrinking-core reaction; thus, reaction orders should be greater than 1 but not exceed 20 [51]. According to the literature, the values of reaction orders obtained for biomass fractions are in the range from 1 to 5.2 [52].

4. Conclusions

This study characterized the kinetics of Miscanthus giganteus, Sida hermaphrodita, and Sorghum Moench thermal decomposition, and examined the possible use of these energy crops as feedstocks for pyrolysis processes. Our findings are useful for selecting optimal feedstock for pyrolysis and designing efficient reactors, which contribute to increasing the energy production from renewable energy sources. Further studies will be focused on the subsequent gasification process of pyrolytic char and combustion, as well as comparing these processes from the perspective of energy efficiency.
The temperature ranges of hemicellulose, cellulose, and lignin degradation during the pyrolysis process (230–360, 285–380, and 200–600 °C, respectively) determined in this work were consistent with the literature data [38]. It was observed that, for Sida hermaphrodita, with the highest cellulose-to-lignin ratio, maximal decomposition peak on the DTG curve occurred at the highest temperature (344 °C), while for Miscanthus giganteus and Sorghum Moench, with lower cellulose-to-lignin ratios, peaks occurred at lower temperatures (334 and 330 °C, respectively). Biomass composition also affected the total weight loss during pyrolysis—the lowest total weight loss occurred for Sorghum Moench, with the largest lignin and ash content, while the highest total weight loss occurred for Sida hermaphrodita, with the smallest lignin and ash content. Deconvolution of DTG curves allowed us to obtain reliable results on the composition of the energy crops (hemicellulose, cellulose, and lignin), with error below ±1.85%.
According to the results of isoconversional kinetic analysis, the pyrolysis of energy crops is a complex process that proceeds via multiple reactions. The kinetics of energy crop pyrolysis can be properly described by nonlinear-regression analysis, assuming three parallel independent reactions responsible for the pyrolysis of hemicellulose, cellulose, and lignin. According to the results of nonlinear-regression analysis, Miscanthus giganteus is a substrate with the highest pyrolytic potential among the energy crops selected for this study due to the lowest value of energy activation, with 92.9, 190.1, and 170 kJ/mol for hemicellulose, cellulose, and lignin, respectively. In turn, Sorghum Moench had the highest values of energy activation (93.2, 190.1, and 175.2 kJ/mol for hemicellulose, cellulose, and lignin, respectively), which is mainly attributed to its high lignin content. Due to the slight differences in activation energy values between the energy crops selected for this study, the most important factor affecting the choice of substrate for pyrolysis process is the cost of plant production. Because Miscanthus giganteus has the largest biomass yield and, as a perennial crop, low cultivation costs, it seems to have the highest potential for the pyrolysis process. Nonlinear-regression results show that hemicellulose has a much lower value of activation energy (92.9–97.7 kJ/mol) than those of cellulose (190.1–192.5 kJ/mol) and lignin (170–175.2 kJ/mol). Due to the interactions between biomass components, the kinetic parameters of hemicellulose, cellulose, and lignin obtained during the pyrolysis of lignocellulosic biomass are not exactly equal to those that were obtained during the pyrolysis of extracted components. Differences in the cellulose, hemicellulose, and lignin fractions, and interactions between them affected the pyrolysis behavior of the energy crops selected for this study. Therefore, biomass composition is a very important factor to consider when selecting feedstock for pyrolysis processes.

Author Contributions

Conceptualization, M.M., R.Ś., and S.L.; methodology, M.M., R.Ś., and S.L.; validation, M.M., R.Ś., and S.L.; formal analysis, M.M. and R.Ś.; investigation, M.M. and R.Ś.; writing, review and editing, M.M., R.Ś., and S.L.; supervision, R.Ś. and S.L. All authors have read and agreed to the published version of the manuscript.

Funding

This research was done within the statutory fund of Lodz Technical University.

Acknowledgments

This research did not receive any specific grant from funding agencies in the public, commercial, or not-for-profit sectors.

Conflicts of Interest

The authors declare no conflict of interest.

References

  1. Bilgili, F.; Koçak, E.; Bulut, Ü.; Kuşkaya, S. Can biomass energy be an efficient policy tool for sustainable development? Renew. Sustain. Energy Rev. 2017, 71, 830–845. [Google Scholar] [CrossRef]
  2. Piwowar, A.; Dzikuć, M. Outline of the economic and technical problems associated with the co-combustion of biomass in Poland. Renew. Sustain. Energy Rev. 2016, 54, 415–420. [Google Scholar] [CrossRef]
  3. Mann, M.; Spath, P. A life cycle assessment of biomass cofiring in a coal-fired power plant. Clean Technol. Environ. Policy 2001, 3, 81–91. [Google Scholar] [CrossRef]
  4. Uddin, M.N.; Techato, K.; Taweekun, J.; Mofijur, M.; Rasul, M.G.; Mahlia, T.; Rahman, S.A. An Overview of Recent Developments in Biomass Pyrolysis Technologies. Energies 2018, 11, 3115. [Google Scholar] [CrossRef] [Green Version]
  5. Collura, S.; Azambre, B.; Weber, J.W. Kinetic modelling of the pyrolysis of Miscanthus × Giganteus from the thermogravimetric analysis of its fractionated components. Environ. Chem. Lett. 2005, 3, 95–99. [Google Scholar] [CrossRef]
  6. Cortes, A.M.; Bridgwater, T. Kinetic study of the pyrolysis of miscanthus and its acid hydrolysis residue by thermogravimetric analysis. Fuel Process. Technol. 2015, 138, 184–193. [Google Scholar] [CrossRef] [Green Version]
  7. Hu, S.-W.; Wu, L.-M.; Persson, S.; Peng, L.; Feng, S. Sweet sorghum and Miscanthus: Two potential dedicated bioenergy crops in China. J. Integr. Agric. 2017, 16, 1236–1243. [Google Scholar] [CrossRef]
  8. Nahm, M.; Morhart, C. Virginia mallow (Sida hermaphrodita (L.) Rusby) as perennial multipurpose crop: Biomass yields, energetic valorization, utilization potentials, and management perspectives. GCB Bioenergy 2018, 10, 393–404. [Google Scholar] [CrossRef] [Green Version]
  9. Kacprzak, A.; Michalska, K.; Romanowska-Duda, Z.; Grzesik, M. Energy crops as a valuable material for biogas production. Kosmos. Probl. Nauk. Biologicznych 2012, 61, 281–293. [Google Scholar]
  10. Roy, P.; Dias, G. Prospects for pyrolysis technologies in the bioenergy sector: A review. Renew. Sustain. Energy Rev. 2017, 77, 59–69. [Google Scholar] [CrossRef]
  11. Basu, P. Biomass Gasification, Pyrolysis and Torrefaction: Practical Design and Theory, 2nd ed.; Elsevier Science: Amsterdam, The Netherlands, 2018. [Google Scholar]
  12. Collard, F.-X.; Blin, J. A review on pyrolysis of biomass constituents: Mechanisms and composition of the products obtained from the conversion of cellulose, hemicelluloses and lignin. Renew. Sustain. Energy Rev. 2014, 38, 594–608. [Google Scholar] [CrossRef]
  13. Slezak, R.; Krzystek, L.; Ledakowicz, S. Thermogravimetric analysis coupled with mass spectrometry of spent mushroom substrate and its fractions. J. Anal. Appl. Pyrolysis 2018, 133, 1–8. [Google Scholar] [CrossRef]
  14. Ahmad, M.; Rajapaksha, A.U.; Lim, J.; Zhang, M.; Bolan, N.; Mohan, D.; Vithanage, M.; Lee, S.; Ok, Y.S. Biochar as a sorbent for contaminant management in soil and water: A review. Chemosphere 2014, 99, 19–33. [Google Scholar] [CrossRef] [PubMed]
  15. Balat, M.; Balat, M.; Kırtay, E.; Balat, H.; Kirtay, E. Main routes for the thermo-conversion of biomass into fuels and chemicals. Part 1: Pyrolysis systems. Energy Convers. Manag. 2009, 50, 3147–3157. [Google Scholar] [CrossRef]
  16. Nicodème, T.; Berchem, T.; Jacquet, N.; Richel, A. Thermochemical conversion of sugar industry by-products to biofuels. Renew. Sustain. Energy Rev. 2018, 88, 151–159. [Google Scholar] [CrossRef]
  17. Cai, J.; Xu, D.; Dong, Z.; Yu, X.; Yang, Y.; Banks, S.; Bridgwater, T. Processing thermogravimetric analysis data for isoconversional kinetic analysis of lignocellulosic biomass pyrolysis: Case study of corn stalk. Renew. Sustain. Energy Rev. 2018, 82, 2705–2715. [Google Scholar] [CrossRef] [Green Version]
  18. Carvalho, W.; Oliveira, T.J.; Cardoso, C.; Ataíde, C.H. Thermogravimetric analysis and analytical pyrolysis of a variety of lignocellulosic sorghum. Chem. Eng. Res. Des. 2015, 95, 337–345. [Google Scholar] [CrossRef]
  19. Hu, M.; Chen, Z.; Wang, S.; Guo, D.; Ma, C.; Zhou, Y.; Chen, J.; Laghari, M.; Fazal, S.; Xiao, B.; et al. Thermogravimetric kinetics of lignocellulosic biomass slow pyrolysis using distributed activation energy model, Fraser–Suzuki deconvolution, and iso-conversional method. Energy Convers. Manag. 2016, 118, 1–11. [Google Scholar] [CrossRef]
  20. Nowicki, L.; Ledakowicz, S. Comprehensive characterization of thermal decomposition of sewage sludge by TG–MS. J. Anal. Appl. Pyrolysis 2014, 110, 220–228. [Google Scholar] [CrossRef]
  21. Özveren, U.; Özdoğan, Z.S. Investigation of the slow pyrolysis kinetics of olive oil pomace using thermo-gravimetric analysis coupled with mass spectrometry. Biomass Bioenergy 2013, 58, 168–179. [Google Scholar] [CrossRef]
  22. Ashraf, A.; Sattar, H.; Munir, S. A comparative applicability study of model-fitting and model-free kinetic analysis approaches to non-isothermal pyrolysis of coal and agricultural residues. Fuel 2019, 240, 326–333. [Google Scholar] [CrossRef]
  23. Ali, I.; Bahaitham, H.; Naebulharam, R.; Naibulharam, R. A comprehensive kinetics study of coconut shell waste pyrolysis. Bioresour. Technol. 2017, 235, 1–11. [Google Scholar] [CrossRef] [PubMed]
  24. Saha, P.; McGaughy, K.; Hasan, R.; Reza, M.T. Pyrolysis and carbon dioxide gasification kinetics of hydrochar produced from cow manure. Environ. Prog. Sustain. Energy 2018, 38, 154–162. [Google Scholar] [CrossRef] [Green Version]
  25. Lu, C.; Song, W.; Lin, W. Kinetics of biomass catalytic pyrolysis. Biotechnol. Adv. 2009, 27, 583–587. [Google Scholar] [CrossRef]
  26. Wang, X.; Wang, X.; Qin, G.; Chen, M.; Wang, J. Comparative study on pyrolysis characteristics and kinetics of lignocellulosic biomass and seaweed. J. Therm. Anal. Calorim. 2018, 132, 1317–1323. [Google Scholar] [CrossRef]
  27. Rueda-Ordóñez, Y.; Tannous, K.; Olivares-Gómez, E. An empirical model to obtain the kinetic parameters of lignocellulosic biomass pyrolysis in an independent parallel reactions scheme. Fuel Process. Technol. 2015, 140, 222–230. [Google Scholar] [CrossRef]
  28. Chen, T.; Li, L.; Zhao, R.; Wu, J. Pyrolysis kinetic analysis of the three pseudocomponents of biomass–cellulose, hemicellulose and lignin. J. Therm. Anal. Calorim. 2016, 128, 1825–1832. [Google Scholar] [CrossRef]
  29. Yeo, J.Y.; Chin, B.L.F.; Tan, J.K.; Loh, Y.S. Comparative studies on the pyrolysis of cellulose, hemicellulose, and lignin based on combined kinetics. J. Energy Inst. 2019, 92, 27–37. [Google Scholar] [CrossRef]
  30. Sher, F.; Iqbal, S.Z.; Liu, H.; Imran, M.; Snape, C.E. Thermal and kinetic analysis of diverse biomass fuels under different reaction environment: A way forward to renewable energy sources. Energy Convers. Manag. 2020, 203, 112266. [Google Scholar] [CrossRef]
  31. Jayaraman, K.; Gökalp, I. Pyrolysis, combustion and gasification characteristics of miscanthus and sewage sludge. Energy Convers. Manag. 2015, 89, 83–91. [Google Scholar] [CrossRef]
  32. Vamvuka, D.; Sfakiotakis, S.; Pazara, E.; Panopoulos, K. Kinetic modeling of five sustainable energy crops as potential sources of bioenergy. Energy Sour. Part A Recover. Util. Environ. Eff. 2016, 38, 1812–1818. [Google Scholar] [CrossRef]
  33. Jeguirim, M.; Dorge, S.; Loth, A.; Trouvé, G. Devolatilization Kinetics of Miscanthus Straw from Thermogravimetric Analysis. Int. J. Green Energy 2010, 7, 164–173. [Google Scholar] [CrossRef]
  34. Chen, D.; Shuang, E.; Liu, L. Analysis of pyrolysis characteristics and kinetics of sweet sorghum bagasse and cotton stalk. J. Therm. Anal. Calorim. 2017, 131, 1899–1909. [Google Scholar] [CrossRef]
  35. Cardoso, C.; Miranda, M.; Santos, K.; Ataíde, C. Determination of kinetic parameters and analytical pyrolysis of tobacco waste and sorghum bagasse. J. Anal. Appl. Pyrolysis 2011, 92, 392–400. [Google Scholar] [CrossRef]
  36. Magdziarz, A.; Wilk, M.; Wądrzyk, M. Pyrolysis of hydrochar derived from biomass—Experimental investigation. Fuel 2020, 267, 117246. [Google Scholar] [CrossRef]
  37. Wang, S.; Luo, Z. Pyrolysis of Biomass; De Gruyter: Berlin, Germany, 2017. [Google Scholar]
  38. Kan, T.; Strezov, V.; Evans, T.J. Lignocellulosic biomass pyrolysis: A review of product properties and effects of pyrolysis parameters. Renew. Sustain. Energy Rev. 2016, 57, 1126–1140. [Google Scholar] [CrossRef]
  39. Burhenne, L.; Messmer, J.; Aicher, T.; Laborie, M.-P. The effect of the biomass components lignin, cellulose and hemicellulose on TGA and fixed bed pyrolysis. J. Anal. Appl. Pyrolysis 2013, 101, 177–184. [Google Scholar] [CrossRef]
  40. Jahirul, M.I.; Rasul, M.G.; Chowdhury, A.A.; Ashwath, N. Biofuels Production through Biomass Pyrolysis —A Technological Review. Energies 2012, 5, 4952–5001. [Google Scholar] [CrossRef]
  41. Szwaja, S.; Magdziarz, A.; Zajemska, M.; Poskart, A. A torrefaction of Sida hermaphrodita to improve fuel properties. Advanced analysis of torrefied products. Renew. Energy 2019, 141, 894–902. [Google Scholar] [CrossRef]
  42. Michalska, K.; Ledakowicz, S. Alkali pre-treatment of Sorghum Moench for biogas production. Chem. Pap. 2013, 67, 1130–1137. [Google Scholar] [CrossRef]
  43. Michalska, K. Investigation of Hydrolysis and Methane Fermentation Process of Energy Crops. Ph.D. Thesis, Lodz Univeristy of Technology, Lodz, Poland, 28 November 2014. [Google Scholar]
  44. Stolarek, P.; Ledakowicz, S.; Ślęzak, R. Influence of Liming on Kinetics of Sewage Sludge Pyrolysis. Ecol. Chem. Eng. S 2019, 26, 175–188. [Google Scholar] [CrossRef] [Green Version]
  45. Renneboog, R. Activation Energy; Salem Press Encyclopedia of Science: Hackensack, NJ, USA, 2018; p. 5. [Google Scholar]
  46. Vyazovkin, S.; Lesnikovich, A. An approach to the solution of the inverse kinetic problem in the case of complex processes. Thermochim. Acta 1990, 165, 273–280. [Google Scholar] [CrossRef]
  47. White, J.E.; Catallo, J.W.; Legendre, B.L. Biomass pyrolysis kinetics: A comparative critical review with relevantagricultural residue case studies. J. Anal. Appl. Pyrolysis 2011, 91, 1–33. [Google Scholar] [CrossRef]
  48. Di Blasi, C. Modeling chemical and physical processes of wood and biomass pyrolysis. Prog. Energy Combust. Sci. 2008, 34, 47–90. [Google Scholar] [CrossRef]
  49. Silva, M.L.S.; López-González, D.; Villasenor, J.; Sanchez, P.; Valverde, J.L. Thermogravimetric–mass spectrometric analysis of lignocellulosic and marine biomass pyrolysis. Bioresour. Technol. 2012, 109, 163–172. [Google Scholar] [CrossRef]
  50. Wang, S.; Lin, H.; Ru, B.; Dai, G.; Wang, X.; Xiao, G.; Luo, Z. Kinetic modeling of biomass components pyrolysis using a sequential and coupling method. Fuel 2016, 185, 763–771. [Google Scholar] [CrossRef]
  51. Kreutter, W.; Liu, Z.; McNamara, P.J.; Singer, S. Kinetic Analysis of Dried Biosolid Pyrolysis. Energy Fuels 2019, 33, 8766–8776. [Google Scholar] [CrossRef]
  52. Aboyade, A.; Carrier, M.; Meyer, E.L.; Knoetze, J.H.; Görgens, J. Model fitting kinetic analysis and characterisation of the devolatilization of coal blends with corn and sugarcane residues. Thermochim. Acta 2012, 530, 95–106. [Google Scholar] [CrossRef]
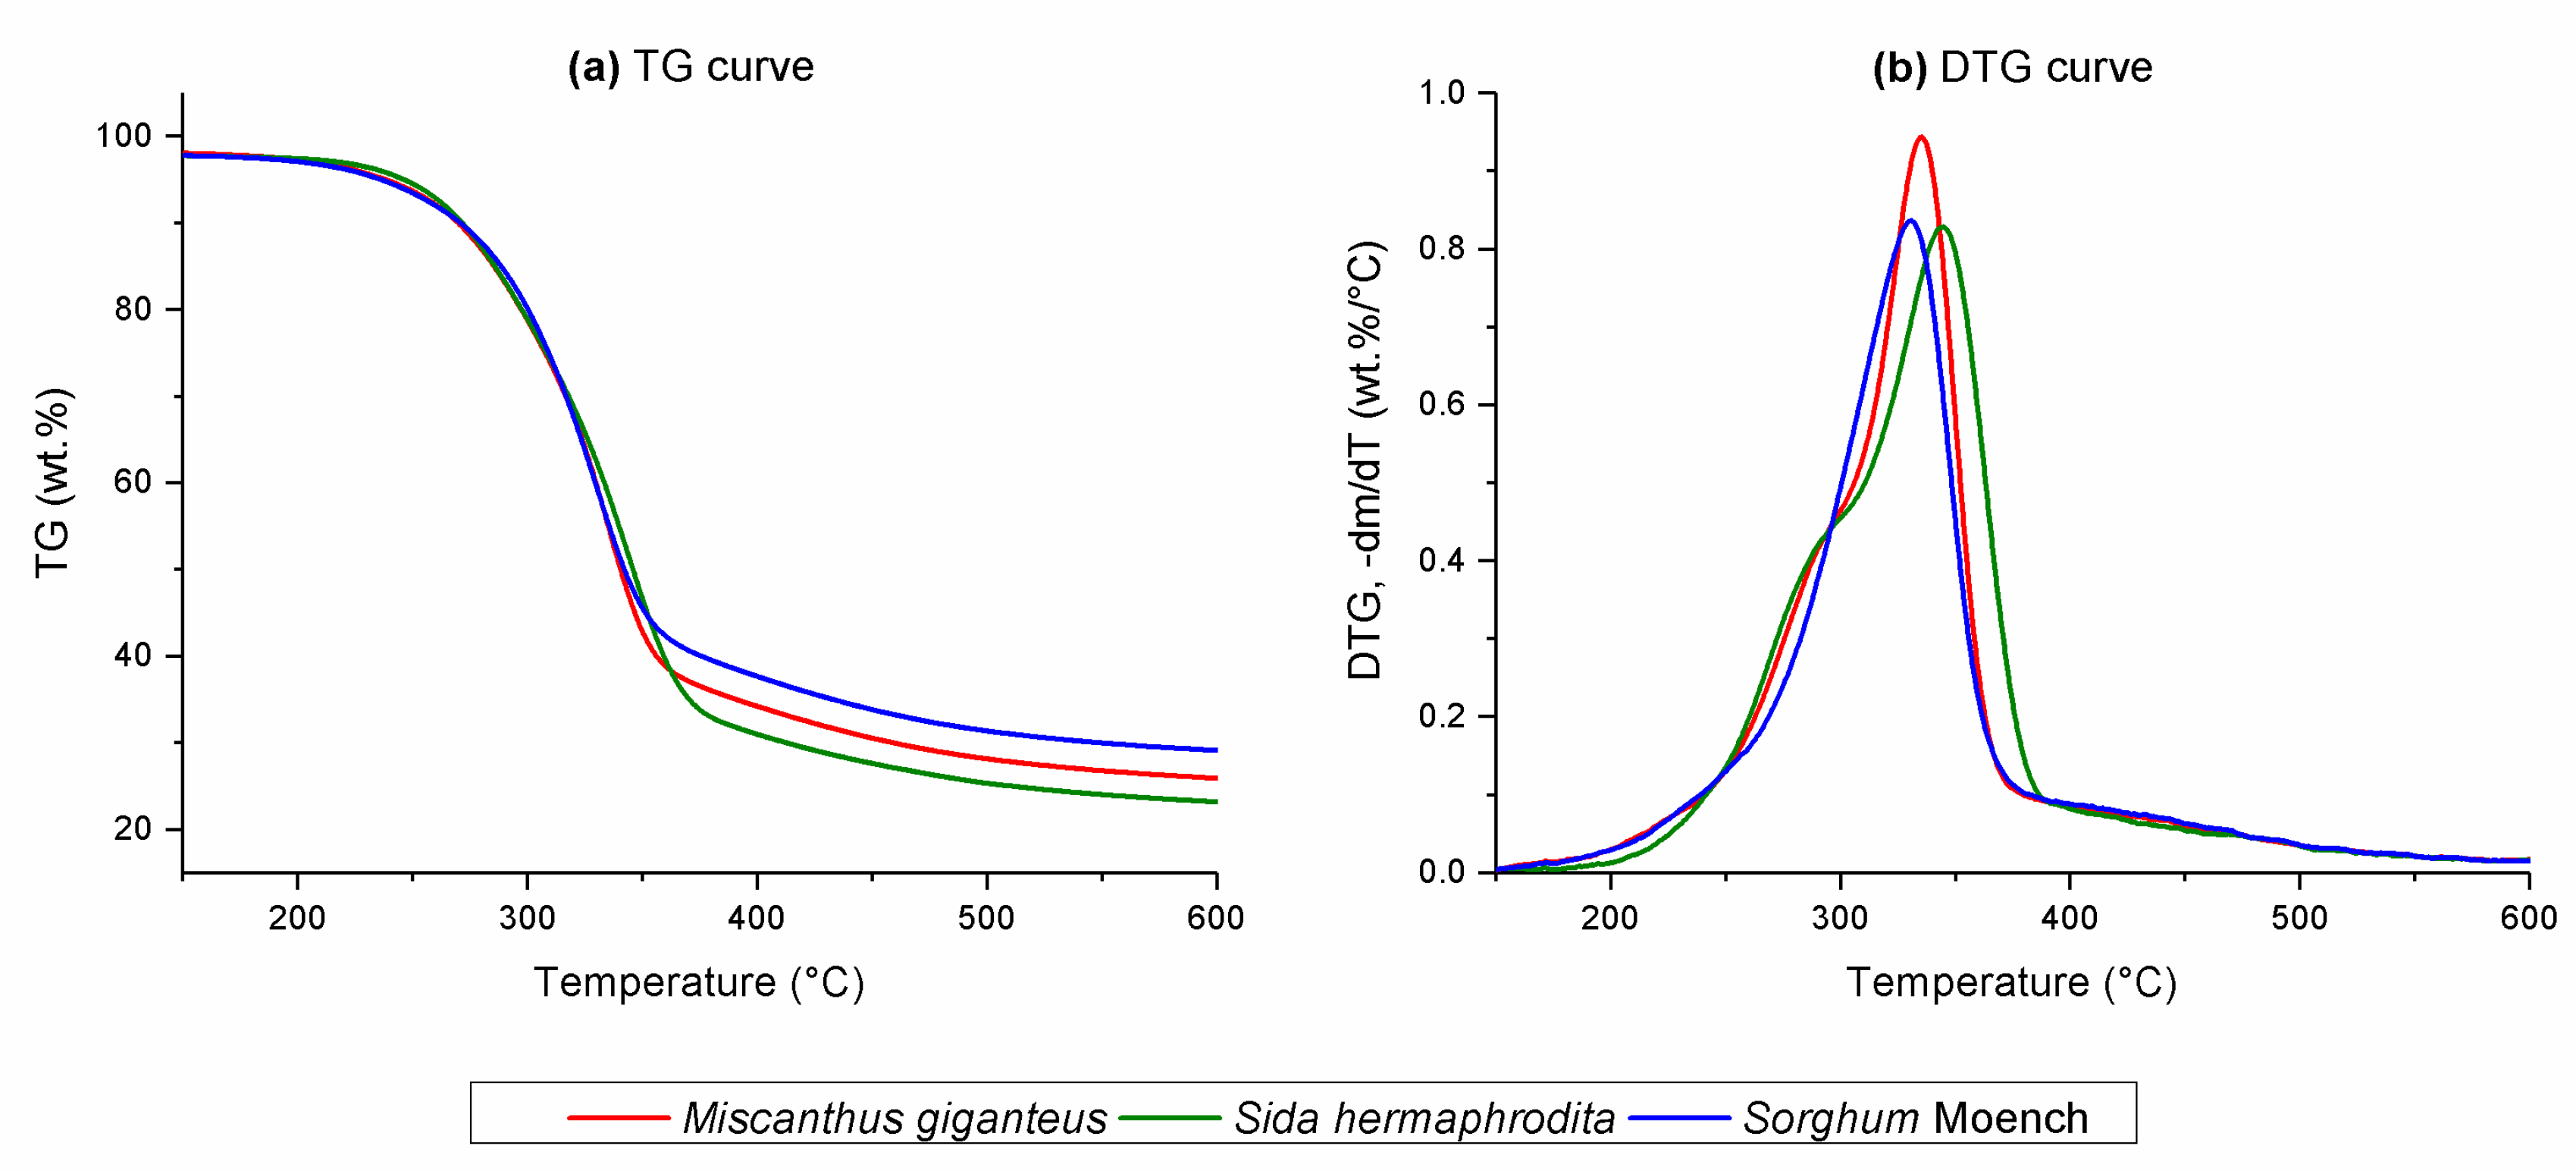
Figure 1. (a) Thermogravimetric (TG) and (b) derivative TG (DTG) curves for energy crops at a heating rate of β = 10 °C/min.
Energies 13 03977 g001
Figure 2. Deconvolution of DTG curve for Miscanthus giganteus at heating rate of β = 10 °C/min.
Energies 13 03977 g002
Figure 3. Friedman plots for energy crop decomposition.
Energies 13 03977 g003
Figure 4. Ozawa–Flynn–Wall plots for energy crop decomposition.
Energies 13 03977 g004
Figure 5. Experiment and generated DTG curves using kinetic model involving three parallel nth-order reactions for Miscanthus giganteus, Sida hermaphrodita, and Sorghum Moench.
Energies 13 03977 g005
Table 1. Main feedstock characteristics higher heating value (HHV).
Biomass Characteristics Substrate
Miscanthus giganteusSida hermaphroditaSorghum Moench
Proximate analysis (wt%, dry basis)
Moisture1.8 ± 0.022.2 ± 0.042.2 ± 0.04
Volatiles75.4 ± 0.7278.4 ± 0.6872.0 ± 0.57
Fixed carbon19.4 ± 0.1917.2 ± 0.2619.0 ± 0.17
Ash3.4 ± 0.062.2 ± 0.046.8 ± 0.13
Ultimate analysis (wt%, dry basis)
C44.3 ± 0.1243.8 ± 0.5742.5 ± 0.14
H5.9 ± 0.055.6 ± 0.135.6 ± 0.07
N0.7 ± 0.020.4 ± 0.011.1 ± 0.02
O 145.748.044.0
S000
HHV (MJ/kg dry basis)18.117.817.8
1 Calculated by difference.
Table 2. Parameters of deconvolution of DTG curves for energy crops.
Energy CropMiscanthus giganteusSida hermaphroditaSorghum Moench
Lump number123123123
Position (°C)296335382297343384288330386
Amplitude (wt%/°C)0.3960.880.0760.320.7120.0640.2760.0720.096
Full width at half maximum (°C)49.533.718848.935.8138.53842.3182.5
Area (wt%)29.644.921.026.342.814.717.853.127.9
Composition 1 (wt%)30.144.921.126.242.314.217.953.127.9
R2 (-)0.9960.9880.990
1 Determined by classical methods on the basis of our team’s previous studies [43].
Table 3. Model parameters of energy crop pyrolysis.
LumpsMiscanthus giganteusSida hermaphroditaSorghum Moench
123123123
log k0 (-)7.0214.6112.125.9914.815.764.7314.4815.36
Ea (kJ/mol)92.9190.117097.7192.5171.993.2190.1175.2
Reaction order (n) (-)3.991.383.993.971.933.973.351.663.97
Lump fraction (wt fraction)0.310.470.220.320.510.170.180.540.28
R2 (-)0.9990.9980.986
Table 4. Activation energies for pyrolysis of hemicellulose, cellulose, and lignin.
SubstrateKinetic ModelEa (kJ/mol)
HemicelluloseCelluloseLignin
Miscanthus giganteusNonlinear regression92.9190.1170.0
Sida hermaphrodita97.7192.5171.9
Sorghum Moench93.2190.1175.2
Pine wood [19]Distributed activation-energy model (DAEM)152.4191.3210.4
Rice husk [19]159.3179.3199.9
Bamboo [19]167.1188.4203.6
Coconut shell waste [23]Kissinger’s method (for hemicellulose and cellulose) and combined kinetics (for lignin)106.4108.679.1–226.5
Sugarcane straw [27]Independent parallel-reaction scheme142.0195.0212.040.0
Pure component [28]Sinusoidally modulated temperature method162.8112.6156.8
Pure component [29]Combined kinetics95.4199.7174.4