Article

Dissolution Process Observation of Methane Bubbles in the Deep Ocean Simulator Facility

1
Division of Applied Physics, Faculty of Engineering, Hokkaido University, Sapporo 060-8628, Japan
2
Research Institute of Energy Frontier, Department of Energy and Environment, AIST, Tsukuba 305-8569, Japan
3
Hawaii Natural Energy Institute, School of Ocean and Earth Science and Technology, University of Hawaii, Honolulu, HI 96822, USA
4
Japan NUS Co., Ltd., Tokyo 160-0023, Japan
5
Department of Physical Oceanography, Atmosphere and Ocean Research Institute, the University of Tokyo, Kashiwa 277-8564, Japan
*
Author to whom correspondence should be addressed.
Energies 2020, 13(15), 3938; https://doi.org/10.3390/en13153938
Submission received: 25 April 2020 / Revised: 11 June 2020 / Accepted: 17 July 2020 / Published: 1 August 2020

Abstract

:
To investigate the temperature dependency of the methane bubble dissolution rate, buoyant single methane bubbles were held stationary in a countercurrent water flow at a pressure of 6.9 MPa and temperatures ranging from 288 K to 303 K. The 1 to 3 mm diameter bubbles were analyzed by observation through the pressure chamber viewport using a bi-telecentric CCD camera. The dissolution rate in artificial seawater was approximately two times smaller than that in pure water. Furthermore, it was observed that the methane bubble dissolution rate increased with temperature, suggesting that bubble dissolution is a thermal activation process (the activation energy is estimated to be 9.0 kJ/mol). The results were different from the expected values calculated using the governing equation for methane dissolution in water. The dissolution modeling of methane bubbles in the mid-to-shallow depth of seawater was revised based on the current results.

Graphical Abstract

1. Introduction

When methane (CH4) and other gaseous hydrocarbons are released into the ocean from natural bottom seeps or oil and gas industry activities such as the development of offshore production wells or during deep oil spills, they can lead to significant environmental consequences. These hydrocarbons can dissolve or may escape through the air–ocean interface. Microbial metabolism is recognized as a major sink of hydrocarbon contaminants in the ocean, but the mechanisms and rates of biological degradation and sedimentation are not well understood.
Natural gas hydrates (NGHs) observed in offshore sediments are formed under high pressure and low temperatures. NGHs contain water and a large amount of natural gases, including CH4 generated by biogenic and thermogenic processes. NGHs have been reported to exist in the seabed in various parts of the world, and they have attracted attention as unconventional natural gas resources (e.g., [1,2]) and, in the geological record [3], as one of the contributing factors to climate change (e.g., [4,5]) and large-scale continental slope instability [6].
Investigations of the distribution of NGH in the offshore seabed are in progress. In areas where biogenic natural gas is dominant, hydrates are observed in the pore spaces of unconsolidated clastic rocks, including sand, sandy clay, loams, etc. By contrast, where thermogenic gas dominates the production in an area, NGHs are often observed as nodules in faults that are near the surface, and in muddy substrates.
Methane is a potent greenhouse gas that has a global warming potential about 30 times larger than that of carbon dioxide (CO2 (e.g., [7])). The release of CH4 during NGH recovery activities could increase its atmospheric inventory, which may exacerbate global warming [8,9]. Therefore, the development of NGH applications, including for the production of energy, requires a careful assessment of environmental impacts. Investigations of the dissolution rate of buoyant natural gas bubbles rising through the oceanic water column are important in assessing environmental impacts, since it will affect the resulting concentrations and spatial extent of the contamination zone. Bubbles that dissolve slowly relative to their vertical rise speed will distribute CH4 and other natural gases over a wider area, resulting in lower concentrations. Furthermore, natural gas bubble plumes entrain ambient seawater as they rise through the density-stratified deep ocean. During this ascent, volumes of cold, dense seawater drawn upward by a plume along with small gas bubbles dispersed in this water may detrain from the plume and form subsurface intrusion layers, which are spread laterally by isopycnal transport [10]. Larger bubbles with strong buoyancy can resist this detrainment and continue to ascend toward the surface. Insight acquired from buoyant natural gas simulations is not only essential for environmental impact assessments but can also contribute to understanding the role of NGH in the global carbon cycle.
To develop effective mitigation strategies for methane leakage from marine NGH development activities, investigations have been conducted to observe bubbles or plumes in the field and to measure bubble dissolution rates in the laboratory. Maini and Bishnoi [11] established a method to hold and observe rising bubbles in a fixed location for an extended period by utilizing a counter flow of water in a high-pressure vessel. They reported that a hydrate film formed on the rising CH4 bubble. Masutani and Adams [12] used a large pressure vessel to observe pure CH4 bubbles and oil-covered CH4 bubbles as part of a private–public risk assessment of deep offshore oil and gas production in the Gulf of Mexico. The dissolution process for CH4 bubbles with and without hydrate films has also been studied previously [13,14]. Warzinski et al. [15] and Chen et al. [16] performed detailed observations of the hydrate film formation on a CH4 bubble to elucidate the dissolution process of the bubble. These investigations have revealed that, besides impeding dissolution, hydrate formation may also alter gas transport by changing the drag characteristics of the bubbles.
Several in situ experiments have examined rising bubbles and natural gas plumes. Topham [17] studied the behavior of natural gas bubbles released into the water column at depths of 650 and 325 m in the Beaufort Sea. Rehder et al. [18,19,20] released CH4 and argon or CO2 at the ocean floor in Monterey Bay and observed rising bubble behavior with a remotely operated vehicle (ROV). As part of the “DeepSpill” project, a field test was conducted to simulate a deep undersea well blowout in which significant quantities of oil and gas were discharged at a depth of 844 m at the Helland Hansen site in the Norwegian Sea, and the behavior of these plumes was studied [21]. Furthermore, natural gas bubbles released from the seabed were observed via acoustic sounder imaging at the Sakhalin slope in the Sea of Okhotsk [22], at the mud volcano in the Black Sea [23], and at Blake Ridge [24]. Recently, detailed observations of rising bubbles were performed via tracking with an ROV in the Gulf of Mexico [25,26].
Applying the results of these earlier studies, models have been developed to simulate the dissolution and dispersion of CH4 bubbles rising through the oceanic water column. Johansen [27] proposed the Lagrangian “DEEPBLOW” model to assess oil and gas blowout accidents. Incorporating the results of laboratory and field experiments, Yapa and his colleagues modified Johansen’s model [28,29,30] and developed the “Clarkson deepwater oil and gas (CDOG)” model to predict the dissolution and transport of oil and gases in seawater [31,32]. McGinnis et al. [33] also proposed a model to simulate the behavior of CH4 gas rising from the seafloor to the ocean surface.
Recently, as part of offshore CH4-hydrate research and development activities, the “Methane Gases from Deepwater (MEGADEEP)” model [34] and “MEGADEEP-Eco” model [35] were created to simulate the diffusion behavior of CH4 gas released from the seabed. These models were applied to CH4-hydrate activities in the Nankai trough [36] by the MH21 project in Japan. They were also used to simulate CH4 emission from offshore CH4-hydrate reservoirs in the East China Sea [37] and in the Japan Sea [38].
Previous research has provided significant insight into the dissolution process of CH4 bubbles in seawater; however, the majority of laboratory experiments have been performed using pure water and field studies have been conducted in seawater. The effect of salts on the dissolution rate of CH4 bubbles is estimated only indirectly, and studies that have made direct comparisons are limited. Furthermore, laboratory experiments have mainly focused on the effects of the hydrate film formation on the dissolving bubbles, and only a very small number of measurements have been made of the bubble dissolution rate under non-hydrate forming conditions. In consideration of these deficiencies, we have attempted to measure the dissolution rate of CH4 bubbles outside of the hydrate film-forming regime. We determined the dissolution rate of single CH4 bubbles in a high-pressure vessel in pure water and artificial seawater and also evaluated the temperature dependency of the dissolution rates. These experimental results were compared with predicted values computed by models [29].

2. Materials and Methods

Experiments were performed in a facility that can simulate conditions in the ocean from the surface down to 1000 m depth. The facility allows the continuous monitoring of buoyant gas bubbles for extended periods. A downward flow of water over the rising bubble generates a downward drag force. The flow rate of water over the bubble can be adjusted so that buoyancy and drag forces are balanced and the bubble is held stationary in space. In the frame of reference of the bubble, this simulates buoyant rise through the water column. In this study, the dissolution rates of single CH4 bubbles under dynamic (i.e., advective), non-hydrate-forming conditions were inferred from data on bubble shrinkage over time.
The University of Hawai’i Deep Ocean Simulator (DOS) was employed in this study. The DOS has an internal volume of about 100 L and can operate safely at internal hydrostatic pressures up to 10.4 MPa. The DOS consists of a pressure vessel equipped with observation windows, a high-pressure water circulation system, a temperature controller, a gas supply system, and an imaging system (Figure 1). Previous studies [11,12] have confirmed that this system is capable of monitoring the behavior of single and multiple buoyant droplets and bubbles over long time periods.
Figure 1 presents a schematic diagram of the DOS facility. The cylindrical pressure chamber comprises two sections, each approximately 1 m in height. The upper section (146 mm inner diameter) serves as a low-velocity, run-in plenum that supplies the enclosed water tunnel. The plastic water tunnel shown in the inset is mounted inside the 298 mm inner diameter lower section that is equipped with a pair of high-pressure viewports (J.M. Canty Fuseview Sightglass; approximately 100 mm clear aperture; 10.44 MPa maximum operating pressure) positioned opposite to one another to allow the observation of the bubbles in the water tunnel. Both sections are fabricated from 316 stainless steel in compliance with all applicable American Society of Mechanical Engineers (ASME) pressure vessel codes. The inner surfaces of the chamber are coated with polytetrafluoroethylene (PTFE).
The system is filled with about 100 L of either tap water (pure water) or synthetic seawater. While natural seawater was available for the present experiments, complications associated with the variability of its properties—even when collected at the same sampling site but at different times—were encountered in earlier investigations by the authors. To minimize this problem, and to ensure that results could be replicated by others, we elected to use artificial seawater with known (and fixed) composition and minimal biological loading. We believed that this would facilitate comparisons between the data and model results for the gas dissolution rate. Moreover, the use of artificial seawater in laboratory marine science experiments is a common practice.
Synthetic seawater is prepared by mixing Instant Ocean with tap water to obtain a salinity of 3.5 ± 0.2 wt% NaCl. The Instant Ocean aquarium mix contains naturally occurring salts including sodium chloride, magnesium chloride, sodium sulfate, calcium chloride, and potassium chloride [39]. We selected Instant Ocean for preparing the artificial seawater since it is widely available and has been previously characterized and employed in a number of scientific studies (e.g., [40]). The pressurized liquid in the system is circulated with a variable speed, magnetically coupled gear pump (Micropump model 223/56 C; Leeson Micro Series AC Inverter, maximum discharge rate: 12 L/min). Two bath chillers (Thermo Scientific model ThermoChill III and model IsoTemp 6200) are employed to maintain the water temperature in the range extending from 278 to 308 K, with an accuracy of ±1 K. The water flow rate in the water tunnel can be adjusted between 5 and 50 cm/s. For a dissolving CH4 bubble with a diameter between 10 and 1 mm, the flow rate in the water tunnel test section was adjusted over a range of approximately 20 to 16 cm/s.
The water tunnel consists of a clear acrylic inlet contraction and constant area viewing section cemented to a polycarbonate diffuser. The diffuser downstream of the viewing section ensures that gas bubbles under observation are not swept out of the water tunnel as they dissolve, since the downward fluid velocity decreases rapidly by a factor of about 20 from the inlet to exit in the diffuser. This allows us to periodically adjust (i.e., reduce) the fluid flow rate and reposition the dissolving bubbles back in the viewing section for continued observation. The inlet contraction of the plastic water tunnel is employed to minimize boundary layers and reduce turbulence levels in the 25.4 mm inner diameter x 102 mm length, cylindrical test (viewing) section.
To investigate the temperature dependency of a rising bubble from the deep sea to the surface layer under the condition where CH4 hydrate does not form, similar tests were conducted at 288, 293, 298, and 303 K (each ±1 K). The pressure was fixed at 6.9 MPa ± 0.14 MPa.
The CH4 gas prepared by Airgas, Inc. that was used in the experiments had 99.99% purity. The gas was injected into the water from a needle positioned at the base of the pressure vessel.
The clear, constant area viewing section of the water tunnel was aligned horizontally with the two large viewports. Gas bubbles stabilized with the downward flow of water were illuminated with an LED panel (Metaphase Technologies model FR-BL) mounted in front of one viewport and were monitored with a telecentric CCD camera (Prosilica GT1920 with Thorlabs 0.128 Bi-telecentric lens) through the opposite viewport. The telecentric camera lens provided constant magnification across the span of the 25.4 mm inner diameter viewing section, to avoid errors in estimating the changes in size over time of the dissolving bubbles as they wandered laterally toward and away from the camera.
Images were recorded at intervals of up to 0.5 s. Images were analyzed every 3 to 30 s, depending on the size change rate. Image analysis was done post-experiment with LabView’s Vision software. Due to minor bubble movement during image capture, the spatial resolution of the image measurements was estimated to be 0.05 mm.
The shape of the bubble was assumed to be an oblate spheroid, and the major axis (a) and the minor axis (b) were estimated from the 2D image data. The time change of the spherical diameter (de) of the equivalent volume (v), calculated by Equation (1), was investigated.
v = π(a2b)/6 = πde3/6,
The Heywood circularity factor (H) also was calculated to assess the bubble-shape change. Three or more replicates were performed at each condition; the number of samples analyzed for each data point reported below was n = 3 to 6.

3. Results and Discussion

Figure 2 shows a typical image of a CH4 bubble observed in the high-pressure vessel (a sample of the bubble tracking animation is provided in Supplementary Materials Video S1).
Based on the (time) sequence of the bubble images, the temporal evolution of the bubble diameter was determined from Equation (1). As shown in Figure 3, the equivalent diameter de appears to decrease linearly with time. The dissolution rate of a CH4 bubble, V, is estimated to be the slope dde/dt of this linear decay.
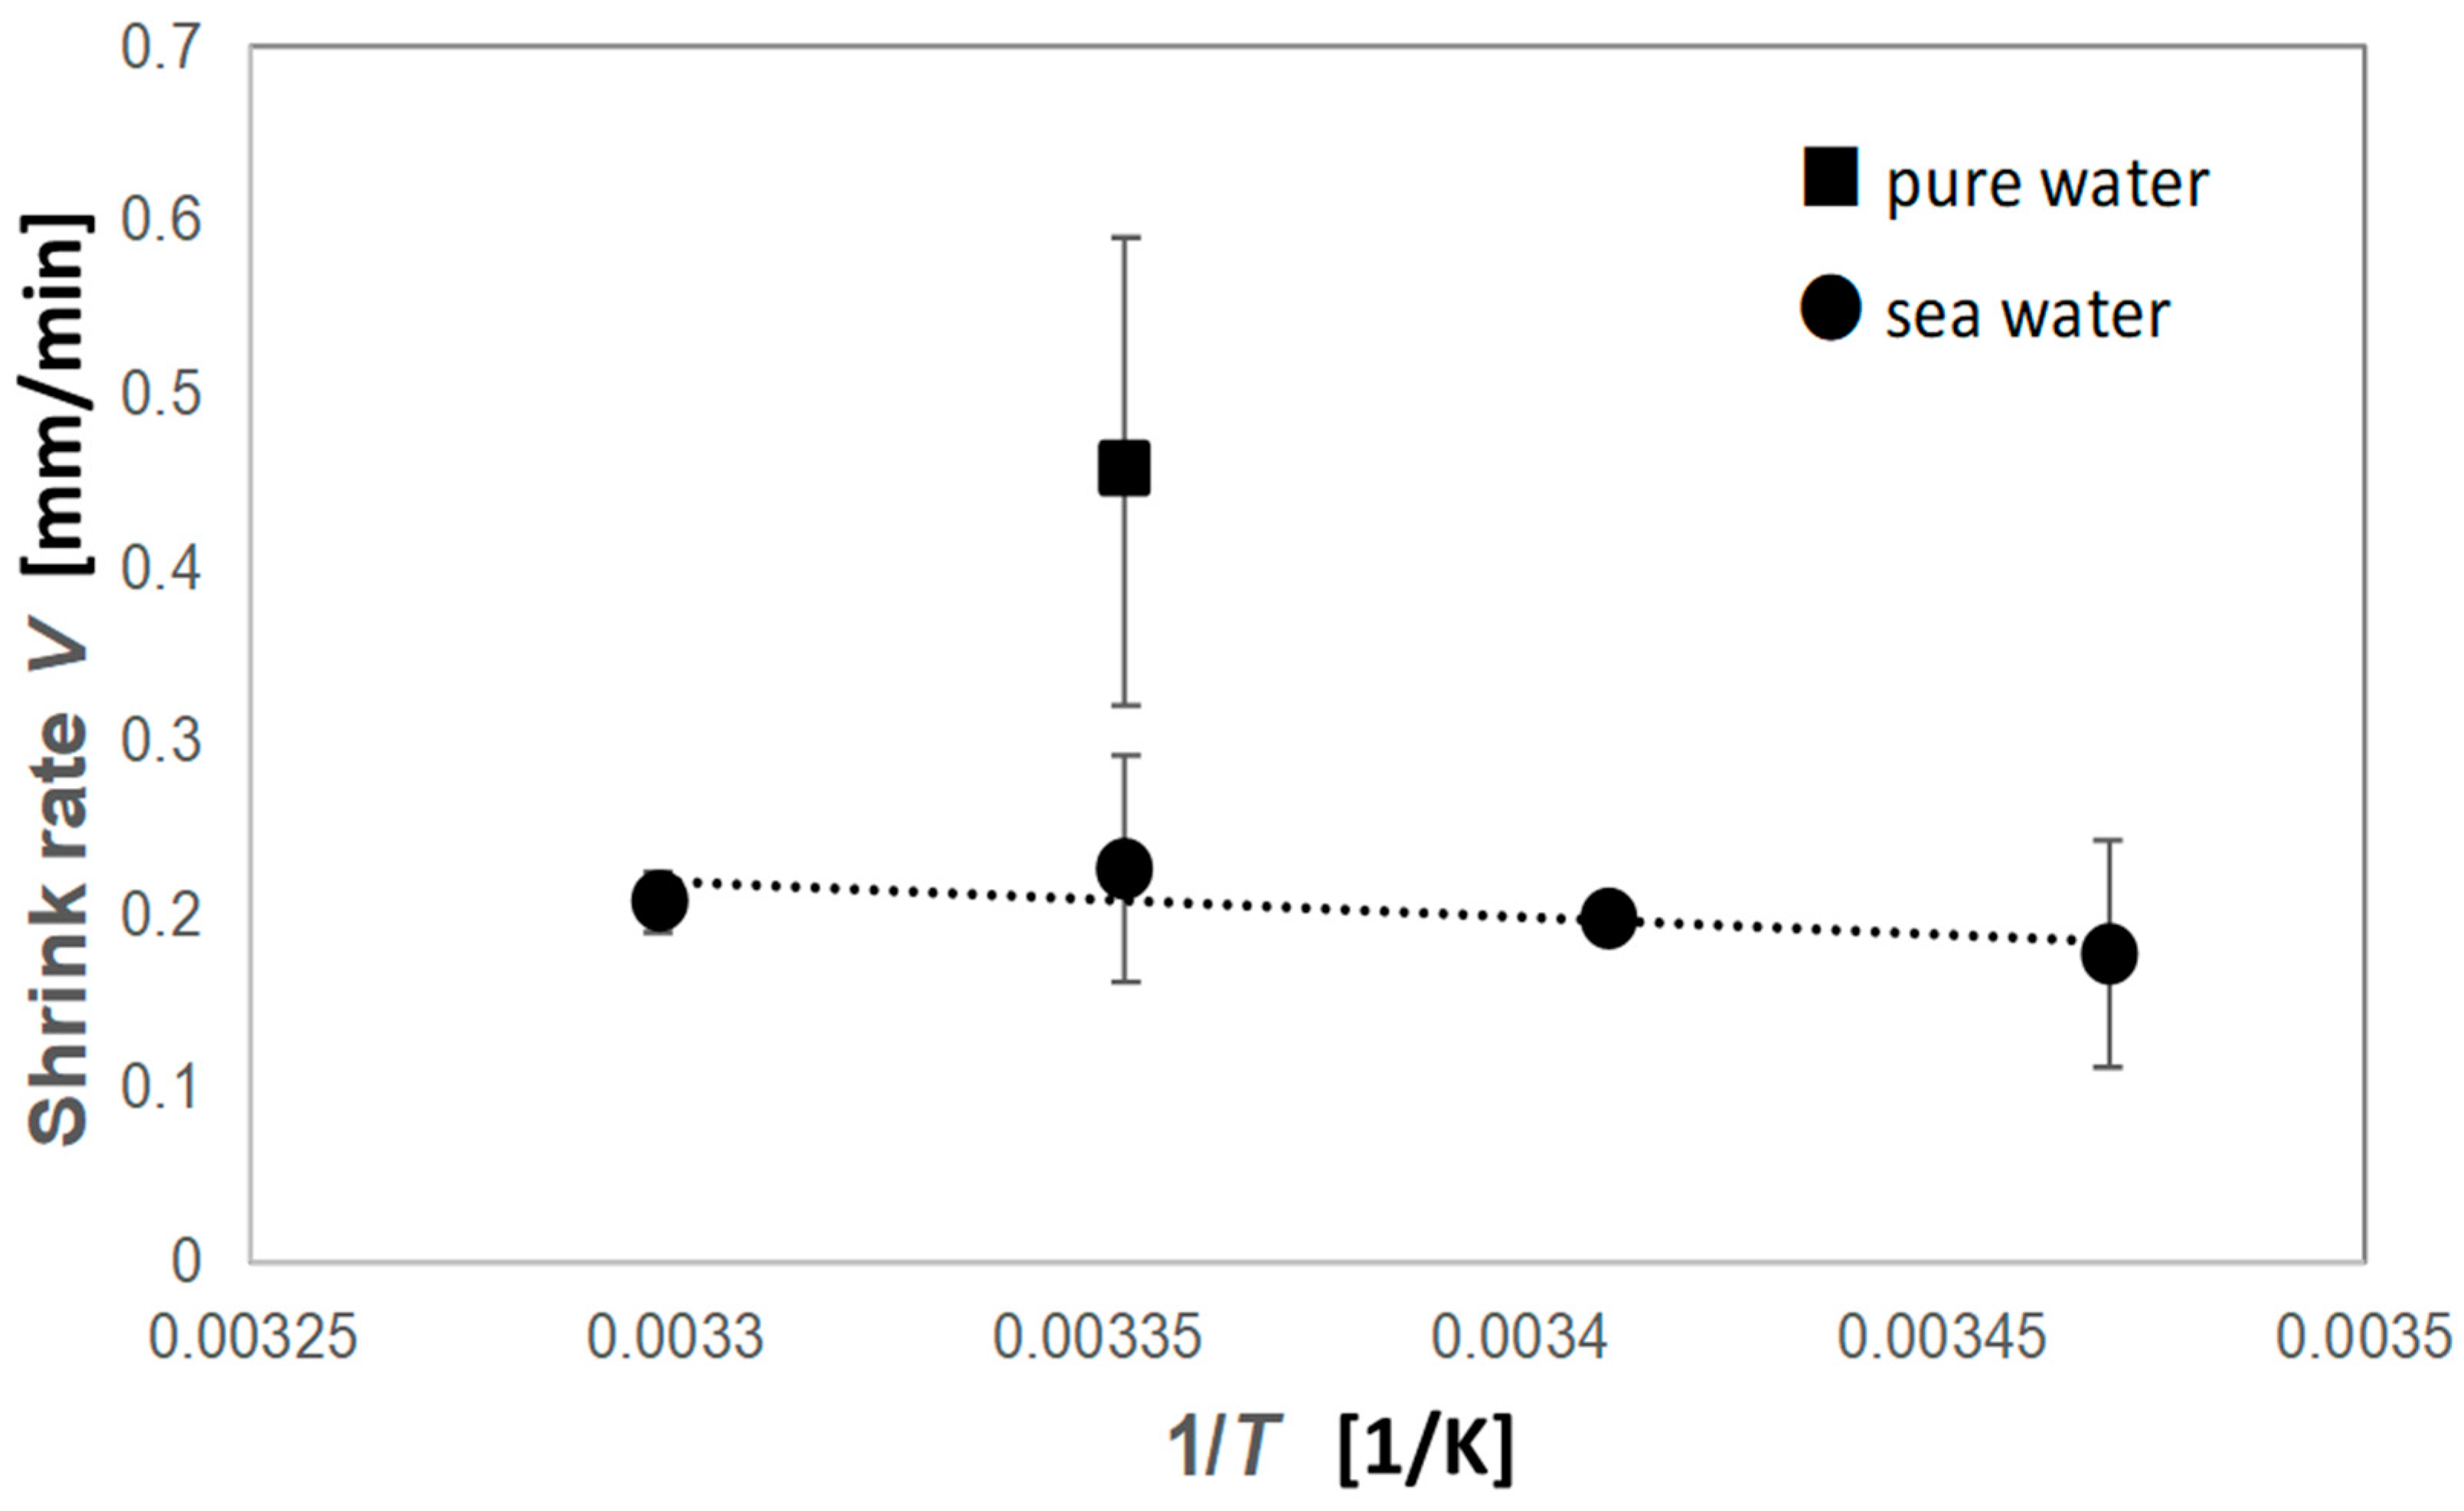
The temperature dependence of V at 6.9 MPa is shown in Figure 4. In pure water, V was about 0.46 mm/min (7.6 μm/s) at a temperature of 298 K. V in seawater was observed to be significantly smaller than in pure water. At 298 K, the data indicate a value of V of about 0.21±0.1 mm/min (3.3–3.7 μm/s). The data also appear to show a very slight increase in V with temperature over the range tested.
The present experiments indicate that the V of a CH4 bubble rising in pure water is larger than in seawater under very similar conditions (i.e., pressure, temperature, bubble size, and ambient flow conditions). This is the first direct comparison to determine the effect of salts on CH4 dissolution. This result is consistent with the prediction by Vascanselos et al. [41] that the dissolution rates of bubbles in seawater are smaller than in pure water because contaminants in seawater tend to accumulate on the bubble surface, which inhibits mass transfer from bubble to liquid.
The present data were compared with previous studies. The dissolution rates of CH4 bubbles in pure water were measured previously by Warzinski et al. [15]. They observed a dissolution rate of 0.94 ± 0.05 µm/s at a temperature of 282 ± 0.5 K and pressure of 8.5 ± 2 MPa. This value is about eight times smaller than our results. One possible explanation for this discrepancy may be differences in the experimental conditions, such as pressure and bubble size.
To date, the dissolution rates of CH4 bubbles in seawater have generally been determined from field data. Rehder et al. [18,20] estimated the in situ dissolution rates of rising bubbles as ranging from 8.5 to 15.1 ± 3.2 µm/s. These rates are much larger than those observed in the present study. Bubble size may explain this difference. McGinnis et al. [33] showed that mass transfer coefficients changed when the diameter of a bubble fell below around 5 mm. Using their model for smaller bubbles, a dissolution rate in seawater of about 0.2 mm/min is calculated, which agrees well with data from the present study.
Equation (2) is the relationship for CH4 dissolution in liquid that has been employed in a number of models [28,29,30,33,38]:
dm/dt = −K M A (Cs − C0),
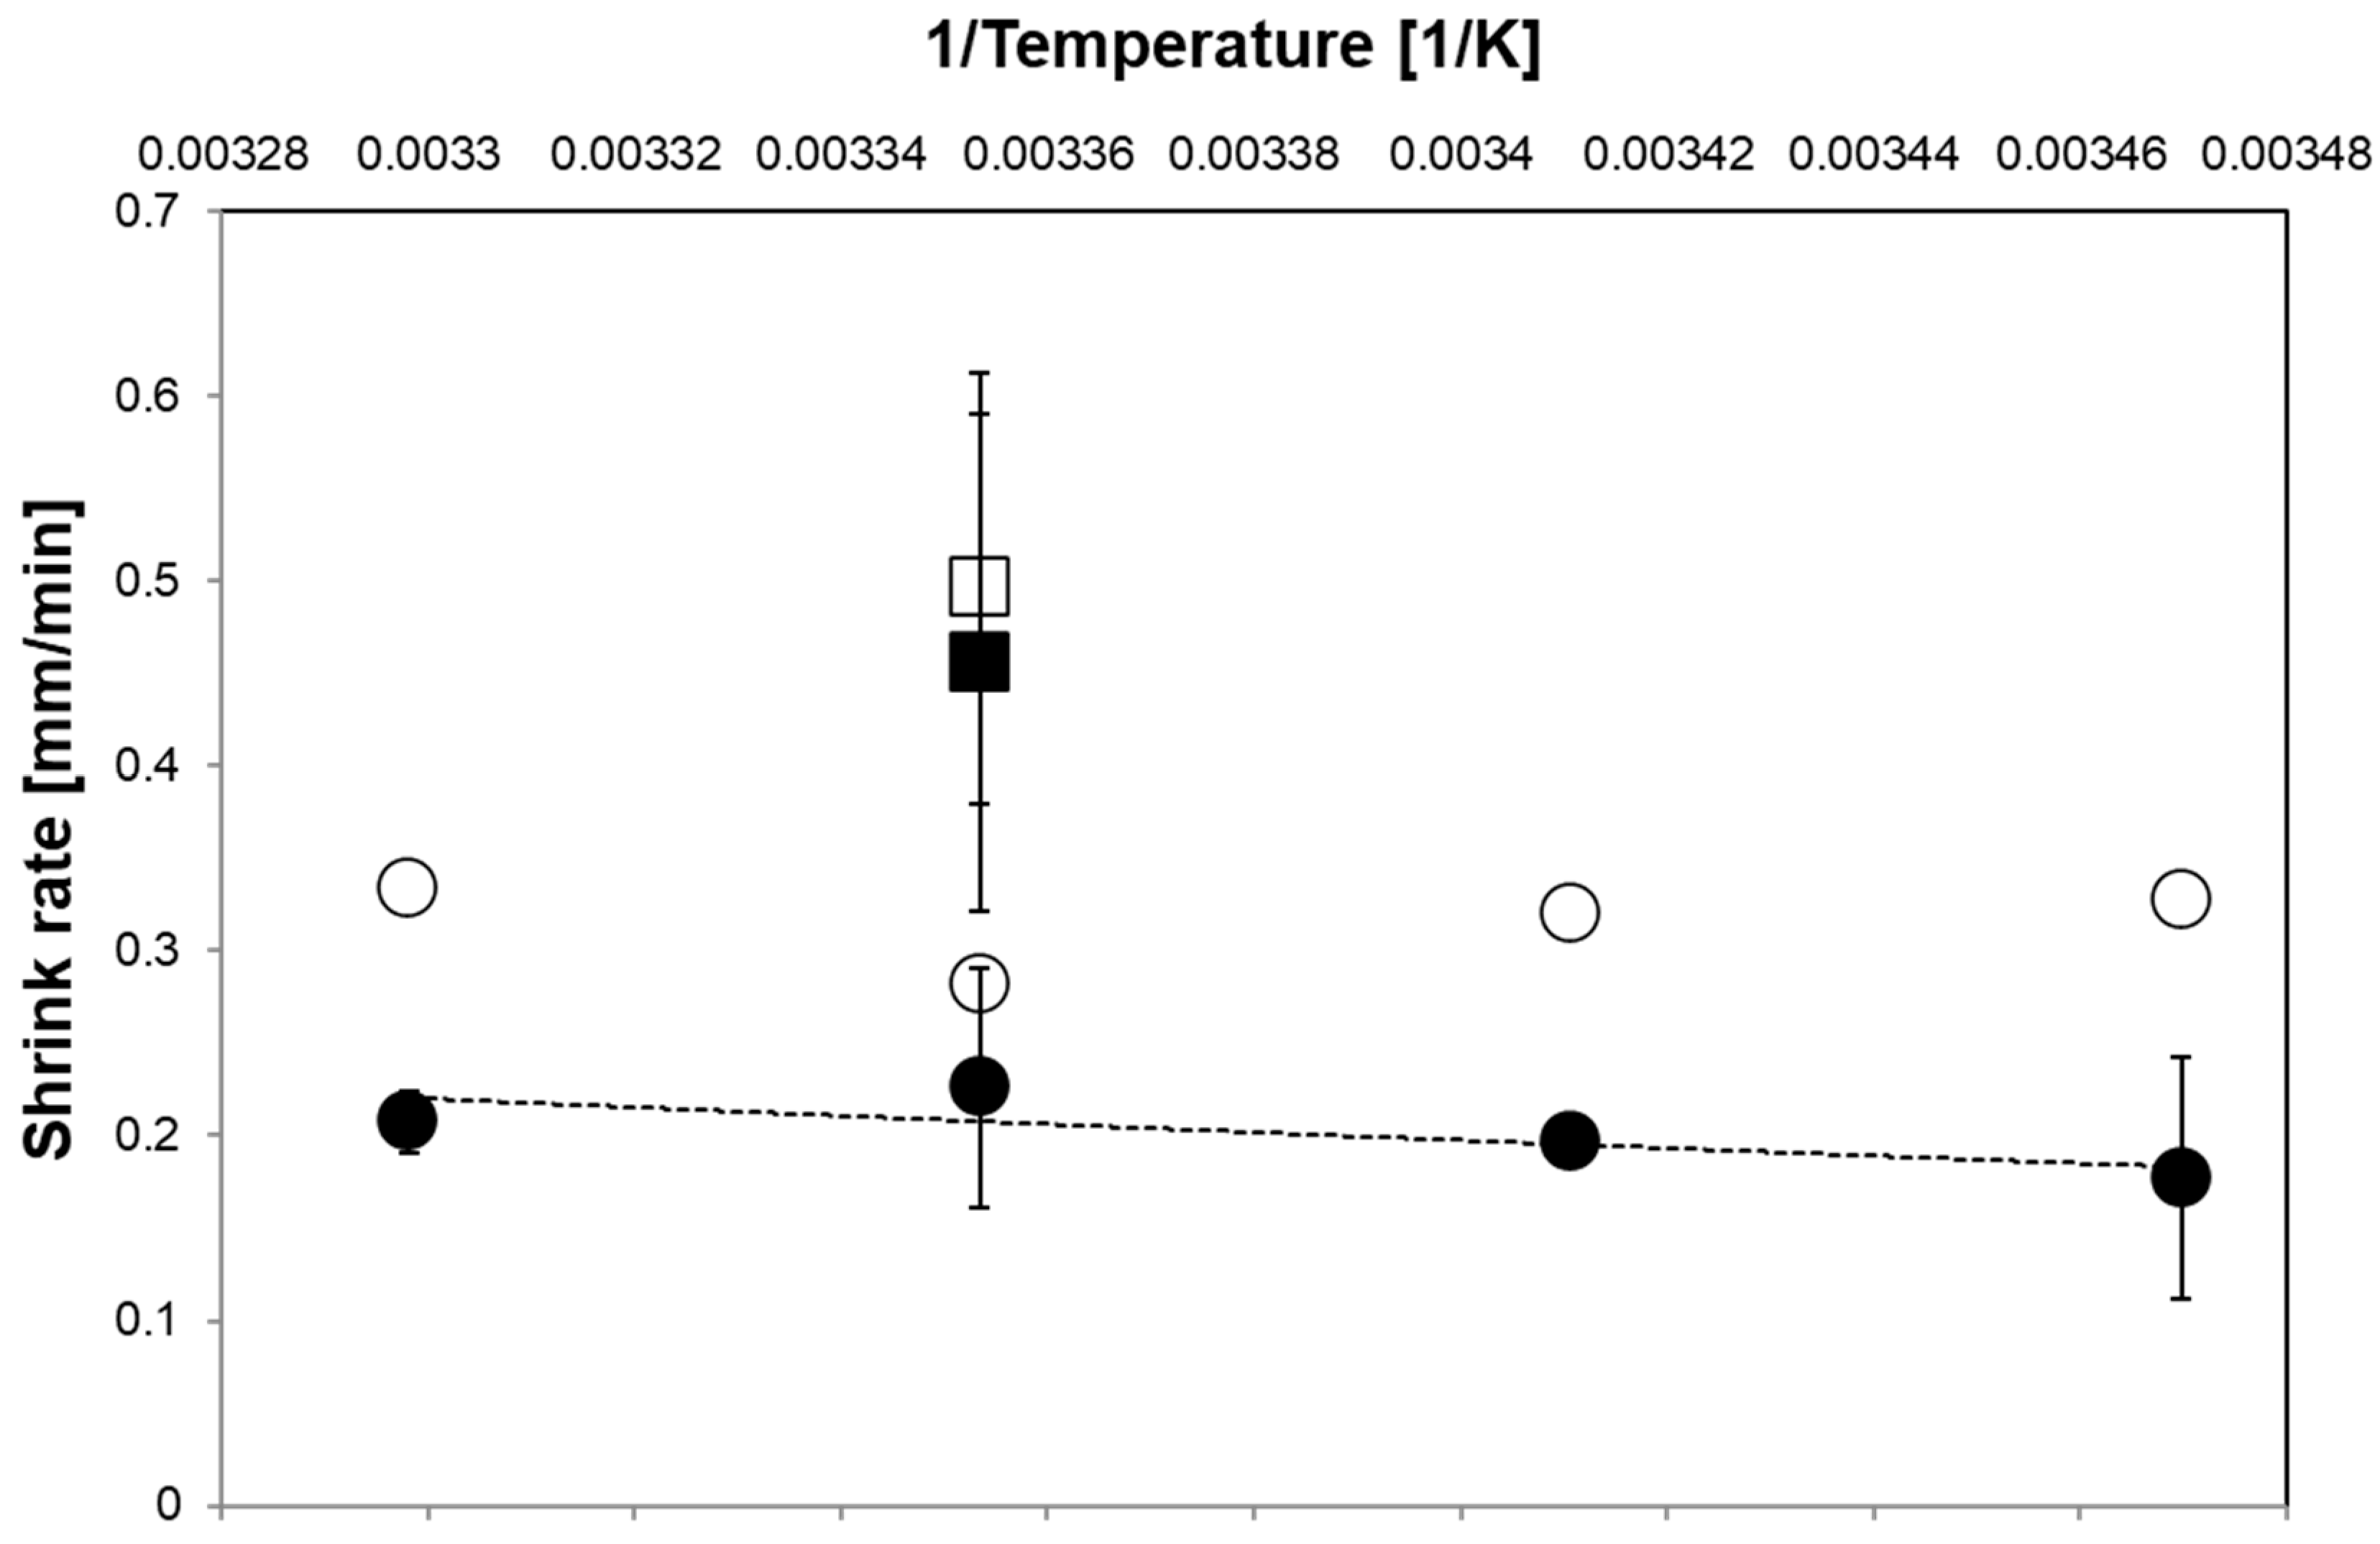
where m is the mass of a bubble, t is time, K is the mass transfer coefficient (for small bubbles), M = 16 g/mol is the molecular weight of CH4, A is the surface area of the bubble, Cs is the saturation concentration of CH4 in the liquid, and C0 is the initial gas concentration in the liquid. For comparison with the present experimental results, the ascent rate, which is needed to determine the value of K, is equivalent to the flow rate of the water in the water tunnel test section. Cs was estimated from the table in Duan and Mao [42], and C0 was assumed to equal the total mass of CH4 injected into the 100 L of water contained in the DOS. The initial bubble diameter was set at 1.5 mm. For these parameters, Equation (2) predicts values for the dissolution rates of CH4 bubbles presented in Figure 5.
As shown in the Figure, the agreement between measured and predicted dissolution rates is quite good for the pure water case, but slightly less so for the seawater cases. The model-estimated dissolution rates of CH4 bubbles in seawater were larger than the experimental results over the entire temperature range tested. Moreover, the predicted trend in the rates of dissolution with temperature is a mirror image of the data. Given these differences, it is worthwhile, therefore, to consider the possibility that the mechanism of dissolution of buoyant CH4 bubbles moving through water may be different from the conventional one employed in previous studies.
It should be noted that differences between the data and the model may be associated, to some degree, with the types and amounts of components in the gas. Since natural gas includes other hydrocarbons besides CH4 and also acid gases, the mixture solubility would be slightly different from that of the pure CH4 used in this study. Thus, further experiments are required to investigate these effects on the gas bubble dissolution process.
As shown in Figure 4, the temperature dependency of the dissolution rate exhibits a positive trend; that is, the dissolution rate increases with temperature. Equation (2) assumes that dissolution depends directly on the solubility of the gas in the liquid. Since the solubility of gases in liquid typically decreases at higher temperature, Equation (2) would not replicate the present experimental observations. As an alternative, we posit that the dissolution of gas bubbles may proceed via a thermal activation process described by:
V = V0 exp (−Q/RT),
where V0 is a pre-exponential constant, Q is the activation energy, R is the gas constant, and T is the absolute temperature of the system. If Equation (3) is fitted to the data in Figure 5 (shown as the dotted line), a value of Q of about 9.0 kJ/mol (R2 = 0.60) is obtained. This is of the same order as the activation energy of CH4 diffusion in pure water, approximately 11 kJ/mol [43]. It does not appear unreasonable, therefore, to propose that the rate-determining step of CH4 dissolution from a gas bubble into liquid is the diffusion of dissolved CH4 away from the bubble boundary layer to the bulk water. The transfer of solute molecules across the phase barrier is included in the governing equation. This transfer is expected to proceed much faster than outward (i.e., toward the water phase) diffusion from the interface. Hence, the rate-determining gas diffusion step (i.e., the dissolved gas molecules diffusing away from the gas-liquid boundary into the bulk water phase) must be included in the set of governing equations of CH4 dissolution models.

4. Conclusions

Environmental impact assessments of the production of natural gas from hydrate (NGH) reservoirs in the seabed requires the development of models that can accurately simulate the behavior of CH4 gas released into the water column. To date, many laboratory experiments and field studies have been conducted in order to investigate the dissolution process of CH4 bubbles and to provide physical insight and data for predictive models. Most of these laboratory studies, however, have employed pure water, while field tests have been performed in the ocean. Experiments that have compared the behavior of CH4 bubbles in pure water and seawater under identical conditions are scarce. Thus, the influence of several key factors, such as salinity, on the accuracy of model predictions remains unclear. In this study, the dissolution of single CH4 bubbles in pure water and in artificial seawater was observed under similar pressure, temperature, and bubble size conditions using a unique Deep Ocean Simulator facility. It was found that bubbles dissolved in pure water at approximately twice the rate of bubbles in seawater and that dissolution rates in seawater appeared to increase slightly with temperature between 288 K and 303 K. These data were compared with corresponding dissolution rates calculated by models used in various NGH development projects. The measured and predicted rates in pure water were in good agreement; however, experimental data obtained with seawater yielded smaller bubble shrinkage rates than the model results. The temperature dependency of the bubble dissolution rate observed in the experiments appears to suggest that the rate of dissolution of CH4 bubbles is limited not by the rate of transfer of CH4 molecules across the phase interface but rather by the diffusion of dissolved CH4 molecules from the interfacial zone to the bulk water phase. We propose that this rate-determining step be considered for inclusion in CH4 bubble dissolution models to improve the accuracy of the model results.

Supplementary Materials

The following are available online at https://www.mdpi.com/1996-1073/13/15/3938/s1. Video S1: a sample of the bubble tracking animation.

Author Contributions

Conceptualization, T.U., N.T., and S.M.M.; methodology, I.N., B.Y., and S.M.M.; software, I.N. and I.Y.; validation, T.U., T.F., B.Y., and S.M.M.; formal analysis, I.Y. and T.F.; investigation, I.N. and A.O.; resources, I.N. and B.Y.; data curation, A.O.; writing—original draft preparation, T.U. and A.O.; writing—review and editing, I.N., B.Y., and S.M.M.; visualization, T.U. and I.N.; supervision, N.T., T.F., and S.S.M.; project administration and funding acquisition, N.T. All authors have read and agreed to the published version of the manuscript.

Funding

This study was conducted as a part of the methane hydrate research project funded by METI (the Ministry of Economy, Trade and Industry, Japan). Partial funding for the University of Hawaii co-authors was also provided by the Office of Naval Research via grant number N00014-17-1-2206.

Acknowledgments

The authors would like to thank N. Arata and M. Nakatsuka (Japan Oil, Gas and Metals National Corporation) for their fruitful discussion, and R. Kanno (Hawaii Natural Energy Institute) for his experimental support.

Conflicts of Interest

The funders had no role in the design of the study; in the collection, analyses, or interpretation of data; in the writing of the manuscript; or in the decision to publish the results.

References

  1. Kvenvolden, K. Methane hydrate–a major reservoir of carbon in the shallow geosphere? Chem. Geol. 1998, 71, 41–51. [Google Scholar] [CrossRef]
  2. Masuda, Y.; Uchida, T.; Nagakubo, S.; Satoh, M. Methane Hydrates. In Fossil Fuels World Scientific Series in Current Energy Issues; Crawley, G.M., Ed.; World Scientific Pub. Co. Pte. Ltd.: Singapore, 2016; Volume 1, Chapter 10; pp. 289–327. [Google Scholar]
  3. Argentino, C.; Conti, S.; Crutchley, G.J.; Fioroni, C.; Fontana, D.; Johnson, J.E. Methane-derived authigenic carbonates on accretionary ridges: Miocene case studies in the northern Apennines (Italy) compared with modern submarine counterparts. Mar. Pet. Geol. 2019, 102, 860–872. [Google Scholar] [CrossRef]
  4. Dickens, G.; O’Neil, J.; Rea, D.; Owen, R. Dissociation of oceanic methane hydrate as a cause of the carbon isotope excursion at the end of the Paleocene. Paleoceanography 1995, 10, 965–971. [Google Scholar] [CrossRef]
  5. Kvenvolden, K. Methane hydrates and global climate. Glob. Biogeochem. Cycles 1988, 2, 221–229. [Google Scholar] [CrossRef] [Green Version]
  6. Sultan, N.; Cochonat, P.; Foucher, J.P.; Mienert, J. Effect of gas hydrates melting on seafloor slope instability. Mar. Geol. 2004, 213, 379–401. [Google Scholar] [CrossRef] [Green Version]
  7. U.S. Environmental Protection Agency. Understanding Global Warming Potentials. Available online: https://www.epa.gov/ghgemissions/understanding-global-warming-potentials (accessed on 8 April 2020).
  8. Schmidt, G.A.; Shindell, D.T. Atmospheric composition, radiative forcing, and climate change as a consequence of a massive methane release from gas hydrates. Paleoceanography 2003, 18, 1004. [Google Scholar] [CrossRef] [Green Version]
  9. Carozza, D.A.; Mysak, L.A.; Schmidt, G.A. Methane and environmental change during the Paleocene-Eocene thermal maximum (PETM): Modeling the PETM onset as a two-stage event. Geophys. Res. Lett. 2011, 38, L05702. [Google Scholar] [CrossRef]
  10. Socolofsky, S.A.; Adams, E.E.; Sherwood, C.R. Formation dynamics of subsurface hydrocarbon intrusions following the Deepwater Horizon blowout. Geophys. Res. Lett. 2011, 38, L09602. [Google Scholar] [CrossRef] [Green Version]
  11. Maini, B.B.; Bishnoi, P.R. Experimental investigation of hydrate formation behavior of a natural gas bubble in a simulated deep sea environment. Chem. Eng. Sci. 1981, 36, 183–189. [Google Scholar] [CrossRef]
  12. Masutani, S.M.; Adams, E.E. Experimental Study of Multi-Phase Plumes with Application to Deep Ocean Oil Spills; Final Report, Contract 1435-01-98-CT-30964; U.S. Department of the Interior Minerals Management Service: Herndon, VA, USA, 2000. [Google Scholar]
  13. Bigalke, N.K.; Rehder, G.; Gust, G. Methane hydrate dissolution rates in undersaturated seawater under controlled hydrodynamic forcing. Mar. Chem. 2009, 115, 226–234. [Google Scholar] [CrossRef]
  14. Bigalke, N.K.; Enstad, L.I.; Rehder, G.; Alendal, G. Terminal velocities of pure and hydrate coated CO2 droplets and CH4 bubbles rising in a simulated oceanic environment. Deep Sea Res. Part I Oceanogr. Res. Pap. 2010, 57, 1102–1110. [Google Scholar] [CrossRef]
  15. Warzinski, R.P.; Lynn, R.; Haljasmaa, I.; Leifer, I.; Shaffer, F.; Anderson, B.J.; Levine, J.S. Dynamic morphology of gas hydrate on a methane bubble in water: Observations and new insights for hydrate film models. Geophys. Res. Lett. 2014, 41, 6841–6847. [Google Scholar] [CrossRef]
  16. Chen, L.; Levine, J.S.; Gilmer, M.W.; Sloan, E.D.; Koh, C.A.; Sum, A.K. Methane hydrate formation and dissociation on suspended gas bubbles in water. J. Chem. Eng. Data 2014, 59, 1045–1051. [Google Scholar] [CrossRef]
  17. Topham, D.R. Observations of the Formation of Hydrocarbon Gas Hydrates at Depth in Seawater; Catalogue No. IOS Note-4; Institute of Ocean Sciences: Patricia Bay, BC, Canada, 1978; p. 8. [Google Scholar]
  18. Rehder, G.; Brewer, P.W.; Peltzer, E.T.; Friederich, G. Enhanced lifetime of methane bubble streams within the deep ocean. Geophys. Res. Lett. 2002, 29, 21-1–21-4. [Google Scholar] [CrossRef] [Green Version]
  19. Rehder, G.; Kirby, S.H.; Durham, W.B.; Stern, L.A.; Peltzer, E.T.; Pinkston, J.; Brewer, P.G. Dissolution rates of pure methane hydrate and carbon-dioxide hydrate in undersaturated seawater at 1000-m depth. Geochim. Cosmochim. Acta 2004, 68, 285–292. [Google Scholar] [CrossRef]
  20. Rehder, G.; Leifer, I.; Brewer, P.G.; Friederich, G.; Peltzer, E.T. Controls on methane bubble dissolution inside and outside the hydrate stability field from open ocean field experiments and numerical modeling. Mar. Chem. 2009, 114, 19–30. [Google Scholar] [CrossRef]
  21. Johansen, Ø.; Rye, H.; Cooper, C. DeepSpill––Field Study of a Simulated Oil and Gas Blowout in Deep Water. Spill Sci. Technol. Bull. 2003, 8, 433–443. [Google Scholar] [CrossRef]
  22. Maksimov, A.O.; Sosedko, E.V. Dynamics of sea bubbles covered by a hydrate skin. In Proceedings of the. XVI Session of the Russian Acoustical Society, Moscow, Russia, 14–18 November 2005; pp. 459–462. [Google Scholar]
  23. Greinert, J.; Artemov, Y.; Egorov, V.; De Batist, M.; McGinnis, D. 1300-m-high rising bubbles from mud volcanoes at 2080m in the Black Sea: Hydroacoustic characteristics and temporal variability. Earth Planet. Sci. Lett. 2006, 244, 1–15. [Google Scholar] [CrossRef]
  24. Juanes, R. Fate of Methane Emitted from Dissociating Marine Hydrates: Modeling, Laboratory, and Field Constraints; DOE Project (No. DOE-MIT-0013999); Massachusetts Inst. of Technology (MIT): Cambridge, MA, USA, 2018. [Google Scholar]
  25. Wang, B.; Socolofsky, S.A.; Breier, J.A.; Seewald, J.S. Observations of bubbles in natural seep flares at MC 118 and GC 600 using in situ quantitative imaging. J. Geophys. Res. Ocean. 2014, 121, 2203–2230. [Google Scholar] [CrossRef] [Green Version]
  26. Johansen, C.; Todd, A.C.; MacDonald, I.R. Time series video analysis of bubble release processes at natural hydrocarbon seeps in the Northern Gulf of Mexico. Mar. Pet. Geol. 2017, 82, 21–34. [Google Scholar] [CrossRef] [Green Version]
  27. Johansen, O. DeepBlow—A Lagrangian Plume Model for Deep Water Blowouts. Spill Sci. Technol. Bulletin 2000, 6, 103–111. [Google Scholar] [CrossRef]
  28. Yapa, P.D.; Zheng, L.; Chen, F. A Model for Deepwater Oil/Gas Blowouts. Mar. Pollut. Bull. 2001, 43, 234–241. [Google Scholar] [CrossRef]
  29. Zheng, L.; Yapa, P.D.; Chen, F. A model for simulating deepwater oil and gas blowouts–Part I: Theory and model formulation. J. Hydraul. Res. 2002, 41, 339–351. [Google Scholar] [CrossRef]
  30. Zheng, L.; Yapa, P.D. Modeling gas dissolution in deepwater oil/gas spills. Geophys. Res. Lett. 2002, 29, 299–309. [Google Scholar] [CrossRef]
  31. Chen, F.; Yapa, P.D. A model for simulating deep water oil and gas blowouts–Part II: Comparison of numerical simulations with “Deepspill” field experiments. J. Hydraul. Res. 2003, 41, 353–365. [Google Scholar] [CrossRef]
  32. Yapa, P.D.; Chen, F. Behavior of oil and gas from deepwater blowouts. J. Hydraul. Eng. 2004, 130, 540–553. [Google Scholar] [CrossRef] [Green Version]
  33. McGinnis, D.F.; Greinert, J.; Artemov, Y.; Beaubien, S.E.; Wüest, A. Fate of rising methane bubbles in stratified waters: How much methane reaches the atmosphere? J. Geophys. Res. Ocean. 2006, 111(C9), C09007. [Google Scholar] [CrossRef] [Green Version]
  34. Yapa, P.D.; Dasanayaka, L.K.; Bandara, U.C.; Nakata, K. A model to simulate the transport and fate of gas and hydrates released in deepwater. J. Hydraul. Res. 2010, 48, 559–572. [Google Scholar] [CrossRef]
  35. Wimalaratne, M.R.; Yapa, P.D.; Nakata, K.; Premathilak, L.T. Transport of dissolved gas and its ecological impact after a gas release from deepwater. Mar. Pollut. Bull. 2015, 100, 279–288. [Google Scholar] [CrossRef]
  36. Nakata, K.; Arata, N.; Yapa, P.D. Development of a model to simulate methane gas and methane hydrates plumes in deepwater. J. Adv. Mar. Sci. Technol. Soc. 2015, 21, 37–57, (In Japanese with English Abstract). [Google Scholar]
  37. Premathilake, L.T.; Yapa, P.D.; Nissanka, I.D.; Kumarage, P. Impact on water surface due to deepwater gas blowouts. Mar. Pollut. Bull. 2016, 112, 365–374. [Google Scholar] [CrossRef] [PubMed]
  38. Takagi, Y.; Kawahara, S.; Okano, Y.; Kato, N. Numerical Simulation of Methane Seeping from the Seabed in the Japan Sea. J. Chem. Eng. Jpn. 2017, 50, 244–253. [Google Scholar] [CrossRef]
  39. Labs of Instant Ocean. Science behind synthetic sea salts. SeaScope 2008, 24, 3–4. Available online: http://www.instantocean.com/~/media/UPG/Files/Instant%20Ocean/SeaScope/Volume%2024%20Fall.ashx (accessed on 9 May 2020).
  40. Holder, E.L.; Conmy, R.N.; Venosa, A.D. Comparative laboratory scale testing of dispersant effectiveness of 23 crude oils using four different testing protocols. J. Environ. Prot. 2015, 6, 628–639. [Google Scholar] [CrossRef] [Green Version]
  41. Vascanselos, J.M.T.; Rodrigues, J.M.L.; Orvalho, S.C.P.; Alves, S.S.; Mendes, R.L.; Reis, A. Effect of contaminants on mass transfer coefficients in bubble column and airlift contactors. Chem. Eng. Sci. 2003, 58, 1431–1440. [Google Scholar] [CrossRef]
  42. Duan, Z.; Mao, S. A thermodynamic model for calculating methane solubility, density and gas phase composition of methane-bearing aqueous fluids from 273 to 523 K and from 1 to 2000 bar. Geochim. Cosmochim. Acta 2006, 70, 3369–3386. [Google Scholar] [CrossRef]
  43. Witherspoon, P.A.; Saraf, D.N. Diffusion of Methane, Ethane, Propane, and n-Butane. J. Phys. Chem. 1965, 69, 3752–3755. [Google Scholar] [CrossRef]
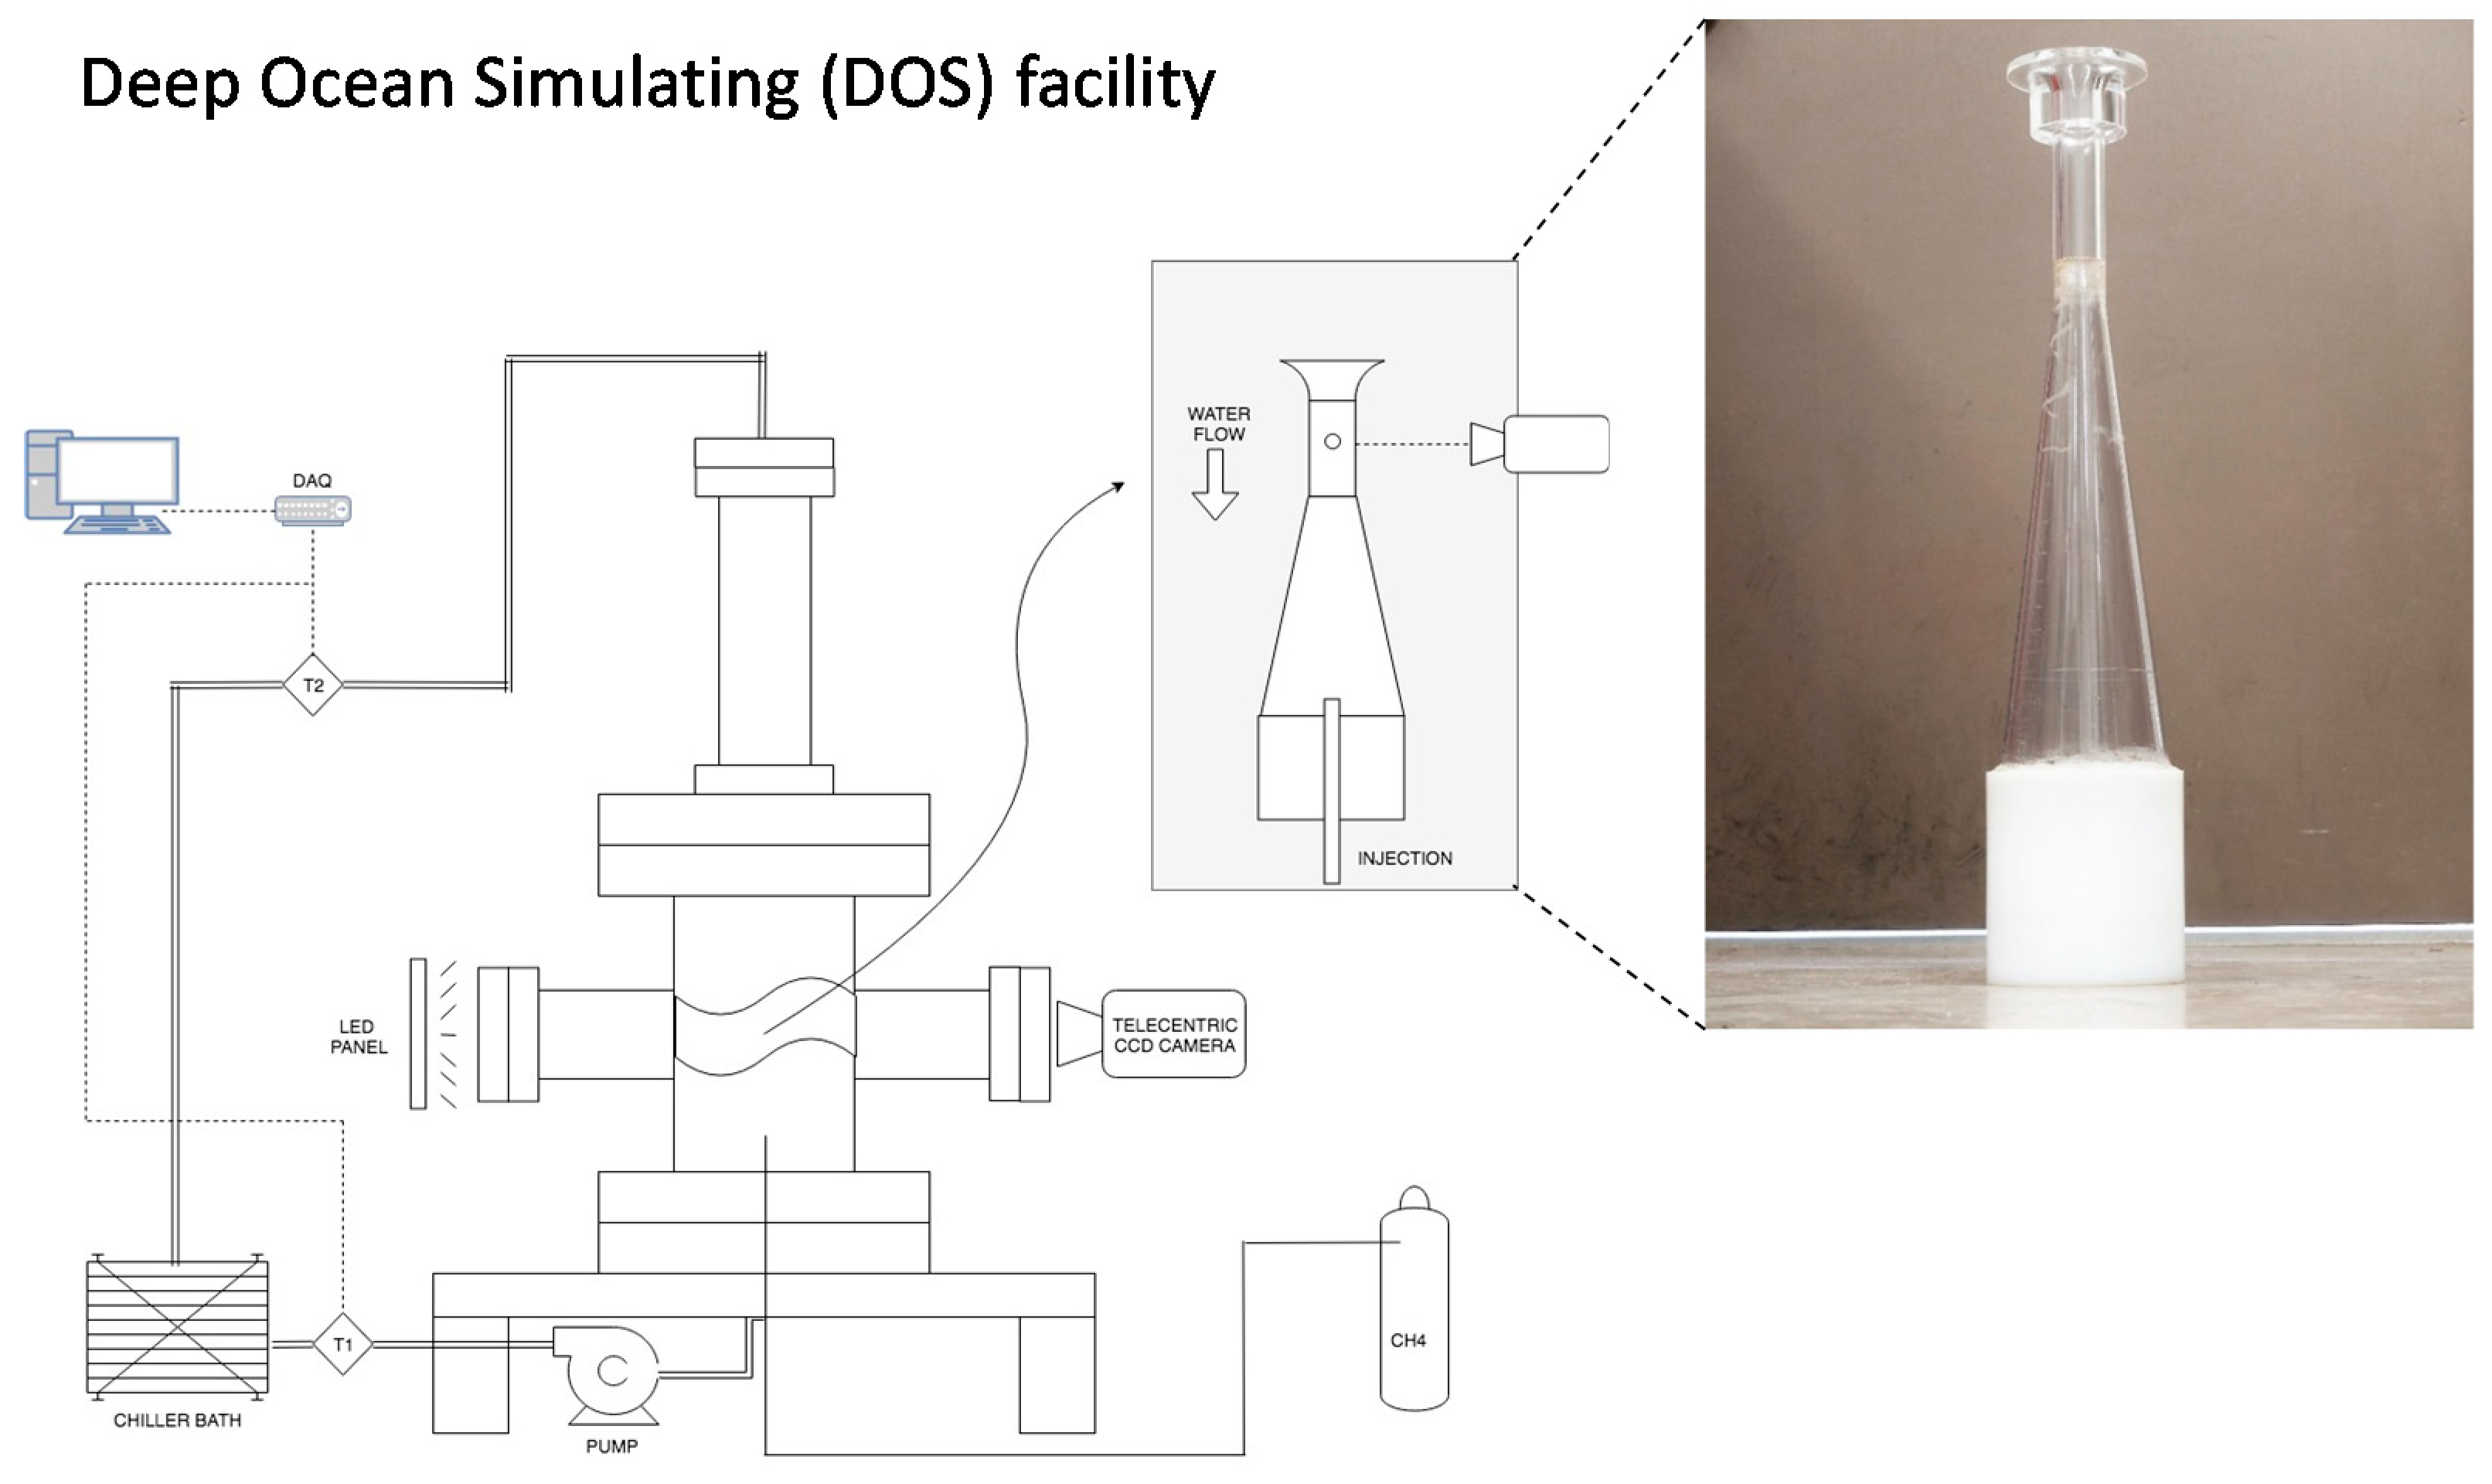
Figure 1. Schematic diagram of the Deep Ocean Simulator (DOS) facility.
Energies 13 03938 g001
Figure 2. CH4 bubble (about 1.5 mm in diameter) in pure water at temperature of 288 K.
Energies 13 03938 g002
Figure 3. Equivalent diameter decrease during dissolution.
Energies 13 03938 g003
Figure 4. Temperature dependence of dissolution rate.
Energies 13 03938 g004
Figure 5. Temperature dependence of dissolution rates. Solid marks are experimental data, and open marks are model predictions. The error bars represent the standard deviations of the replicates. Square marks correspond to dissolution in pure water, and circles, to the seawater case. The dotted line is a fitted curve for the experimental data for seawater that is calculated using Equation (3).
Energies 13 03938 g005