Article

Value Co-Creation Behavior in Green Supply Chains: An Empirical Study

1
School of Economics and Management, Beijing Jiaotong University, Beijing 100044, China
2
School of Business Administration, Zhongnan University of Economic and Law, Wuhan 430073, China
*
Author to whom correspondence should be addressed.
Energies 2020, 13(15), 3902; https://doi.org/10.3390/en13153902
Submission received: 10 June 2020 / Revised: 19 July 2020 / Accepted: 24 July 2020 / Published: 30 July 2020
(This article belongs to the Special Issue Green Energy Technology)

Abstract

:
As an important supply chain development strategy, green investment and sustainability are concerns of the government and enterprises. However, due to the high cost and low profit of green investment, a large number of small and medium-sized firms can be deterred from their implementation. Value co-creation has become a key measure to solve this problem. This article explores the relationship between the green supply chain (GSC) strategy, value co-creation, and corporate performance in the manufacturing environment, and considers the regulatory effects of internal environmental factors and external environmental pressures on this relationship. Based on data from 115 manufacturers in China, we tested the hypotheses, explained the statistical results, and identified key concerns for implementing GSC through value co-creation. The findings reveal that the GSC strategy can promote a high level of firms’ value co-creation with their supply chain partners, and different value co-creation modes have different effects on firm performance (i.e., operational performance, innovation performance, and financial performance). In addition, the findings indicate that macro-level external pressure and micro-level internal support could enhance such effects. This study enriches the literature with value co-creation modes and GSC management by integrating GSC strategies and value co-creation strategies, providing confidence to the firms and their supply chain partners in value co-creation, thus helping them to better implement a GSC strategy.

1. Introduction

Green sustainable development is a very important supply chain strategy, which has received widespread attention worldwide [1,2]. Increasing public awareness, increasingly stringent government regulatory requirements, and market pressures have forced many companies to incorporate green and sustainable development into their supply chain [3]. In China, with its rapid economic development, resource and environmental problems are becoming more and more serious such as severe smog, lack of water, soil pollution, etc. Additionally, these resource waste and pollutant emissions mainly come from manufacturing industries. Therefore, the Chinese government and the Ministry of Environmental Protection (MEP) have promulgated and implemented stricter government regulatory policies, forcing many manufacturers to focus on sustainable supply chain. In fact, many manufacturers have started green sustainable supply chain management, which is more important than some supply chain management issues (such as integration and cooperation), raising environmental awareness such as green procurement, green transportation, green packaging, etc., and strives to promote suppliers implement environmental management.
Effective management of a green supply chain (GSC) requires an expanded perspective beyond a focus company including supply chain partners [4]. Value co-creation is considered as a business cooperation strategy for supply chain partners. As the cost of green innovation is relatively high, some manufacturers have started to cooperate with other enterprises in the supply chain (such as suppliers and retailers) to jointly develop green products and technologies [1,5]. For example, companies such as BMW, Patagonia, and the Body Shop have taken a sustainable approach by developing innovative environmentally friendly products with their consumers and have realized that the development of green products/services has become a new competitive advantage for their firms [1].
The current literature relevant to co-creation indicates that it is conducive to the deep cooperation between supply chain enterprises [4]. For the value co-creation of GSC, it is beneficial for upstream and downstream firms to share green technology investment and improve the efficiency of the whole supply chain [6]. However, there are contradicting views on the impact of co-creation on supply chain performance. For example, some literature suggests that value co-creation could cause organizational conflicts such as relationship conflict (i.e., the incompatibility in buyer-supplier manufacturer relationship) and task conflict (i.e., the differences in positions and ideas of tasks performed by suppliers and manufacturers), thereby causing a negative impact on performance [7,8,9]. Thus, the connotation of value co-creation and its impact on performance in the context of green supply chain are still unclear and need to be explored.
As a complex system, manufacturing is directly or indirectly related to the creation of economic wealth and impacts on the product life cycle of the natural environment and social systems [6]. Due to different sectors, the internal and external contextual factors of the manufacturer have an important impact on the implementation of the manufacturing supply chain strategy. The internal environment support mainly refers to some internal firm factors that influence the activities of the enterprise (e.g., the staff, culture, and operations process [8,10]). For example, some of the literature indicates that the attitude and ability of managers is highly relevant with the implementation of a green supply chain and value co-creation [8,10]. The external environmental pressures refer to the macro-factors such as marketing pressure and institutional pressures. Indeed, some literature suggests that internal contextual factors could have some influence on the implementation of supply chain strategies [10]. Thus, we need to further explore the actual impact of these contextual factors on the implementation of a green supply chain.
This paper mainly focused on two problems: (1) How does the firm’s green supply chain strategy impact the performance by value co-creation behaviors? and (2) How does the internal environment support and external contextual factors impact on the relationship between green strategy adoption and value co-creation? First, this paper proposes a theoretical model of value co-creation under the green supply chain strategy and further posited the hypotheses in Figure 1. We examined 115 manufacturers through a series of statistical methods. Our findings indicate that adoption of the green supply chain strategy by firms can indeed improve operational performance, financial performance, and even innovation performance by a value co-creation strategy. In addition, external and internal contextual factors have a different moderating effect on the relationship between GSC strategy, value co-creation, and performance. Our findings enrich the literature relevant to co-creation by exploring new insights into green supply chain strategies and considering the roles of some contextual factors. In addition, our findings enhance the internal power of manufacturers and their upstream and downstream firms to implement a green supply chain management and provide some suggestions for practitioners.
The main contributions of this paper are as follows: This paper innovatively studies the green supply chain management from the perspective of value co-creation. Regarding the selection of value co-creation behavior factors, this paper considers three different value co-creation behaviors between manufacturers, suppliers, competitors, and retailers. This paper evaluates corporate performance from three aspects: operational performance, innovative performance, and financial performance. At the same time, this paper analyzed the coordination effect of the internal environment and external environment on the value co-creation of a green supply chain. In the internal environment, this paper particularly studied the influence of the digital level of enterprises on green value co-creation, which is innovative to some extent.
The rest of this paper is arranged as follows. Section 2 introduces the literature review of related topics. Section 3 explains the conceptual model of the hypothesis. Section 4 introduces the research methods, and Section 5 introduces the results of the empirical analysis. Section 6 discusses the main findings and Section 7 introduces the conclusions, limitations, and future research directions.

2. Literature Review

2.1. Cooperation in Green Supply Chain

Green supply chain cooperation has an important impact on sustainable product development and operations mode [11,12,13,14,15] and has become a positive change in corporate strategy for various companies [14,15]. Cooperation can be divided into vertical and horizontal cooperation and among the two types of cooperation and their cooperation performance is impacted by different ways [16,17,18,19,20,21,22]. The literature shows that vertical cooperation in the supply chain can improve supply chain decision-making and performance through information sharing, thereby achieving a win–win situation [16,17,18]. In the horizontal cooperation, two competitive retailers can cooperate to purchase and obtain a quantity discount, thereby influencing their profits [19].
In addition, for the purpose of realizing the green and economic performance of products, supply chain members mainly adopt two typical ways in the green cooperation of a supply chain: alliance and cost sharing contracts [23]. For example, Ge et al. showed that both cooperation and competition will tend toward a green technology alliance, and the company’s decision to cooperate will change with the change in the endogenous knowledge sharing rate [24,25,26].The second model is to stimulate the green investment of members through supply chain contracts and deal with the coordination of green channels. For example, Yenipazarli et al. analyzed the effects of retailer supplier cooperation on profit/cost and the environmental effects on the supply chain under two upstream and downstream contracts [27]. When members of the supply chain share the cost, on one hand, it can make products greener. On the other hand, it can make the overall profit of the supply chain increase [21,28,29,30]. Therefore, it is necessary to discuss how to cooperate with supply chain partners to improve corporate performance.

2.2. Value Co-Creation Behavior in the Supply Chain

Michael (1980) suggests that the value creation of an enterprise is composed of internal production and operations routines that create value. However, with the continuous change in the market competition environment, the creation process of enterprise value cannot be limited to the inside of the enterprise [31], but is co-created by the cooperative network composed of enterprises [32]. Enterprises can improve the efficiency, quality, cost, and other aspects of the whole supply chain through cooperative implementation of strategic management [33].
Prahalad et al. proposed value co-creation as a new method of value creation [34] and believe that value originates not only from producers, but from the joint creation of consumers and enterprises or other relevant stakeholders. Ultimately, the value is determined by the consumer. From the perspective of stakeholders, the meaning of a “company” is a relationship that exists between individuals or groups that affect the company’s business or is affected by it, and the purpose for which a business is established forms the basis for whether a stakeholder establishes relationships and cooperates with them [35]. In this relationship, stakeholders are the unity of recipients of value and the value creators/co-creators [36]. Multiple stakeholders have an impact on the business environment and company efficiency by providing resources and benefit from it [37]. Therefore, the joint efforts of stakeholders are the most important part of value co-creation [38]. In addition, stakeholders must first have a common purpose to collaborate [39] and then also encourage the positive contributions of members [40].
Value creation usually occurs in the process of using products or services [41]. The fierce market competition requires the enterprises in the supply chain to strengthen cooperation and establish a value network. Many scholars have studied the vertical cooperation among enterprises, that is, the cooperation between enterprises and suppliers and retailers. Enterprises can create more value for the supply chain through information sharing, resource integration, and process integration with upstream and downstream partners [29,42,43,44,45,46,47]. Some scholars have also paid attention to the horizontal cooperation between supply chain enterprises and competitors, but there have been few studies. D’Aspremon et al. and Kamien et al. introduced the concept of horizontal Research & Development. cooperation in theory early on [48,49]; Ge et al. and Dai et al. compared different horizontal cooperation modes of green supply chain [22,23]; and Luo et al. studied the green technology investment of two manufacturers in a competitive and cooperative environment [50]. Gnyawali et al. applied practical case analysis, and concluded that competitive cooperation is beneficial to the development of advanced technology [51]. Therefore, our research focused on three different types of value co-creation: co-creation with suppliers, co-creation with retailers, and co-creation with competitors.

2.3. Value Co-Creation and Performance

Research shows that value co-creation behavior benefits both suppliers and customers [52]. For customers, value co-creation mainly focuses on the customer dimension, which is a relatively new research field [53]. Most of the relevant studies have focused on the development of measurement tools to study customer co-creation value across different research backgrounds [54,55,56]. Co-creation practices enable interaction and communication between customers and enterprises, so as to benefit customers who participate. Active participation in co-creating value makes them more satisfied than those who are not [57], encourages customers to be more innovative [58], and increases the customers’ enthusiasm and willingness to take risks [59]. At the same time, the perceived value gained from value co creation will increase customer commitment [60], and psychological attachment, which increases the willingness of customers to make more voluntary efforts in the cooperative relationship. The increase of customer value in value co-creation improves the customer experience in supplier relationships [61], and establishes customer loyalty [62].
For enterprises, value co-creation is realized through the establishment of a co-operation relationship between two or more parties in the supply chain, so as to jointly obtain strategic benefits and improve the operation efficiency, economic performance, and service performance of enterprises [63,64,65], which is also the key success factor of enterprises in delivering products and services [66]. Through value co-creation, companies have a positive impact on service performance and environmental performance [67,68]. Through the green internal innovation process and green technology investment research and development, it can promote enterprises to develop green energy-saving products and realize energy-saving and emissions reduction of the whole supply chain [69,70]. The optimal strategy of the enterprise and the performance of the supply chain will change due to different cooperation models [17,18,21,71]. Thus, this study will examine different performances (i.e., operational performance, innovation performance and financial performance) of value co-creation in the supply chain and the changes in performance under different contextual factors.

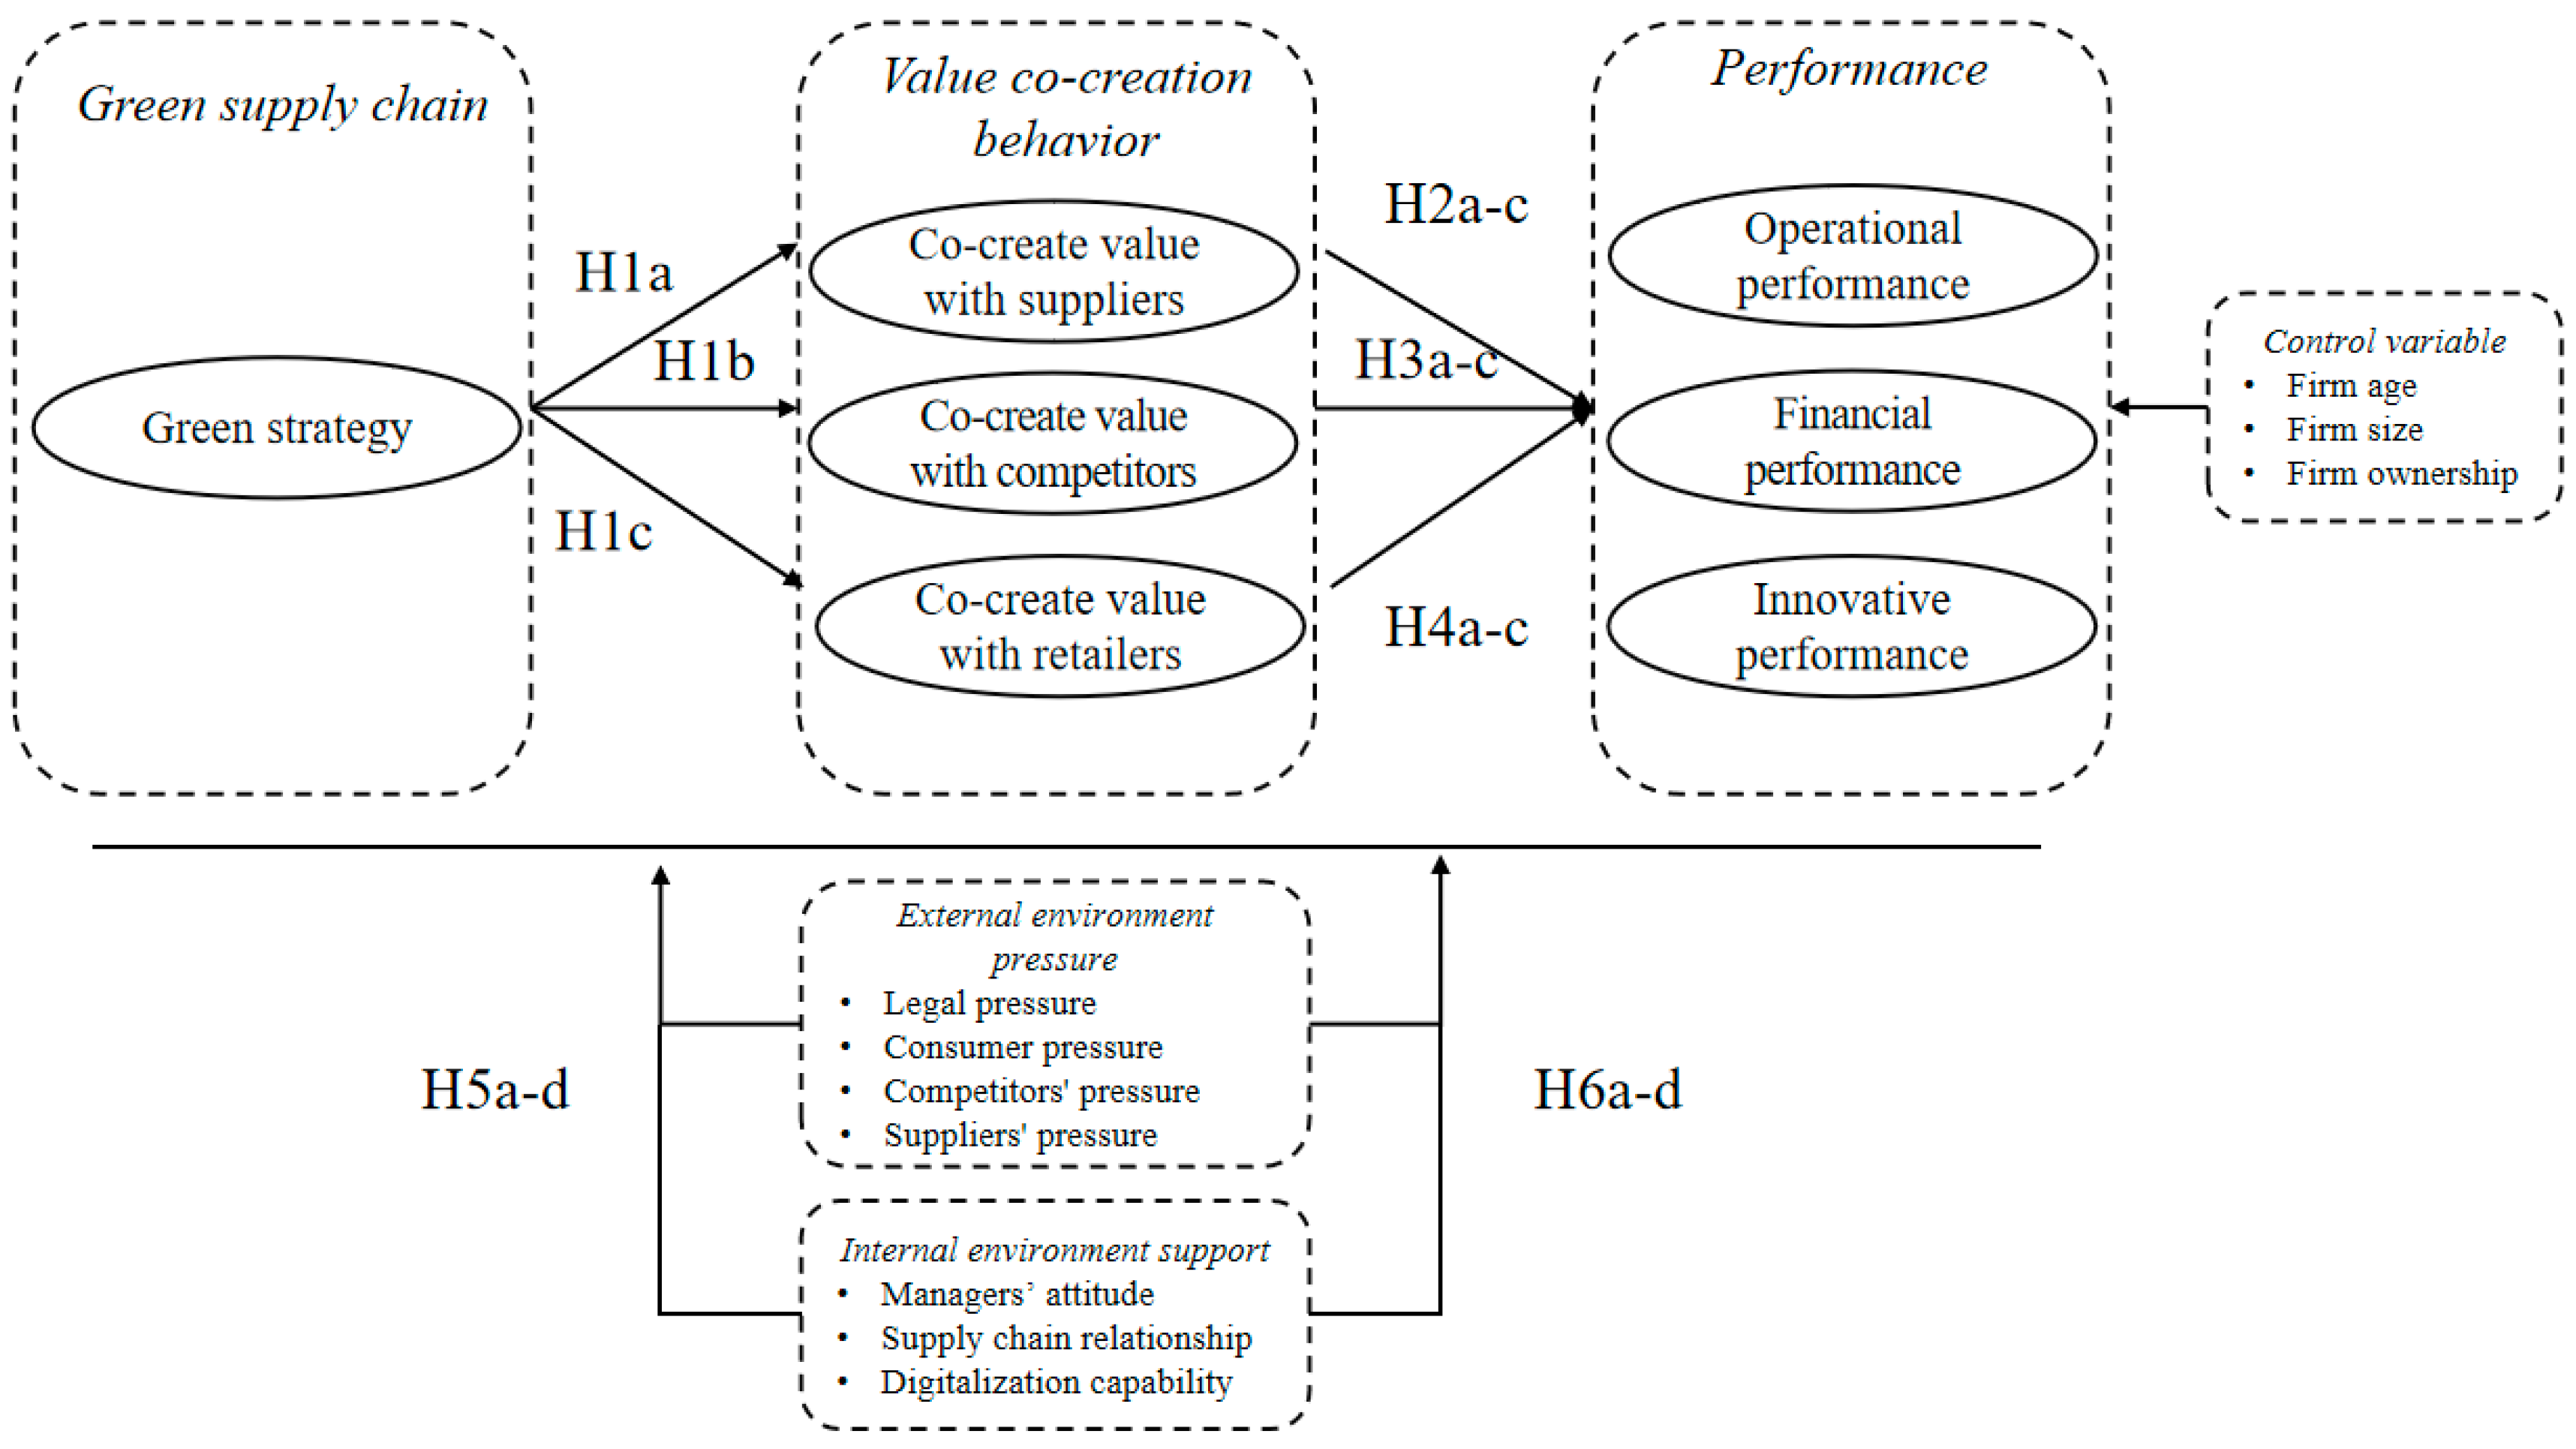
3. Hypotheses Development

3.1. The Relationship between Green Strategy and Value Co-Creation Behavior

A green strategy should not be a burden to firms. On the contrary, it will promote value co-creation among firms and increase the value of firms. A single enterprise may not achieve the goal of a green strategy completely or to a high degree, depending on its limited ability. Therefore, it is necessary to establish a strategic alliance with green environmental protection as the core between firms [72] to achieve the green strategic goals of ecological, economic, and social sustainable development. As a product of the times and social development, the green strategy has been recognized by all participants in the supply chain, and has formed a green strategic alliance with the upstream and downstream enterprises of the supply chain. The green supply chain strategy can promote the alliance participants to take a positive attitude to cooperate, jointly design products and systems that meet the production requirements, and establish a fair and reasonable cost sharing, risk sharing, and benefit distribution mechanism.
The implementation of green strategy promotes green procurement, which is regarded as the starting point to reduce environmental problems [73]. Cooperation between manufacturers and suppliers is the key to green procurement. Therefore, the deeper the implementation of the GSC strategy, the higher the manufacturer’s requirements for raw materials from suppliers, and the more likely the suppliers’ raw materials are to be customized, resulting in stronger interdependence between manufacturers and suppliers, more frequent value co-creation, and closer alliances between manufacturers and suppliers. Consequently, we propose (see Figure 1):
Hypothesis 1a (H1a).
Green Strategy of Manufacturers is Positively Related to Value Co-creation with their Suppliers.
With the growing popularity of green products, the consumers’ demand for green products has gradually increased. A single manufacturer may not be able to meet the consumers’ demand due to the size of the enterprise, so there may be multiple manufacturers producing the same type of green products. As the demand for green products increases, the revenue of the dominant manufacturers will increase significantly. However, the profit of following manufacturers may decrease, even lower than the level before cooperation [74]. Therefore, in order to promote common development, achieve win–win and mutual benefit, a contract may be drawn up between the two manufacturers for revenue distribution. The deeper the implementation of the green strategy, the larger the market size of manufacturers will be, and the more necessary it is for manufacturers to adopt co-creative behavior to secure cooperation. Thus, we propose:
Hypothesis 1b (H1b).
Green Strategy of Manufacturers is Positively Related to Value Co-creation with their Competitors.
As a downstream company in the supply chain, retailers directly contact consumers to understand their consumer preferences. Under the green strategy, retailers can share sales data with manufacturers to reduce the bullwhip effect [75] and assist manufacturers in designing green products that better meet consumer needs. When the green concept is accepted by more consumers, the value-creation behavior of retailers and manufacturers will become more frequent. Thus, we propose:
Hypothesis 1c (H1c).
Green Strategy of Manufacturers is Positively Related to Value Co-creation with their Retailers.

3.2. The Impact of Value Co-Creation Behavior on Firm Performance

By closely cooperating with each other to complete value creation (that is, value co-creation), companies can achieve performance that a single company cannot achieve by itself. Manufacturers work with suppliers, manufacturers in the same industry, and retailers to create value together. Through cooperation, they can design different business models to improve the operational efficiency of the enterprise, thereby improving the performance level [65]. The value co-creation behavior between firms can improve the quality of service and response speed. In the supply chain, companies share knowledge and information resources with partners through value co-creation, and use complementary capabilities to jointly deliver products and services to different customers [76], thereby improving the company’s operating performance. Consequently, we propose:
Hypothesis 2a (H2a).
Value Co-creation with their Suppliers is Positively Related to the Manufacturers’ Operational Performance in a Green Supply Chain.
Hypothesis 2b (H2b).
Value Co-creation with their Competitors is Positively Related to the Manufacturers’ Operational Performance in a Green Supply Chain.
Hypothesis 2c (H2c).
Value Co-creation with their Retailers is Positively Related to the Manufacturers’ Operational Performance in a Green Supply Chain.
The value co-creation behavior promotes mutual trust between participating companies and through the use of overall synergies. It can promote the improvement of corporate financial performance [77]. In the context of the Green Strategic Alliance, manufacturers sign a certain contract with the supplier to give the supplier a certain preferential price [72] to ensure the possibility of achieving the common goal of green development and establish a brand image of a green strategic alliance, in order to form competitiveness in their respective fields and give products a green value. By complementing resources, manufacturers can solve problems that cannot be solved by a single enterprise, while weakening unilateral opportunistic tendencies and diversifying potential financial risks [78]. Through value co-creation behavior, manufacturers and retailers can enable firms to make flexible adjustments in response to changes in the environment, which can help companies seize market opportunities and improve dynamic capabilities [79]. Firms reach a consensus on cooperation, share resources, and conduct profitability to a certain degree. Such value co-creation behavior will form a strong and mutually beneficial relationship between firms, give products a higher value, reduce operating risks and costs, and increase product competition as well as efforts to expand market share and improve corporate returns. Consequently, we propose:
Hypothesis 3a (H3a).
Value Co-creation with their Suppliers is Positively Related to the Manufacturers’ Financial Performance in GSC.
Hypothesis 3b (H3b).
Value Co-creation with their Competitors is Positively Related to the Manufacturers’ Financial Performance in GSC.
Hypothesis 3c (H3c).
Value Co-creation with their Retailers is Positively Related to the Manufacturers’ Financial Performance in GSC.
The value co-creation activity has changed the relationship between companies. During the exchange of corporate culture and interests, the two sides also improved the company’s openness, and the increase in openness in the organization is conducive to organizational innovation. In value co-creation activities, the sharing of technical resources can increase the breadth of employee thinking and promote the innovation of individual employees [80]. Value co-creation behavior can bring about knowledge transfer, which has a positive effect on product and process innovation [81]. Knowledge originally belonging to different organizations is passed between partners, and new products or services are easily born through permutations and combinations. Therefore, companies that adopt value co-creation can be the first to apply new technologies in the industry, obtain corresponding intellectual property rights, increase sales revenue of innovative products, and make products that have good market response and irreplaceability within a certain time. Thus, we propose:
Hypothesis 4a (H4a).
Value Co-creation with their Suppliers is Positively Related to the Manufacturers’ Innovative Performance in GSC.
Hypothesis 4b (H4b).
Value Co-creation with their Competitors is Positively Related to the Manufacturers’ Innovative Performance in GSC.
Hypothesis 4c (H4c).
Value Co-creation with their Retailers is Positively Related to the Manufacturers’ Innovative Performance in GSC.

3.3. The Moderating Effect of External Environmental Pressure

The essence of firms adopting green management is to respond to the natural environment, and the motivation of response is affected by various factors such as stakeholder pressure. Regulatory, competition, marketing pressure, and drivers can improve the environmental awareness of enterprises [82]. We perceive that the external environmental pressure (legal pressure, consumer pressure, competitor pressure, supplier pressure) of the company will have an impact on the above changes. Firms with these external pressures could be inclined to adopt co-creation with supply chain members. Additionally, the relatively mature legal environment, consumption environment, and industry environment will make the advantages of green strategies more obvious, thereby encouraging firms to conduct value co-creation. Suppliers can provide complete green products and services, which will also cause a certain degree of pressure and incentives on the supply chain and promote value creation between firms. Thus, we propose:
Hypothesis 5a (H5a).
The External Environmental Pressures have a Positive Moderating Effect on the Relationship between Green Strategy and Value Co-creation Behavior.
The change in the external market environment is an important means for enterprises to deal with various complex environments, transfer risks, gain competitive advantages, and improve operation performance [83]. It may play a positive role in the relationship between enterprise value co-creation and operational performance. Thus, we propose:
Hypothesis 5b (H5b).
The External Environment Pressure has a Positive Moderating Effect on the Relationship between Value Co-creation Behavior and Operational Performance.
A better market environment and higher customer satisfaction can improve the financial performance of enterprises [84]. The improvement of external factors can strengthen the market competitiveness of enterprises, so as to increase the role of value co-creation in promoting the financial performance of enterprises. Thus, we propose:
Hypothesis 5c (H5c).
The External Environment Pressure has a Positive Moderating Effect on the Relationship between Value Co-creation Behavior and Financial Performance.
The government’s actions to improve the external environment such as improving the market mechanism, optimizing the innovative business environment of small and medium-sized enterprises, and formulating supporting policies, etc. can improve the level of innovation of enterprises [85]. In the foundation of value co-creation among enterprises, favorable external factors can improve the innovation performance of enterprises. Thus, we propose:
Hypothesis 5d (H5d).
The External Environmental Pressure has a Positive Moderating Effect on the Relationship between Value Co-creation Behavior and Innovative Performance.

3.4. The Moderating Effect of Internal Environmental Support

Internal environment support such as the stability of the relationship between enterprises and the reputation of suppliers has an important impact on the results of the supply chain alliance [86]. We perceive that the internal support environment of the enterprise (three categories) will have an impact on the above changes. The recognition of the green strategy by enterprise managers, the relative stability of the green alliance, and the relatively high technology level of enterprises may promote co-creation between enterprises. Thus, we propose:
Hypothesis 6a (H6a).
The Internal Support Environment has a Positive Moderating Effect on the Relationship between Green Strategy and Value Co-creation Behavior.
By strengthening coordination with suppliers and downstream members of the supply chain including retailers, enterprises will promote their own operation activities [87]. The middle-level supply managers of internal stakeholders also play an important role in the operation activities of enterprises [88]. We believe that the internal support environment of an enterprise will have a positive impact on the relationship between co-creation and operation performance. Thus, we propose:
Hypothesis 6b (H6b).
The Internal Support Environment has a Positive Moderating Effect on the Relationship between Value Co-creation Behavior and Operational Performance.
The idea of managers determines the operation of an enterprise. At the same time, the relationship between an enterprise and its supply chain partners as well as its digitalization level, also become the key to improving the financial level and building sustainable competitiveness of an enterprise [6]. These internal factors will strengthen the promotion of co-creation on the financial performance of an enterprise. Thus, we propose:
Hypothesis 6c (H6c).
The Internal Support Environment has a Positive Moderating Effect on the Relationship between Value Co-creation Behavior and Financial Performance.
Enterprise alliance can improve the internal support environment of enterprises, realize knowledge sharing among partners, and promote the innovation performance of enterprises [6]. The enterprise managers’ emphasis on innovation and the enterprise’s own digital ability also determine the enterprise’s innovation ability. Thus, we propose:
Hypothesis 6d (H6d).
The Internal Support Environment has a Positive Moderating Effect on the Relationship between Value Co-creation Behavior and Innovative Performance.

4. Methodology

4.1. Research Process

This paper conducted an empirical analysis on a sample survey of Chinese firms in the form of a questionnaire. The analysis of this paper was divided into four steps: (1) A reliability analysis was carried out to illustrate the effectiveness of sample extraction; (2) As the questionnaire involved many contents, principal component analysis (PCA) was carried out to screen out several important influential factors; (3) a validity analysis was used to show that there was a good distinction between various factors; and (4) hierarchical regression analysis was used to study the influence of each factor on co-creation and performance.

4.2. Survey Development

In this paper, each factor in the conceptual model was measured in multiple ways (see Figure 1). The questionnaire was divided into descriptive items (see Table 1) and measurement items (see Appendix A). Descriptive questions mainly included the basic information of the respondents and their companies. The measurement items were further divided into three parts: the first part describes the green strategy of the company and the cooperation between the company and each member of the supply chain on green technology; the second part analyzes the legal environment and international environment of the company; and the third part examines the company from the performance of cooperation, financial situation, and innovation ability. This paper adopts the Likert scale commonly used in other articles, in which “1” means “strongly disagree” and “5” means “strongly agree”.
To develop a structured questionnaire, a comprehensive review of the related literature was undertaken. In this study, value co-creation with supplier (VCS) was measured from four dimensions including whether enterprises and suppliers could adopt a positive attitude and cooperative behavior; jointly design products and systems to meet production demand; standardize the relationship of responsibilities, rights, benefits and some behaviors in the process of value co-creation; and establish a benefit distribution mechanism [89]. Value co-creation with competitor (VCC) was measured from four dimensions including whether enterprises and competitors can adopt a positive attitude and cooperative behavior; share information, technology and resources to improve competitive advantage; standardize the relationship of responsibilities, rights, benefits and some behaviors in the process of value co-creation; and establish a benefit distribution mechanism [90]. Value co-creation with retailer (VCR) was also measured from four dimensions including whether enterprises and retailers could adopt a positive attitude and cooperative behavior; receive retailers’ feedback in time and let retailers participate in product design and development; standardize the relationship of responsibilities, rights, benefits and some behaviors in the process of value co-creation; and establish a benefit distribution mechanism [91].

4.3. Sample Selection

We chose automobile manufacturers in Mainland China as the main research objects. Before the formal issuance of the questionnaire, we sent the questionnaire to the three senior managers of the company. After filling in the questionnaire, we communicated with them, inquired about the rationality of the questionnaire, and modified the questionnaire according to the opinions. We selected 150 manufacturing companies to conduct anonymous surveys on senior executives in the form of electronic questionnaires. Each question was required to be answered to ensure the authenticity of the information obtained. Each respondent was divided into four groups and it took one month to collect the questionnaire. After each group had been completed, it sent a filling request for the next group. If the previous group failed to fill in the questionnaire on time, it sent a reminder again. Finally, we received a total of 115 available questionnaires with a response rate of 76.7%. The profile of the interviewees and their companies can be seen in Table 1.
Among the surveyed enterprises, 54% of them sent their Chief Officer (CEO) or middle manager to participate in the interviews, 24% had been established for more than 20 years, one third of them had an annual income of more than 2 billion yuan, and 90% were local private enterprises and foreign-funded enterprises. Over 50% of the enterprises had environmental management system certification, social responsibility management system certification, and quality management system certification. A total of 84% of the enterprises provided staff training, and three quarters of enterprises carried out total quality management.

5. Results

5.1. Preliminary Study

In order to ensure that the collected data were suitable for all factor analysis, the Kaiser-Meyer-Olkin (KMO) test was carried out. The KMO test result was 0.867, greater than 0.8, and the Bartlett’s test showed a satisfactory result when p < 0.000, so the samples passed the reliability test, and factor analysis could be carried out.

5.2. Exploratory Study

In this paper, SPSS 21.0 was used for exploratory factor analysis (EFA) to extract principal component factors. As shown in Table 2, nine factors were obtained through principal component analysis, and the cumulative explanatory variance of these factors was 82.7%. In addition, Cronbach’s α coefficient was greater than 0.8, and the sample data were good, which shows that these nine factors can be used to explain all measured items.

5.3. Confirmatory Study

Confirmatory factor analysis (CFA) was used to verify the model. It can be seen from Table 3 that standardized load coefficients were all greater than 0.8, and were significant when the confidence was greater than 95%, and R2 was greater than 0.5. Through the confirmatory factor analysis test, it showed that the measurement item structure was good and that the model could be accepted completely (χ2 = 216.144, df = 114, χ2/df = 1.896, RMSEA = 0.061, CFI = 0.939, GFI = 0.868, AGFI = 0.835, NFI = 0.880, TLI = 0.931).
The results show that the t-value of each item was higher than the critical value, the significance level was 0.05, and the R2 value of each variable was greater than 0.5. This is sufficient evidence of convergence efficiency. The discriminant validity was tested by comparing the mean variance (AVE) extracted and the square correlation between structures. The results show that the AVE was greater than 0.5, and the correlation coefficient between factors was less than AVE, indicating that there is good discrimination validity between factors (see Table 4).

5.4. Hypotheses Testing and Results

A hierarchical regression method was used to test the proposed hypothesis and passed the multicollinearity test. To avoid the threat of multi-collinearity, the variance inflation factors were computed, and the value of 1.37 revealed that the dataset was suitable for regression analysis [92], thus dataset was suited for the regression analysis. Additionally, the value of the adjusted R2 of each model confirmed that the output of the regression models was accepted.
As shown in Table 5, the significant coefficient of model 1 (β = 0.832, p < 0.001) indicates that GS is positively correlated with VCS, thus supporting H1a; the significant coefficient of model 3 (β = 0.870, p < 0.001) indicates that GS is positively correlated with VCC, supporting H1b; and the significant coefficient of model 5 (β = 0.778, p < 0.001) indicates that GS is positively correlated with VCS, supporting H1c. Therefore, it shows that the green strategy is positively related to the value co-creation behavior. Model 8 shows that value co-creation behaviors (VCS, VCC, VCR) have a positive and significant effect on OP (p < 0.001), so H2 is accepted. The results of model 11 show that VCC is positively correlated with FP (β = 0.520, p < 0.001) and VCR is positively correlated with FP (β = 0.231, p < 0.05), but the relationship between VCC and FP is not significant, so H3b and H3c are accepted and H3 is rejected. Similarly, the results of model 14 show that VCC is positively correlated with IP (β = 0.321, p < 0.001) and VCR is positively correlated with IP (β = 0.368, p < 0.001), but VCC is not significantly related to IP, thus accepting H4b and H4c and rejecting H4a.
The research results show that models 2, 4, and 6 test the moderating effect of ETE and ITE on the GS and value co-creation behavior (VCS, VCC, VCR), indicating that ETE has a positive moderating effect on GS and value co-creation behavior (VCS, VCC, VCR) (p < 0.05), while ITE has no moderating effect on GS and value co-creation behavior (VCS, VCC, VCR), so it accepts H5a and rejects H6a. Model 9 tests the moderating effect of EEP and IES on the value co-creation behavior (VCS, VCC, VCR) and OP, indicating that EEP and IES have no moderating effect on the relationship between value co-creation (VCS, VCC, VCR) and OP, thus rejecting H5b and H6b. Model 12 tests the moderating effect of EEP and IES on value co-creation behavior (VCS, VCC, VCR) and FP and shows that EEP has no moderating effect on the relationship between value co-creation behavior (VCS, VCC, VCR) and FP, but IES has a positive moderating effect on the relationship between value co-creation behavior (VCS, VCC, VCR) and FP (p < 0.05). Therefore, it rejects H5c and accepts H6c. Model 15 tests the moderating effect of EEP and ITE on value co-creation behavior (VCS, VCC, VCR) and IP, indicating that EEP and IES both have a positive moderating effect on the relationship between value co-creation behavior (VCS, VCC, VCR) and IP (p < 0.05), so H5d and H6d is accepted.
In addition, in the study of control variables, firm age has a positive effect on FP, but has no effect on OP and IP, while firm size and firm ownership have no effect on OP, FP, and IP.

6. Discussion and Implications

6.1. Effects of Green Strategy on Value Co-Creation Behavior

This paper conducted an empirical study on value co-creation behavior in the green supply chain. First of all, this paper studied the impact of green strategy on value co-creation in the supply chain where the results showed that VCS, VCC, and VCR had a positive impact, and the implementation of a green strategy of manufacturers can effectively promote value co-creation among suppliers and other supply chain members. At the same time, both corporate responsibility and public awareness attach great importance to “green”, which proves the importance of co-creation under the green supply chain. The establishment of a green strategy by the state and enterprises can promote enterprises to seek more active ways to realize the strategy, and then effectively promote the green cooperation and value creation between enterprises and other enterprises in the supply chain.

6.2. Enablers of Performance

The article found that there was a positive correlation between value co-creation behavior in the supply chain and financial performance and innovation performance. Moreover, the nature of the manufacturer also has an impact on performance, which is rarely mentioned in the literature on green supply chains. Therefore, this study provides a new theoretical perspective.
Empirical results support H5 and H6, indicating that value co-creation behaviors are positively related to manufacturers’ financial performance and innovative performance in green supply chains. The results showed that value co-creation with suppliers was positively related to manufacturers’ operational performance, which confirmed H4a. The value co-creation of manufacturers and suppliers can deepen the information sharing and cooperation between the two sides, improving the supply efficiency of raw materials and the supply chain flexibility of manufacturing enterprises. However, when it comes to value co-creation between manufacturers and competitors, the value co-creation between manufacturers and retailers was not significant for operational performance, which indicates that hypothesis H4b and H4c are not valid. Green co-creation requires manufacturers to invest more money in technology for suppliers with a relatively weak technology level. Although it helps to improve operational efficiency, it may lead to higher costs. At the same time, due to the low co-creation degree of the sample enterprises in this paper, the innovation practice of suppliers cannot meet the production needs of the market and manufacturing enterprises, so it cannot promote the production of innovative products/services.
Regarding the influence of control variables on manufacturer performance, the results showed that only firm age had a positive effect on the manufacturers’ financial performance. This indicates that the age of the company is a major factor affecting corporate performance. Large companies with a long history and good reputation are more likely to win the trust of other firms, thus promoting value co-creation with other firms. However, the influence of firm size and firm ownership on performance was not significant, and the results did not show that company size and ownership had an impact on performance.

6.3. Effects of Moderators

This paper analyzed the moderating effect of external and internal contextual variables on the relationship between value co-creation behavior and enterprise performance in a green supply chain.
The results shows that external environment pressure (EEP) had a positive regulating effect on the relationship between green strategy (GS), value co-creation with supplier (VCS), value co-creation with competitor (VCC), and value co-creation with retailer (VCR), while internal environmental support (IES) had no significant regulating effect on the relationship between green strategy (GS), value co-creation with supplier (VCS), value co-creation with competitor (VCC), and value co-creation with retailer (VCR). This indicates that external contextual variables (legal environment, consumption environment, industry environment) have positive effects on promoting value co-creation in the green supply chain. Effective policies such as green subsidies and the attention of suppliers, consumers, and competitors to the green strategy can encourage enterprises to actively seek the realization channels of green products, and then promote the co-creation of green value with upstream and downstream enterprises. However, internal contextual variables (manager’s attitude, supply chain relationship, digitization capability) have little effect on promoting value co-creation in the green supply chain.
At the same time, external environment pressure (EEP) had a positive moderating effect on the relationship between co-creation behavior (value co-creation with supplier, value co-creation with competitor, and value co-creation with retailer) and innovative performance (IP), while external environment pressure (EEP) had no significant moderating effect on co-creation behavior (value co-creation with supplier, value co-creation with competitor, and value co-creation with retailer) and operational performance (OP) and financial performance( FP), indicating that good external contextual factors can promote the improvement of enterprise innovation performance, but not for operational performance and economic performance. This shows that good legal, production, and consumption environments can promote enterprises to increase the degree of innovation in the development and production of green products to design products more in line with the requirements, but at the same time, it often needs to spend more money and manpower, resulting in its impact on financial performance, and operational performance is not significant. Internal environmental support (IES) has no significant moderating effect on co-creation behavior (value co-creation with supplier, value co-creation with competitor, and value co-creation with retailer) and operational performance (OP) relationship, while internal environmental support (IES) has a positive regulating effect on co-creation behavior and the relationship between financial performance (FP) and innovative performance (IP), indicating that a good internal enterprise environment has a positive effect on improving enterprise financial performance and innovation performance, but has little effect on operational performance. This shows that managers’ attention to green products can promote enterprises to invest more innovation costs in the research and development of green products to improve the innovation performance of the enterprise. At the same time, the higher the degree of digitalization the enterprise has, the less the cost of replacing green products, so the financial performance is higher.

6.4. Theoretical Implications

This paper empirically analyzed the influence of different value co-creation modes on the enterprise performance of the supply chain and contributes to green supply chains and value co-creation literature in many ways. First, this paper studied the green supply chain from the perspective of value co-creation, while most of the current studies on value co-creation are based on the general supply chain. Second, this paper selected different types of value co-creation behaviors between manufacturers, suppliers, competitors, and retailers on the factor selection of value co-creation behaviors. Third, this paper considered the regulating effect of the internal environment and external environment. In the internal environment, this paper innovatively analyzed the impact of digital capability on the performance of the green supply chain of enterprises, which is more comprehensive than the related studies in the previous literature. Fourth, unlike the previous literature, which focused more on the influence of financial performance, this paper analyzed it from the three aspects of operational performance, financial performance, and innovation performance in order to evaluate the influence of value co-creation in green supply chains on enterprise performance from multiple aspects. Finally, the empirical research of this paper paid more attention to the interaction between the model of value co-creation and other influencing factors (such as internal and external environmental factors), which is unlike many studies in previous research that only focused on the single influence of the model of value co-creation.

6.5. Managerial Implications

This study has some valuable management implications for manufacturers and governments. First, manufacturers should actively adopt a green strategy, which has a positive effect on promoting value co-creation behavior between manufacturers and their suppliers, competitors, and retailers. Second, manufacturers should actively seek friendly cooperation with other firms, which can help improve the performance of firms such as financial performance, innovative performance, and operational performance. Finally, the internal and external contextual factors of firms play a regulating role in the mechanism of co-creation in the green supply chain. Therefore, the government should increase the publicity of environmental protection awareness, guide the demand of firms and consumers for green products, and create a good policy and consumption environment to reduce the pressure of supply chain enterprises. Firms should strengthen their managers’ understanding of green production, improve the level of digital management, establish friendly cooperative relations with upstream and downstream enterprises in the supply chain, and improve the internal environment to promote green value co-creation behavior in the manufacturing supply chain and improve the performance of firms.

7. Limitations and Future Research Lines

This article has some contributions in theory and practice, but still has some limitations. First of all, the research object of this paper was domestic manufacturing firms, and there was no further subdivision of enterprise type. Different types of manufacturing firms may face different situations. Second, this paper only considered the co-creation behavior of two subjects in the supply chain, while in actual operation, there may be more possibilities for the value co-creation behavior of firms. In addition, from the perspective of organizational behavior and psychology, there is a certain gap between the subjective perception of managers and the actual situation of the company during the investigation process, which may lead to the conclusion of this article not being objective and unscientific [93].
Based on the main findings and limitations, we propose several questions that can be explored in depth in future studies. First, the research object can be determined in more segmented manufacturing enterprises such as automobiles, electronic parts, electrical appliances, etc. to make the empirical results more accurate. Second, we can consider the impact of value co-creation between multiple entities in the supply chain or between enterprises and the government on enterprise performance. Third, the model can be considered to add coordination variables and control variables such as product diversity and corporate reputation to make the model more fully studied. Fourth, we can consider expanding the sample size and can choose enterprises from different countries or regions for comparison such as comparing the implementation effect of value co-creation between Chinese enterprises and enterprises from developed countries. Perhaps due to the differences in national policies and development environment, we will obtain unexpected research conclusions.

Author Contributions

Conceptualization, G.L. and X.S.; Methodology, X.S.; Formal Analysis, Y.Y. and C.D.; Resources, C.D.; Data Curation, G.L.; Writing—Original Draft Preparation, Y.Y.; Writing—Review & Editing, C.D. and X.S.; Project Administration, X.S.; Funding Acquisition, G.L. and Y.Y. All authors have read and agreed to the published version of the manuscript.

Funding

This research was partially supported by the Fundamental Research Funds for the Central Universities (grant number: 2020JBW002), Beijing Social Science Foundation of China (grant number: 18GLC081) and the National Science Foundation of China (grant number: 71971215, 71601187).

Conflicts of Interest

The authors declare no conflicts of interest.

Appendix A

Table A1. Measurement items.
FactorMeasured VariableItem
Green strategy (GS)Managers are very willing to implement the green supply chain strategy.GS1
Select environmentally friendly suppliers.GS2
Can carry out green design and green production for products.GS3
Can pay attention to the principle of resource conservation of environmental protection.GS4
Advocate that consumers choose green products that are not polluted or contribute to public health.GS5
Try to reduce the generation of harmful substances.GS6
Value co-creation with supplier (VCS)Can adopt positive attitude and cooperative behavior with suppliers.VCS1
Can jointly design products and systems to meet production requirements.VCS2
There are norms about the relationship of responsibility, right, interest and some behaviors.VCS3
Can establish the mechanism of interest distribution.VCS4
Value co-creation with competitor (VCC)Can adopt positive attitude and cooperative behavior with competitors.VCC1
Can share information, technology and resources to improve competitive advantage.VCC2
There are norms about the relationship of responsibility, right, interest and some behaviors.VCC3
Can establish the mechanism of interest distribution.VCC4
Value co-creation with retailer (VCR)Can adopt positive attitude and cooperative behavior with retailers.VCR1
Can receive retailers’ feedback in time and let retailers participate in product design and development.VCR2
There are norms about the relationship of responsibility, right, interest and some behaviors.VCR3
Can establish the mechanism of interest distribution.VCR4
External Environmental Pressure (EEP)Legal Pressure (LP)There are national laws, regulations and standards on environmental protection of manufacturing firms.LP1
There are local laws, regulations and standards on environmental protection of manufacturing firms.LP2
There are laws, regulations, and standards related to environmental protection in market.LP3
Relevant departments strengthen the supervision and management of firms’ compliance with laws, regulations and standards related to environmental protection.LP4
Law enforcement personnel increase the punishment for firms that violate relevant laws, regulations and standards.LP5
The government has increased financial subsidies to reduce the pollution and damage of firms to environmental resources.LP6
Relevant policies issued by the government strongly support the sustainable development.LP7
Consumers’ Pressure(CP)Consumers’ social responsibility and awareness of environmental protection are enhanced.CP1
Consumers’ expectations and requirements for green products and product safety increase.CP2
The export of products shall meet the environmental protection standards and safety standards.CP3
Consumers require us to have a good social and environmental image.CP4
Non-governmental organizations advocate social responsibility and environmental protection.CP5
Competitors’ Pressure (CmP)Leading firms in the industry have begun to implement sustainable supply chain management.CmP1
Firms in the industry that have implemented sustainable supply chain management perform well in terms of environment, society and economy.CmP2
Most firms in the industry have begun to implement sustainable supply chain management.CmP3
Suppliers’ Pressure (SP)Suppliers pay more attention to environmental protection.SP1
Suppliers put forward environmental protection requirements for the firms.SP2
The firm has reached certain environmental partnership with suppliers.SP3
Suppliers can provide environmentally friendly or recyclable raw materials.SP4
Suppliers can provide environmentally friendly or recyclable raw material packaging.SP5
Internal Environmental Support (IES)Managers’ attitude (MA)Top management believes that environmental protection is an important part of corporate strategy.MA1
Senior managers support activities to improve social responsibility and environmental performance.MA2
Top managers pay attention to corporate social responsibility and require corporate behavior to meet environmental requirements.MA3
Senior managers are directly responsible for the work of firm environment.MA4
Supply chain relationship (SCR)Firms and government departments have established friendly relations at various levels.SCR1
Firms and major suppliers have established friendly relations at multiple levels.SCR2
Different departments of the firms have established friendly relations at multiple levels.SCR3
Firms and distributors have established friendly relations at many levels.SCR4
Firms and retailers have established friendly relations at many levels.SCR5
Firms and suppliers have established friendly relations at multiple levels.SCR6
Digitalization capability (DC)Managers have digital leadership.DC1
Firms have more information professionals.DC2
Digital facilities and information systems are widely used.DC3
The business object of the enterprise has been digitized by means of mobile technology, etc.DC4
Can conduct digital contact analysis on the business of the enterprise.DC5
Business events and business decisions are driven by data analysis and algorithms.DC6
Firms have digital based business model innovation.DC7
Firms’ IT capability can support digital transformation.DC8
Operational performance (OP)Customer service level of the company has been improved.OP1
The company’s responsiveness has been improved.OP2
Decrease in customer complaints.OP3
Financial performance (FP)Market share expansion.FP1
Increase in revenue.FP2
Decrease in total operating costs.FP3
The return on assets of has been improved.FP4
The inventory turnover cycle is optimized.FP5
Innovative performance (IP)Often take the lead in launching new products/services in the industry.IP1
Often take the lead in applying new technologies in the industry.IP2
Cost increase of the manufacturer’s investment in product transformation and innovation.IP3
Increase in the manufacturer’s intellectual property (including application for patent, trademark and design, etc.IP4
The manufacturer’s innovative products have a good market response.IP5
Increase in sales revenue of innovative products.IP6
The manufacturer’s innovative products are highly irreplaceable.IP7

References

  1. Bai, C.; Kusi-Sarpong, S.; Sarkis, J. An implementation path for green information technology systems in the Ghanaian mining industry. J. Clean. Prod. 2017, 164, 1105–1123. [Google Scholar] [CrossRef]
  2. Hong, Z.; Guo, X. Green product supply chain contracts considering environmental responsibilities. Omega 2018, 83, 155–166. [Google Scholar] [CrossRef]
  3. Kusi-Sarpong, S.; Gupta, H.; Sarkis, J. A supply chain sustainability innovation framework and evaluation methodology. Int. J. Prod. Res. 2019, 57, 1990–2008. [Google Scholar] [CrossRef] [Green Version]
  4. Lacoste, S. Sustainable value co-creation in business networks. Ind. Mark. Manag. 2016, 52, 151–162. [Google Scholar] [CrossRef]
  5. Isaksson, R.; Johansson, P.; Fischer, K. Detecting Supply Chain Innovation Potential for Sustainable Development. J. Bus. Ethics 2010, 97, 425–442. [Google Scholar] [CrossRef] [Green Version]
  6. Li, S.; Haney, M.H.; Lee, G.; Kang, M.; Ko, C. The effect of task conflict on outsourcers’ long-term orientation toward suppliers: The moderating role of formal control and Chinese guanxi. J. Bus. Ind. Mark. 2019, 35, 260–269. [Google Scholar] [CrossRef]
  7. Lo, S.M.; Zhang, S.; Wang, Z.; Zhao, X. The impact of relationship quality and supplier development on green supply chain integration: A mediation and moderation analysis. J. Clean. Prod. 2018, 202, 524–535. [Google Scholar] [CrossRef]
  8. Tariq, A.; Yuosre, F.; Badir, W.T.; Bhutta, U.S. Drivers and consequences of green product and process innovation: A systematic review, conceptual framework, and future outlook. Technol. Soc. 2017, 51, 8–23. [Google Scholar] [CrossRef]
  9. Liu, Y.; Luo, Y.; Liu, T. Governing buyer–supplier relationships through transactional and relational mechanisms: Evidence from China. J. Oper. Manag. 2009, 27, 294–309. [Google Scholar] [CrossRef]
  10. Somsuk, N.; Laosirihongthong, T. Prioritization of applicable drivers for green supply chain management implementation toward sustainability in Thailand. Taylor Fr. 2016, 24, 175–191. [Google Scholar] [CrossRef]
  11. Shi, X.; Chan, H.L.; Dong, C. Value of bargaining contract in a supply chain system with sustainability investment: An incentive analysis. IEEE Trans. Syst. Man Cybern. Syst. 2020, 50, 1622–1634. [Google Scholar] [CrossRef]
  12. Shi, X.; Dong, C.; Zhang, C.; Zhang, X. Who should invest in clean technologies in a supply chain with competition? J. Clean. Prod. 2019, 215, 689–700. [Google Scholar] [CrossRef]
  13. Dong, C.; Liu, Q.; Shen, B. To be or not to be green? Strategic investment for green product development in a supply chain. Transp. Res. Part E Logist. Transp. Rev. 2019, 131, 193–227. [Google Scholar] [CrossRef]
  14. Huang, X.X.; Hu, Z.P.; Liu, C.S.; Yu, D.J.; Yu, L.F. The relationships between regulatory and customer pressure, green organizational responses, and green innovation performance. J. Clean. Prod. 2016, 112, 3423–3433. [Google Scholar] [CrossRef]
  15. Schiederig, T.; Tietze, F.; Herstatt, C. Green innovation in technology and innovation management—An exploratory literature review. R&D Management 2012, 42, 180–192. [Google Scholar]
  16. Swami, S.; Shah, J. Channel coordination in green supply chain management. J. Oper. Res. Soc. 2013, 64, 339–351. [Google Scholar] [CrossRef]
  17. Wei, J.; Zhao, J. Pricing Decisions for Substitutable Products with Horizontal and Vertical Competition in Fuzzy Environments. Ann. Oper. Res. 2016, 242, 505–528. [Google Scholar] [CrossRef]
  18. Zu-Jun, M.; Zhang, N.; Dai, Y.; Hu, S. Managing channel profits of different cooperative models in closed-loop supply chains. Omega 2016, 59, 251–262. [Google Scholar] [CrossRef]
  19. Chen, R.R.; Roma, P. Group Buying of Competing Retailers. Prod. Oper. Manag. 2011, 20, 181–197. [Google Scholar] [CrossRef] [Green Version]
  20. Wei, J.; Zhao, J.; Li, Y. Price and warranty period decisions for complementary products with horizontal firms’ cooperation/noncooperation strategies. J. Clean. Prod. 2015, 105, 86–102. [Google Scholar] [CrossRef]
  21. Yang, L.; Zhang, Q.; Ji, J. Pricing and carbon emission reduction decisions in supply chains with vertical and horizontal cooperation. Int. J. Prod. Econ. 2017, 191, 286–297. [Google Scholar] [CrossRef]
  22. Li, H.; Wang, C.; Shang, M.; Ou, W. Pricing, Carbon Emission Reduction, Low-Carbon Promotion and Returning Decision in a Closed-Loop Supply Chain under Vertical and Horizontal Cooperation. Int. J. Environ. Res. Public Health 2017, 14, 1332. [Google Scholar] [CrossRef] [PubMed] [Green Version]
  23. Dai, R.; Zhang, J.; Tang, W. Cartelization or Cost-sharing? Comparison of cooperation modes in a green supply chain. J. Clean. Prod. 2017, 156, 159–173. [Google Scholar]
  24. Ge, Z.; Hu, Q. Collaboration in R&D activities: Firm-specific decisions. Eur. J. Oper. Res. 2007, 185, 864–883. [Google Scholar]
  25. Gupta, S. Research Note—Channel Structure with Knowledge Spillovers. Mark. Sci. 2008, 27, 247–261. [Google Scholar] [CrossRef]
  26. Ge, Z.; Hu, Q.; Xia, Y. Firms’ R&D Cooperation Behavior in a Supply Chain. Prod. Oper. Manag. 2014, 23, 599–609. [Google Scholar]
  27. Yenipazarli, A. To collaborate or not to collaborate: Prompting upstream eco-efficient innovation in a supply chain. Eur. J. Oper. Res. 2017, 260, 571–587. [Google Scholar] [CrossRef]
  28. Song, H.; Gao, X. Green supply chain game model and analysis under revenue-sharing contract. J. Clean. Prod. 2018, 170, 183–192. [Google Scholar] [CrossRef]
  29. Dong, C.; Shen, B.; Chow, P.S.; Yang, L.; Ng, C.T. Sustainability investment under cap-and-trade regulation. Ann. Oper. Res. 2016, 240, 509–531. [Google Scholar] [CrossRef]
  30. Heydari, J.; Govindan, K.; Aslani, A. Pricing and greening decisions in a three-tier dual channel supply chain. Int. J. Prod. Econ. 2019, 217, 185–196. [Google Scholar] [CrossRef]
  31. Porter, M.E. Competitive Strategy: Techniques for Analyzing Industries and Competitors; Social Science Electronic Publishing: New York, NY, USA, 1980; pp. 86–87. [Google Scholar]
  32. Huemer, L. Supply Management: Value Creation, Coordination and Positioning in Supply Relationships. Long Range Plan. 2006, 39, 133–153. [Google Scholar] [CrossRef]
  33. Ketchen, D.J.; Hult, G.T.M. Bridging Organization Theory and Supply Chain Management: The Case of Best Value Supply Chains. J. Oper. Manag. 2007, 25, 573–580. [Google Scholar] [CrossRef]
  34. Prahalad, C.K.; Ramaswamy, V. Co-creation experiences: The next practice in value creation. J. Interact. Mark. 2010, 18, 5–14. [Google Scholar] [CrossRef] [Green Version]
  35. Freeman, R.E. Managing for Stakeholders: Trade-offs or Value Creation. J. Bus. Ethics 2010, 96, 7–9. [Google Scholar] [CrossRef]
  36. Freudenreich, B.; Lüdeke-Freund, F.; Schaltegger, S. A Stakeholder Theory Perspective on Business Models: Value Creation for Sustainability. J. Bus. Ethics 2019, 8, 1–6. [Google Scholar] [CrossRef]
  37. Donaldson, T.; Preston, L.E. The Stakeholder Theory of the Corporation: Concepts, Evidence, and Implications. Acad. Manag. Rev. 1995, 20, 65–91. [Google Scholar] [CrossRef] [Green Version]
  38. Haslam, C.; Tsitsianis, N.; Andersson, T.; Gleadle, P. Accounting for business models: Increasing the visibility of stakeholders. J. Bus. Models 2015, 3, 62–80. [Google Scholar]
  39. Breuer, H.; Lüdeke-Freund, F. Values-based network and business model innovation. Int. J. Innov. Manag. 2017, 21, 1750028. [Google Scholar] [CrossRef]
  40. Dentoni, D.; Bitzer, V.; Pascucci, S. Cross-sector partnerships and the co-creation of dynamic capabilities for stakeholder orientation. J. Bus. Ethics 2016, 135, 35–53. [Google Scholar] [CrossRef] [Green Version]
  41. Vargo, S.L.; Lusch, R.F. Service-dominant logic: Continuing the evolution. J. Acad. Mark. Sci. 2008, 36, 1–10. [Google Scholar] [CrossRef]
  42. Cachon, G.P. Supply Chain Coordination with Contracts. Handb. Oper. Res. Manag. Sci. 2003, 11, 227–339. [Google Scholar]
  43. Anni-Kaisa, K.; Katrina, L. The Underlying Potential of Supply Management in Value Creation. J. Purch. Supply Manag. 2012, 18, 68–75. [Google Scholar]
  44. FitzPatrick, M.; Varey, R.J.; Grönroos, C.; Davey, J. Relationality in the service logic of value creation. J. Serv. Mark. 2015, 29, 463–471. [Google Scholar] [CrossRef]
  45. Yngfalk, F. ‘It’s not us, it’s them!’—Rethinking value co-creation among multiple actors. J. Mark. Manag. 2013, 29, 1163–1181. [Google Scholar] [CrossRef]
  46. Lei, M.; Liu, H.; Deng, H.; Huang, T.; Leong, G.K. Demand Information Sharing and Channel Choice in A Dual-channel Supply Chain with Multiple Retailers. Int. J. Prod. Res. 2014, 52, 6792–6818. [Google Scholar] [CrossRef]
  47. Mukhopadhyay, S.K.; Yao, D.Q.; Yue, X. Information Sharing of Value-adding Retailer in A Mixed Channel Hi-tech Supply Chain. J. Bus. Res. 2008, 61, 950–958. [Google Scholar] [CrossRef]
  48. D’Aspremont, C.; Jacquemin, A. Cooperative and Noncooperative R&D in Duopoly with Spillovers: Erratum. Am. Econ. Rev. 1990, 80, 641–642. [Google Scholar]
  49. Kamien, M.I.; Zang, M.I. Research Joint Ventures and R&D Cartels. Am. Econ. Rev. 1992, 82, 1293–1306. [Google Scholar]
  50. Luo, Z.; Chen, X.; Wang, X. The role of co-opetition in low carbon manufacturing. Eur. J. Oper. Res. 2016, 253, 392–403. [Google Scholar] [CrossRef] [Green Version]
  51. Gnyawali, D.R.; Park, B.R. Co-opetition Between Giants: Collaboration with Competitors for Technological Innovatio. Res. Policy 2011, 40, 650–663. [Google Scholar] [CrossRef]
  52. Yim, C.K.; Chan, K.W.; Lam, S.S.K. Do Customers and Employees Enjoy Service Participation? Synergistic Ef. J. Mark. 2012, 76, 121–140. [Google Scholar] [CrossRef] [Green Version]
  53. Xie, X.; Tsai, N.; Xu, S.; Zhang, B. Does customer co-creation value lead to electronic word-of-mouth? An empirical study on the short-video platform industry. Soc. Sci. J. 2019, 56, 401–416. [Google Scholar] [CrossRef]
  54. Lusch, R.F.; Vargo, S.L.; O’Brien, M. Competing through service: Insights from service-dominant logic. J. Retail. 2007, 83, 5–18. [Google Scholar] [CrossRef]
  55. Payne, A.F.; Storbacka, K.; Frow, P. Managing the co-creation of value. J. Acad. Mark. Sci. 2008, 36, 83–96. [Google Scholar] [CrossRef]
  56. Merz, M.A.; Zarantonello, L.; Grappi, S. How valuable are your customers in the brand value co-creation process? The development of a Customer Co-Creation Value (CCCV) scale. J. Bus. Res. 2018, 82, 79–89. [Google Scholar] [CrossRef] [Green Version]
  57. Navarro, S.; Llinares, C.; Garzon, D. Exploring the relationship between co-creation and satisfaction using qca. J. Bus. Res. 2016, 69, 1336–1339. [Google Scholar] [CrossRef]
  58. Franke, N.; Schreier, M. Why Customers Value Self-Designed Products: The Importance of Process Effort and Enjoyment. J. Prod. Innov. Manag. 2010, 27, 1020–1031. [Google Scholar] [CrossRef] [Green Version]
  59. Glassman, M.; Mcafee, R.B. Enthusiasm: The missing link in leadership. Sam Adv. Manag. J. 1990, 55, 4–6. [Google Scholar]
  60. Zhang, M.; Guo, L.; Hu, M.; Liu, W. Influence of customer engagement with company social networks on stickiness: Mediating effect of customer value creation. Int. J. Inf. Manag. 2017, 37, 229–240. [Google Scholar] [CrossRef]
  61. Tuli, K.R.; Kohli, A.K.; Bharadwaj, S.G. Rethinking Customer Solutions: From Product Bundles to Relational processes. J. Mark. 2007, 71, 1–17. [Google Scholar] [CrossRef] [Green Version]
  62. Kim, H.-S.; Kim, Y.-G. A CRM performance measurement framework: Its development process and application. Ind. Mark. Manag. 2007, 38, 477–489. [Google Scholar] [CrossRef]
  63. Butler, B.; Batt, P.J. Re-assessing value (co)-creation and cooperative advantage in international networks. Ind. Mark. Manag. 2014, 43, 538–542. [Google Scholar] [CrossRef]
  64. Kowalkowski, C.; Witell, L.; Gustafsson, A. Any way goes: Identifying value constellations for service infusion in SMEs. Ind. Mark. Manag. 2012, 42, 18–30. [Google Scholar] [CrossRef] [Green Version]
  65. Gummesson, E.; Nenonen, S.; Storbacka, K. Business model design: Conceptualizing networked value co-creation. Int. J. Qual. Serv. Sci. 2010, 2, 43–59. [Google Scholar]
  66. Ulaga, W.; Reinartz, W. Hybrid Offerings: How Manufacturing Firms Combine Goods and Services Successfully. J. Mark. A Q. Publ. Am. Mark. Assoc. 2011, 75, 5–23. [Google Scholar] [CrossRef]
  67. Zhu, Q.; Geng, Y.; Lai, K. Circular economy practices among Chinese manufacturers varying in environmental-oriented supply chain cooperation and the performance implications. Environ. Manag. 2010, 91, 1324–1331. [Google Scholar] [CrossRef]
  68. Green, K.W.; Zelbst, P.J.; Bhadauria, V.S.; Meacham, J. Do environmental collaboration and monitoring enhance organizational performance? Ind. Manag. Data Syst. 2012, 112, 186–205. [Google Scholar] [CrossRef]
  69. Ghosh, D.; Shah, J. A comparative analysis of greening policies across supply chain structures. Prod. Econ. 2012, 135, 568–583. [Google Scholar] [CrossRef]
  70. Grekova, K.; Calantone, R.J.; Bremmers, H.J.; Trienekens, J.H.; Omta, S.W.F. How environmental collaboration with suppliers and customers influences firm performance: Evidence from Dutch food and beverage processors. Clean. Prod. 2016, 112, 1861–1871. [Google Scholar] [CrossRef]
  71. Xu, X.; He, P.; Xu, H.; Zhang, Q. Supply chain coordination with green technology under cap-and-trade regulation. Int. J. Prod. Econ. 2017, 183, 433–442. [Google Scholar] [CrossRef]
  72. Hou, Y.; Zhang, S.; Hong, J. Study on the selection of enterprise suppliers under the green strategic alliance. China Bus. Theory 2017, 17, 73–75. [Google Scholar]
  73. Qiu, E. Research on Enterprise Green Management System; Harbin Engineering University: Harbin, China, 2006. [Google Scholar]
  74. Wang, M.; Gao, Q.; Liang, D. Stackelberg game model between retailers and two competitive manufacturers. Mod. Bus. 2014, 23, 17–18. [Google Scholar]
  75. Lee, H.L.; Padmanabhan, V.; Whang, S. Information distortion in a supply chain. Bullwhip Eff. Manag. Sci. 1997, 43, 546–558. [Google Scholar]
  76. Kang, Y.; Chen, J.; Tong, S. Service strategy and service performance: The regulatory effect of value co-creation. Soft Sci. 2016, 30, 103–107. [Google Scholar]
  77. Holweg, M.; Pil, F.K. Theoretical perspectives on the co-ordination of supply chains. J. Oper. Manag. 2008, 26, 389–406. [Google Scholar] [CrossRef]
  78. Liu, H.; Zhang, X. Influence of governance mechanism of online retail platform on opportunistic behavior of sellers-Taking perceived uncertainty as moderating variable. Bus. Econ. Manag. 2017, 04, 17–28. [Google Scholar]
  79. Zhu, Q.; Sun, Y.; Zhou, L. Research on the relationship between platform empowerment, value co-creation and enterprise performance. Sci. Res. 2019, 37, 2026–2033. [Google Scholar]
  80. Shi, H. Research on the Impact of Value Co-Creation among Firms on Innovation Cooperation Based on Resource Theory; Harbin University of Technology: Harbin, China, 2012. [Google Scholar]
  81. Roper, S.; Du, J.; Love, J.H. Modelling the innovation value chain. Res. Policy 2008, 37, 961–977. [Google Scholar] [CrossRef] [Green Version]
  82. Bansal, P.; Roth, K. Why Companies Go Green: A Model of Ecological Responsiveness. Acad. Manag. J. 2000, 43, 717–736. [Google Scholar]
  83. Zhu, Q.H. An inter-sectoral comparison of GSC management in China: Drivers and practices. J. Clean. Prod. 2006, 14, 472–486. [Google Scholar] [CrossRef]
  84. Wu, F.; Gu, F.; Zhang, J. Factors influencing financial performance of Listed Companies. J. Syst. Manag. 2013, 022, 715–719. [Google Scholar]
  85. Jiang, Q.; Tan, Q. Research on the configuration path of enterprise innovation performance based on fuzzy qualitative analysis. China Sci. Technol. Forum 2019, 08, 67–76. [Google Scholar]
  86. Yang, J. The determinants of supply chain alliance performance: An empirical study. Int. J. Prod. Res. 2009, 47, 1055–1069. [Google Scholar] [CrossRef] [Green Version]
  87. Carter, C.R.; Carter, J.R. Interorganizational determinants of environmental purchasing: Initial evidence from the consumer products industries. Decis. Sci. 1998, 29, 659–685. [Google Scholar] [CrossRef]
  88. Ehrgott, M.; Reimann, F.; Kaufmann, L.; Carter, C.R. Social sustainability in selecting emerging economy suppliers. J. Bus. Ethics 2011, 98, 99–119. [Google Scholar] [CrossRef]
  89. Lee, J.N. The impact of knowledge sharing, organizational capability and partnership quality on IS outsourcing success. Inf. Manag. 2001, 38, 323–335. [Google Scholar] [CrossRef]
  90. Ngo, L.V.; O’Cass, A. Creating value offerings via operant resource-based capabilities. Ind. Mark. Manag. 2009, 38, 45–59. [Google Scholar] [CrossRef]
  91. Ren, S.J.; Hu, C.; Ngai, E.W.T.; Zhou, M. An empirical analysis of inter-organisational value co-creation in a supply chain: A process perspective. Prod. Plan. Control 2015, 26, 969–980. [Google Scholar] [CrossRef]
  92. Flynn, B.B.; Huo, B.; Zhao, X. The impact of supply chain integration on performance: A contingency and configuration approach. J. Oper. Manag. 2010, 28, 58–71. [Google Scholar] [CrossRef]
  93. Schruijer, S.G.; Curseu, P.L. Looking at the gap between social psychological and psychodynamic perspectives on group dynamics historically. J. Organ. Chang. Manag. 2014, 27, 232–245. [Google Scholar] [CrossRef]
Figure 1. Conceptual model.
Energies 13 03902 g001
Table 1. Descriptive items.
CharacteristicsPercentage (%)
Respondent’s Position
CEO 12
Middle manager 42
General staff46
Age of the Firm (Number of Years)
Less than 525
5–1034
11–1513
16–204
More than 2024
Annual Revenue (Million RMB Yuan)
Less than 5023
50–10027
100–20010
200–20007
More than 200033
Ownership of the Firm
State-owned9
Local private58
Foreign 32
Joint venture1
Environmental Management System Certification
Yes66
No34
Social Responsibility Management System Certification
Yes54
No46
Quality Management System Certification
Yes75
No26
Train Employees on Environmental Management
Never16
Sometimes58
Always26
Total Quality Management
Yes75
No25
Table 2. Results of the exploratory factor analysis.
ItemFactor 1Factor 2Factor 3Factor 4Factor 5Factor 6Factor 7Factor 8Factor 9
GS10.812--------
GS20.764--------
GS30.695--------
GS40.703--------
GS50.710--------
GS60.693--------
VCS1-0.785-------
VCS2-0.778-------
VCS3-0.790-------
VCS4-0.811-------
VCC1--0.828------
VCC2--0.813------
VCC3--0.830------
VCC4--0.802------
VCR1---0.793-----
VCR2---0.727-----
VCR3---0.847-----
VCR4---0.835-----
LP1----0.837----
LP2----0.809----
LP3----0.812----
LP4----0.811----
LP5----0.849----
LP6----0.811----
LP7----0.823----
CP1----0.806----
CP2----0.792----
CP3----0.763----
CP4----0.806----
CP5----0.769----
CmP1----0.857----
CmP2----0.878----
CmP3----0.860----
SP1----0.762----
SP2----0.789----
SP3----0.805----
SP4----0.803----
SP5----0.820----
MA1-----0.821---
MA2-----0.787---
MA3-----0.814---
MA4-----0.773---
SCR1-----0.874---
SCR2-----0.860---
SCR3-----0.894---
SCR4-----0.845---
SCR5-----0.876---
SCR6-----0.856---
DC1-----0.863---
DC2-----0.815---
DC3-----0.830---
DC4-----0.843---
DC5-----0.850---
DC6-----0.849---
DC7-----0.855---
DC8-----0.836---
OP1------0.881--
OP2------0.849--
OP3------0.838--
FP1-------0.896-
FP2-------0.888-
FP3-------0.841-
FP4-------0.855-
FP5-------0.867-
IP1--------0.862
IP2--------0.825
IP3--------0.823
IP4--------0.844
IP5--------0.915
IP6--------0.869
IP7--------0.840
Mean4.2504.2023.9404.1784.0794.0104.1403.9534.075
S.D.0.8440.8310.9550.8490.8730.8910.8150.9410.863
Cumulative Percent of Variance0.6020.6430.6770.7220.7500.7750.8000.8120.827
Cronbach’s α0.9170.8190.8320.8450.9190.9510.8500.8890.909
Note: please see Table 3 for the meaning of the abbreviations in Table 2.
Table 3. Parameter estimates of the confirmatory factor analysis.
FactorItemStandardized Factor Loadingt-ValueR2
Factor1: Green strategy (GS)GS10.869-0.594
GS20.8758.3190.602
GS30.8038.4070.584
GS40.87610.3250.630
GS50.86511.3370.624
GS60.89316.2040.580
Factor 2: Value Co-creation with supplier (VCS)VCS10.890-0.517
VCS20.86215.0890.720
VCS30.81913.7300.690
VCS40.84918.4270.823
Factor 3: Value co-creation with competitor (VCC)VCC10.831-0.785
VCC20.90716.0820.723
VCC30.88617.6560.779
VCC40.85021.2990.712
Factor 4: Value co-creation with retailer (VCR)VCR10.883-0.747
VCR20.8448.6920.596
VCR30.8648.6700.598
VCR40.8049.4070.548
Factor 5: External environment pressure (EEP)LE10.806-0.519
LE20.87410.8730.566
LE30.86511.9400.575
LE40.88210.6840.581
LE50.88910.4670.843
LE60.89310.5560.849
LE70.9188.7690.701
CE10.9218.6920.940
CE20.8378.6700.898
CE30.9709.4070.917
CE40.9489.9490.787
CE50.95710.8730.716
IE10.8879.5480.832
IE20.8468.4700.765
IE30.9128.4840.946
PS10.8758.6870.892
PS20.97330.2320.838
PS30.9449.4650.740
PS40.9169.6530.710
PS50.8159.4280.858
Factor 6: Internal environment support (IES)MA10.824-0.782
MA20.81519.4250.536
MA30.89917.3670.527
MA40.85818.7390.525
SCR10.81920.8460.516
SCR20.89817.4360.607
SCR30.80316.2390.572
SCR40.82713.2850.755
SCR50.86012.4590.562
SCR60.84319.0480.584
DC10.92618.4750.567
DC20.88422.5320.572
DC30.66120.6040.858
DC40.65421.2040.892
DC50.65220.7910.736
DC60.81822.8410.965
DC70.87920.8730.890
DC80.85619.0230.901
Factor 7: Operational performance (OP)OP10.869-0.754
OP20.8808.6970.722
OP30.9829.7320.830
Factor 8: Financial performance (FP)FP10.943-0.772
FP20.94920.6200.961
FP30.86821.7030.871
FP40.84924.3390.812
FP50.91121.6610.578
Factor 9: Innovative performance (IP)IP10.879-0.524
IP20.98030.3140.511
IP30.93327.2330.639
IP40.90122.5830.575
IP50.84321.4900.670
IP60.92621.9630.637
IP70.88418.8060.594
Table 4. Discriminant validity.
AVEGSVCSVCCVCREEPITEOPFPIP
GS0.625---------
VCS0.6610.004--------
VCC0.7250.0210.021-------
VCR0.6820.0030.1520.160------
EEP0.8160.0380.1990.2560.065-----
IES0.8090.0100.0020.0110.2420.087----
OP0.8110.0250.1160.1060.0070.0390.145---
FP0.7190.0870.1790.1980.0760.0590.0960.310--
IP0.8420.2030.2140.2360.1570.0950.2080.178--
Table 5. Result of hierarchical regression analysis.
ModelVCSVCCVCROPFPIP
123456789101112131415
Independent Variable
GS0.832 a0.355 b0.870 a0.1500.778 a0.132---------
VCS-------0.125 a0.849-0.1771.168-0.1891.650 c
VCC-------0.173 a0.356-0.520 a1.962 b-0.321 a1.086 c
VCR-------0.187 a0.367-0.231 c0.773-0.368 a0.643
Moderator Variable
EEP ∗ GS-0.052 c-0.149 c 0.024 c------
IES ∗ GS-0.023-0.011-0.079------
EEP ∗ VCS- ------0.509--0.146 1.046 b
EEP ∗ VCC- ------0.044--0.108 0.087 c
EEP ∗ VCR- ------0.378--0.055 0.920 b
IES ∗ VCS- ------0.274--0.200 c 0.582 b
IES ∗ VCC- ------0.284--0.333 c 0.169 c
IES ∗ VCR- ------0.569--0.165 c 0.825 b
Control Variable
firm age------0.1260.0240.0480.174 c0.055 c0.081 c0.1170.0110.034
firm size------0.1030.0460.0620.0880.0260.0420.0850.0260.056
firm ownership------0.0840.0920.1230.0700.0760.0780.0280.0350.104
Constant0.686 a1.386 a0.243 a1.741 a0.874 a1.819 a4.359 a0.454 a0.957 a0.0520.2090.3720.575 b0.1820.518
Adjusted R20.6960.7440.5390.6920.5810.6890.7370.7040.7760.5520.7110.8170.5280.7170.812
Note: a p < 0.001; b p<0.01; c p<0.05.

