Article

Simulation Model of Regenerative LNG Refrigeration System for Re-Liquification of BOG

Department of Mechanical Engineering, Chungbuk National University, Cheongju 28644, Korea
*
Author to whom correspondence should be addressed.
Energies 2020, 13(15), 3894; https://doi.org/10.3390/en13153894
Submission received: 29 June 2020 / Revised: 21 July 2020 / Accepted: 22 July 2020 / Published: 30 July 2020
(This article belongs to the Special Issue Technologies Conducive to Low Green House Gas Emission)

Abstract

:
Boil-off gas (BOG) disposal in liquefied natural gas (LNG) tankers has long been considered inevitable owing to the constant vaporization of the LNG in the storage tanks, but results in energy waste and environmental pollution. To address these challenges, we developed a re-liquification system that can condense the BOG and return it to the storage tank. The re-liquification system was modeled, and a case study was conducted to evaluate the viability of the system. The energy waste, which was quantified by tonnes of oil equivalent (TOE), greenhouse-gas emissions in tonnes of carbon dioxide (TCO2), and cost reduction in millions of U.S. dollars (MUSD), was evaluated for five different tanker cruising speeds. The re-liquification system significantly reduced the average TOE, TCO2, and cost by up to 9120.40 TOE/year, 19,474.33 TCO2/year, and 1.9765 MUSD/year, respectively, for five different tanker speeds with multi-stage compression.

Graphical Abstract

1. Introduction

The era of high global oil prices and depletion of oil reserves has led to social problems and an urgent need to secure alternative fuels. The fuel source, supply, safety, toxicity, health hazards, engine performance, emissions, storage, and availability are important factors to consider when evaluating potential alternative fuels [1]. Currently, diesel engines are widely used as sources of motive power. Diesel engines are highly efficient, but the combustion of diesel fuel has disadvantages, as the emissions contain large amounts of NOx and soot [2,3,4]. These emissions result in ground ozone generation and acid rain, which pose severe health hazards [5]. Exhaust-treatment technologies are available for reducing NOx and soot particle emissions from diesel engines, e.g., selective catalytic reduction and diesel particulate filters [6]. However, these devices are limited in their effectiveness and require expensive catalyst materials; thus, the investigation of alternative fuels has become necessary [7]. Liquefied natural gas (LNG) is an eco-friendly energy source that is uniquely positioned with regard to energy utilization, demand, and future supply. At present, the demand for LNG is increasing; the technologies associated with LNG transportation are crucial to the wide-scale use of LNG. LNG is natural gas that has been chilled until it reaches a liquid state, which occurs at 111 K and atmospheric pressure. The refrigeration process reduces the volume of the natural gas by a factor of 600, which allows tankers to transport large quantities effectively. However, owing the continuous heat influx in the LNG storage tank, the formation of boil-off gas (BOG) is unavoidable. The BOG generation rate depends on the capacity of the LNG fleet, and 140,000 m3 of KC–1 membrane type LNG tankage generates BOG at a rate of 2327 kg/h [8,9]. Without proper management of BOG generation in the LNG storage tank, the pressure in the tank eventually becomes high enough to cause severe damage to the system. The most common solution for this problem is to vent the BOG to the atmosphere at a certain pressure limit. However, the release of BOG causes environmental problems. BOG mostly comprises methane, a known greenhouse gas with a greenhouse effect 10 times higher than that of CO2. An alternative to venting the BOG that avoids these downsides is to re–liquefy it via an additional refrigeration cycle. However, owing to space limitations and expensive system components, this method is only feasible under specific conditions.
The Cryostar EcoRel system, the Hamworthy MARK–I and MARK–III systems [10], and the Hamworthy–Burckhardt system [11] are all employed in liquification plants using nitrogen as a refrigerant for the full re-liquification of BOG to minimize fuel losses. Vorkapic et al. investigated this re-liquification plus the Tractebel Gas Engineering systems applicable to LNG transportation vessels [12]. Additionally, the Linde–Hampson system was used for partial re–liquification using the cold heat of BOG [13]. Adamkiewicz and Cydejko investigated the energy consumption and effects of gas vapor re-liquification and its effects on Q–flex–type LNG tanks [14]. Beladjine et al. performed a thermodynamic analysis on an ethylene BOG re-liquification system with hydrocarbon-based refrigerants and found that R600a was the best performing refrigerant [15]. Rao et al. performed a case study involving BOG re-liquification and LNG re-gasification processes to reduce power consumption, and the best design achieved a 11.9% reduction in power consumption [16]. Tan et al. developed a simulation model for an ejector-enhanced LNG BOG re-liquification system that could reduce the power consumption by 754.1 kW and increase the coefficient of performance (COP) by 28% compared with the basic re-liquification system [17]. Romero et al. identified the operating conditions necessary to achieve high efficiency for a Brayton cycle LNG re-liquification system where LNG, nitrogen, and seawater were used as refrigerants [18]. Hwang et al. performed a case study on the LNG re-liquification cycle for vessels to obtain the optimal design with regard to the overall cost from birth to grave, including the manufacturing cost and operation cost at various cruising speeds [19].
The systematic development of technology in maritime transport must consider the ecological requirements that limit the possibility of operating ships with some types of main propulsion in waters subject to special protection, included in the protection zones. The attractiveness of transporting natural gas by sea and LNG as a fuel to replace low-sulfur fuels, thereby eliminating the need to install expensive exhaust gas purification systems, has prompted ship-owners to build new vessels. The use of LNG in ship propulsion is not a completely new solution. For many years, LNG-adapted vessels have used cargo steam (BOG) to power the main propulsion, and a wide variety of studies have been conducted on partial and full re-liquification of BOG for vessels and stationary plant; however, further research and developments of re-liquification for LNG vessels is needed. In the present study, we developed a computational model of a re-liquification system for the BOG from an LNG fleet to evaluate the performance of the system with regard to the fuel reduction, CO2 emissions, and operating cost.

2. Methodology

2.1. Model

As shown in Figure 1a, the re-liquification system is composed of three compressors, three gas-to-seawater intercoolers, a BOG regenerator (i.e., condenser), a flash chamber with an integral throttle valve, and an LNG fuel tank. The BOG is released from the LNG tank at −128 °C and 8.23 bar; because both the temperature and pressure are too low for engine combustion, the fuel is pre-heated by the condenser before being compressed by the multi–stage compressors at 326 °C and 300 bar immediately prior to being supplied to the high–pressure LNG injection engine [20]. Assuming that the volume of the KC-1 membrane type LNG storage tank is 140,000 m3 with a liquid level of 90%, density of 437.9 kg/m3, and evaporation rate of 0.1%/day [8,9], a BOG generation rate of approximately 2327 kg/h can be expected. The boil-off LNG from the tank is used as fuel in the LNG engine. All of the BOG must be consumed by the engine to prevent any gas from being released into the atmosphere. The fuel consumption rate depends on the speed of the vessel; the engine consumes more fuel to produce the additional power needed to sustain higher speeds. Consequently, at lower speeds, more BOG remains because less BOG is consumed by the engine, while less leftover BOG flows through the re-liquification cycle at higher speeds. Because the BOG cannot be completely consumed even at the maximum speed of the vessel, the re-liquification system must be considered at all voyage conditions.
The leftover compressed BOG is cooled by seawater and then cooled further by the boil-off LNG released from the LNG tank at −128 °C, which chills the leftover BOG in the condenser while heating the released LNG flowing past the condenser. The condensed BOG then flows through the throttle valve and is separated into gas and liquid phases in the flash chamber. The re-liquefied BOG returns to the LNG fuel tank, while the remaining gaseous BOG flows to the mixing chamber where it combines with the fresh BOG from the fuel tank to begin the cycle anew. For the multi-stage compression process, seawater was used for intercooling the compressed BOG. The effectiveness of the intercoolers was assumed to be 85%. Figure 1b shows a computational model for the system developed using the commercial software AMESim V13. CH4 was used for the properties of LNG, and the two-phase flow library was used to describe the phase change of CH4 during the process. Various types of sub-model, such as compressor (e.g., TPFPUCOMP), half heat exchanger (e.g., TPFEXSIMP), heat flow rate calculators (e.g., THPHI), throttle valve (e.g., TPFSEC), and fluid separator (e.g., TPFFS) were utilized to model the multi-compressors, the gas-to-seawater intercoolers and the regenerator, the process of throttling, and the separating phases of BOG, respectively [21].

2.2. T–s, P–h Diagrams

Figure 2a,b show the P–h and T–s diagrams of the system, respectively. Multi–compression processes increase the temperature and pressure of the BOG for optimal combustion conditions in engines. By compressing the BOG in multiple stages, compressor work can be reduced compared with single-stage compression. The single, double, and triple stages compress the gas to 70.86 °C at 16.3 bar, 121.48 °C at 30 bar, and 326.11 °C at 300 bar, respectively. The leftover BOG is condensed, and the temperature of the BOG decreases from 326.11 °C to −118.94 °C. The pressure is maintained at 300 bar, and the pressure drop is ignored. The pressure is reduced from 300 bar to 8.23 bar by the throttle valve, while the temperature of the BOG decreases to −128 °C. The superheated vapor phase of the BOG becomes a saturated liquid and gas mixture with a quality of 0.1544.

2.3. Calculation Equations

To properly design the re-liquification system, the generation rate of BOG from the LNG fuel tank must be calculated. The mass flow rate of the generated BOG is given as follows:
B O G = V × L v × ρ × V γ ,
where V represents the volume of the LNG storage tank, L v represents the liquid level of the tank, ρ represents the average density of the generated BOG, and V γ represents the BOG evaporation rate. The mass flow rate of the expansion valve can be calculated as
m ˙ 1 = 1 k × a r e a × 2 × ρ × Δ P ,
where a r e a represents the cross–sectional area of the restriction at the inlet, Δ P represents the pressure differential, and k represents the friction coefficient. Both the expansion and contraction friction coefficients, i.e., k e x p and k c o n t , respectively. They can be defined as follows:
k e x p = 1 a r e a 1 a r e a 2 2 ,
k c o n t = 1 1 0.6 + 0.4 × a r e a 1 a r e a 2 3 2 ,
where a r e a 1 and a r e a 2 represent the cross-sectional areas of the inlet and outlet, respectively.
The system includes three gas-to-seawater intercoolers and one regenerative heat exchanger (i.e., condenser). The heat capacity rates of the inlet ( C 1 ) and outlet ( C 2 of the heat exchangers are defined as follows:
C 1 = d m 1 × C p 1 ,
C 2 = d m 2 × C p 2 ,
where d m 1 and d m 2 represent the fluid mass flow rates, and C p 1 and C p 2 represent the fluid constant-pressure specific heats at the inlet and outlet of the heat exchanger, respectively.
The minimal and maximal heat capacity rates C m i n and C m a x are given as follows:
C m i n = m i n C 1 , C 2 ,
C m a x = m a x C 1 , C 2 .
The resulting flow stream capacity ratio C r can be derived as
C r = C m i n C m a x .
Owing to the characteristics of the regenerator, the heat flow rate depends on both of the mass flow rates. The steady-state heat flux, ϕ s t e a d y , can be derived as
ϕ s t e a d y = ϕ e x p × T 2 T 1 t d i f f ,
where ϕ e x p represents the heat flux, t d i f f represents the temperature difference, and T 1 and T 2 represents the inlet and outlet temperature, respectively. Therefore, the steady-state effectiveness, ϵ s t e a d y is defined as
ϵ s t e a d y = | ϕ s t e a d y | C m i n × T 2 T 1 .
The isentropic efficiency of the compressor was used to calculate the enthalpy change. The isentropic efficiency can be expressed as
η i s = h d i s h s h d h s ,
where η i s represents the isentropic efficiency, h d i s represents the isentropic discharge specific enthalpy, h s represents the suction specific enthalpy, and h d represents the discharge specific enthalpy of the compressor.
Therefore, the enthalpy change Δ h can be calculated as
Δ h = h d h s = h d i s h s η i s .
The enthalpy flow rate increases, indicating that the compression work W c increases
W c = d m × Δ h .
The ability to reduce greenhouse-gas emissions via by the re–liquification of BOG can be expressed by the tonnes of oil equivalent (TOE) and tonnes of CO2 equivalent (TCO2). The TOE and TCO2 are given as follows:
T O E = m ˙ × L H V ÷ 10 7 ,
T C O 2 = t C × 44 12 ,
where m ˙ represents the mass flow rate, and L H V represents the lower heating value of the LNG circulating through the system. The total carbon t C is given as follows:
t C = m ˙ × L H V × C E F ÷ 10 6
where C E F represents the carbon emission factor of the LNG.

2.4. Case Study Model

As discussed here and in previous work [19], the pressure of the BOG from the LNG tank is 8.23 bar, and the pressure of the gas supplied to the high-pressure LNG injection engine is 300 bar. We assume that the volume of the storage tank is 140,000 m3, liquid level is 90%, density is 437.9 kg/m3, evaporation rate is 0.1%/day, and the expected BOG generation rate is 2327 kg/h. Any leftover BOG after the engine has been fueled should be released owing to safety concerns (i.e., increasing the system pressure). Instead of being released into the atmosphere, the leftover BOG can be liquefied and sent back to the LNG tank. The design of a BOG re-liquification system is closely related to the speed of the LNG tanker. Table 1 presents the fuel consumption flow rate, leftover BOG from LNG in the condenser, excess BOG flow rate into the atmosphere, and re-liquefied LNG flow rate, for five different tanker cruising speeds. A case study was conducted for five operating conditions with a maximum re-liquification rate of 84.56% during the throttling process from 300 to 8.23 bar under single-stage, double-stage, and triple-stage compression.
As indicated by Table 1, in Cases 0–2, a certain portion of the BOG must be vented to the atmosphere owing to the limited refrigeration capacity of the re-liquification system. However, as the amount of BOG consumed by the engine increases, the flow rate through the condenser decreases, allowing the remainder of the BOG to circulate through the system without releasing leftover BOG.
The mass flow rate of boil-off LNG from the tank is approximately 0.64638 kg/s, but when the leftover BOG circulates through the re-liquification cycle, it is added to the boil-off LNG from the storage tank before flowing through the compressor. Although the quality of BOG is fixed at 0.1544 in the flash chamber, the mass flow rates of the BOG vary (i.e., according to the vessel speed); however, they all converged and became steady at a constant value after three cycles. Therefore, all calculations were performed under steady-state conditions. Figure 3 shows the change in the flow rate of the BOG with respect to the number of cycles and illustrates how the flow rate becomes constant.

3. Results and Discussion

3.1. Total Compression Work

Figure 4 presents the total compressor work for the three different stages of compression in each case. The total compressor work was calculated for the maximum re-liquification ratio (84.56%) of the BOG for five cases, as discussed previously. As the speed of the ship increases, the total compression work decreases because the flow rate of the leftover BOG is reduced. Additionally, increasing the number of compression stages with intercooling decreases the total compressor work. The average total compressor work of double- and triple-stage compression was 10.0% and 18.5% lower than that of single-stage compression, respectively.

3.2. Additional Seawater Flow Rate

Figure 5 presents the total required flow rate of seawater for cooling the BOG through the intercoolers and condenser. The flow rates of the BOG presented in Table 1 were used to determine the required seawater flow rate for each case. The temperature of the seawater was assumed to be 18 °C for the calculation. The required flow rate of the seawater decreases with an increase in the cruising speed because the re-liquefied flow rate of the BOG decreases. The flow rate for single-stage compression refers to the seawater influx into the condenser. Compared with single-stage compression, the required seawater for cooling the BOG was increased by approximately 308% and 535% on average for double- and triple-stage compression, respectively. Each additional compression stage increases the amount of seawater to cool down the compressed BOG as it exits the compressor. However, an increase in the vessel speed leads to more fuel consumption in the engine, and the smaller amount of leftover BOG results in less work for the compressors and thus leads to a smaller amount of cooling seawater required.

3.3. Energy Waste

As mentioned previously, boil-off LNG can be used as fuel in the engine, but the leftover BOG released into the atmosphere results in considerable energy losses, which can be reduced by the re-liquification system. However, some energy is inevitably consumed in operating the compressor. The waste energy and consumption can be expressed by the TOE. Figure 6 presents the energy reduction achieved by the re-liquification system and energy consumption of the compressors in terms of the TOE. Conversion factors were used to calculate the TOE of the LNG and the power consumption of the compressors: 1.306 × 10⁻³ TOE/kg and 0.229 × 10⁻³ TOE/kWh, respectively [22]. The reduction in the TOE for all the cases indicated that the re-liquification system reduced the TOE significantly. Cases 1 and 2 exhibited TOE reductions of approximately 67%, and 84%, respectively, compared with the system without re-liquification. In Cases 3–5, all of the leftover BOG was re-liquefied; thus, the energy consumption was solely due to compression processes. Therefore, the TOE is lowest when the tanker is cruising at the highest speed, because the minimum amount of leftover BOG needs to be re-liquefied by the system. The average TOE reduction was 9120.40 TOE/year for the five different cases.

3.4. Greenhouse Gas Emissions

In addition to energy losses, releasing the leftover BOG into the atmosphere causes pollution. Therefore, the re-liquification system also reduces emissions. The leftover BOG is mostly methane, which has a greenhouse effect that is 10 times stronger than that of CO2. The effect of the leftover BOG on emissions was evaluated in terms of TCO2. Figure 7 presents the production of CO2 equivalent emissions from the leftover BOG and the generation of CO2 emissions due to compressor operation. Conversion factors were used to evaluate the TCO2 of the leftover BOG and the power consumption of the compressors: 15.312 TCO2/TJ and 0.4594 TCO2/MWh, respectively [23]. The re-liquification system reduced the TCO2 generation by 67%, 84%, 100%, 100%, and 100% for Cases 1–5 respectively, by reducing BOG disposal. However, when the utilization of the compressors in the system is considered, the TCO2 generation reduction changes to 62.1%, 77.8%, 91.9%, 88.2%, and 69.5% for each case, respectively. The average TCO2 reduction was 19,474.33 TCO2/year for the five different cases.

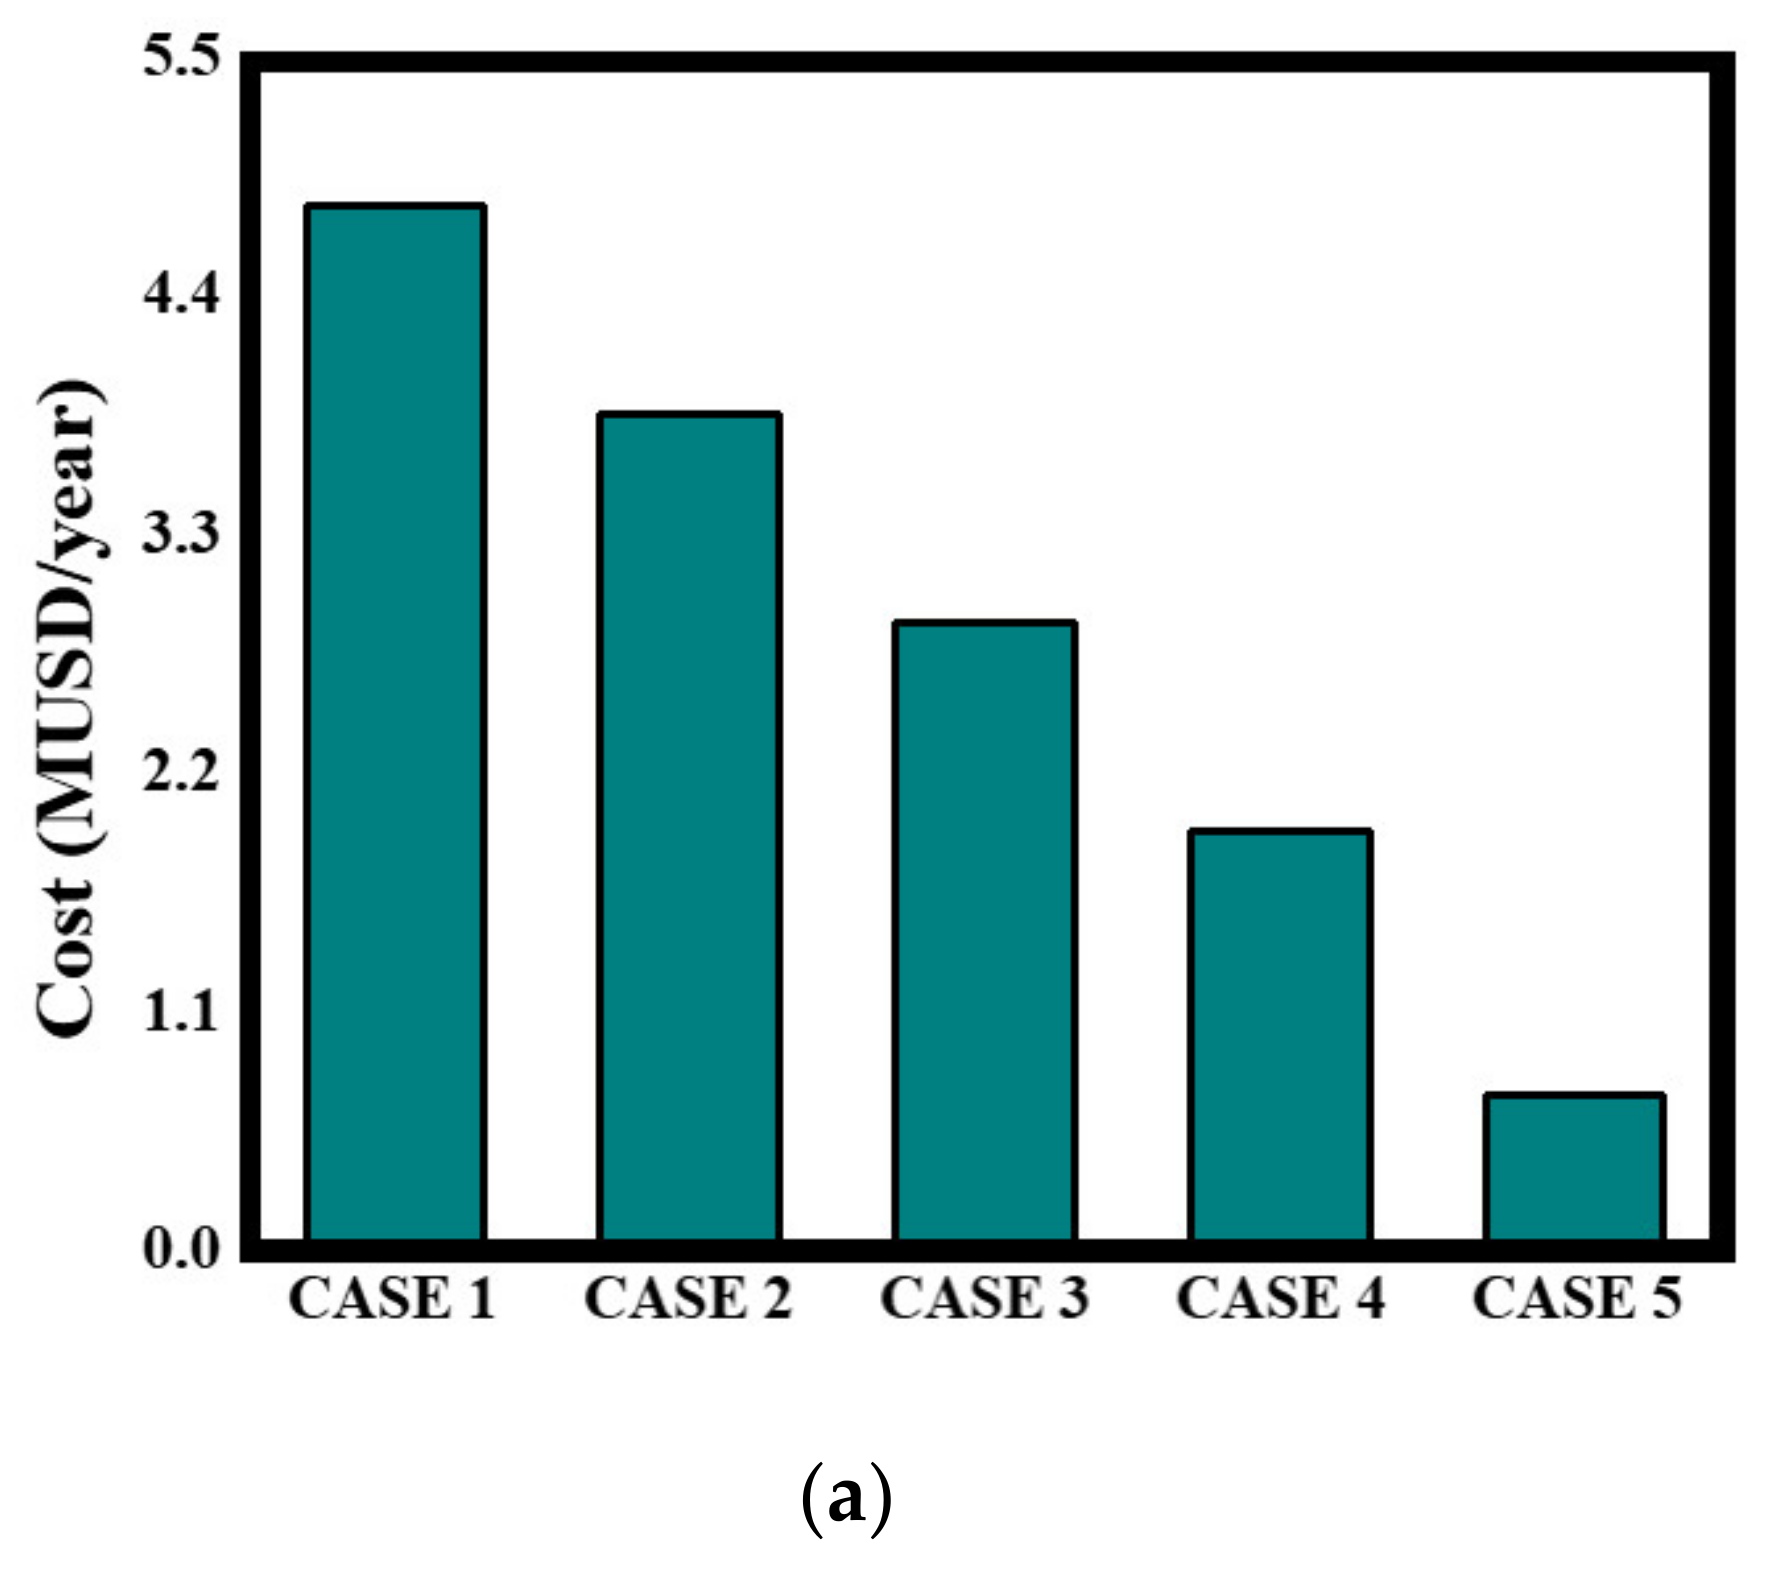
3.5. Annual Cost Reduction

Figure 8 shows the cost generation obtained using the system, including the compressor operating cost in all five cases; the re-liquification system reduced the amount of BOG released into the atmosphere (i.e., waste LNG), leading to a significant cost reduction. However, the energy consumption due to the compressor operation must be considered. The conversion factor for LNG savings and power consumption of the compressors were $5.82/Mscf and $0.107/kWh, respectively [24]. In spite of the energy consumed by the compressors, the maximum net cost in Case 1–5 was 2.1326, 1.1612, 0.542, 0.52509, and 0.50529 MUSD/year, respectively. Relatively larger cost reductions of 67% and 84% were achieved for Case 1 and 2, respectively, but there were diminishing returns as the cruising speed increased. The reduction of cost owing to conservation of LNG, which was attributed to the re-liquification of BOG, was counteracted somewhat by the energy consumption of the compressors. In particular, for Case 5, the net cost reduction was relatively insignificant because the amount of re-liquefied BOG was small, but the energy consumption of the compression process was large as most of the recovered gas was directed to the engines. The average cost reduction for the five cases was 1.9765 MSDU/year.

4. Conclusions

We developed a computational model of a re-liquification system for recovering BOG generated in storage tanks of LNG carriers and evaluated the performance of the system with regard to the TOE, TCO2, and cost reduction. The reflux system was modeled, and a case study was conducted to assess system viability. Energy wastage was assessed for five different LNG tanker cruising speeds with multi-stage compression, using LNG as fuel for propulsion. The following conclusions are drawn.
  • The double- and triple-stage compression decreased compression powers by up to 10% and 18.5%, respectively, but increased the seawater flow rate by 308% and 535% for intercooling compared with single-stage compression.
  • The re-liquification system reduced the TOE, TCO2, and fuel costs by up to 76.7%, 77.1%, and 69.3%, respectively, for five different LNG tanker speeds.
  • The re-liquification of BOG is more critical at lower vessel speeds, and the benefits of the system become relatively insignificant at high speeds (i.e., more BOG is used for engine-out power production) because the BOG disposal decreases.
  • The re-liquification of BOG must be performed continuously because it is preferable to release the CO2 that results from compressor operation rather than boil off LNG in terms of greenhouse-gas emissions.
The KC–1 membrane type LNG tankage was selected in this case study, and specific values could be varied for different types of tanker. This study is expected to provide a viable tool for the development and optimization of BOG re-liquification systems for LNG tankers.

Author Contributions

Conceptualization, K.K.; methodology, K.K.; software, S.-H.S.; validation, K.K. and S.-H.S.; formal analysis, S.-H.S.; investigation, S.-H.S.; resources, S.-H.S.; data curation, S.-H.S.; writing—original draft preparation, S.-H.S.; writing—review and editing, K.K.; visualization, S.-H.S.; supervision, K.K.; project administration, K.K.; funding acquisition, K.K. All authors have read and agreed to the published version of the manuscript.

Funding

This research was funded by National Innovative Cluster R&D Project, grant number P0006674, and authors appreciate the financial support.

Acknowledgments

The authors appreciate the valuable contribution of art-works made by Jin–sang Yoon in this paper.

Conflicts of Interest

The authors declare no conflict of interest.

References

  1. Karagöz, Y.; Sandalcı, T.; Koylu, U.O.; Dalkılıç, A.S.; Wongwises, S. Effect of the Use of Natural Gas–Diesel Fuel Mixture on Performance, Emissions, and Combustion Characteristics of a Compression Ignition Engine. Adv. Mech. Eng. 2016, 8, 1–13. [Google Scholar] [CrossRef]
  2. Kim, K.; Kim, H. Characterization of products from Fe(CO)5 seeded CO diffusion flame. Energy 2018, 148, 802–808. [Google Scholar] [CrossRef]
  3. Kim, S.L.; Choi, K.W.; Lee, K.; Kim, K. Evaluation of automotive waste heat recovery for various driving modes. Energy 2016, 106, 579–589. [Google Scholar] [CrossRef]
  4. Kim, K.; Kim, H.; Lee, K. Novel strategies and optimization techniques to reduce harmful diesel engine emissions. Environ. Eng. Sci. 2012, 29, 335–342. [Google Scholar] [CrossRef]
  5. McTaggart-Cowan, G.P.; Jones, H.L.; Rogak, S.N.; Bushe, W.K.; Hill, P.G.; Munshi, S.R. Direct-Injected Hydrogen-Methane Mixtures in a Heavy-Duty Compression Ignition Engine; SAE Technical Paper Series, 2006; SAE International: Warrendale, PE, USA, 2006. [Google Scholar]
  6. Oh, J.; Kim, K.; Lee, K. Effects of various mixer types on the spatial distribution of a De-NOx reductant. Fuel 2012, 94, 93–101. [Google Scholar] [CrossRef]
  7. Zhou, J.H.; Cheung, C.S.; Leung, C.W. Combustion, performance and emissions of a diesel engine with H2, CH4 and H2-CH4 addition. Int. J. Hydrog. Energy 2014, 39, 4611–4621. [Google Scholar] [CrossRef]
  8. Shin, M.W.; Shin, D.; Choi, S.H.; Yoon, E.S. Optimal operation of the boil-off gas compression process using a boil-off rate model for LNG storage tanks. Korean J. Chem. Eng. 2008, 25, 7–12. [Google Scholar] [CrossRef]
  9. Jeong, H.; Kim, T.; Kim, S.; Shim, W.J. Thermal Analysis of Insulation System for KC-1 Membrane LNG Tank. J. Ocean Eng. Technol. 2017, 31, 91–102. [Google Scholar] [CrossRef] [Green Version]
  10. Bukowski, J.D.; Liu, Y.N.; Boccella, S.J.; Kowalski, L.J. Innovations in NG Liquification Technology for Future LNG Plants and Floating LNG Facilities. In Proceedings of the International Gas Union Research Conference, Seoul, Korea, 19–21 October 2011. [Google Scholar]
  11. Mate, O.M.; Diaz, A.M. Reliquification Systems for Marine Application. In Proceedings of the World Maritime Conference, San Francisco, CA, USA, 17–20 October 2003; pp. 1–15. [Google Scholar]
  12. Vorkapić, A.; Kralj, P.; Bernečić, D. Ship systems for natural gas liquefaction. Pomorstvo 2016, 30, 105–112. [Google Scholar] [CrossRef] [Green Version]
  13. Barron, R.F. Cryogenic Systems, 2nd ed.; Oxford University Press: New York, NY, USA, 1985. [Google Scholar]
  14. Adamkiewicz, A.; Cydejko, J. The Influence of Energy Consumption of Gas Vapour Reliquification on the Structure of the LNG Carrier Power Plant. Naše More 2016, 63, 38–42. [Google Scholar] [CrossRef]
  15. Beladjine, B.M.; Ouadha, A.; Addad, Y. Thermodynamic analysis of hydrocarbon refrigerants-based ethylene BOG re-liquification system. J. Mar. Sci. Appl. 2016, 15, 321–330. [Google Scholar] [CrossRef]
  16. Rao, H.N.; Wong, K.H.; Karimi, I.A. Minimizing Power Consumption Related to BOG Reliquification in an LNG Regasification Terminal. Ind. Eng. Chem. Res. 2016, 55, 7431–7445. [Google Scholar] [CrossRef] [Green Version]
  17. Tan, H.B.; Zhao, Q.X.; Sun, N.N.; Li, Y.Z. Enhancement of energy performance in a boil-off gas re-liquification system of LNG carriers using ejectors. Energy Convers. Manag. 2016, 126, 875–888. [Google Scholar] [CrossRef]
  18. Romero, J.; Orosa, J.A.; Oliveira, A.C. Research on the Brayton cycle design conditions for reliquification cooling of LNG boil off. J. Mar. Sci. Technol. 2012, 17, 532–541. [Google Scholar] [CrossRef]
  19. Hwang, C.; Lim, Y. Optimal Process Design of Onboard BOG Re-liquification System for LNG Carrier. J. Ocean Eng. Technol. 2018, 32, 372–379. [Google Scholar] [CrossRef]
  20. MAN Diesel & Turbo. Marine Engine IMO Tier II and Tier III Programme 2nd Edition. 2017. Available online: https://marine.mandieselturbo.com/docs/librariesprovider6/marine-engine-programmes/mep2017_2web.pdf?sfvrsn=0 (accessed on 4 February 2020).
  21. LMS. Simcenter Amesim Help. 2017. Available online: https://docs.plm.automation.siemens.com/content/amesim/17/help/en_US/simcenter_amesim_17/simcenter_amesim_help.html (accessed on 16 July 2020).
  22. International Energy Agency (IEA). Available online: https://www.iea.org/ (accessed on 16 July 2020).
  23. Intergovernmental Panel on Climate Change (IPCC). IPCC Guidelines for National Greenhouse Gas Inventories Volume 2. 2006. Available online: https://www.ipcc-nggip.iges.or.jp/public/2006gl/vol2.html (accessed on 16 July 2020).
  24. U.S. Energy Information Administration (EIA). Price of Liquefied U.S. Natural Gas Exports. Available online: https://www.eia.gov/dnav/ng/hist/n9133us3m.htm (accessed on 4 February 2020).
Figure 1. Modeling of the liquefied natural gas (LNG) re-liquification system: (a) schematic; (b) AMESim model.
Energies 13 03894 g001
Figure 2. Thermodynamic condition diagram of each state: (a) P–h; (b) T–s.
Energies 13 03894 g002aEnergies 13 03894 g002b
Figure 3. Flow rate of BOG in the re-liquification cycle for cases 1–5.
Energies 13 03894 g003
Figure 4. Total compression work and re-liquification flow rate for each case.
Energies 13 03894 g004
Figure 5. Seawater flow rate for cooling the intercooler and condenser for the five cases.
Energies 13 03894 g005
Figure 6. Tonnes of oil equivalent (TOE) generation due to BOG disposal (a) without re-liquification and, (b) with re-liquification. The TOE generation is solely from compression work for Cases 3 to 5 because there is no BOG disposal in these cases.
Energies 13 03894 g006aEnergies 13 03894 g006b
Figure 7. Tonnes of CO2 (TCO2) generation due to BOG disposal (a) without re-liquification and (b) with re-liquification. The TCO2 generation is solely from compression work for Cases 3–5 because there is no BOG disposal in these cases.
Energies 13 03894 g007aEnergies 13 03894 g007b
Figure 8. Annual cost generation due to BOG disposal (a) without re-liquification and (b) with re-liquification. The cost generation is mostly from compression work for Case 3 to5 because there is less BOG disposal in these cases.
Energies 13 03894 g008aEnergies 13 03894 g008b
Table 1. Boil-off gas (BOG) disposal flow rate according to the fuel consumption rate and vessel speed.
Cruising Speed
[km/h]
Fuel Consumption
[kg/h]
Condenser BOG Flow Rate
[kg/h]
Disposed BOG Flow Rate
[kg/s]
Re-Liquefied LNG Flow Rate
[kg/s]
Case 00023270.319570.32683
Case 123.1557117560.160960.32681
Case 225.9392014070.062530.32830
Case 328.711269105800.29389
Case 431.48161770900.19694
Case 534.26206226500.07361

