Abstract
Overdischarge often occurs during the use of battery packs, owing to cell inconsistency in the pack. In this study, the overdischarge behavior of 2.9 Ah cylindrical NCM811 [Li(Ni0.8Co0.1Mn0.1)O2] batteries in an adiabatic environment was investigated. A higher overdischarge rate resulted in a faster temperature increase in the batteries. Moreover, the following temperatures increased: Tu, at which the voltage decreased to 0 V; Ti, at which the current decreased to 0 A; and the maximum temperature during the battery overdischarge (Tm). The following times decreased: tu, when the voltage decreased from 3 to 0 V, and ti, when the current decreased to 0 A. The discharge capacity of the batteries was 3.06–3.14 Ah, and the maximum discharge depth of the batteries was 105.51–108.27%. Additionally, the characteristic overdischarge behavior of the batteries in a high-temperature environment (55 °C) was investigated. At high temperatures, the safety during overdischarging decreased, and the amount of energy released during the overdischarge phase and short-circuiting decreased significantly. Shallow overdischarging did not significantly affect the battery capacity recovery. None of the overdischarging cases caused fires, explosions, or thermal runaway in the batteries. The NCM811 batteries achieved good safety performance under overdischarge conditions: hence, they are valuable references for battery safety research.
1. Introduction
In 1978, Exxon issued a Li/Ti battery with an energy density of 130 Wh/kg. In 1991, Sony produced a C/LiCoO2 battery with an energy density of 150–190 Wh/kg. To date, the energy density of C/NCA [Li(NixCoyAlz)O2] batteries can reach 300 Wh/kg [1]. Li-ion batteries have the advantages of a high specific energy, high operating voltage platform, and low self-discharge rate; hence, they are currently the most practical option for electric vehicle (EV)/Plug in Hybrid Electric Vehicle(PHEV) batteries [2]. In the future, graphite may be replaced with oxide and nanomaterials as the negative electrodes that be used in EVs/PHEVs, which will improve the C-rate capability, cycling stability, calendar life, and abuse tolerance [3]. However, frequent battery accidents have restricted the adoption of Li-ion batteries to electric vehicles. The root cause of fires and explosions in Li-ion batteries is thermal runaway (TR) caused by battery failure. TR is caused by thermal abuse [4], electrical abuse, and mechanical abuse [5]. Multiple battery cells are connected in series and parallel to form a battery box. Owing to cell inconsistency in the pack, some units are often overdischarged. Overdischarging is a form of battery abuse and necessitates further studies [6].
Qian et al. [7] overdischarged an NCM111 [Li(Ni1/3Co1/3Mn1/3)O2]/graphite battery to 2 V for lifespan testing. The result of this shallow overdischarge demonstrated the deterioration of stability of the NCM111 crystal structure. When normal cycling was conducted on the overdischarged batteries, the degradation of the batteries was restrained, and the internal resistance was improved [8]. However, the battery life decreased from 1500 to 1300 cycles. It is safe to overcharge the battery, as a TR is unlikely to occur. Brand et al. [9] compared the overdischarge safety of NCM/graphite, NCA/graphite, and LiFePO4/graphite batteries. Dangerous temperature increases were not observed for these three types of batteries, and damage to the battery case or electrolyte leakage was observed. The LFP/C batteries exhibited a low voltage drop and the lowest maximum temperature. Liu et al. [10] discovered that a battery could only charge/discharge for 49, 7, 3, and 1 cycles when it was overdischarged at 5%, 10%, 15%, and 20%, respectively; the battery overdischarge process was investigated using electrochemical impedance spectroscopy (EIS). The ohmic resistance R0, solid electrolyte phase resistance RSEI, and Warburg coefficient σ can be used as indicators to predict faults in batteries. Maleki et al. [11] reported that overdischarging a battery to 0.5 V had negligible effects on the thermal stability of the battery, overcharge performance, and direct current resistance; however, it caused the battery to generate gases. When the battery was overdischarged to 0 V, its thickness increased by 70%, and the direct current resistance increased by 250%. Zheng et al. [12] reported that when a battery was overdischarged to a low voltage, the solid electrolyte interphase (SEI) membrane dissolved and cracked; consequently, H2, CH4, and C2H6 gases are generated in batteries whose overdischarge cut-off voltage is 1 V. Juarez et al. [13] discovered that the maximum surface temperature of a battery during overdischarge was highly dependent on the C-rate. The surface temperature of a battery overdischarged at 1 C reached 79 °C. Ouyang [14] reported that the temperature rise of batteries increased during overcharging/overdischarging. Moreover, a closer proximity to the battery opening corresponded to a higher surface temperature. The main sources of heat generation during overdischarging were assumed to be the concentration polarization before the beginning of the Cu dissolution and the rupturing of the SEI layer. Although the energy density of ternary metal oxide active materials increases with the Ni content, their structures become increasingly unstable. Li(Ni0.8Co0.1Mn0.1)O2, which is abbreviated as NCM811, is a widely studied electrode material with a high energy density and power density. However, studies on the overdischarge behavior of NCM811 batteries are scarce.
Regarding the mechanism of overdischarge-induced TR, researchers have discovered that if a battery is discharged to 0 V, it undergoes an electrochemically irreversible solid-state amorphization process [15]. Most researchers believe that the dissolution of Cu is the main cause of capacity decay and internal short circuits (ISCs) [16,17]. Guo et al. [18] discovered that when a battery is overdischarged to a state of charge (SOC) of −12%, the Cu current collector dissolves, leading to the deposition of Cu on the electrode, inducing the formation of an ISC. Overdischarging damages the electrode material and decomposes the SEI film. Lai et al. [19] studied the electrical characteristics of an ISC caused by overdischarging. The probability of an ISC increases nonlinearly with the increasing degree of overdischarge. When a battery is overdischarged to approximately 118% of the depth of discharge, the ISC rate is maximized. ISC self-healing occurs after a long period of rest in a battery with a discharge depth below 125%. He et al. [20] observed that, during the overdischarging, Cu was oxidized to Cu+ and Cu2+, which then diffused from the negative-electrode side to the positive-electrode side. Finally, Cu2+ was reduced to Cu+ and then further reduced to metallic Cu. During the charging/overdischarging cycle, Cu dendritic crystals continued to grow from the side of the negative electrode, passed through the separator, and then formed a Cu bridge between the positive and negative electrodes. The chemical reactions involved are expressed as follows:
Oxidation: Cu → Cu+ + e− 3.92 V (vs. Li/Li+).
Cu+ → Cu2+ + e− 4.17 V (vs. Li/Li+).
Reduction: Cu2+ + e− → Cu+ 3.28 V (vs. Li/Li+).
Cu+ + e− → Cu 3.19 V (vs. Li/Li+).
Zhang and Wu et al. [21,22] discovered that the positive electrode of a battery after discharging contained brass. Ye et al. [23] observed that the temperature of the negative electrode was always higher than that of the positive electrode during overdischarging; an electrochemical reaction platform in which the Cu current collector was dissolved was observed at 0.5 V, and the overdischarge reduced the SEI film decomposition temperature. Johannes [24] confirmed the presence of elemental Cu on the surface of the positive electrode after overdischarging using scanning electron microscopy (SEM) and energy-dispersive X-ray spectroscopy (EDS). The relevance of Cu dissolution and deposition and possible solution approaches were also discussed.
Because overdischarging may not cause cell fires or explosions, it is safer than overcharging. The scarce existing research on overdischarging primarily focuses on the effect of shallow overdischarge on battery cycle use. In this study, the changes in the temperature, voltage, and current during the overdischarging of a high-energy density NCM811 battery to 0 V at different rates were examined. Additionally, the changes in the structure of the electrode material after overdischarging were analyzed via SEM.
2. Experimental Methods
2.1. Samples
The samples used were commercial 18,650 cells, which were labeled as 2.9 Ah and can be referred to as NCM811 (Li(Ni0.8Co0.1Mn0.1)O2) batteries. The anode material was graphite. The recommended operating voltage window of the battery was 2.5–4.2 V. The electrolyte was LiPF6. The actual capacity was tested via charging and discharging for three cycles at a rate of 1 C (2.9 A).
2.2. Overdischarge Test
Overdischarge adiabatic TR experiments were conducted using an adiabatic accelerated rate calorimeter (ARC) BTC130 produced by British Hel Limited. The ARC uses an “Adiabatic Test” mode to detect the exothermicity of the sample. It heats the sample to the initial temperature, and the system automatically enters the search mode to detect the temperature rise rate of the sample. If the temperature rise rate of the sample exceeds the set value, the system determines that the sample contains self-exothermic heat and records the self-discharge heat rate. Furthermore, the system ensures that the temperature of the calorimeter remains synchronized with the temperature of the sample to avoid heat loss. This provides an adiabatic environment and tracks the exothermic reaction of the sample. Simultaneously, the temperature change of the sample is related to its own reaction only. High-temperature-resistant tape was used to wind the heating wire uniformly near the positive electrode of the battery for 2–3 turns. The thermocouple was bonded near the negative electrode. The wrapped battery was then fixed in the ARC furnace cavity. The design of the overdischarge TR experimental platform is shown in Figure 1. After it was confirmed that the experimental equipment was connected correctly, the ARC was activated. The parameter settings in the “Adiabatic Test” mode are presented in Table 1. Further, the battery cell test system was activated to perform overdischarging; after a cooldown period, the experiment was concluded.
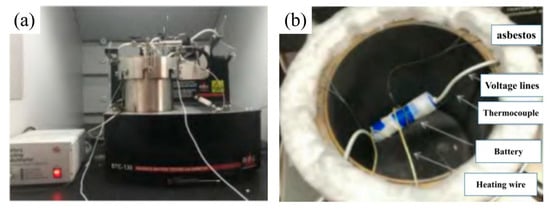
Figure 1.
(a). Overdischarge TR experimental platform; (b). The experiment was ready

Table 1.
Accelerated rate calorimeter (ARC) parameter settings in the “Adiabatic Test” mode.
The mentioned experiments were performed to investigate the thermal characteristics of the NCM811 battery during the overdischarge TR process. The temperature at which the battery voltage decreased to 0 V is denoted as TU, the temperature at which the battery current decreased to 0 A is denoted as TI, the maximum temperature reached by the battery during the overdischarge TR is denoted as Tm, the time taken for the battery voltage to decrease from 3 to 0 V is denoted as tu, and the time taken for the battery current to decrease to 0 A is denoted as ti. The ARC parameter settings in the “Adiabatic Test” mode are presented in Table 1.
In addition, the “H-W-S” (Heat-Wait-Seek) mode of the ARC was used to investigate the temperature at which the decomposition of the SEI film began and the temperature at which the battery separator melted.
2.3. Material Characterization
The surface morphologies of the electrode materials were observed by the SUPRA35 scanning electron microscope (SEM, LEO, Oberkochen, Germany), equipped with an energy-dispersive spectroscopy (EDS, INCA, Oxford Instrument, Oxford, UK) system. A thin layer of gold was sputtered on the surface of the samples before the SEM examination.
3. Results and Discussion
3.1. Thermal Runaway during Overdischarging at Different C-Rates
A fully charged NCM811 battery was placed in the adiabatic environment of the ARC and overdischarged to 0 V at rates of 0.2, 0.5, 1, and 2 C. The changes in the voltage, current, and temperature rise rate are shown in Figure 2. All the batteries were validated after the overdischarging; however, no TR fires or explosions occurred. In the 0.2 C overdischarge experiment, as shown in Figure 2a, the voltage decreased gradually from 4.2 to 3.0 V, while the battery temperature increased gradually from 25 to 47 °C. Subsequently, the voltage decreased rapidly to 0 V within 1760 s, and the temperature increased by 16 °C. The temperature at which the voltage decreased to 0, i.e., TU = 63 °C, indicated that a Cu bridge was formed between the negative and positive electrodes of the battery [20]. The battery experienced an ISC, and the current immediately decreased from 0.58 to 0.1–0.2 A. After some time, it decreased to 0 A. When the current was 0 A, the battery temperature TI was 89 °C. The maximum temperature, Tm, during the battery overdischarge was 106 °C, the discharge capacity was 3.123 Ah, and the SOC was 112.5%.
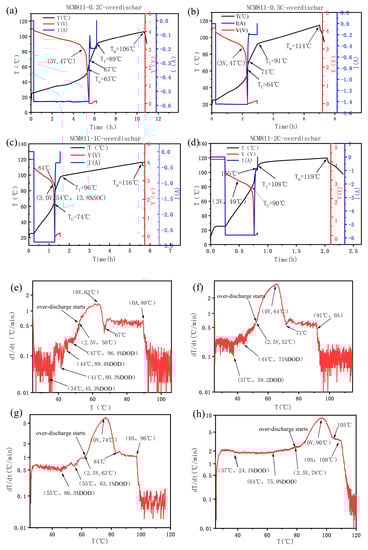
Figure 2.
Battery voltage, current, and temperature changes during overdischarging. (a,e) 0.2 C overdischarge; (b,f) 0.5 C overdischarge; (c,g) 1 C overdischarge; and (d,h) 2 C overdischarge.
In the 0.5 C overdischarge experiment, as shown in Figure 2b, the voltage decreased gradually from 4.2 to 3.0 V, while the battery temperature increased slowly from 25 °C to 47 °C, after which the voltage decreased rapidly to 0 V within 940 s. The temperature increased by 17 °C. The temperature at which the voltage decreased to 0 (TU) was 64 °C. The discharge capacity was 3.138 Ah, and the SOC was 113.5%. After the battery generated an ISC, the voltage was maintained at 0 V, and the current immediately decreased from 1.45 to 0.2 A; after a period of stability, it decreased to 0 A. When the current was 0 A, the battery temperature TI was 91 °C, and the maximum temperature Tm during the overdischarge process was 114 °C. In the 1 C overdischarge experiment, as shown in Figure 2c, the voltage gradually decreased from 4.2 to 3.0 V, while the battery temperature slowly increased from 25 to 54 °C. At this time, the discharge capacity of the battery was 2.392 Ah, and the remaining capacity was 13.83% SOC. Subsequently, within 760 s, the voltage decreased rapidly to 0 V, while the temperature increased by 20 °C. At this time, the temperature at which the voltage decreased to 0 (TU) was 74 °C, the battery discharging capacity was 3.116 Ah, and the SOC was 112.2%. After the battery generated an ISC, the voltage was maintained at 0 V, and the current immediately decreased from 2.9 to 0.36 A, where it remained for a period before decreasing further to 0 A. When the current was 0 A, the battery temperature (TI) was 96 °C, and the maximum temperature (Tm) during the overdischarge process was 116 °C.
In the 2 C overdischarge experiment, as shown in Figure 2d, the voltage gradually decreased from 4.2 to 3.0 V, while the battery temperature increased slowly from 25 to 49 °C. Then, the voltage decreased rapidly to 0 V within 1060 s, while the temperature increased by 41 °C. At this time, the temperature at which the voltage decreased to 0 (TU) was 90 °C, the battery discharge capacity was 3.062 Ah, and the SOC was 110.9%. After the battery experienced an ISC, the voltage remained at 0 V, and the current decreased immediately from 5.8 to 0.9 A. The current then decreased to 0 A after a period of stability. When the current was 0 A, the battery temperature (TI) was 108 °C, and the maximum temperature Tm during the overdischarging was 119 °C.
The change in the temperature rise rate reflects the complexity of the ISC induced by overdischarging. Figure 2e shows the relationship between the temperature and the temperature rise rate in the 0.2 C overdischarge experiment. During the normal discharge phase under adiabatic conditions, three peaks appeared in the plot of the temperature change rate. The boundaries of these three peaks appeared at 34, 41, 44, and 47 °C, and the corresponding discharge depths were 45.3%, 80.2%, 89.4%, and 96.4%, respectively. The polarization resistance increased significantly at the beginning and end of the discharge process. Owing to the longer discharge time at the lower C-rate, more experimental data pertaining to the internal polarization resistance were obtained. The peaks were due to the increased internal polarization resistance. As shown in Figure 2f–h, the temperature rise rate exhibited clear peaks owing to the polarization resistances in the 0.2 C, 0.5 C, and 1 C experiments. However, the stable polarization resistance at 2 C maintained a high Joule thermal power, and the temperature rise rate remained stable. The ISC that occurred in each test caused a significant temperature increase. Additionally, small temperature peaks were observed before the ISC occurred in the 0.2, 0.5, and 1 C overdischarge experiments. This is because the Cu redox reaction generated heat before a micro-short-circuit occurred. The temperature peaks may have been related to these reactions.
After short circuit occurred, the voltage remained at 0 V, and the discharge current decreased gradually. In the 0.2 C experiment, the temperature rise rate decreased gradually after the short circuit occurred; however, some exothermic processes occurred after a temperature of 67 °C was reached, which increased the local temperature rate. This temperature peak also appeared in the other experiments: at 71 °C in the 0.5 C experiment, 84 °C in the 1 C experiment, and 105 °C in the 2 C experiment; it may have been caused by the growth of the SEI film and the formation of organic polymers [2,25]. Figure 3 shows the temperature increase curve for the high-temperature TR test of the NCM811 battery. The initial temperature of the thermal decomposition of the SEI film for this NCM811 battery was 84 °C, and the melting point of the separator was 108 °C. Therefore, the SEI film on the negative electrode of the battery was partially decomposed in the 0.2 C, 0.5 C, 1 C, and 2 C overdischarge tests.
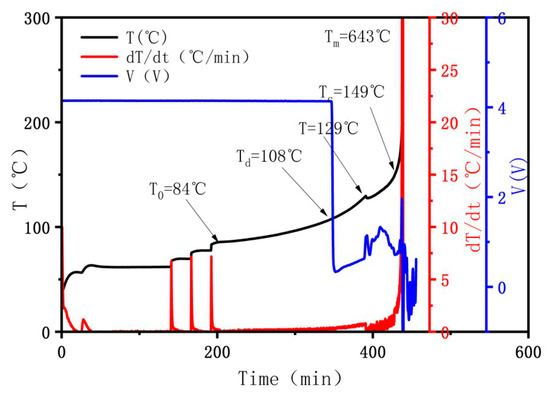
Figure 3.
High temperature thermal runaway (TR) process for the NCM811 battery.
As shown in Figure 4a,b, in the 1 C discharge test of the NCM811 battery at an ambient temperature of 55 °C, the voltage decreased gradually from 4.2 to 3.0 V, and the battery temperature increased slowly from 25 to 76 °C. The battery discharge capacity was 2.46 Ah, and the remaining capacity was 10.86% SOC. After 660 s, the voltage rapidly decreased to 0 V, and the temperature increased by 19 °C. The temperature at which the voltage decreased to 0 (TU) was 95 °C. The battery discharge capacity was 3.067 Ah, and the SOC was 111%. After the battery generated an ISC, the voltage remained at 0 V. Additionally, the current decreased immediately from 5.8 to 0.9 A and then to 0 A after a period of stability. When the current was 0 A, the battery temperature (TI) was 105 °C, and the maximum temperature (Tm) during the overdischarge process was 115 °C. Comparing the results of the 1 C overdischarge at the normal temperature with the results at 55 °C revealed that the temperature at which the voltage decreased to 0 V (Tu) and the temperature at which the current decreased to 0 A (ti) increased significantly. The maximum temperature (Tm) of the overdischarge process was similar, whereas the time when the voltage decreased from 3 to 0 V (Tu) and the time when the short-circuit current decreased to 0 A (ti) both decreased. Thus, the overdischarge safety of the battery was reduced at high temperatures. The energy released during overdischarging and the short circuit decreased significantly.
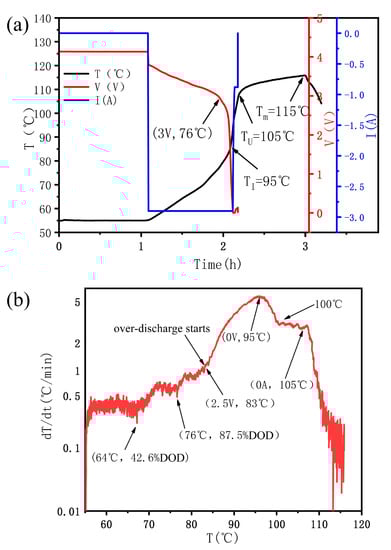
Figure 4.
(a). voltage, current, and temperature changes during overdischarging at 1 C-55 °C; (b). temperature rise rate and temperature changes during overdischarging at 1 C-55 °C.
Figure 5 shows the curves for the short-circuit voltage, current, and energy released over time during overdischarging at different rates under adiabatic conditions. Although the discharge currents differed, the voltages and currents of the batteries with different discharge rates exhibited the same trend during the short-circuit period. At overdischarge rates of 0.2 C, 0.5 C, 1 C, and 2 C, the sharp voltage drops were extended by 900, 360, 200, and 200 s, respectively, and were within the tolerable limits for avoiding faults caused by overdischarging. The current-decay times after the short circuit were 2560, 2280, 240, and 240 s, respectively. According to the power integrated with respect to time recorded by the charge–discharge instrument, the energy released during the overdischarge stage was 628.2, 647, 749.9, and 2006.2 J, respectively, and the energy released during the 2.5–0 V overdischarge phase increased with the discharge rate. The energy released during the short circuit was calculated according to E = c m ΔT, where c = 1 J/(g·s) represents the specific heat capacity of the battery, and ΔT represents the temperature difference of the battery. The energies released by the 0.2 C, 0.5 C, 1 C, and 2 C short circuits were 1986.6, 2270, 1911, and 1313.7 J, respectively. The energy released was the highest at 0.5 C, followed by 0.2 C. It was the lowest at 2 C.
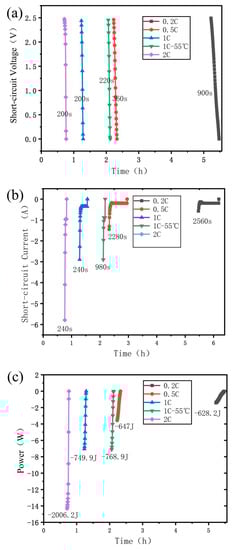
Figure 5.
Changes in (a) voltage, (b) current, and (c) energy over time at different overdischarge rates.
The characteristic parameters of the NCM811 battery overdischarge TR are presented in Table 2. When the battery was overdischarged at a high rate, the fast internal heat generation of the battery resulted in a faster temperature increase, a higher temperature at which the voltage decreased to 0 V (Tu), and a higher temperature at which the current decreased to 0 A (TI). As the battery overdischarge rate increased, the maximum temperature (Tm) during the battery overdischarge increased, and the 2 C rate became slightly lower than the 1 C rate. The time taken for the voltage to decrease from 3 to 0 V (tu) decreased as the overdischarge rate increased. The time taken for the current to decrease to 0 A (ti) also decreased with the increasing overdischarge rate. The energy released during a short circuit increased with the overdischarge rate. The discharge capacity was 3.06–3.14 Ah. Compared with the experiments at 25 °C and at 55 °C, the temperatures Tu and Ti increased significantly. Similarly, the maximum temperature Tm increased, and the times tu and ti decreased. The overdischarge safety of the battery at high temperatures also decreased. The amount of energy released during the overdischarge phase and the short circuit decreased significantly.
Table 2.
Characteristic parameters of the NCM811 battery during the overdischarging TR.
When the mentioned overdischarged batteries were charged at 0.2 C, the capacity of the five samples could not be restored because the battery separators were fused. The temperature, voltage, and temperature rise rate of the battery in the H-W-S mode of the ARC are shown in Figure 3. The temperature, Td, of the battery separators was 108 °C. The maximum temperatures during the overdischarging of the five groups of samples were 106–119 °C.
3.2. Shallow Overdischarge
The NCM811 battery was overdischarged to 1 and 2 V at 1 C in an adiabatic environment. The temperature, voltage, and current change during the overdischarge process are shown in Figure 6. The maximum temperatures reached by the overdischarged batteries were 75 and 74 °C, which were significantly lower than the melting point of the battery separator, and the theoretical capacity of the battery was recoverable. Two batteries were charged and discharged at 0.2 C, and the first-cycle capacities were restored to 2.873 and 2.861 Ah. The curves obtained in the 0.2 C cycle after overdischarging to 2 and 1 V are shown in Figure 6c. Incremental capacity analysis (ICA) can reveal the battery capacity decay and electrode material changes [26,27]. The battery after a shallow overdischarge recovered its capacity with a current of 0.2 C. The ICA curve for the first cycle of capacity recovery is shown in Figure 6d. The ICA curves for the shallow overdischarged batteries coincided with those for the non-overdischarged batteries, and the peak values were identical. A single shallow overdischarge had no effect on the battery capacity or active material structure. This may be because the cutoff voltage did not reach the voltage plateau where the Cu current collector was dissolved. A shallow overdischarge may cause the battery to undergo charge–discharge cycles in a high-temperature environment exceeding 60 °C, and multiple cycles may degrade the battery capacity [28]. Moreover, under the coupled effects of overdischarge and a high temperature, more severe degradation occurs [29].
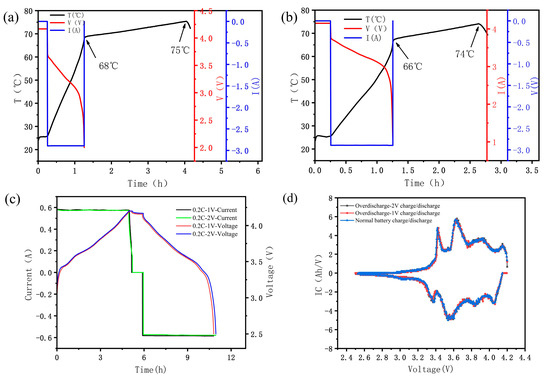
Figure 6.
Battery temperature, voltage, and current changes during 1 C overdischarge: (a) 1 C overdischarge to 2 V; (b) 1 C overdischarge to 1 V; (c) The curve of the 0.2 C cycle after overdischarging to 2 V and 1 V; (d) ICV curve of 0.2 C charge/discharge.
3.3. Structural Changes after Overdischarging
The NCM811 battery overdischarged to 0 V at 1 C was disassembled and is shown in Figure 7. Some of the negative-electrode active materials were attached to the separator, and the exposed Cu surface was smooth. This may be because the negative-electrode potential continued to increase during overdischarging, the negative-electrode Cu current collector oxidized and corroded at high potentials, and the generated Cu ions were deposited on the negative-electrode surface, destroying the binding force of the negative-electrode active material and the Cu foil. The positive- and negative-electrode crystal structures of this battery were compared with those of normal batteries. After overdischarging, the sample was examined using SEM, as shown in Figure 8. For the normal battery, the positive electrode had smaller ternary particles, and the negative-electrode graphite exhibited a layered structure. After overdischarging, the positive-electrode material exhibited small particles (Figure 8b), and the EDS image indicated the presence of Cu (Figure 8c). This phenomenon was also observed by Guo [18] and is attributed to the dissolution of the Cu current collector. The graphite negative-electrode layer structure collapsed and broke, and numerous Cu particles were deposited. The SEM image revealed that the separator contained cracks, confirming the previous conjecture that the separator was fused at a high temperature.
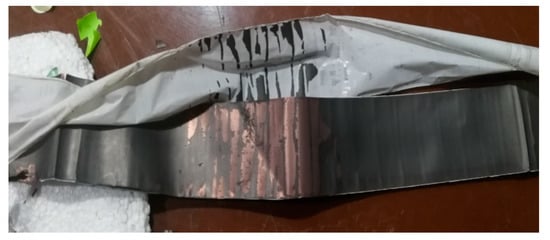
Figure 7.
NCM811 battery disassembled after 1 C overdischarge.
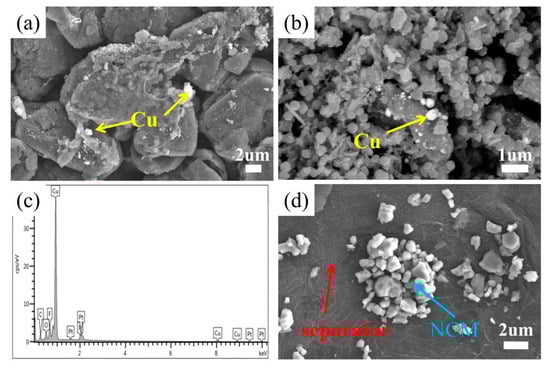
Figure 8.
SEM images of overdischarged batteries: (a) negative electrode overdischarged, (b) positive electrode overdischarged, (c) EDS test of the positive-electrode sample zone, and (d) separator.
4. Conclusions
The changes in the temperature, voltage, and current during the overdischarging of a high-energy-density NCM811 battery were investigated, and the following conclusions are drawn:
- In an adiabatic environment, as the overdischarge rate increased, the NCM811 battery was heated at an increasing rate. The temperatures Tu, TI, and Tm increased during the battery overdischarge. Additionally, the times, tu and ti, both increased. At rates of 0.2 C, 0.5 C, 1 C, and 2 C, Tm was 106, 114, 116, and 119 °C, respectively
- The amount of energy released during a short circuit increased with the overdischarge rate. The discharge capacity was 3.06–3.14 Ah. Notably, at rates of 0.2 C, 0.5 C, 1 C, and 2 C, the extensions of the significant voltage drops were 900, 360, 200, and 200 s, respectively, which were within the tolerable limits for avoiding faults caused by overdischarging. The energies released during the short circuits were 1986.6, 2270, 1911, and 1313.7 J, respectively. The energy released at 0.5 C was the highest, followed by that at 0.2 C. It was the lowest at 2 C.
- The overdischarge safety of the battery was reduced at high temperatures (55 °C). The energy released during the overdischarge phase and during a short circuit decreased significantly.
- Shallow overdischarging to 2 and 1 V had a negligible effect on the NCM811 battery capacity recovery. The maximum temperatures reached by the overdischarged batteries were 75 and 74 °C.
- After overdischarging, spherical Cu precipitates were observed on the positive-electrode material of the sample, the graphite negative-electrode structure was damaged, and the separator was fused.
- Although the capacities of the five groups of samples could not be recovered after overdischarging, the overdischarging did not cause fires, explosions, or TR of the batteries in any of the cases tested. The NCM811 battery good safety under overdischarging conditions.
Author Contributions
Methodology, L.Z.; formal analysis, G.D.; investigation, Y.F., X.L., Z.Z.; resources, L.J.; data curation, D.W.; writing—original draft preparation, D.W.; writing—review and editing, D.W.; project administration, L.Z.; funding acquisition, Z.D. All authors have read and agreed to the published version of the manuscript.
Funding
This research was funded by [Natural Science Foundation of Shandong Province] grant number [ZR201709240128] and [National Key Research and Development Program of China] grant number [No.2017YFB0102004].
Conflicts of Interest
The authors declare no conflicts of interest.
References
- Reddy, M.V.; Mauger, A.; Julien, C.M.; Paolella, A.; Zaghib, K. Brief History of Early Lithium-Battery Development. Materials 2020, 13, 1884. [Google Scholar] [CrossRef] [PubMed]
- Goodenough, J.B.; Kim, Y. Challenges for Rechargeable Li Batteries. Chem. Mater 2010, 22, 587–603. [Google Scholar] [CrossRef]
- Reddy, M.V.; Rao, G.V.S.; Chowdari, B.V.R. Metal Oxides and Oxysalts as Anode Materials for Li Ion Batteries. Chem. Rev. 2013, 113, 5364–5457. [Google Scholar] [CrossRef] [PubMed]
- Cheng, X.M.; Li, T.; Ruan, X.S.; Wang, Z. Thermal Runaway Characteristics of a Large Format Lithium-Ion Battery Module. Energies 2019, 12, 3099. [Google Scholar] [CrossRef]
- Wen, J.; Yu, Y.; Chen, C. A review on lithium-ion batteries safety issues: Existing problems and possible solutions. Mater Express 2012, 2, 197–212. [Google Scholar] [CrossRef]
- Shu, J.; Shui, M.; Xu, D.; Wang, D.; Ren, Y.; Gao, S. A comparative study of overdischarge behaviors of cathode materials for lithium-ion batteries. J. Solid. State Electr. 2012, 16, 819–824. [Google Scholar] [CrossRef]
- Qian, K.; Li, Y.; He, Y.B.; Liu, D.; Zheng, Y.; Luo, D.; Li, B.; Kang, F. Abuse tolerance behavior of layered oxide-based Li-ion battery during overcharge and overdischarge. RSC Adv. 2016, 6, 76897–76904. [Google Scholar] [CrossRef]
- Ouyang, D.X.; Weng, J.W.; Chen, M.Y. Impacts of Current Rates on the Degradation Behaviors of Lithium-Ion Batteries under overdischarge Conditions. J. Electrochem. Soc. 2019, 166, A3432–A3440. [Google Scholar] [CrossRef]
- Brand, M.; Gläser, S.; Geder, J.; Menacher, S.; Obpacher, S.; Jossen, A.; Quinger, D. Electrical safety of commercial Li-ion cells based on NMC and NCA technology compared to LFP technology. World Electr. Veh. J. 2013, 6, 572. [Google Scholar] [CrossRef]
- Liu, Y.; Liu, Q.; Li, Z.; Ren, Y.; Xie, J.; He, H.; Xu, F. Failure study of commercial LiFePO4 cells in overdischarge conditions using electrochemical impedance spectroscopy. J. Electrochem. Soc. 2014, 161, A620–A632. [Google Scholar] [CrossRef]
- Maleki, H.; Howard, J.N. Effects of overdischarge on performance and thermal stability of a Li-ion cell. J. Power Sources 2006, 160, 1395–1402. [Google Scholar] [CrossRef]
- Zheng, Y.; Qian, K.; Luo, D.; Li, Y.; Lu, Q.; Li, B.; He, Y.B.; Wang, X.; Li, J.; Kang, F. Influence of overdischarge on the lifetime and performance of LiFePO4/graphite batteries. RSC Adv. 2016, 6, 30474–30483. [Google Scholar] [CrossRef]
- Fear, C.; Juarez-Robles, D.; Jeevarajan, J.A.; Mukherjee, P.P. Elucidating Copper Dissolution Phenomenon in Li-Ion Cells under Overdischarge Extremes. J. Electrochem. Soc. 2018, 165, A1639–A1647. [Google Scholar] [CrossRef]
- Ouyang, D.; Chen, M.; Liu, J.; Wei, R.; Weng, J.; Wang, J. Investigation of a commerial lithium-ion battery under overcharge/overdischarge failure condition. RSC Adv. 2018, 8, 33414–33424. [Google Scholar] [CrossRef]
- Balakrishnan, P.G.; Ramesh, R.; Kumar, T. Safety mechanisms in lithium-ion batteries. J. Power Sources 2006, 155, 401–414. [Google Scholar] [CrossRef]
- Li, H.F.; Gao, J.K.; Zhang, S.L. Effect of overdischarge on swelling and recharge performance of lithium ion cells. Chin. J. Chem. 2008, 26, 1585–1588. [Google Scholar] [CrossRef]
- Tang, Z.Y.; Ruan, Y.L. Progress in capacity fade mechanism of lithium ion battery. Prog. Chem. 2005, 17, 1–7. [Google Scholar]
- Guo, R.; Lu, L.G.; Ouyang, M.G.; Feng, X.N. Mechanism of the entire overdischarge process and overdischarge induced internal short circuit in lithium-ion batteries. Sci. Rep. UK 2016, 6. [Google Scholar] [CrossRef] [PubMed]
- Lai, X.; Zheng, Y.J.; Zhou, L.; Gao, W.K. Electrical behavior of overdischarge induced internal short circuit in lithium-ion cells. Electrochim. Acta 2018, 278, 245–254. [Google Scholar] [CrossRef]
- He, H.; Liu, Y.; Liu, Q.; Li, Z.; Xu, F.; Dun, C.; Ren, Y.; Wang, M.X.; Xie, J. Failure Investigation of LiFeP04 Cells in overdischarge Conditions. J. Electrochem. Soc. 2013, 160, A793–A798. [Google Scholar] [CrossRef]
- Zhang, L.; Ma, Y.; Cheng, X.; Du, C.; Guan, T.; Cui, Y.; Sun, S.; Zuo, P.; Gao, Y.; Yin, G. Capacity fading mechanism during long-term cycling of overdischarged LiCoO 2 /mesocarbon microbeads battery. J. Power Sources 2015, 293, 1006–1015. [Google Scholar] [CrossRef]
- Chao, W.; Chunbo, Z.; Jinlei, S.; Jianhu, J. Fault mechanism study on Li-ion battery at overdischarge and its diagnosis approach. IET Electr. Syst. Transp. 2017, 7, 48–54. [Google Scholar] [CrossRef]
- Ye, J.N. Research on the Characteristics and Mechanism of Thermal Runaway (Failure) of Lithium Battery under Overcharge and Overdischarge Conditions. Ph.D. Thesis, University of Science and Technology of China, HeFei, China, 2017. [Google Scholar]
- Kasnatscheew, J.; Börner, M.; Streipert, B.; Meister, P.; Wagner, R.; Laskovic, I.C.; Winter, M. Lithium ion battery cells under abusive discharge conditions: Electrode potential development and interactions between positive and negative electrode. J. Power Sources 2017, 362, 278–282. [Google Scholar] [CrossRef]
- Laruelle, S.; Grugeon, S.; Poizot, P.; Dolle, M.; Dupont, L.; Tarascon, J. On the origin of the extra electrochemical capacity displayed by MO/Li cells at low potential. J. Electrochem. Soc. 2002, 149, A627–A634. [Google Scholar] [CrossRef]
- Dubarry, M.; Truchot, C.; Cugnet, M. Evaluation of commercial lithium-ion cells based on composite positive electrode for plug-in hybrid electric vehicle applications. Part I: Initial characterizations. J. Power Sources 2011, 196, 10328–10335. [Google Scholar] [CrossRef]
- Liu, J.L.; Duan, Q.L.; Ma, M.N. Aging mechanisms and thermal stability of aged commercial 18650 lithium ion battery induced by slight overcharging cycling. J. Power Sources 2020. [Google Scholar] [CrossRef]
- Wright, D.R.; Garcia, A.N.; Owen, J.R. Review on high temperature secondary Li-ion batteries. Energy Procedia 2018, 151, 174–181. [Google Scholar] [CrossRef]
- Ouyang, D.X.; Weng, J.W.; Chen, M.Y.; Liu, J.; Wang, J. Experimental analysis on the degradation behavior of overdischarged lithium-ion battery combined with the effect of high-temperature environment. Int. J. Energ. Res. 2020, 44, 229–241. [Google Scholar] [CrossRef]


© 2020 by the authors. Licensee MDPI, Basel, Switzerland. This article is an open access article distributed under the terms and conditions of the Creative Commons Attribution (CC BY) license (http://creativecommons.org/licenses/by/4.0/).