Abstract
A variable sedimentary environment and accumulation process leads to a complex pore structure in deep carbonate gas reservoirs, and the physical properties are quite different between layers. Moreover, some pores and throats are filled with solid bitumen (SB), which not only interferes with reservoir analysis, but also affects efficient development. However, previous studies on SB mainly focused on the accumulation process and reservoir analysis, and there are few reports about the influence on development. In this paper, through scanning electron microscope analysis, SB extraction, gas flow experiments and depletion experiments, and a similar transformation between experimental results and reservoir production, the production characteristics of carbonate gas reservoirs with different pore structures were studied, and the influence of SB on pore structure, reservoir analysis and development were systematically analyzed. The results show that permeability is one of the key factors affecting gas production rate and recovery, and the production is mainly contributed by high-permeability layers. Although the reserves are abundant, the gas production rate and recovery of layers with a low permeability are relatively low. The SB reduces the pore and throat radius, resulting in porosity and permeability being decreased by 4.73–6.28% and 36.02–3.70%, respectively. With the increase in original permeability, the permeability loss rate decreases. During development, the loss rate of gas production rate is much higher than that of permeability. Increasing the production pressure difference is conducive to reducing the influence. SB also reduces the recovery, which leads to the loss rate of gas production being much higher than that of porosity. For reservoirs with a high permeability, the loss rates of gas production rate and the amount produced are close to those of permeability and porosity. Therefore, in the reservoir analysis and development of carbonate gas reservoirs bearing SB, it is necessary and significant to analyze the influence of reservoir types.
1. Introduction
Based on geological statistics, carbonate reservoirs account for about 35.7% of global oil and gas resources, and deep and ultra-deep carbonate gas reservoirs (depth > 4500 m) have become one of the popular resources for exploration and development [1,2]. Abundant marine origin carbonate gas reservoirs have been found in Sichuan Basin, SW China [3,4]; the reserves of Sinian and Cambrian gas reservoirs exceed 1 × 10¹² m3, and have become one of the important gas producing areas [5,6,7,8]. The variable sedimentary environment and accumulation process lead to a complex pore structure of deep carbonate gas reservoirs, including pores, cavities and fractures, and the physical properties are quite different between layers [9,10,11,12]. Moreover, some pores and fractures in the Sinian and Cambrian reservoirs are filled with solid bitumen (SB) [13,14]. Although SB can provide information about geological changes [15,16,17,18], it creates greater challenges for reservoir analysis and development.
To study the influence of SB on a gas reservoir, the first step is to research the distribution characteristics in the pore structure. Wood et al. [19] found that the reservoir quality of the Triassic tight gas siltstone area in the Western Canadian Sedimentary Basin was strongly affected by SB through organic petrological observation and scanning electron microscopy (SEM). Furthermore, Shi et al. [20] used geochemical and trace element analysis methods to classify the SB of the Longwangmiao and Dengying gas reservoirs into two types: high-maturity and low-maturity SB. Taheri-Shakib et al. [21] studied the physicochemical properties of SB in the adsorbed and non-adsorbed components of sandstone, dolomite, and calcite rock powders by spectroscopy, elemental analysis, and SEM. Meanwhile, Gao et al. [22] and Mastalerz et al. [23] analyzed the characteristics of SB in dissolved pores, intergranular pores, and sutures with optical microscopy and SEM. A large number of studies have shown that it is feasible to analyze the pore structure and SB distribution characteristics by SEM andthin-section casting. However, there is no systematic understanding of the distribution characteristics of SB in the pore structure.
As one of the components in bitumen, asphaltene is the most polar component with an uncertain molecular weight or structure [24,25]. In the oil reservoir, the deposition mechanism of asphaltene and its damage to the reservoir have been widely recognized [26,27,28,29,30,31]. In addition, SB can produce certain nuclear magnetic resonance (NMR) signals, which are confused with oil and gas signals, resulting in logging interpretation errors [32,33]. The most direct way to research the influence is to compare the changes in porosity and permeability after the removal of SB. As is known, bitumen is a heavy component in crude oil, which is soluble in aromatic solvents such as benzene and toluene, SB can be removed from cores by extraction [32,34,35]. However, there are few studies on gas reservoirs, and the related studies were mainly concentrated in the Longwangmiao Formation in Moxi Area, SW China. Lai et al. [13] found that the porosity and permeability increased by 1.01% and 0.04 mD after SB extraction. Moreover, regarding the use of pores with a lateral relaxation time (T2 spectrum) longer than 3 ms as effective pores, they found that the SB content is between 0.1% and 3.0% by NMR logging and conventional logging. However, Ji et al. [36] found that the T2 spectrum of SB has a peak within 3 ms and a peak outside 3 ms, and the NMR porosity of SB was about 1.01%. It can be seen that there were some differences in the methods and results of NMR testing. Considering the strong heterogeneity and the difference in SB content between layers, it is more pertinent and significant to study the influence according to the pore structure characteristics of the reservoir.
Pore structure is one of the key factors that restrict the gas production rate and the amount produced; the dominant pore structures are quite different between layers. Gas flow experiments and numerical simulation analyses showed that there was a starting pressure gradient in low-permeability reservoirs, and fracture was the main gas flow channel [13,37,38]. Meng et al. [12] found that high permeability can improve productivity in a short period, which can also lead to a sharp decline. Yue et al. [39] found that gas production was closely related to porosity. Meanwhile, some scholars have studied the influence of heterogeneity on the gas production rate and amount produced [40,41]. Wang et al. [42] found that, in the early stage of development, production was mainly contributed to by high-permeability layers, and permeability also affected the recovery. The filling of SB leads to a decrease in porosity and permeability, which will affect the gas production rate and overall recovery. When only referring to the changes in porosity and permeability, it is difficult to fully reflect the damage to reservoirs. However, there is no report about the influence of SB on gas production rate, recovery and production. Researching the influence on development, so as to improve the accuracy of productivity analysis, especially for reservoirs without porosity and permeability corrections, is of great significance.
The purpose of this study is to research the productivity characteristics of carbonate gas reservoirs, and systematically analyze the distribution characteristics of SB in the pore structure, and to further understand its influence on the porosity, permeability and productivity of reservoirs with different pore structures. On the one hand, the Cambrian carbonate gas reservoirs in Sichuan Basin are rich in reserves, with obvious pore structures and SB distribution characteristics [3,5,9]. On the other hand, the porosity and permeability of the reservoirs in the Gaoshiti–Longnusi area are relatively low, and SB has great influence on reservoir identification and development [13,14]. Based on this, we take the Cambrian Longwangmiao carbonate gas reservoir in the Gaoshiti–Longnusi area as our target. Firstly, the pore structure and distribution characteristics of SB were analyzed and classified by SEM and thin-section casting, thereby providing a theoretical basis for analyzing the influence. Then, cores with different pore types were extracted to quantitatively analyze the influence on porosity and permeability, and organic elements such as carbon, hydrogen, oxygen and nitrogen were tested. Finally, the cores with a similar porosity and permeability were used for gas flow experiments and depletion experiments under reservoir conditions, to analyze the gas production characteristics of different types of reservoirs. Based on the core experimental results and the changes in porosity and permeability caused by SB, the influence of SB on gas production rate and amount produced was predicted and analyzed.
2. Geological Setting
The Cambrian Longwangmiao formation carbonate gas reservoir in Sichuan Basin is one of the largest integrated reservoirs in China (Figure 1). In the early stage, marine transgression occurred rapidly, forming a gently sloped sedimentary environment dominated by carbonate deposition. The Moxi, Longnusi, and Gaoshiti areas, located in the high part of the structure, are rich in gas (Figure 1 and Figure 2) [43]. Based on both paleogeomorphology and provenance, the paleouplift in the Moxi area was found to be the highest in the sedimentary strata. The paleouplift around the Moxi area gradually decreased. The Gaoshiti–Longnusi area is located on the edge of the Moxi area (Figure 1), and the reservoir heterogeneity is high [44]. In the longitudinal direction, the Cambrian is between Sinian and Ordovician, and the Longwangmiao Formation is located in the upper part of the Lower Cambrian. The buried depth of the Longwangmiao Formation in the Gaoshiti–Longnusi area exceeds 4500 m, reaching a deep gas reservoir.
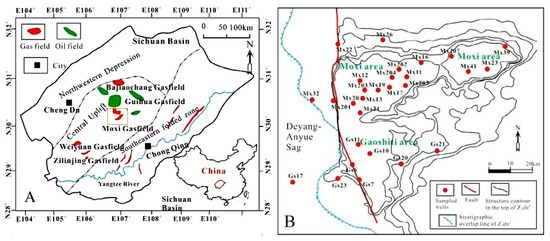
Figure 1.
Location of the Gaoshiti–Longnusi area: (A) Sichuan Basin; (B) Longwangmiao carbonate gas reservoir [17,45].
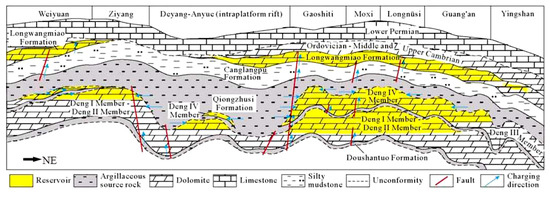
Figure 2.
Schematic representation of the distribution of carbonate gas reservoirs in central Sichuan Basin [45].
The reservoir rocks mainly comprise grain dolomite and calcite, and some pores are filled with SB [46]. According to the logging data, including Moxi-23, Moxi-207, Gaoshi-7 and Gaoshi-10 and other wells, the porosity is mostly between 2% and 8%, with an average between 2.6% and 5.4%. The permeability is between 0.036 mD and 1.36 mD, and some layers reach 8.70 mD. Therefore, the differences in porosity and permeability between layers are great. After the initial calibration of SB by conventional logging and NMR logging, the porosity and permeability decreased by 0.1–1.5% and 0.01–0.20 mD, respectively. As the water saturation of most reservoirs is below 36%, the proportion of water-producing wells is relatively low. The gas production rate of some reservoirs is more than 20 × 104 m3/day, while that of reservoirs with a low permeability is lower than 1.0 × 10⁴ m3/day, which is quite different between reservoirs. At present, the pore pressure, overburden pressure and temperature of reservoirs are approximately 70–80 MPa, 126 MPa and 120–140 °C, respectively.
3. Samples and Experimental Methods
3.1. Samples Preparation
The depths of 109 cores acquired from the Longwangmiao carbonate gas reservoir in the Gaoshiti–Longnusi area were between 4547 m and 4967 m. From core surfaces, the development of cavities and fractures were quite different. According to Chinese National Standard GB/T 29172-2012, the helium porosity and permeability were measured by an OPP-1 (Temco, Tulsa, OK, USA) high-pressure porosimeter under standard conditions (Figure 3). The porosity and permeability of each sample were measured three times, and the errors of porosity and permeability were within 0.05% and 0.02 mD, respectively. Except for some cores with a low permeability (<0.01 mD), the porosity and permeability of cores were well matched with the logging data, which can truly reflect the reservoir characteristics. Considering the porosity, permeability and surface characteristics, these cores can be divided into four types, as pore (32 samples), cavity (26 samples), fracture-pore (27 samples) and fracture-cavity (24 samples) type cores, which can reflect the dominant pore structure of four types of reservoirs. According to the permeability, a reservoir with a permeability below 0.1 mD is called a low-permeability reservoir in this study, while a reservoir with a permeability above 1.0 mD is called a high-permeability reservoir, and the permeability of medium permeability reservoirs is between 0.1 and 1.0 mD.
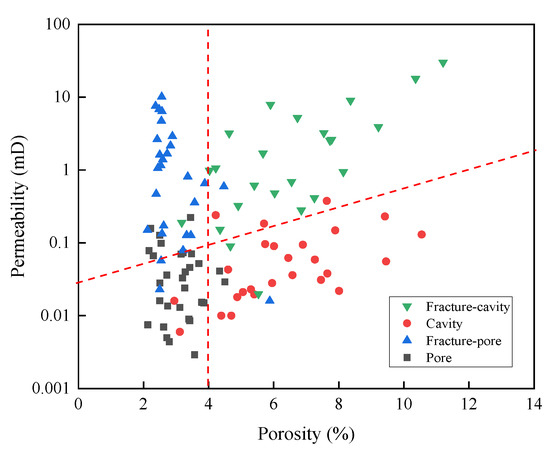
Figure 3.
Relationship between the sample porosities and permeabilities.
3.2. SEM Testing
The electronic signals of the SEM analysis include secondary electrons, backscattered electrons, and Auger electrons [47]. Compared with secondary electronic signals, backscattered electronic signals can observe mineral properties more clearly; hence, they were selected to analyze the SB distribution characteristics. According to the Chinese National Standard GB/T 17361-2013, the samples were scanned by Helios NanoLab 650 double-beam SEM (Pixel size 0.8~800 nm), and the surface morphology and composition were qualitatively analyzed. The pixel size of the SEM analysis was 0.8–800 nm, the sample diameter was less than 25 mm, the thickness was 1–5 mm, and the surface was coated with 10–20 nm carbon conductive film. In order to improve the analysis results, thin-section casting was used for the auxiliary analysis. A Leica polarizing microscope was used to scan the thin-section cast samples to obtain their pore structure characteristics, and the diameters of the samples were less than 25 mm, with thicknesses of less than 5 mm. These tests were carried out under laboratory standard conditions.
3.3. SB Extraction
Based on the Chinese National Standard GB/T 29172-2012, the method of Dean–Stark was used to extract SB. Chloroform, toluene, ethanol and other solvents with different proportions were used as extraction solvents. Four cores of each type, 16 cores in total, were selected as Series 1 (Table 1). In Series 1, the average porosity of pore, cavity, fracture-pore and fracture-cavity types of cores was 3.17%, 5.51%, 3.19% and 6.12%, while the average permeability was 0.038 mD, 0.055 mD, 0.662 mD and 1.157 mD, respectively. All cores were dried in a constant-temperature drying oven (China, normal temperature ~300 °C) at 116 °C for 6 h, and the porosity and permeability were then measured. Then we, put the cores into the extraction sample chamber, and connected the condensing tube, long neck bottle and other devices. At the bottom of the long neck bottle, we set the constant temperature to heat the solvent to boiling, and the upper part for circulating cooled air. After 15–20 days of distillation, we took out and dried these cores, and their porosity and permeability were measured again. After extraction, Series 1 was named Series 3.

Table 1.
Core parameters of Series 1 and 2.
3.4. Core Experiments
3.4.1. Gas Flow Experiments
Experiments are one of the most direct and accurate methods to study the influence of pore structure on gas flow and production. Because of the different scales between cores and reservoirs, a similarity transformation is the key step in experiment design and analysis. According to the similarity of the pressure gradient and gas velocity, the transformation between experimental pressure difference and production pressure difference (Equation (1)), gas velocity and production rate (Equation (2)) can be realized, respectively [48]. Based on logging data, including a pore pressure of 75 MPa, a well control radius of 800 m, a reservoir thickness of 40 m, a wellbore radius of 0.06 m, a core diameter of 25 mm and a length of 45 mm, a similar transformation relationship between core experiments and reservoir production is shown in Figure 4. Therefore, the gas production rate of vertical wells can be deduced by testing the gas velocity under different pressure differences by changing the porosity, permeability and pore structure of cores to analyze the gas production characteristics of different reservoirs.
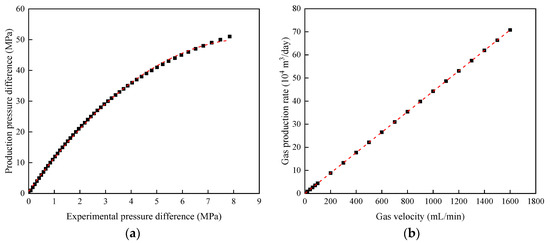
Figure 4.
Similarity transformation results: (a) experimental pressure difference vs. production pressure difference; (b) gas velocity vs. gas production rate.
The experiments were completed in a high-precision, high-temperature and high-pressure system (Figure 5), including an injection system (TC-260, China, 0–180 MPa, ±0.3%), temperature control system (TC-260, China, normal temperature~200 °C, ±5 °C), pressure acquisition system (Senex, China, >0.01 MPa, ±0.25%) and flow acquisition system (Qixing, China, >0.01 mL/min, ±0.25%). While ensuring the accuracy of the system, the thickened sleeves and high-performance sealing rings had improved the stability and safety. The specific experimental steps were as follows. First, vacuum the cores for 12 h and saturate the formation water. Then, connect the experimental devices, increase the pore pressure by water injection, and simultaneously increase the temperature and overburden pressure to the reservoir conditions, then stabilize it for 4 h. After that, reduce the outlet pressure and establish irreducible water saturation by gas flooding, then raise the outlet pressure to 75 MPa. When the pore pressure is balanced, reduce the outlet pressure with a pressure difference of 0.1–1.0 MPa, record the stable gas velocity under different pressure differences, and encrypt the records at the beginning. Finally, finish the experiment when the pressure difference reaches about 8 MPa.
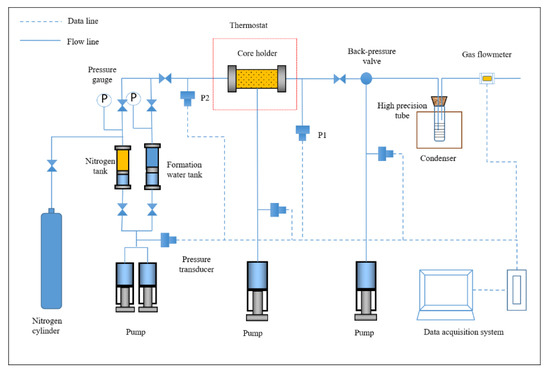
Figure 5.
The high-temperature and high-pressure experimental system schematic diagram.
Based on permeability and porosity, 16 cores, named Series 2, were used for gas flow and depletion experiments (Table 1). In Series 2, the average porosity of four types of cores was 3.18%, 5.82%, 2.94% and 6.53%, and the average permeability was 0.040 mD, 0.053 mD, 0.656 mD and 1.164 mD, respectively. The average porosity of Series 1 and 2 was 4.62% and 4.50%, respectively, and the average permeability was 0.478 mD for both. Moreover, the cores were matched one by one between Series 1 and 2, and it can be considered that Series 1 and 2 were the same. According to the experimental results of Series 2 and the change in porosity and permeability of Series 1, it is relatively accurate to study the influence of SB on gas production rate, recovery and production. On one hand, the porosity and permeability of the two series were very close; on the other hand, the influence of the pore cementation strength changes caused by extraction on core experiments was avoided.
3.4.2. Depletion Development Experiments
Gas flow experiments focus on the gas production rate and dynamic analysis, while depletion experiments are more suitable to analyze gas recovery and production, so as to analyze the quasi-static production characteristics. After the flow experiments, the depletion experiments were carried out as follows. First, increase the outlet pressure and stabilize the pore pressure at 75 MPa for 4 h. Second, close the inlet valve, reduce the outlet pressure by 1.0 MPa every 5–10 min, and record the upstream pressure (P2), downstream pressure (P1) and gas production in each stage. Finally, stop the experiments when the pore pressure is depleted to 45 MPa. In order to improve the accuracy of the experiment, the dead volume is controlled so that it remains 4 times that of the pore volume. In data processing, when fully considering temperature, pressure, the gas compression coefficient and dead volume, we did not include dead volume in the calculation of original reserves, production and recovery.
4. Results and Discussion
4.1. Pore Structure and SB Distribution Characteristics
There are no obvious fractures on the surface of the pore type cores; the pores are very dense and unevenly distributed (Figure 6a). The pores on the surface of the cavity type cores are more developed, mainly with a diameter of 2–5 mm, and the connectivity between the cavities is weak (Figure 6b). Fractures can be observed on the surface of fracture-pore and fracture-cavity type cores, and the development of fractures is quite different; the latter contains some cavities, which leads to a higher porosity (Figure 6c,d). The development and distribution characteristics of cavities and fractures lead to a weak correlation between porosity and permeability [14]. Fracture-pore type reservoirs show the characteristics of “low-porosity and high-permeability”, while pore-type reservoirs show “high-porosity and low-permeability” characteristics.
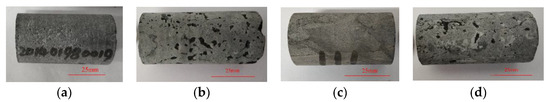
Figure 6.
Cores with different pore structures: (a) pore type, Gaoshi-7 well, 4834.41 m; (b) cavity type, Moxi-56 well, 4965.83 m; (c) fracture-pore type, Moxi-107 well, 4828.86 m; (d) fracture-cavity type, Moxi-56 well, 4964.46 m.
As shown in Figure 7, the pore structure is mainly intercrystalline pores, intercrystalline solution pores and fractures [13], and the pore radius is quite different. Intercrystalline solution pores are the main reservoir space; and the connectivity between the pores is weak, so the permeability is relatively low (Figure 7b,e). The diagenetic minerals are quartz and dolomite with a content of 98%; and the clay minerals are illite and kaolinite (Figure 7a,c). There is secondary biomass in pores, and some pores are completely filled with SB (Figure 7d–f). SB has two surface properties caused by different maturities; one is carbon–SB (CSB), with a high maturity, the other is oil–SB (OSB), with a low maturity (Figure 7f), which indicates that SB in reservoirs is formed in different geological periods [20]. Due to the large molecular size, SB entered or remained in larger pores more easily, so the SB content in the cavities and fractures is relatively high.
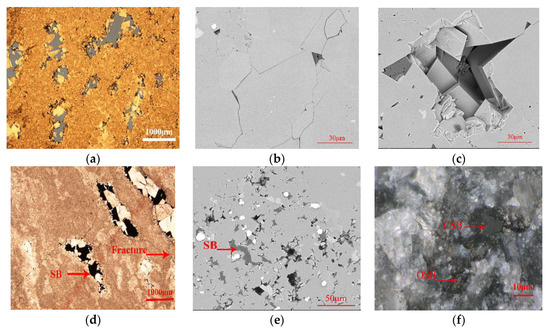
Figure 7.
Pore structure characteristics of carbonate gas reservoirs: (a) Moxi-23 well, 4805.71 m, cavity development; (b) Gaoshi-7 well, 4834.90 m, fractures; (c) Gaoshi-7 well, 4834.90 m, pore; (d) Moxi-23 well, 4802.60 m, SB-filled cavities; (e) Gaoshi-7 well, 4834.90 m, SB-filled pores; (f) Moxi-41 well, 4805.67 m, carbon–SB and oil–SB.
Based on more than 100 SEM images, the distribution characteristics of SB can be summarized into four forms. The first are SB-filled fractures (Figure 8a). The shape of the SB varies with the shape of the fractures. The second are pores completely filled with SB, with circular, square, and irregular shape distributions (Figure 8b). The third are SB distributions along the inner pore walls, without completely filling the pores and with an uneven thickness (Figure 8c). The fourth is SB covering the outer surface of debris in the pores (Figure 8d). Furthermore, SB reduced the pore and throat radius, which easily caused a blockage in the gas flow channels and reduced well production. Combined with the complex pore structure characteristics, different distribution forms will weaken the correlation between porosity and permeability.
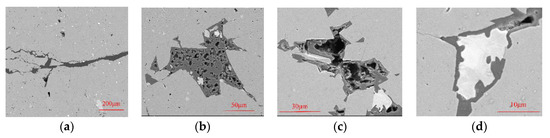
Figure 8.
Microscopic distribution characteristics of solid bitumen (SB): (a) Gaoshi-7 well, 4834.90 m, SB-filled fracture; (b) Moxi-56 well, 4954.54 m, SB-filled pore; (c) Moxi-56 well, 4959.91 m, SB-filled edge; (d) Moxi-56 well, 4959.91 m, SB-filled surface.
4.2. Influence of SB on Porosity and Permeability
The contents of carbon, hydrogen, oxygen and nitrogen are 80.11%, 2.75%, 1.77% and 1.00%, respectively. The hydrogen to carbon ratio is 0.41 and the oxygen to carbon ratio is 0.02, indicating that the SB maturity is relatively high. After extraction, the porosity of Series 3 increased by 0.10% to 0.44%, with an average of 0.26%; the porosity increase rate was between 2.48% and 14.62%, with an average of 5.67% (Figure 9a). In the pore, cavity, fracture-pore and fracture-cavity types of cores, the average porosity increased by 0.15%, 0.29%, 0.20% and 0.38%, with increase rates of 4.78%, 5.17%, 6.27% and 6.28% (Table 2), respectively. These results were close to the logging interpretation, and the SB content in the edge of the Moxi area is slightly lower [12]. Consistent with the SEM test, the cavities were more easily filled with SB, and the SB content in pore type reservoirs was relatively low. Affected by fractures and cavities, the correlation between SB content and original porosity is not strong enough, but the porosity loss caused by SB is very obvious. If the SB is ignored, the geological reserves will be overestimated.
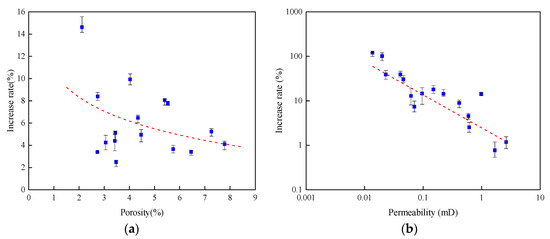
Figure 9.
Influence of SB on reservoir parameters: (a) porosity; (b) permeability.
Table 2.
Influence of SB on porosity and permeability.
After extraction, the permeability of Series 3 increased by 0.005–0.139 mD, with an average of 0.027 mD; the increase rate was between 0.77% and 120.59%, with an average of 6.33% (Figure 9b). The average increment of four types of cores was 0.011 mD, 0.015 mD, 0.025 mD and 0.056 mD, with an increase rate of 29.07%, 26.60%, 3.74% and 4.81%, respectively (Table 2). If we ignore the influence of FP34 and FC34 cores, the average increase rate is higher than 11.50%, and that of fracture-pore and fracture-cavity types of cores is 8.89% and 9.54%. Although the increments of layers without fractures were less than 0.020 mD, the increase rate was mostly higher than 30%. For layers with a permeability between 0.1 mD and 1.0 mD, the permeability increase rate was 18.00–4.55%. With the increase in original permeability, the influence of SB decreased. Considering that the reservoir permeability is mostly below 1.36 mD, the permeability loss rate is relatively high.
Because of the strong heterogeneity between layers in Longwangmiao gas reservoir [11], analyzing the influence based on pore structures is of great significance, as this will effectively reduce the errors between layers. For pore and cavity type reservoirs, the permeability loss rate is relatively high, while the porosity loss rate is about 5%. Compared to pore and cavity types, the permeability loss rate of fracture-pore and fracture-cavity type reservoirs decreased obviously, but the porosity loss rate increased slightly. Therefore, it is better to pay attention to the changes in permeability for reservoirs with a low permeability, especially for cavity type reservoirs, while, for reservoirs with fractures, it is necessary to analyze the influence on porosity.
4.3. Gas Production Characteristics of Different Types of Reservoirs
4.3.1. Gas Production Rate
The average irreducible water saturation of Series 1 was 25.69%, and that of four types of cores was 17.25%, 19.70%, 30.83% and 35.00%, respectively, which was close to the reservoir water saturation. The irreducible water saturation of cavity and fracture-cavity type reservoirs was relatively highly affected by the residual water masses in the cavities [49]. In cores without fractures, the connected pores and throats are the main gas flow channels. Moreover, the starting pressure of gas flow was about 0.40–2.40 MPa, and the corresponding pressure gradient was about 8.89–53.30 MPa/m (Figure 10a). And the starting pressure gradient was negatively correlated with permeability. With the increase in pressure difference, the influence of capillary resistance decreased, and the gas flow tended to be linear. In cores with fractures, these fractures easily became high-permeability channels, which reduced the efficiency of gas flooding, increased the reservoir heterogeneity, and resulted in relatively high irreducible water saturation [50]. Due to the strong connectivity between pores, there was no obvious starting pressure gradient, and the gas velocity was greatly increased (Figure 10a,b). Therefore, the permeability and pressure differences are the key factors affecting gas flow. The gas flow in cores without fractures is more susceptible to the pore and throat radius, this is consistent with the significant increase in permeability after SB extraction.
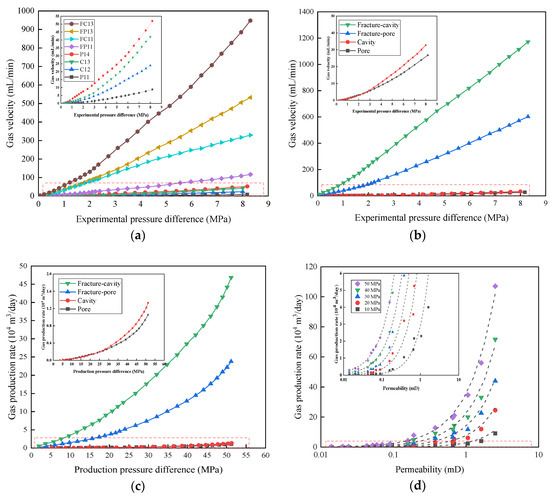
Figure 10.
Gas flow and production rate characteristics of different types of reservoirs: (a) gas velocity; (b) average velocity; (c) average production rate; (d) production rate under different pressure differences.
According to the results of the production capacity conversion, under a production pressure difference of 20 MPa, the maximum gas production rate of low-permeability reservoirs was 0.32 × 10⁴ m3/day, while that of medium permeability reservoirs was 0.82–6.13 × 10⁴ m3/day (Figure 10d). Meanwhile, porosity has a positive influence on production rate. The gas production rate of high-porosity reservoirs increased slightly, such as cores C11, FC11 and FC12, and that of low-porosity reservoirs decreased significantly, such as cores P12 and FC13. In gas reservoir development, when the gas production rate reaches the lower limit, it provides economic benefits. Generally, the lower limit of a deep carbonate gas reservoir is 1.0–5.0 × 10⁴ m3/day. Increasing the production pressure difference or permeability will make more layers provide economic benefits.
Theoretically, there is a linear correlation between permeability and gas velocity or production rate. However, under irreducible water saturation, according to gas–water two-phase relative permeability characteristics, the relative gas permeability of a high-permeability reservoir with fractures is relatively high, while that of low-permeability reservoirs is relatively low [49]. Meanwhile, affected by the starting pressure gradient, the relationship between gas production rate and permeability is not linear, but is closer to the power function. In multi-layer co-production modes, the gas production is mainly contributed by high-permeability layers (Figure 10c,d) [51]. Although the low-permeability reservoirs, especially cavity type reservoirs, are rich in reserves, increasing the production pressure difference cannot effectively improve the gas production rate. On the contrary, it will aggravate the interference between layers. Therefore, only by increasing the permeability can the gas production rate of reservoirs with a low permeability be improved and the influence of interlayer heterogeneity be reduced.
4.3.2. Gas Recovery and Production
Gas recovery and production are the key indicators for evaluating development. As shown in Figure 11, due to the low permeability, the depletion rate of pore and cavity type reservoirs was slow. Moreover, affected by the capillary resistance, the pressure difference between upstream (P2) and downstream (P1) was above 1.5 MPa Affected by the starting pressure, it is difficult to utilize part of the reserves in the far well area, which are called the unrecoverable reserves. In particular, at a pore pressure above 65 MPa, the pressure difference between P2 and P1 increased rapidly, which indicated that it is useful to improve the pressure difference to increase the depletion rate. However, it is difficult to reduce the unrecoverable reserves.
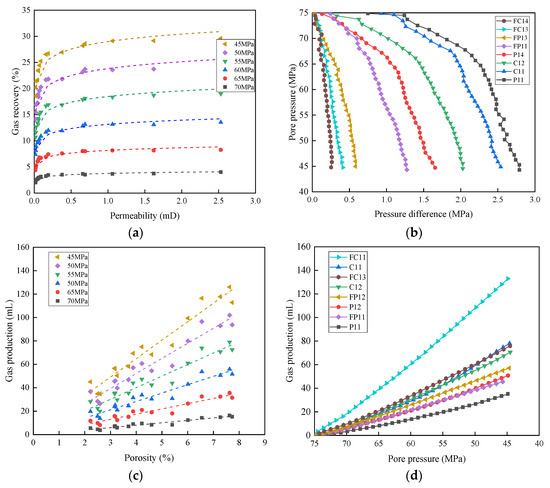
Figure 11.
Gas recovery and production characteristics of different types of reservoirs: (a) gas recovery; (b) pressure difference between upstream and downstream; (c) gas production and (d) production under different pressure differences.
When the permeability increased, the gas velocity and depletion rate accelerated, and the upstream reserves were effectively utilized. The pressure difference between P2 and P1 was obviously reduced, the gas reserves were nearly completely depleted (Figure 11a,b). Therefore, with the increase in permeability, the recovery gradually increased and then tended to be stable [39]. When the outlet pressure was 45 MPa, the average recovery of pore, cavity, fracture-pore and fracture-cavity type reservoirs was 21.99%, 22.61%, 27.65% and 28.57%, respectively (Figure 11a). Because the permeability was relatively close, the recovery of cavity type reservoirs with higher reserves was lower than that of pore type reservoirs. Considering the influence of the gas production rate, if the depletion cycle is shortened, more reservoirs will be difficult to completely deplete, and the recovery difference between layers will be significantly increased.
The comprehensive influence of recovery and original reserves determines the gas production (Figure 11a,c). Theoretically, the gas production is directly related to the original reserves [39]. For reservoirs with similar porosity, permeability has a positive effect on production. For example, the porosity of core P1 and FP1 was 2.59% and 2.22%, and the production of core P1 was less than that of core FP1, due to the low recovery. Similarly, the production of core C2 was less than that of core FC3 (Figure 11d). This indicated that low permeability limited the effective development. For reservoirs with similar permeability, the stable production time of reservoirs with a high porosity is longer. For fracture-pore type reservoirs, the geological reserves are low, while the gas production rate and pore pressure drop are high. This easily leads to insufficient gas supply and interlayer interferences.
It is proven that fractures and permeability are the key factor affecting the gas production rate and recovery, while production is mainly affected by porosity [39]. The gas production rate and produced amount of fracture-cavity type reservoirs are relatively high because of well-matched fractures and cavities. For fracture-pore type reservoirs, the production pressure should be controlled to avoid insufficient gas supply and interlayer interference with low-permeability layers. For reservoirs with a low permeability, especially cavity type reservoirs, the permeability should be improved to increase the production rate and recovery.
4.4. Influence of SB on Gas Reservoir Development
4.4.1. Influence of SB on Gas Production Rate
According to the core experimental results of Series 2, the power function fitting of permeability and the gas production rate under different pressure differences was carried out. Based on the average permeability of four types of cores in Series 1 and 3, the gas production rate was obtained to analyze the influence of SB on gas production rate. As shown in Figure 12, after extracting the SB, the gas production rate of Series 3 was obviously increased. Within a production pressure difference of 10–50 MPa, the gas production rate of pore and cavity type reservoirs increased by 0.29 × 10⁴ m3/day and 0.39 × 10⁴ m3/day, and the increase rates were 45.68–33.92% and 41.58–30.99%, respectively (Figure 12a). The gas production rate of fracture-pore and fracture-cavity type reservoirs increased by 0.09–0.93 × 10⁴ m3/day, 0.26–2.30 × 10⁴ m3/day, with an increase rate of 5.50–4.25%, 7.17–5.52% (Figure 12b). Considering that the production pressure difference in a gas reservoir is generally below 20MPa, the loss rate of gas production caused by sb is 11–2% higher than that of permeability. With the increase in production pressure difference or permeability, the loss rate gradually decreased and approached that of permeability.
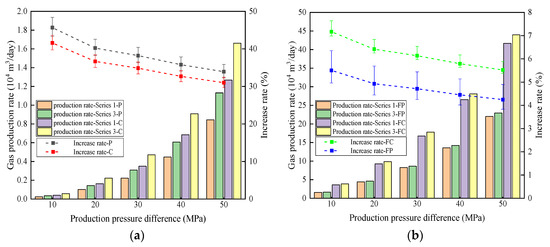
Figure 12.
Influence of SB on gas production rate: (a) reservoirs without fractures; (b) reservoirs with fractures.
Under reservoir conditions, gas flow is affected by pore structure and water saturation. The connected pores and throats are the main gas flow channels in pore and cavity type reservoirs. After being filled with SB, the capillary resistance increases, and the loss rate of gas production is significantly higher than that of permeability. For reservoirs with fractures, fractures are the main flow channels, the capillary resistance has little effect on gas flow, and the loss rate of gas production is slightly higher than that of permeability [38]. In addition, the increase in porosity has a positive effect on gas production; the synergistic effect of capillary resistance and porosity results in a higher gas production loss rate than that of permeability. Affected by the complex pore structure and SB, the overall gas production rate of the Longwangmiao carbonate gas reservoir in the Gaoshiti–Longnusi area is relatively low.
4.4.2. Influence of SB on Gas Recovery and Production
According to the logarithm function relationship between permeability and recovery, the recoveries of Series 1 and 3 were fitted, and the gas production was deduced based on the change in porosity. For the pore and cavity type reservoirs with low depletion rates and high flow resistance, the permeability increased significantly after SB extraction, and the recovery increased by 0.01–0.52% and 0.01–0.48%, respectively, with an increase rate of 3.26–2.35% and 2.88–2.10% (Figure 13a,b). The increase rate of gas production was 8.19–7.23% and 8.20–7.38%, which was much higher than the porosity increase rate of 4.78% and 5.17%. Moreover, the recovery increase rate of fracture-pore and fracture-cavity type reservoirs was only 0.34–0.26% and 0.42–0.33%, respectively. The gas production increase rate was 6.60% and 6.70%, which was very close to the porosity increase rate of 6.27% and 6.28% (Figure 13a,b). On the whole, the increase rate of recovery and the gas production rate were 0.49% and 6.20%, respectively. With the decrease in pore pressure, the loss rate of gas production is close to that of porosity. If the depletion cycle is shortened, the influence of permeability will be more obvious, and the loss rate of gas production will be higher.
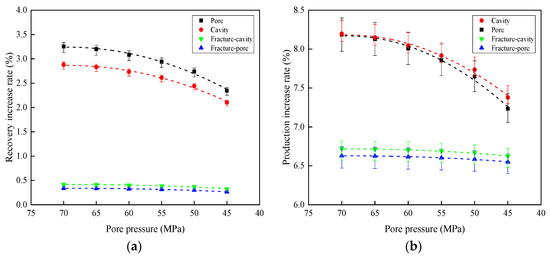
Figure 13.
Influence of SB on reservoir development: (a) gas recovery; (b) gas production.
The results show that the loss rate of gas production is significantly higher than that of porosity. When the pores and throats are filled with SB, the capillary resistance and starting pressure increase, resulting in an increase in unrecoverable reserves in the far well area [52]. Therefore, the SB not only reduces the geological reserves, but also increases the unrecoverable reserves. It is not accurate to analyze the influence on gas production by porosity changes, especially for reservoirs with a low permeability. In addition, the influence on production decreases with the increase in permeability. Therefore, for reservoirs with a high permeability, the loss rate of gas production is close to that of porosity. For reservoirs with similar permeability, the recovery and gas production increase rates of reservoirs with a high porosity are relatively higher.
Our experiments showed that SB was harmful to the effective development of deep carbonate gas reservoirs, especially for reservoirs with a low permeability. The filling of SB not only reduces permeability and porosity, but also reduces the gas production rate, recovery and production. For low-permeability reservoirs, the permeability loss rate is relatively high, which leads to a significant reduction in gas production rate and recovery, so the gas production loss rate is higher than the porosity loss rate. With the increase in permeability, the influence of SB decreases. For reservoirs with a high permeability, the loss rate of permeability and the gas production rate are relatively low, and the loss rate of gas production is very close to that of porosity. Therefore, for different types of reservoirs, the damage caused by SB is quite different. In reservoir analysis and production prediction, it is necessary and significant to correct and analyze the influence of SB based on reservoir types.
5. Conclusions
Through SEM analysis, SB extraction and core experiments under reservoir conditions, the development characteristics of different types of reservoirs were analyzed, and the influences of SB on pore structure, reservoir porosity and permeability, gas production rate and gas production were also systematically analyzed. Permeability is one of the key factors affecting gas production rate and recovery. The production of deep carbonate gas reservoirs is mainly contributed by reservoirs with a high permeability. Improving permeability is one of the best ways to increase the gas production rate and recovery of low-permeability reservoirs. In the pore structure, there are four forms of SB distribution. The filling of SB reduces the pore throat radius, which reduces the porosity and permeability, while the loss rates of gas production rate, recovery and the amount produced are relatively higher, especially for cavity type reservoirs. With the increase in original permeability, the influence of SB decreases gradually. In reservoir identification and production analysis of carbonate gas reservoirs bearing SB, it is necessary and significant to analyze and correct its influence based on reservoirs characteristics.
Author Contributions
This article is completed with the efforts of all authors. J.C. was responsible for relevant experiments, data processing and paper writing; S.Y. guided the research methods and ideas; D.Y. and H.D. provided cores and production data; J.L. and Y.H. assisted in experiments, and modified the language; C.Z. supplemented relevant experiments. All authors have read and agreed to the published version of the manuscript.
Funding
This research received no external funding.
Acknowledgments
This study was funded by the National Science and Technology Major Projects of China (grant number 2016ZX05015-003), Science and Technology Major Projects of PetroChina (grant number 2016E-06) and the National Natural Science Foundation (grant number 51774300). The authors are grateful for the support and help from the State Key Laboratory of Petroleum Resources and Prospecting of China University of Petroleum (Beijing) and the Exploration and Development Research Institute of the Southwest Oil and Gas Field Company.
Conflicts of Interest
The work described was original research that has not been published previously. And there were no conflicts of interest about this article, which was approved by all authors for publication.
Nomenclature
| L | Core length, m |
| h | Reservoir thickness, m |
| d | Core diameter, m |
| Q | Vertical well production, ×104 m3/day |
| Qr | Gas flow velocity, mL/s |
| pe | Original reservoir pressure, MPa |
| pw1 | Bottom hole flow pressure, MPa |
| pw2 | Outlet pressure of experiments, MPa |
| re | Well control radius, m |
| rw | Wellbore radius, m |
References
- Bera, B.; Gunda, N.S.K.; Mitra, S.K.; Vick, D. Characterization of nanometer-scale porosity in reservoir carbonate rock by focused ion beam–scanning electron microscopy. Microsc. Microanal. 2012, 18, 171–178. [Google Scholar] [CrossRef]
- Jin, X.J.; Dou, Q.F.; Hou, J.G.; Huang, Q.F.; Sun, Y.F.; Jiang, Y.W.; Li, T.; Sun, P.K.; Sullivan, C.; Adersokan, H.; et al. Rock-physics-model-based pore type characterization and its implication for porosity and permeability qualification in a deeply-buried carbonate reservoir, Changxing formation, Lower Permian, Sichuan Bain, China. J. Pet. Sci. Eng. 2017, 153, 223–233. [Google Scholar] [CrossRef]
- Wei, X.S.; Chen, H.D.; Zhang, D.F.; Dai, R.; Guo, Y.R.; Chen, J.P.; Ren, J.F.; Liu, N.; Luo, S.S.; Zhao, J.X. Gas exploration potential of tight carbonate reservoirs: A case study of Ordovician Majiagou Formation in the eastern Yi-Shan slope, Ordos Basin, NW China. Pet. Explor. Dev. 2017, 44, 347–357. [Google Scholar] [CrossRef]
- Liu, W.; Qiu, N.S.; Xu, Q.C.; Liu, Y.F.; Shen, A.J.; Zhang, G.W. The evolution of pore-fluid pressure and its causes in the Sinian-Cambrian deep carbonate gas reservoirs in central Sichuan Basin, southwestern China. J. Pet. Sci. Eng. 2018, 169, 96–109. [Google Scholar] [CrossRef]
- Ma, Y.S.; Cai, X.Y.; Zhao, P.R. Distribution and further exploration of the largemedium sized gas fields in Sichuan Basin. Acta Pet. Sin. 2012, 31, 347–354. [Google Scholar]
- Zou, C.N.; Du, J.H.; Xu, C.C.; Wang, Z.C.; Zhang, B.M.; Wei, G.Q.; Wang, T.S.; Yao, G.S.; Deng, S.H.; Liu, J.J.; et al. Formation, distribution, resource potential, and discovery of Sinian–Cambrian giant gas field, Sichuan Basin, SW China. Pet. Explor. Dev. 2014, 41, 306–325. [Google Scholar] [CrossRef]
- Wei, G.Q.; Yang, W.; Du, J.H. Tectonic features of GST-MX paleo-uplift and its controls on the formation of a giant gas field, Sichuan Basin, SW China. Pet. Explor. Dev. 2015, 42, 283–292. [Google Scholar] [CrossRef]
- Wang, Z.X.; Wang, Y.L.; Wu, B.X.; Wang, G.; Sun, Z.P.; Xu, L.; Zhu, S.Z.; Sun, L.N.; Wei, Z.F. Hydrocarbon gas generation from pyrolysis of extracts and residues of low maturity solid bitumens from the Sichuan Basin, China. Org. Geochem. 2017, 103, 51–62. [Google Scholar] [CrossRef]
- Abbaszadeh, M.; Koide, N.; Murahashi, Y. Integrated characterization and flow modeling of a heterogeneous carbonate reservoir in Daleel Field, Oman. SPE Reserv. Eval. Eng. 2000, 3, 150–159. [Google Scholar] [CrossRef]
- He, J.H.; Ding, W.L.; Li, A.; Sun, Y.X.; Dai, P.; Yin, S.; Chen, E.; Gu, Y. Quantitative microporosity evaluation using mercury injection and digital image analysis in tight carbonate rocks: A case study from the Ordovician in the Tazhong Palaeouplift, Tarim Basin, NW China. J. Nat. Gas Sci. Eng. 2016, 34, 627–644. [Google Scholar] [CrossRef]
- Smith, L.B.; Eberli, G.P.; Masaferro, J.L.; Al-Dhahab, S. Discrimination of effective from ineffective porosity in heterogeneous Cretaceous carbonates, Al Ghubar field, Oman. AAPG Bull. 2003, 87, 1509–1529. [Google Scholar] [CrossRef]
- Meng, F.K.; Lei, Q.; He, D.B.; Yan, H.J.; Jia, A.L.; Deng, H.; Xu, W. Production performance analysis for deviated wells in composite carbonate gas reservoirs. J. Nat. Gas Sci. Eng. 2018, 56, 333–343. [Google Scholar] [CrossRef]
- Lai, Q.; Xie, B.; Wu, Y.Y.; Huang, K.; Liu, X.G.; Jin, Y.; Luo, W.J.; Liang, T. Petrophysical characteristics and logging evaluation of bitumen carbonate reservoirs: A case study of the Cambrian Longwangmiao Formation in Anyue gas field, Sichuan Basin, SW China. Pet. Explor. Dev. 2017, 44, 941–947. [Google Scholar] [CrossRef]
- Wang, L.; He, Y.M.; Peng, X.; Deng, H.; Liu, Y.C.; Xu, W. Pore structure characteristics of an ultradeep carbonate gas reservoir and their effects on gas storage and percolation capacities in the Deng IV member, Gaoshiti-Moxi Area, Sichuan Basin, SW China. Mar. Pet. Geol. 2020, 111, 44–65. [Google Scholar] [CrossRef]
- Jin, X.D.; Pan, C.C.; Yu, S.; Li, E.T.; Wang, J.; Fu, X.D.; Qin, J.Z.; Xie, Z.Y.; Zheng, P.; Wang, L.S.; et al. Organic geochemistry of marine source rocks and pyrobitumen-containing reservoir rocks of the Sichuan Basin and neighbouring areas, SW China. Mar. Pet. Geol. 2014, 56, 147–165. [Google Scholar] [CrossRef]
- Hao, B.; Zhao, W.Z.; Hu, S.Y.; Shi, S.Y.; Gao, P.; Wang, T.S.; Huang, S.P.; Jiang, H. Bitumen formation of Cambrian Longwangmiao Formation in the central Sichuan and its implication for hydrocarbon accumulation. Pet. Res. 2018, 3, 44–56. [Google Scholar] [CrossRef]
- Chen, Z.H.; Simoneit, B.R.; Wang, T.G.; Ni, Z.Y.; Yuan, G.H.; Chang, X.C. Molecular markers, carbon isotopes, and rare earth elements of highly mature reservoir pyrobitumens from Sichuan Basin, southwestern China: Implications for PreCambrian-Lower Cambrian petroleum systems. Precambrian Res. 2018, 317, 33–56. [Google Scholar] [CrossRef]
- Zheng, T.Y.; Ma, X.H.; Pang, X.Q.; Wang, W.Y.; Zheng, D.Y.; Huang, Y.Z.; Wang, X.R.; Kang, K. Organic geochemistry of the Upper Triassic T3x5 source rocks and the hydrocarbon generation and expulsion characteristics in Sichuan Basin, central China. J. Pet. Sci. Eng. 2019, 173, 1340–1354. [Google Scholar] [CrossRef]
- Wood, J.M.; Sanei, H.; Curtis, M.E.; Clarkson, C.R. Solid bitumen as a determinant of reservoir quality in an unconventional tight gas siltstone play. Int. J. Coal Geol. 2015, 150, 287–295. [Google Scholar] [CrossRef]
- Shi, C.H.; Cao, J.; Tan, X.C.; Luo, B.; Zeng, W.; Hu, W.X. Discovery of oil bitumen co-existing with solid bitumen in the Lower Cambrian Longwangmiao giant gas reservoir, Sichuan Basin, southwestern China: Implications for hydrocarbon accumulation process. Org. Geochem. 2017, 108, 61–81. [Google Scholar] [CrossRef]
- Taheri-Shakib, J.; Rajabi-Kochi, M.; Kazemzadeh, E.; Naderi, H.; Salimidelshad, Y.; Esfahani, M.R. A comprehensive study of asphaltene fractionation based on adsorption onto calcite, dolomite and sandstone. J. Pet. Sci. Eng. 2018, 171, 863–878. [Google Scholar] [CrossRef]
- Gao, P.; Liu, G.D.; Lash, G.G.; Li, B.Y.; Yan, D.T.; Chen, C. Occurrences and origin of reservoir solid bitumen in Sinian Dengying Formation dolomites of the Sichuan Basin, SW China. Int. J. Coal Geol. 2018, 200, 135–152. [Google Scholar] [CrossRef]
- Mastalerz, M.; Drobniak, A.; Stankiewicz, A.B. Origin, properties, and implications of solid bitumen in source-rock reservoirs: A review. Int. J. Coal Geol. 2018, 195, 14–36. [Google Scholar] [CrossRef]
- Strausz, O.P.; Mojelsky, T.W.; Lown, E.M. The molecular structure of bitumen: An unfolding story. Fuel 1992, 71, 1355–1363. [Google Scholar] [CrossRef]
- Groenzin, H.; Mullins, O.C.; Eser, S.; Mathews, J.; Yang, M.G.; Jones, D. Molecular size of bitumen solubility fractions. Energy Fuels 2003, 17, 498–503. [Google Scholar] [CrossRef]
- Hassanpouryouzband, A.; Joonaki, E.; Taghikhani, V.; Boozarjomehry, R.B.; Chapoy, A.; Tohidi, B. New two-dimensional particle-scale model to simulate asphaltene deposition in wellbores and pipelines. Energy Fuels 2018, 32, 2661–2672. [Google Scholar] [CrossRef]
- Marczewski, A.W.; Szymula, M. Adsorption of bitumens from toluene on mineral surface. Colloids Surf. A Physicochem. Eng. Asp. 2002, 208, 259–266. [Google Scholar] [CrossRef]
- Szymula, M.; Marczewski, A.W. Adsorption of bitumens from toluene on typical soils of Lublin region. Appl. Surf. Sci. 2002, 196, 301–311. [Google Scholar] [CrossRef]
- Doryani, H.; Malayeri, M.R.; Riazi, M. Precipitation and deposition of bitumen in porous media: Impact of various connate water types. J. Mol. Liq. 2018, 258, 124–132. [Google Scholar] [CrossRef]
- Qi, Z.; Abedini, A.; Sharbatian, A.; Pang, Y.; Guerrero, A.; Sinton, D. Bitumen deposition during bitumen extraction with natural gas condensate and naphtha. Energy Fuels 2018, 32, 1433–1439. [Google Scholar] [CrossRef]
- Tirjoo, A.; Bayati, B.; Rezaei, H.; Rahmati, M. Molecular dynamics simulations of bitumen aggregation under different conditions. J. Pet. Sci. Eng. 2019, 177, 392–402. [Google Scholar] [CrossRef]
- Orangi, H.S.; Modarress, H.; Fazlali, A.; Namazi, M.H. Phase behavior of binary mixture of bitumen solvent and ternary mixture of bitumen solvent precipitant. Fluid Phase Equilibria 2006, 245, 117–124. [Google Scholar] [CrossRef]
- Li, Y.; Chen, S.J.; Lu, J.G.; Wang, G.; Zou, X.L.; Xiao, Z.L.; Su, K.M.; He, Q.B.; Luo, X.P. The logging recognition of solid bitumen and its effect on physical properties, AC, resistivity and NMR parameters. Mar. Pet. Geol. 2020, 112, 104070. [Google Scholar] [CrossRef]
- Speight, J.G.; Long, R.B.; Trowbridge, T.D. Factors influencing the separation of bitumens from heavy petroleum feedstocks. Fuel 1984, 63, 616–620. [Google Scholar] [CrossRef]
- Mehana, M.; Abraham, J.; Fahes, M. The impact of bitumen deposition on fluid flow in sandstone. J. Pet. Sci. Eng. 2019, 174, 676–681. [Google Scholar] [CrossRef]
- Ji, K.; Guo, S.B.; Mao, W.J.; Hou, X.L.; Xing, J.; Hou, B.C. The influence of bitumen on the interpretation of NMR measurement. Mar. Pet. Geol. 2018, 89, 752–760. [Google Scholar] [CrossRef]
- Feng, G.Q.; Liu, Q.G.; Shi, G.Z.; Lin, Z.H. An unsteady seepage flow model considering kickoff pressure gradient for low-permeability gas reservoirs. Pet. Explor. Dev. 2008, 35, 457–461. [Google Scholar] [CrossRef]
- Xie, X.H.; Lu, H.J.; Deng, H.C.; Yang, H.Z.; Teng, B.L.; Li, H.A. Characterization of unique natural gas flow in fracture-vuggy carbonate reservoir: A case study on Dengying carbonate reservoir in China. J. Pet. Sci. Eng. 2019, 182, 106243. [Google Scholar] [CrossRef]
- Yue, D.L.; Wu, S.H.; Xu, Z.Y.; Xiong, L.; Chen, D.X.; Ji, Y.L.; Zhou, Y. Reservoir quality, natural fractures, and gas productivity of upper Triassic Xujiahe tight gas sandstones in western Sichuan Basin, China. Mar. Pet. Geol. 2018, 370–386. [Google Scholar] [CrossRef]
- Wu, Y.T.; Pan, Z.J.; Zhang, D.Y.; Lu, Z.H.; Connell, L.D. Evaluation of gas production from multiple coal seams: A simulation study and economics. Int. J. Min. Sci. Technol. 2018, 28, 359–371. [Google Scholar] [CrossRef]
- Liu, G.F.; Meng, Z.; Luo, D.Y.; Wang, J.M.; Gu, D.H.; Yang, D.Y. Experimental evaluation of interlayer interference during commingled production in a tight sandstone gas reservoir with multi-pressure systems. Fuel 2020, 262, 116557. [Google Scholar] [CrossRef]
- Wang, L.; Yang, S.L.; Liu, Y.C.; Xu, W.; Deng, H.; Meng, Z.; Han, W.; Qian, K. Experimental investigation on gas supply capability of commingled production in a fracture-cavity carbonate gas reservoir. Pet. Explor. Dev. 2017, 44, 824–833. [Google Scholar] [CrossRef]
- Fang, H.; Ji, H.C.; Zhou, J.G.; Zhang, J.Y.; Jia, H.B.; Liu, Z.Y. The influences of sea-level changes on the quality of bank reservoirs of the Lower Cambrian Longwangmiao Formation, in the Gaoshiti-Moxi area, Sichuan Province, China. J. Nat. Gas Sci. Eng. 2016, 32, 292–303. [Google Scholar] [CrossRef]
- Zeng, H.L.; Zhao, W.Z.; Xu, Z.H.; Fu, Q.L.; Hu, S.Y.; Wang, Z.C.; Li, B.H. Carbonate seismic sedimentology: A case study of Cambrian Longwangmiao Formation, Gaoshiti-Moxi area, Sichuan Basin, China. Pet. Explor. Dev. 2018, 45, 830–839. [Google Scholar] [CrossRef]
- Yueming, Y.A.; Long, W.E.; Bing, L.U.; Wenzhi, W.; Shujiao, S. Hydrocarbon accumulation of Sinian natural gas reservoirs, Leshan-Longnüsi paleohigh, Sichuan Basin, SW China. Pet. Explor. Dev. 2016, 43, 197–207. [Google Scholar]
- Li, X.Z.; Guo, Z.H.; Wan, Y.J.; Liu, X.H.; Zhang, M.L.; Xie, W.R.; Su, Y.H.; Hu, Y.; Feng, J.W.; Yang, B.X.; et al. Geological characteristics and development strategies for Cambrian Longwangmiao Formation gas reservoir in Anyue gas field, Sichuan Basin, SW China. Pet. Explor. Dev. 2017, 44, 428–436. [Google Scholar] [CrossRef]
- Morawski, I.; Nowicki, M. Directional Auger and elastic peak electron spectroscopies: Versatile methods to reveal near-surface crystal structure. Surf. Sci. Rep. 2019, 74, 178–212. [Google Scholar] [CrossRef]
- Wang, L.; Yang, S.L.; Xu, W.; Meng, Z.; Han, W.; Qian, K. Application of Improved Productivity Simulation Method in Determination of the Lower Limits of Reservoir Physical Properties in Moxi District of An’yue Gas Field. Xinjiang Pet. Geol. 2017, 38, 358–362. (In Chinese) [Google Scholar]
- Wang, L.; Yang, S.L.; Peng, X.; Deng, H.; Liao, Y.; Liu, Y.C.; Xu, W.; Yan, Y.J. Visual Investigation of the Occurrence Characteristics of Multi-Type Formation Water in a Fracture–Cavity Carbonate Gas Reservoir. Energies 2018, 11, 661. [Google Scholar] [CrossRef]
- Li, C.H.; Li, X.Z.; Gao, S.S.; Liu, H.X.; You, S.Q.; Fang, F.F.; Shen, W.J. Experiment on gas-water two-phase seepage and inflow performance curves of gas wells in carbonate reservoirs: A case study of Longwangmiao Formation and Dengying Formation in Gaoshiti-Moxi block, Sichuan Basin, SW China. Pet. Explor. Dev. 2017, 44, 983–992. [Google Scholar] [CrossRef]
- Chen, Y.; Ma, G.W.; Jin, Y.; Wang, H.D.; Wang, Y. Productivity evaluation of unconventional reservoir development with three-dimensional fracture networks. Fuel 2019, 244, 304–313. [Google Scholar] [CrossRef]
- Tian, W.B.; Li, A.F.; Ren, X.X.; Josephine, Y. The threshold pressure gradient effect in the tight sandstone gas reservoirs with high water saturation. Fuel 2018, 226, 221–229. [Google Scholar] [CrossRef]
© 2020 by the authors. Licensee MDPI, Basel, Switzerland. This article is an open access article distributed under the terms and conditions of the Creative Commons Attribution (CC BY) license (http://creativecommons.org/licenses/by/4.0/).