Article

Evaluation of Filtered Spark Gap on the Lightning Protection of Distribution Transformers: Experimental and Simulation Study

1
Department of Electrical Engineering and Automation, Aalto University, Maarintie 8, 02150 Espoo, Finland
2
Department of Electrical Engineering, University of Engineering and Technology, Lahore 39161, Pakistan
3
Faculty of Electrical Power Engineering and Communication, Brno University of Technology, 601 90 Brno, Czech Republic
*
Author to whom correspondence should be addressed.
Energies 2020, 13(15), 3799; https://doi.org/10.3390/en13153799
Submission received: 24 June 2020 / Revised: 20 July 2020 / Accepted: 23 July 2020 / Published: 24 July 2020
(This article belongs to the Special Issue Transient and Dynamic Simulations of Distribution Networks)

Abstract

:
Protection of transformers, as one of the most expensive equipment in the power system, against lightning overvoltage impulses is a vital task. This paper, for the first time so far, investigates the effects of a filtered spark gap on the protection level of transformers against lightning overvoltage impulses. The filter is an inductor that is placed in series with the transformer and before the spark gap aiming to reduce the voltage at the connection point of the spark gap, and hence, enhancing the protection level of the transformer under lightning overvoltages. The experimental laboratory tests are accomplished on a 400 kVA, 22/0.4 kV, Delta-Star ( Δ Y ) connection type transformer under 110 kV, and 125 kV overvoltage impulses, whereas the size of the spark gap is set to 80 mm and two inductors of 35 μ H and 119 μ H are considered. In order to perform a more in-depth analysis, a model that works reasonably close to the empirical case is developed in the EMTP-RV software. An optimization algorithm is used to determine the sensitive parameters of the double-exponential function, which is used to reproduce the applied laboratory lightning impulse voltages in the EMTP-RV environment. Moreover, the transformer is modeled according to the Cigre Guidelines (Working Group 02 of Study Committee 33). The behavior of the spark gap is simulated as close as the practical situation using the disruptive effect method. The preciseness of the simulated filtered spark gap model is verified by comparing the results of the simulated model in the EMTP-RV with the results of experimental tests. After verifying the model, different sizes of inductors are studied in the EMTP-RV environment to investigate whether larger or smaller inductors provide better protection for the transformer under lightning conditions. A comparison is performed among the conventional spark gap, surge arrester, and the filtered spark gap to provide a better analysis of the potential of the proposed device. The results indicate that proper sizing of the inductor, within an effective range, slightly enhances the protection level of the transformer.

1. Introduction

Electrical equipment and, more specifically, the equipment that is operating in open areas are subjected to more natural hazards such as lightning phenomena. Lightning surges can cause severe damages to the equipment that results in outages, and consequently, demand curtailment may happen. On the other hand, maintaining the economic growth of a country requires a high-reliable electricity supply [1]. Therefore, enhancing the protection level of the electrical equipment can improve the reliability, and consequently, offer a better service to end-users [2]. Practical solutions might be renovating and modifying the construction of the equipment or optimal allocation of protection devices.
The importance of enhancing the protection of power system equipment against lightning resulted in opening several areas of research [3,4,5,6,7,8]. Li et al., in [3], provided adequate information on the usage of the lightning rod, while [4,5,6,7,8] mainly discussed the arrangements and effectiveness of shield wire on direct and indirect lightning overvoltages protection. However, among the electrical equipment, transformers are considered as one of the most expensive equipment in the power system. The unexpected external transients, even those with magnitude lower than the applied protection level, may severely stress the winding insulation in transformers [9]. To this end, in the literature, there exist many works that focused on investigating different methods to enhance the protection level of transformers against lightning overvoltages. The degrees of protection for the transformers were thoroughly investigated in [10]. This work provided adequate information on the most effective degrees of protection as well as partial protection while considering direct-stroke protection.
High power rating transformers (≥200 kVA) are generally protected by surge arresters, whereas low power rating transformers (<200 kVA) are protected by spark gaps. Surge capacitors have been specially designed to protect the insulation of transformers by mitigating the steepness of the overvoltage wave [11]. On the other hand, protection schemes based on the combination of surge arresters, spark gaps and surge arresters, and surge capacitors and surge arresters have also been proposed. In [12], the effects of the spark gap and surge arrester on the lightning overvoltage protection of a wooden pole-mounted transformer were investigated. It was recommended that low rating surge arresters, which are more cost-efficient, arranged in series combination with spark gaps, can be used to mitigate the lightning overvoltages. Sabiha et al., first in [13], proposed a high-frequency model for the transformers to investigate the transfer of lightning overvoltage from the primary terminal or medium voltage (MV) side to the secondary terminal or low voltage (LV) side. Accordingly, the transferred overvoltages to the secondary terminal (LV side) of the distribution transformer through the operation of spark-gap was studied in detail in [14]. In this work, the combination of surge arrester, installed on the LV side, with the spark-gap, installed on the MV side, was also investigated and it was shown that installing surge arresters at the LV side of the transformer mitigated the lightning overvoltage, stroke at the MV side, before transmitting toward the LV electricity consumers. In [15], the effects of the spark gap on the LV side of the transformer was investigated using a surge arrestor on the MV side. The authors demonstrated that such an arrangement sufficiently decreases the voltage stress on the MV winding. In [16], a genetic algorithm (GA) was used for optimal placement of the spark gap, aiming at providing efficient protection for MV transformers. Similarly, in [17], a GA algorithm has been used for surge arrestor allocation in an IEEE-123 distribution network. The results demonstrated the effectiveness of the model in decreasing the probability of flashover occurrence. The effectiveness of utilizing a transmission line surge arrestor was investigated in [18]. It was shown that, more often than not, the common methods of connecting surge arresters for protecting the transformers are not adequate, and in some cases, the transformers still flashover in the presence of the arrester. This may endanger the protection level of the transformers. The application of surge arresters is regarded as the most appropriate method for the protection of power transformers, where these devices may also decrease the probability of flashover per year due to both the direct and indirect lightning phenomena [19]. Since the surge arresters are quite costly and may fail due to an overvoltage surge, continuous monitoring is required. On the other hand, the spark gap is a simple device that consists of two electrodes connected between the conductor and ground. In a three-phase distribution transformer, especially for ungrounded MV networks, the ignition of the spark gap results in an earth fault and, the circuit breaker is activated to remove the fault [20].
The literature review shows that not only the aforementioned works but also, to the best of our knowledge, the other existing works solely focus on optimally designing, installing, and operating the commonly-used overvoltage protection devices. On the other hand, the medium voltage distribution lines and, more specifically, the lines up to 20 kV that do not have a shielding wire are more likely to be struck by direct lightning [21], while having the shield wire also mitigates the lightning-induced overvoltages of MV networks effectively [5]. Therefore, some modification in the existing protection devices is required to protect the transformers against direct lightning. This work, for the first time so far, investigates the effects of a filtered spark gap on the mitigation of lightning overvoltages over distribution transformers both in the laboratory and in software. The filter is an inductor installed before the spark gap aims at reducing the amplitude of overvoltages induced by the lightning. The consequence might be fewer flashovers in the spark gap and hence fewer outages in the power system. A wide range of inductors is examined, and the obtained results are analyzed adequately to show the effectiveness of the proposed protection device. Therefore, the primary contribution of this work is proposing a novel, inexpensive configuration, namely filtered spark gap, to reduce the amplitude of lightning overvoltage on the high voltage terminals of the transformer and consequently improving the effectiveness of the conventional spark gap on protecting the power system equipment.
The remainder of this paper is organized as follows. Section 2 presents the experimental laboratory setup as well as modeling the proposed filtered spark gap in a software environment. The model is verified in Section 3 by comparing the software results with the recorded results in the laboratory. Section 4 provides in-depth analyses of the model by examining different inductor sizes to study the impact of inductor size on the protection level of the proposed filtered spark gap against indirect lightning strikes. Section 5 performs a comparison among different protection methods such as spark gap, filtered spark gap, and surge arrester following by a discussion on the results. Concluding remarks and the prospect of future works are presented in Section 6.

2. Filtered Spark Gap-Based Model

This section provides detailed information regarding the high voltage laboratory experimental setup as well as modeling the applied impulses, transformer, spark gap, and the proposed filter in a software environment. In Section 2.1, technical information of the utilized devices such as the inductor, spark gap, transformer, and impulse generator is provided, while Section 2.2 provides detailed information on simulating the aforementioned devices in software and required adjustments to obtain results as close as the experimental situation.

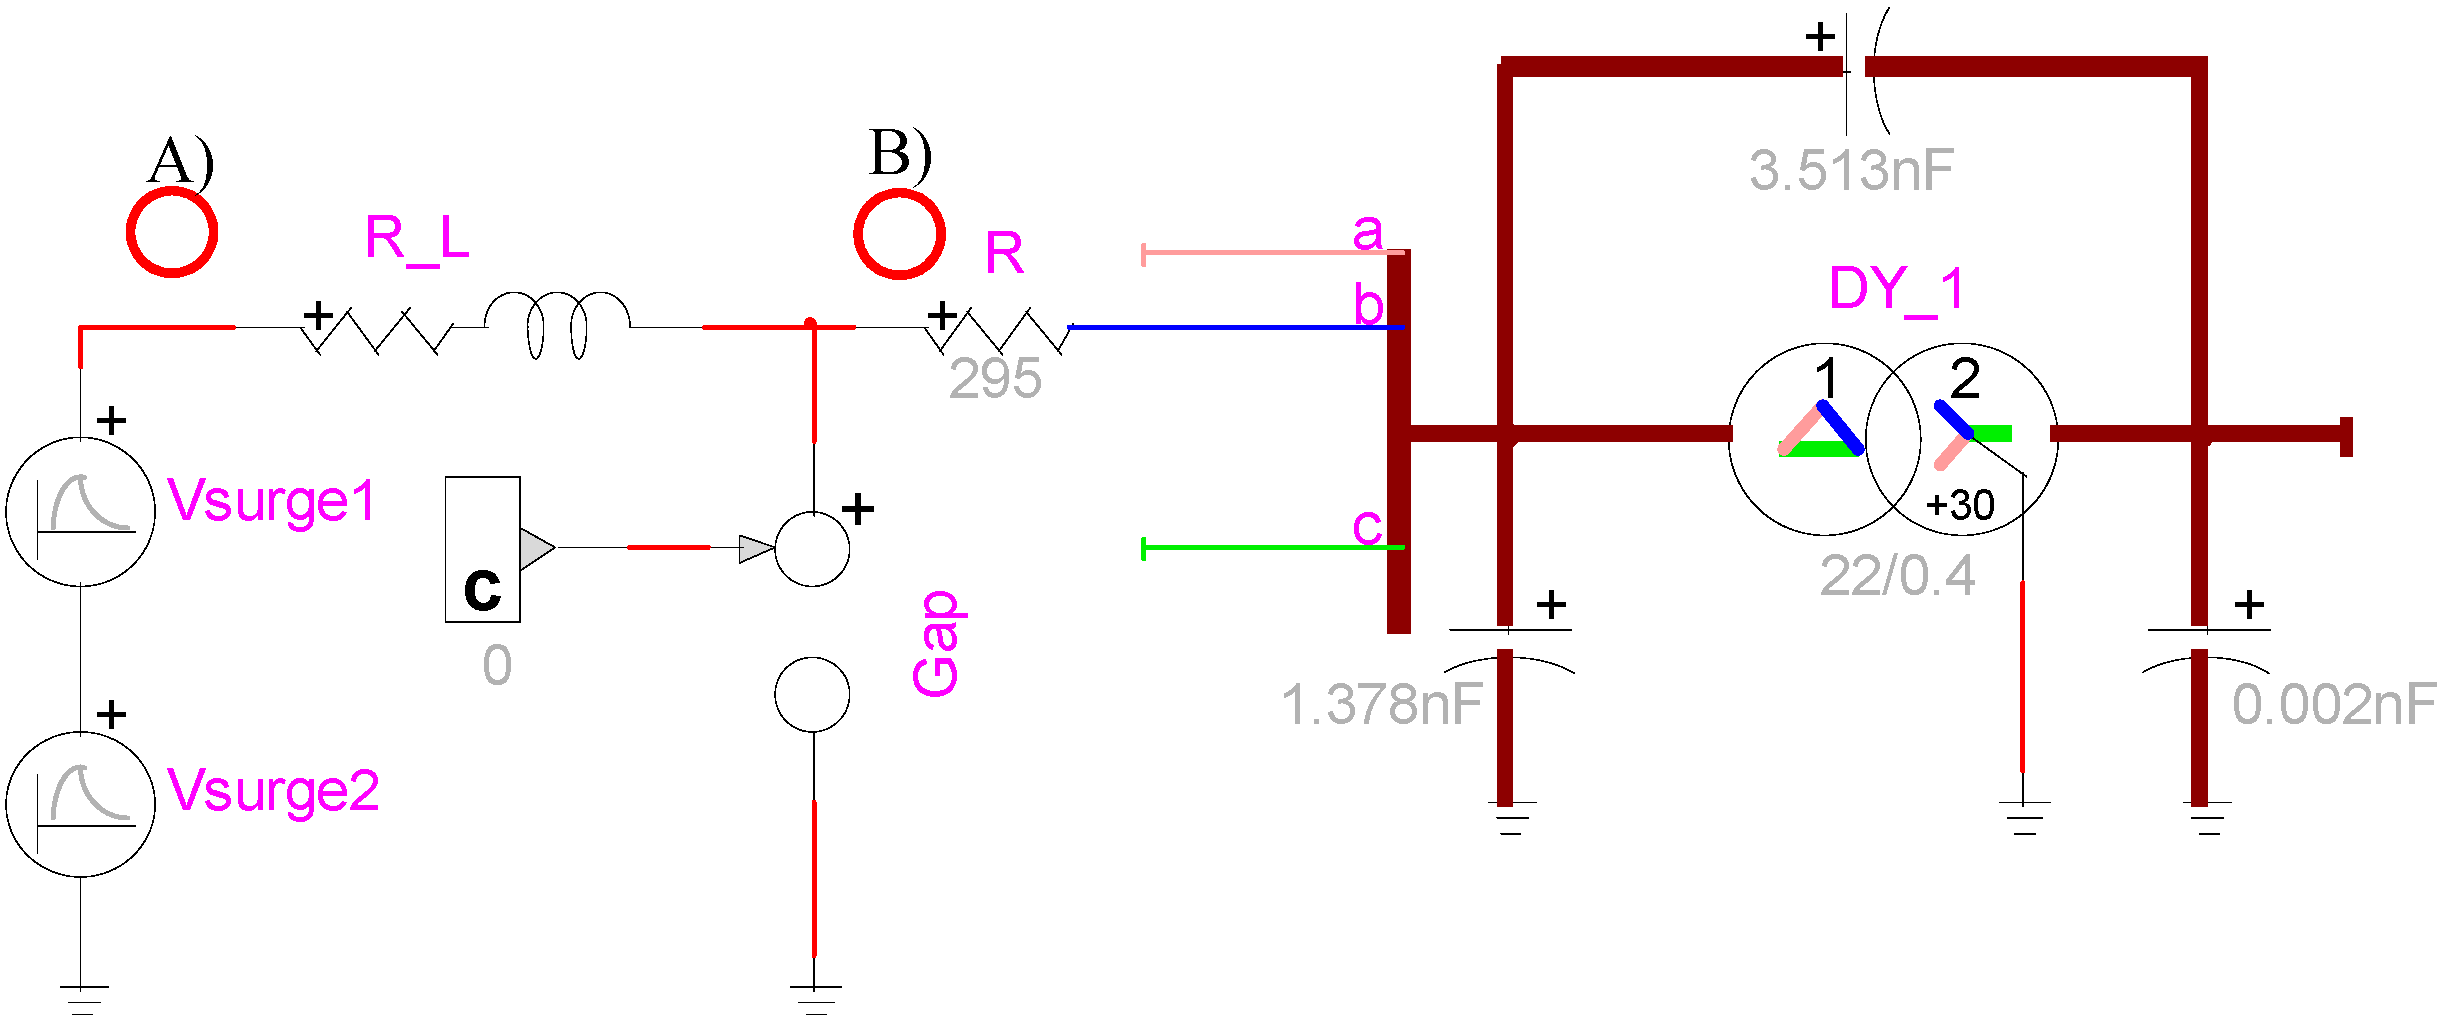
2.1. High Voltage Laboratory Experimental Setup

The laboratory tests have been performed in the Brno University of Technology, High Voltage Laboratory, in the Czech Republic. Figure 1a demonstrates the complete laboratory setup for investigating the impacts of filtered spark gap on the lightning overvoltages, while Figure 1b provides a close-up to highlight the connection of the inductor and the spark gap to the high voltage terminal of the transformer. The impulse generator is a 1000 kV/100 kJ, SG∆ 1000–100, Haefely, with a damping resistor of about 160 Ω, while the measurement system was HiAS 743. The tests were performed under the following atmospheric conditions: pressure: 97.392 kPa, temperature: 18.9 °C, and relative air humidity: 62.8%. The high voltage winding of the transformer was connected in a delta connection. Thus, the impulse voltage generator (to simulate the behavior of indirect lightning phenomena) could be connected to the phases a, b, or c (see Figure 1b for experimental setup and Figure 8 for the simulated model in software), however, for the sake of simplicity, in all the tests, the impulse was applied on the middle phase “b”, and all the measurements were made on the same phase. Interested readers may refer to [22] for obtaining a complete report on the laboratory setup, supporting figures, as well as a wide range of experimental results.
The utilized spark gap, presented in Figure 2a, is a sphere–sphere spark gap with an adjustable gap length 0–80 mm and brass electrode with a 20 mm electrode diameter. In this work, the gap length was set to 80 mm and was connected to the middle phase “b”. Figure 2b is a close-up to highlight the placement of the spark gap. More information about the spark gap is provided in the software simulations setup section. Two inductors with the following parameters were used in the laboratory test: (1) dimension 160 mm × 550 mm, 49 turns approximately, 1 mm2 wire, resistance 571.8 m Ω , inductance 119 μH and (2) dimension 110 mm × 400 mm, 33 turns approximately, 0.33 mm2 HV cable, resistance 450.8 m Ω , inductance 35 μH.

2.2. Software Simulation Setup

The optimization model was implemented in the general algebraic modeling system (GAMS) [23] and a nonlinear solver CONOPT was used to handle it [24]. In order to perform further simulation studies, the Electromagnetic Transients Program-Restructured Version (EMTP-RV) 4.1 software was used for virtual simulation purposes [25]. The MPLOT option in the EMTP-RV, which requires Matlab software [26], was used to prepare the figures.

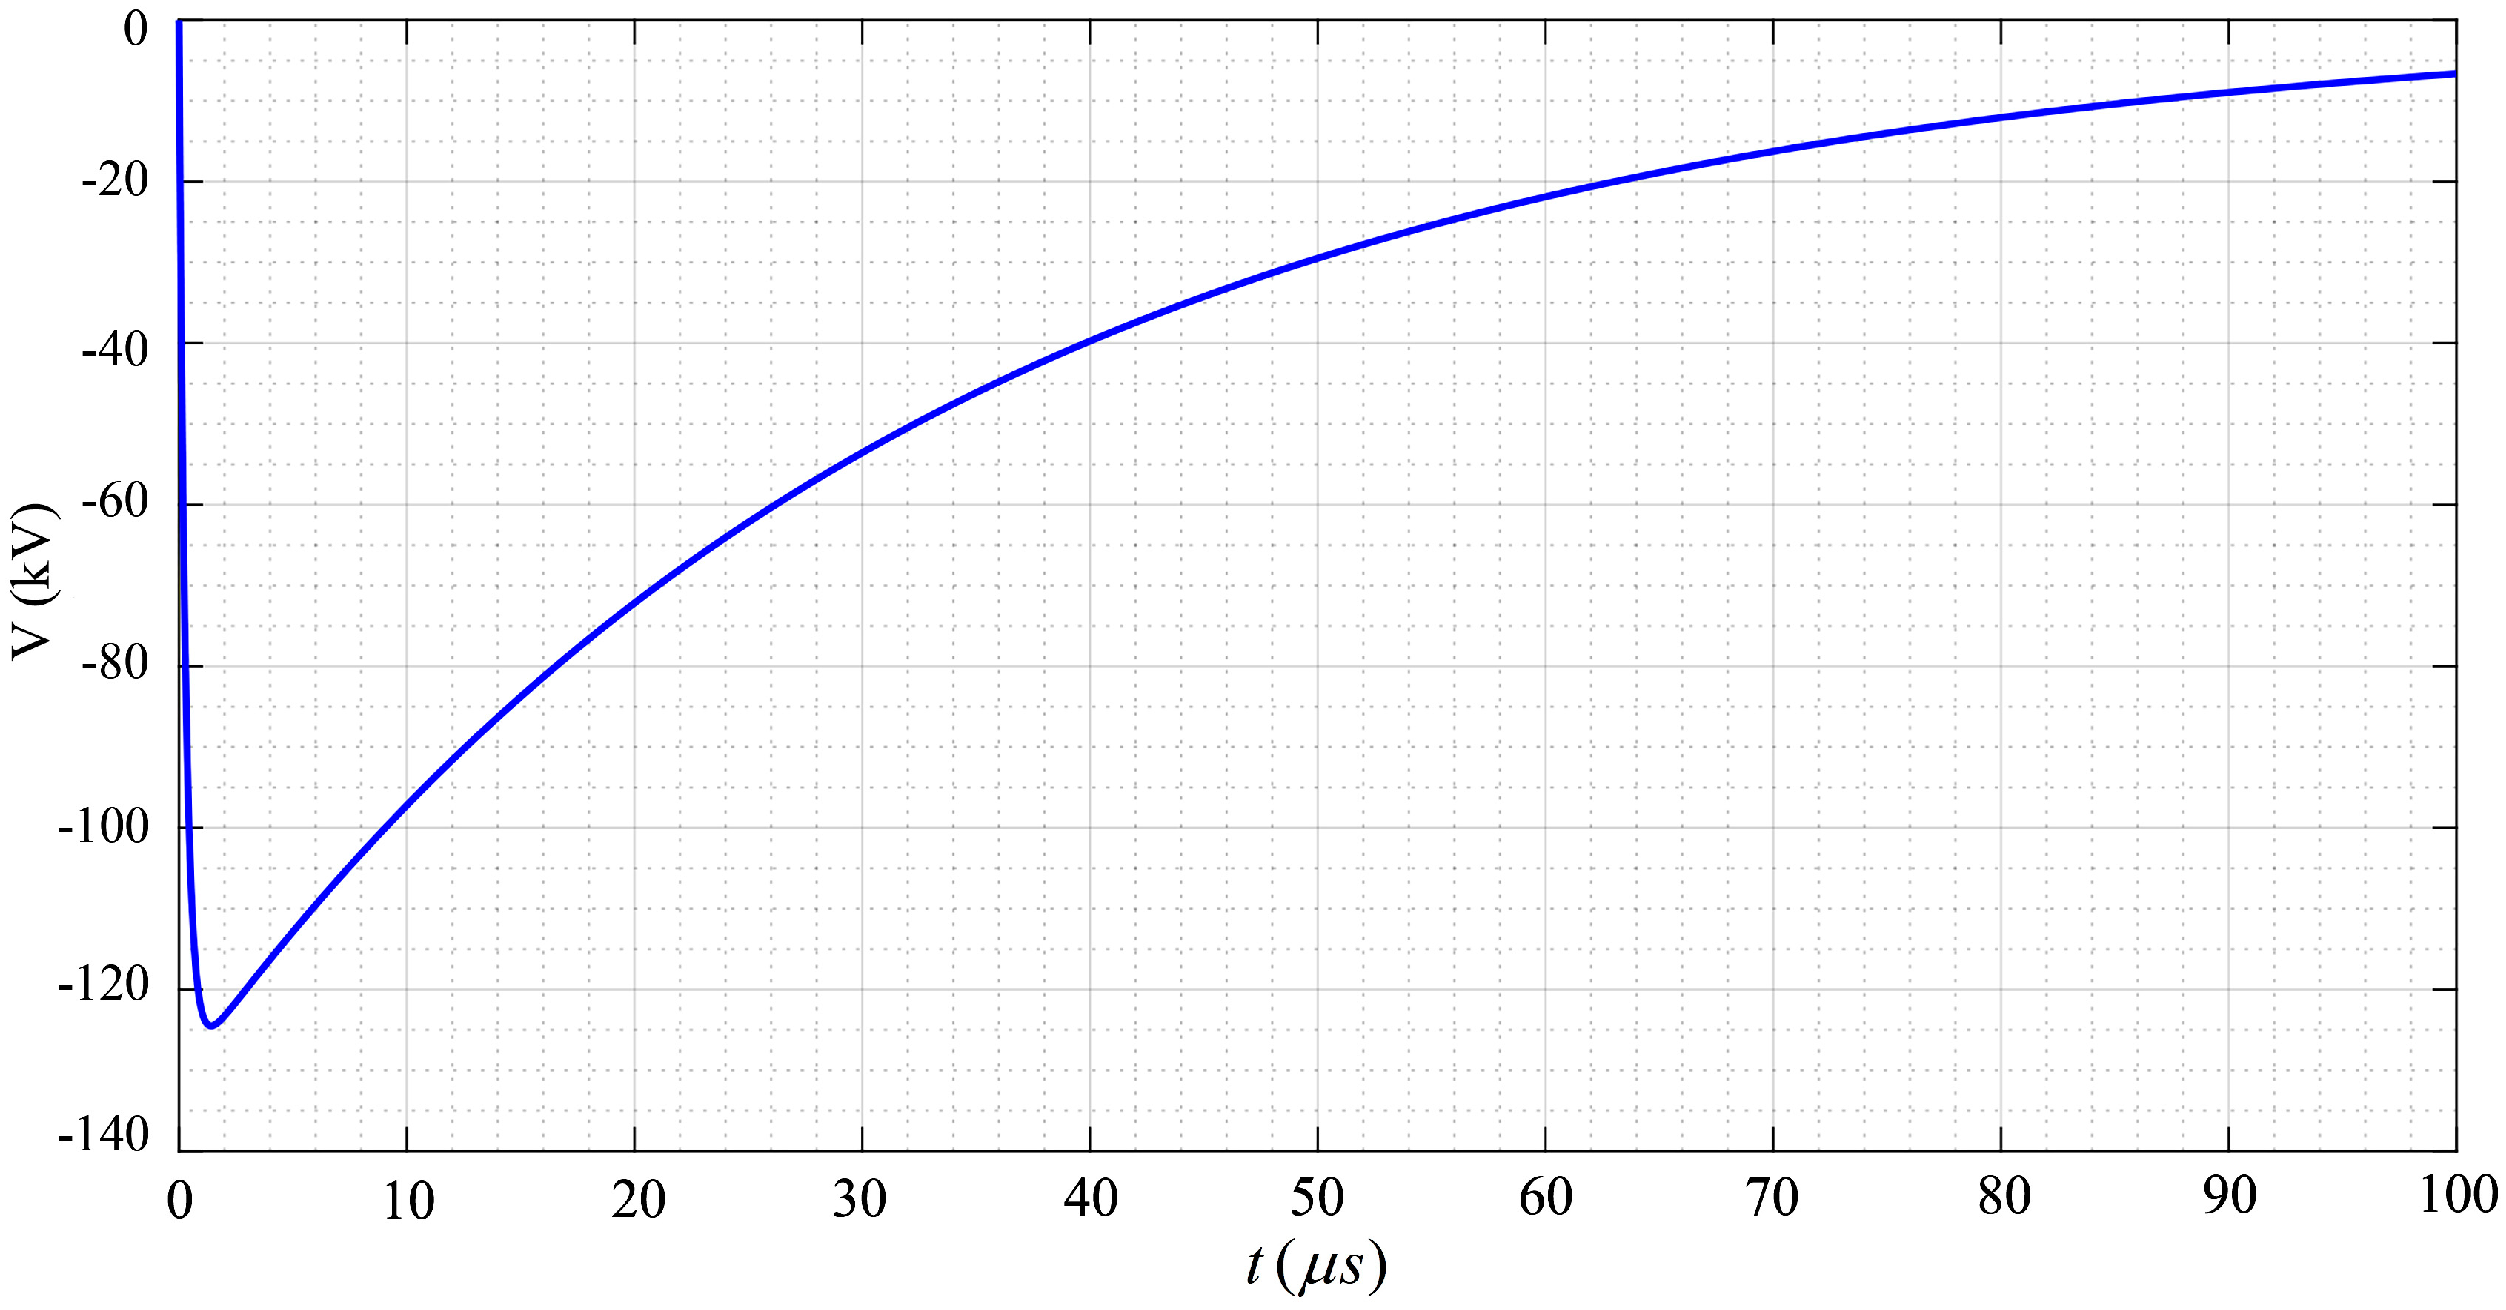
2.2.1. Applied Impulse

Reproducing an impulse voltage in simulation software similar to the laboratory environment is not straightforward; however, it plays a crucial role in validating the simulated model and performing further tests and analyses. In this work, the applied impulse voltage used to perform laboratory tests was not following the standard impulse voltage wave shape 1.2 / 50   μ s where 1.2   μ s stands for the front-time and 50   μ s . presents the time-to-half value. The impulse voltages are quasi-double peak ones with a nonstandard peak and time-to-half values. The nonstandard 125 kV impulse voltage generated in the laboratory is presented in Figure 3. In laboratory-generated impulse voltages, the electromagnetic fields associated with a high-voltage impulse may induce a voltage on the standard voltage divider that results in a small peak after the main peak [27].
In EMTP-RV software, standard or nonstandard lightning impulses can be reproduced by using the existing voltage surge tool in the library that utilizes the double exponential function given by (1) to produce impulse voltages. In order to reproduce a standard impulse voltage, one surge tool might be enough, while nonstandard impulses require more than one surge to be connected in series. In this work, the nonstandard quasi-double peak impulse voltage is reproduced by connecting two surges in series, Figure 4.
V ( t ) = V m ( e α t e β t )
where V m is the maximum voltage of the source, α and β are the coefficients to adjust the front time (e.g., 1.2   μ s ± 30 % ) and time to half value (e.g., 50   μ s ± 20 % ) [28].
The parameters of the double exponential function (1) are too sensitive, and adjusting them via a trial and error approach is frustrating and may never reproduce an impulse similar to the applied laboratory impulse. In this work, an optimization model was used to find the optimal values for these parameters and reproduce an impulse voltage identical to the applied laboratory impulse voltage as follows.
max α 1 + β 1 s . t .
V m 1 ( e α 1 t p 1 e β 1 t p 1 ) V p 1
V m 1 ( e α 1 t p 1 e β 1 t p 1 ) = V p 1
V m 1 ( e α 1 t p 1 + e β 1 t p 1 + ) V p 1 ; t [ t p 1 + ζ 1 t p 1 + ζ 2 ]
V t p _ V m 1 ( e α 1 t t p e β 1 t t p ) V t p ¯
Due to the practical experience, the parameters α and β mostly take negative values. Therefore, maximizing the summation of these negative values guarantee to find the smallest values, which is extremely helpful in enhancing the computational efficiency of simulation via the EMTP-RV software [25]. It is worth mentioning that for the sake of simplicity, the optimization algorithm is developed to reproduce the positive polarity of the impulse voltage, while to find the negative polarity, easily the signs of V m s are changed to the negative one. The primary step in this optimization method is setting the peak value of the first peak. From the impulse voltages applied in the laboratory, the value of the first peak, V p 1 , and the frontier time, t p 1 , can be derived. From Figure 3, V p 1 is a bit lower than 125 kV, while the frontier time is 1.4   μ s . In this paper V p 1 is set to 124.5 kV. Before the first peak, the curve should be increasing, and this can be done by keeping the values of the curve less than or equal to V p 1 before time t p 1 . Equation (3) is used for this reason where t p 1 stands for any time before t p 1 , while (4) guarantees that the curve reaches its peak value at a specific time t p 1 . As it can be seen in Figure 3, after this peak, the curve should be decreasing again and to do so (5) is used to guarantee such a decreasing trend where t p 1 stands for any time after t p 1 , then practically ζ 1 can be selected as 0.02 μ s and for ζ 2 any value bigger than 0.02 μ s works (in this paper, 0.3 μ s ). On the other hand, it is required to simulate the behavior of the curve around the turning point where the second peak will be started after that. From Figure 3, the turning point happens around t t p = 4.5   μ s and the value at this point, V t p , is about 114.5 kV, therefore, the minimum and maximum limits are set to 114 kV and 115 kV, respectively. The obtained parameters are used in the double exponential model, and the curve is plotted via EMTP-RV or Matlab software, see Figure 5. Then, a comparison between the laboratory applied impulse and the later plotted curve is performed to reveal the differences between these curves. The second peak is prepared such that it fills the revealed difference. In this case, the following general optimization model is used. It is noteworthy to mention that the second curve should be started immediately after the turning point ( t t p = 4.5   μ s ).
max α 2 + β 2 s . t .
V m 2 ( e α 2 t c 1 e β 1 t c 1 ) V c 1
V m 2 ( e α 2 t c 2 e β 2 t c 2 ) V c 2 ; t c 2 ( ξ 1 ξ 2 ]
V m 2 ( e α 2 t 40 e β 2 t 40 ) V c 40
V m 2 ( e α 2 t 50 e β 2 t 50 ) V c 50
V m 2 ( e α 2 t 80 e β 2 t 80 ) V c 80
Similar to the previous case, it is favorable to obtain relatively small values for the parameters. Afterward, we need to choose some compensation points in the curve. One compensation point can be at the time after the turning point and before the second peak, where the curve needs to be increasing. In this paper, t c 1 = 2.5   μ s has been selected; note that this curve starts after the turning pint, 4.5   μ s , therefore t c 1 = 2.5   μ s is corresponding with t = 7 μ s of the first curve, and a comparison shows that this curve should compensate around 7.7 kV, therefore, V c 1 is set to 7.7 kV. The second peak is happening at around 7 μ s in Figure 3, however, a comparison between Figure 5 and Figure 3 reveals that for all times between 7 μ s and 15 μ s in Figure 3, a compensation less than or equal to 25 kV is required, which is stated by (9) while setting V c 1 , ξ 1 and ξ 1 to 25 kV, 2.5 μ s and 10.5 μ s . The other compensation points are selected to make a tail similar to the applied impulse. In this paper, the points correspond with 40 μ s , 50 μ s , and 80 μ s in Figure 3 have been selected to reproduce the time to half value. To this end, (10)–(12) are used, while according to comparison, the following data have been extracted and used in the optimization model: t 40 = 35.5   μ s , t 50 = 45.5   μ s , and t 80 = 75.5   μ s and the corresponding voltages are V c 40 = 35   kV , V c 50 = 33   kV , and V c 80 = 30   kV . Interested readers may refer to [29] for obtaining more information on the optimization models and deriving the GAMS code.
The optimization model was implemented in GAMS software [23], and the parameters for the first and second surges were obtained as follows: V m 1 = 131 ,   α 1 = 29818 ,   β 1 = 3386235 , V m 2 = 60 ,   α 2 = 11573 ,   and β 2 = 70405 , where the second surge is started 4.5   μ s after the first surge. Figure 6 presents the projection of the simulated impulse voltage, the blue curve, and on the laboratory applied impulse, the green curve. As can be seen from this figure, the optimization model resulted in an excellent outcome where the reproduced impulse voltage was almost identical to the laboratory applied impulse.

2.2.2. Transformer Model

The transformer used in the laboratory tests was a 22/0.4 kV Delta-Star ( Δ Y ) connection type. To model the transformer in the EMTP-RV environment, Cigre Guidelines were used [11]. Figure 7 shows the basic building block of a transformer for one phase. Three identical basic building blocks were connected in the Δ Y connection to model the three-phase transformer. After setting up the Δ Y connection, for the high voltage studies, it is essential to consider the capacitances on the primary side, between the primary and secondary sides, and on the secondary side. All the capacitances, presented in Figure 8, were measured in the laboratory to precisely model the transformer.

2.2.3. Spark Gap

A spark gap is a device that is used to protect the power system equipment by limiting the overvoltage. The spark gap is triggered when the applied voltage at the spark gap terminals exceeds the dielectric strength of air between its horns. In this work, to simulate the behavior of the spark gap as close as the practical situation, the disruptive effect (DE) method (13) was used [30].
t 0 t [ | v g a p ( t ) | v 0 ] k d t D
where the k, v 0 , and D are an empirical constant, the onset voltage onset of primary ionization or onset of a secondary streamer (kV), and the disruptive effect value (kV µs), respectively. These terms depend on the gap size and can be obtained or estimated via laboratory tests. Expression (13) states that the flashover in the spark gap occurs if from the moment t0 that the gap voltage becomes greater than v0, to time t in which the integral becomes greater than or equal to D.
The values of parameters k, D, and v0 are determined via the volt–time curve of the system and observing the withstand voltage of the dielectric under standard lightning overvoltages. Analytical and statistical methods are used to predict the behavior of the spark gap and calculate the best values for the aforementioned parameters [31]. However, more often than not, for the sake of simplicity and under the standard overvoltage impulses, k is set to 1.00 and the other two parameters are adjusted accordingly [30,32] as described in Section 3.

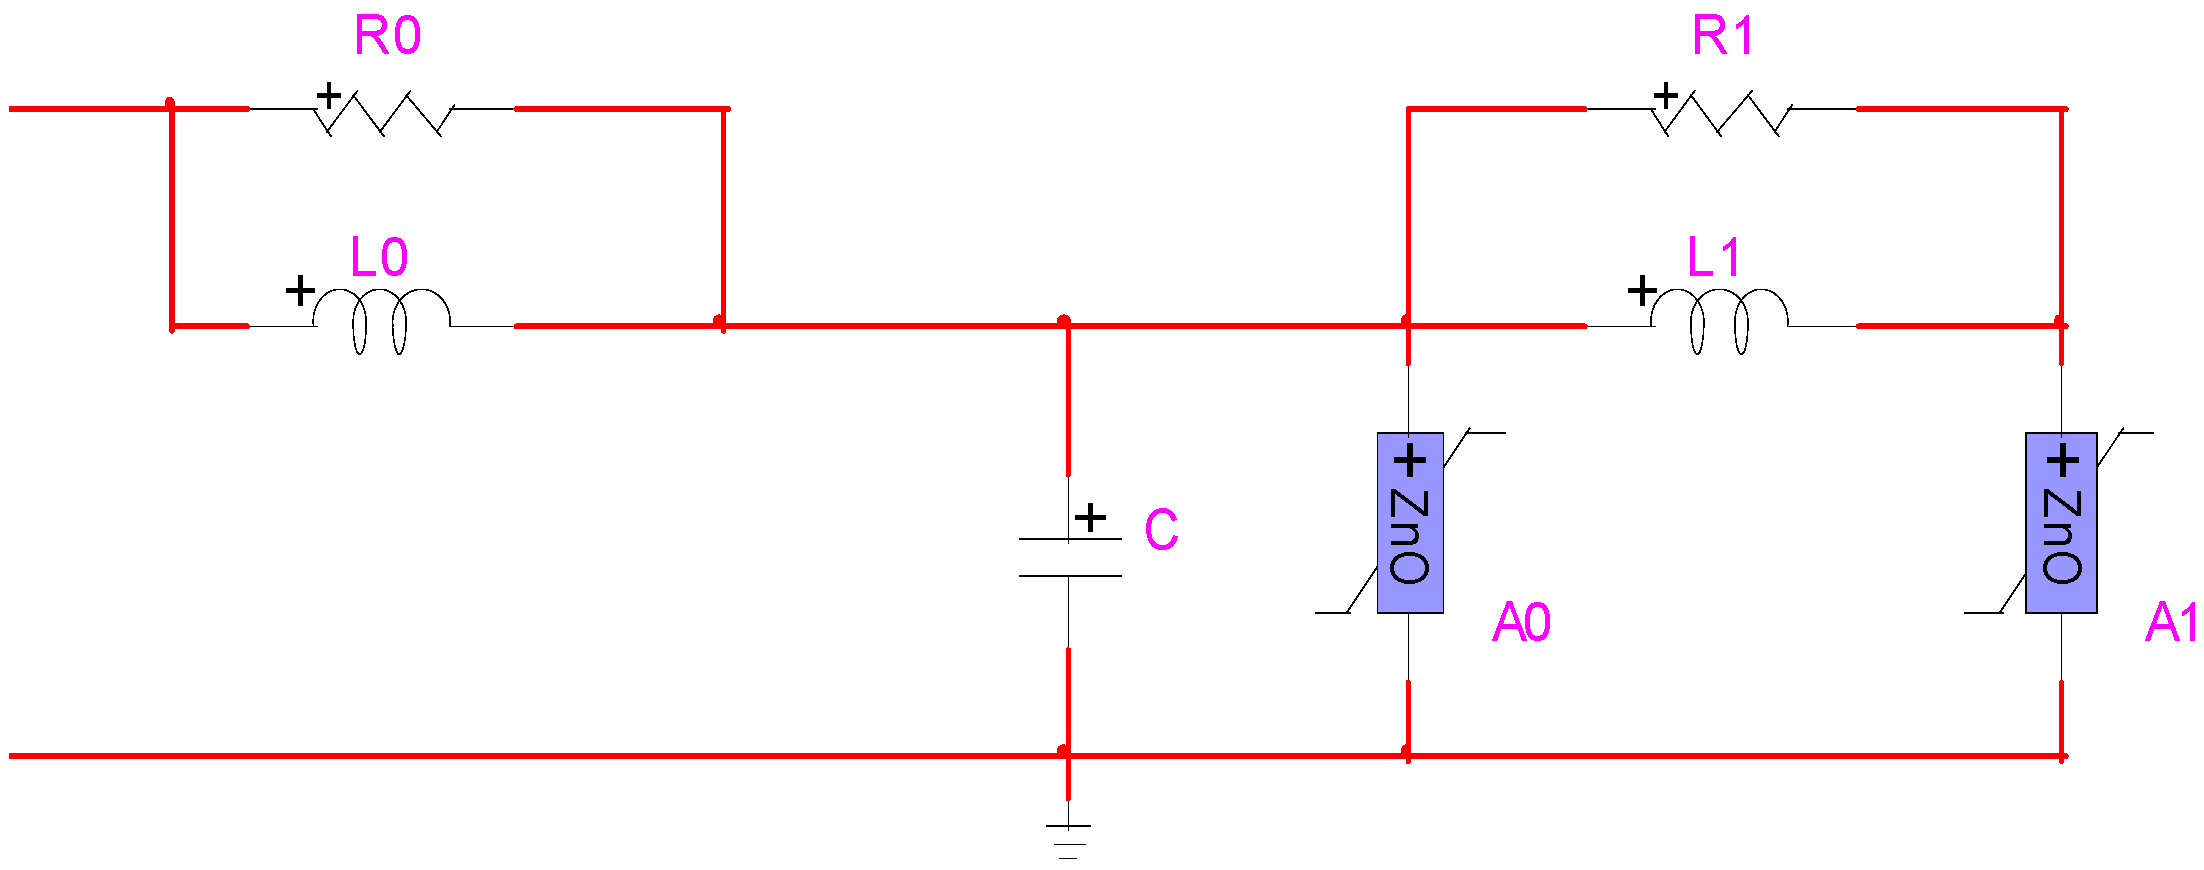
2.2.4. Placement of the Inductor-Based Filter

The inductor is placed before the transformer, while in the case of considering the spark gap, the spark gap is placed in between the series inductor and the transformer, see Figure 9. A damping resistor is also considered after the spark gap.

3. Model Validation

This section validates the simulated model in the EMTP-RV software. All the measurements were made at the connection point of the spark gap. For the case of considering the filtered spark gap, the measurements were made immediately after the inductor, see point (B) in Figure 9. The simulation time-steps were set to 20 nanoseconds (ns), while the total simulation time was similar to the laboratory test interval, 100 microseconds ( μ s ). The main reason of setting very small time-steps was to obtain precise results inclosing small fluctuations in the measured voltages. It is worth mentioning that the simulated model of the filtered spark gap in EMTP-RV is available in [22].
Before conducting different case studies, the model simulated in EMTP-RV software was validated by comparing its outcomes with the results obtained from the laboratory test. Two inductors of 35   μ H and 119 μ H , and different conditions were considered to perform the laboratory tests: (1) applying the 110 kV and 125 kV impulses in the presence of the spark gap and (2) applying the 110 kV and 125 kV impulses in the presence of the filtered spark gap. To simulate the behavior of the spark gap via the disruptive effect (DE) method, presented in (2), the DE parameters are adjusted in a way that the results stay as close as possible to the experimental case. As mentioned in Section 2, Section 2.2.3, for the standard lightning overvoltages, more often than not, k is set to 1.00, and the other parameters are obtained. However, in this work, due to applying nonstandard impulses, first, the method proposed in [33] has been used to derive the parameters, and then, a trial and error method has been used to find a better match with the laboratory results. Therefore, in this paper, the parameters are set as follows:   V 0 = 112 kV, k = 0.97 , and D = 0.01. It is worth mentioning that the impulse is applied to the middle phase, b in Figure 9, and all the tests are done while the transformer tank is grounded.

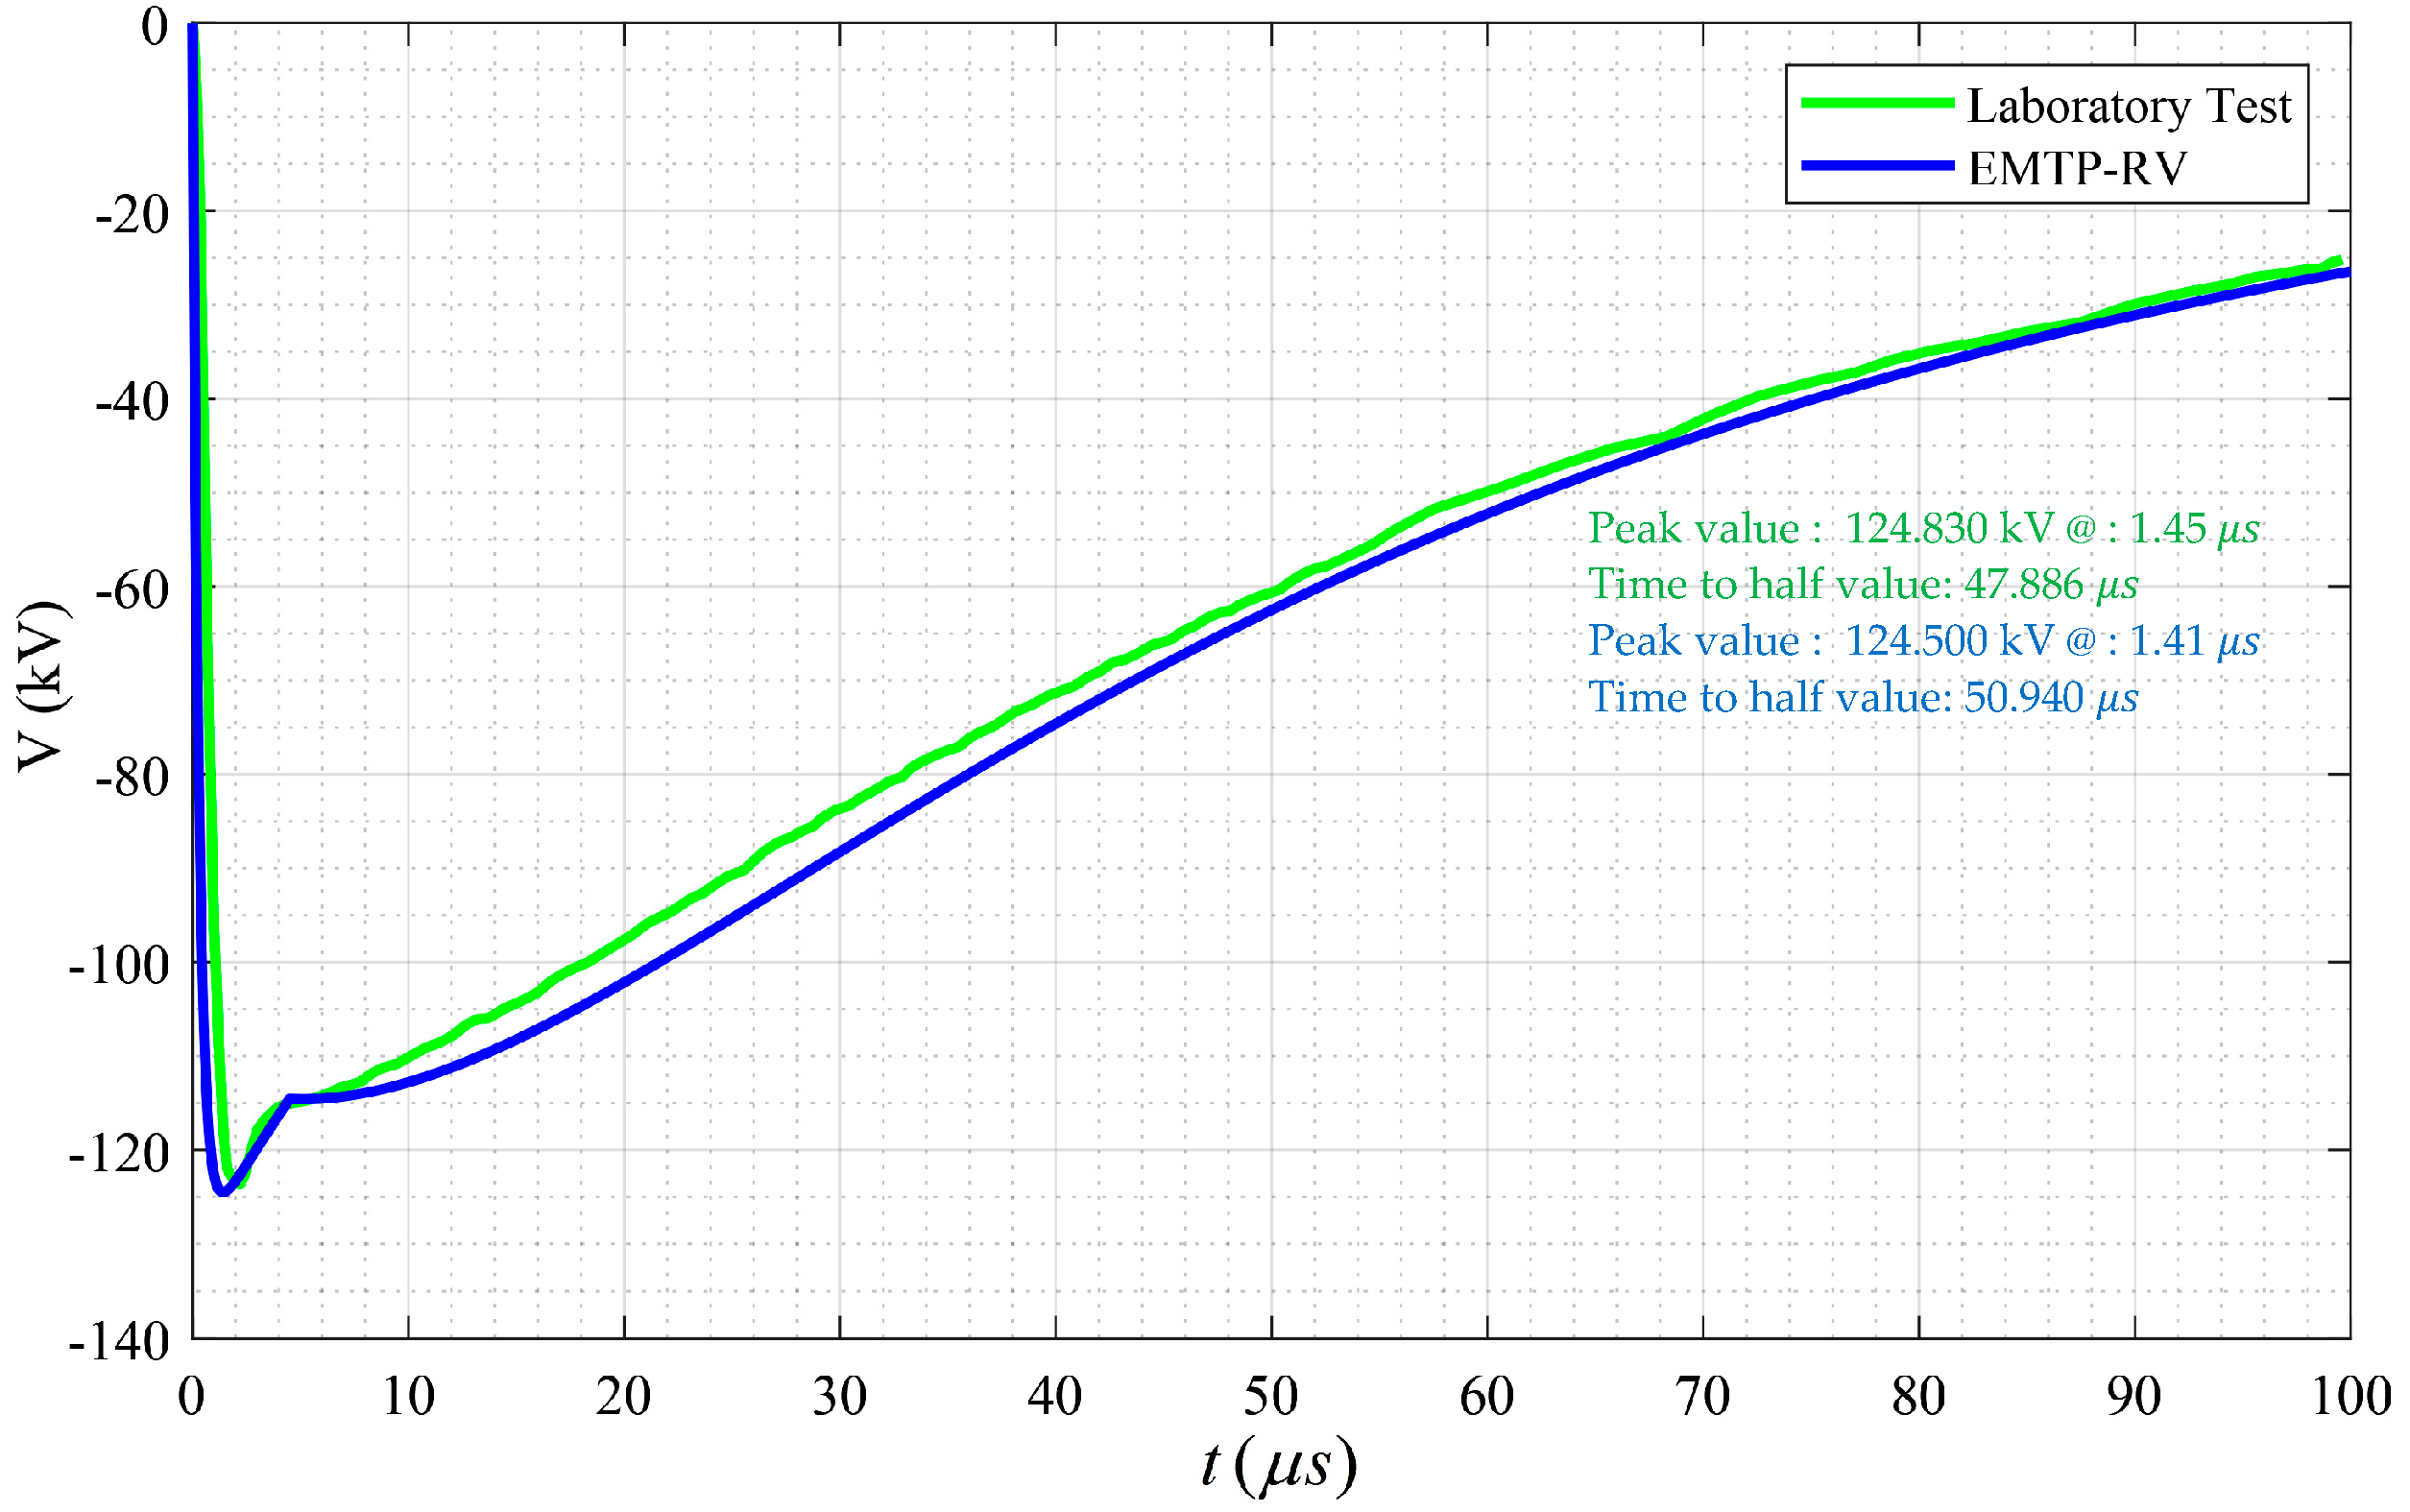
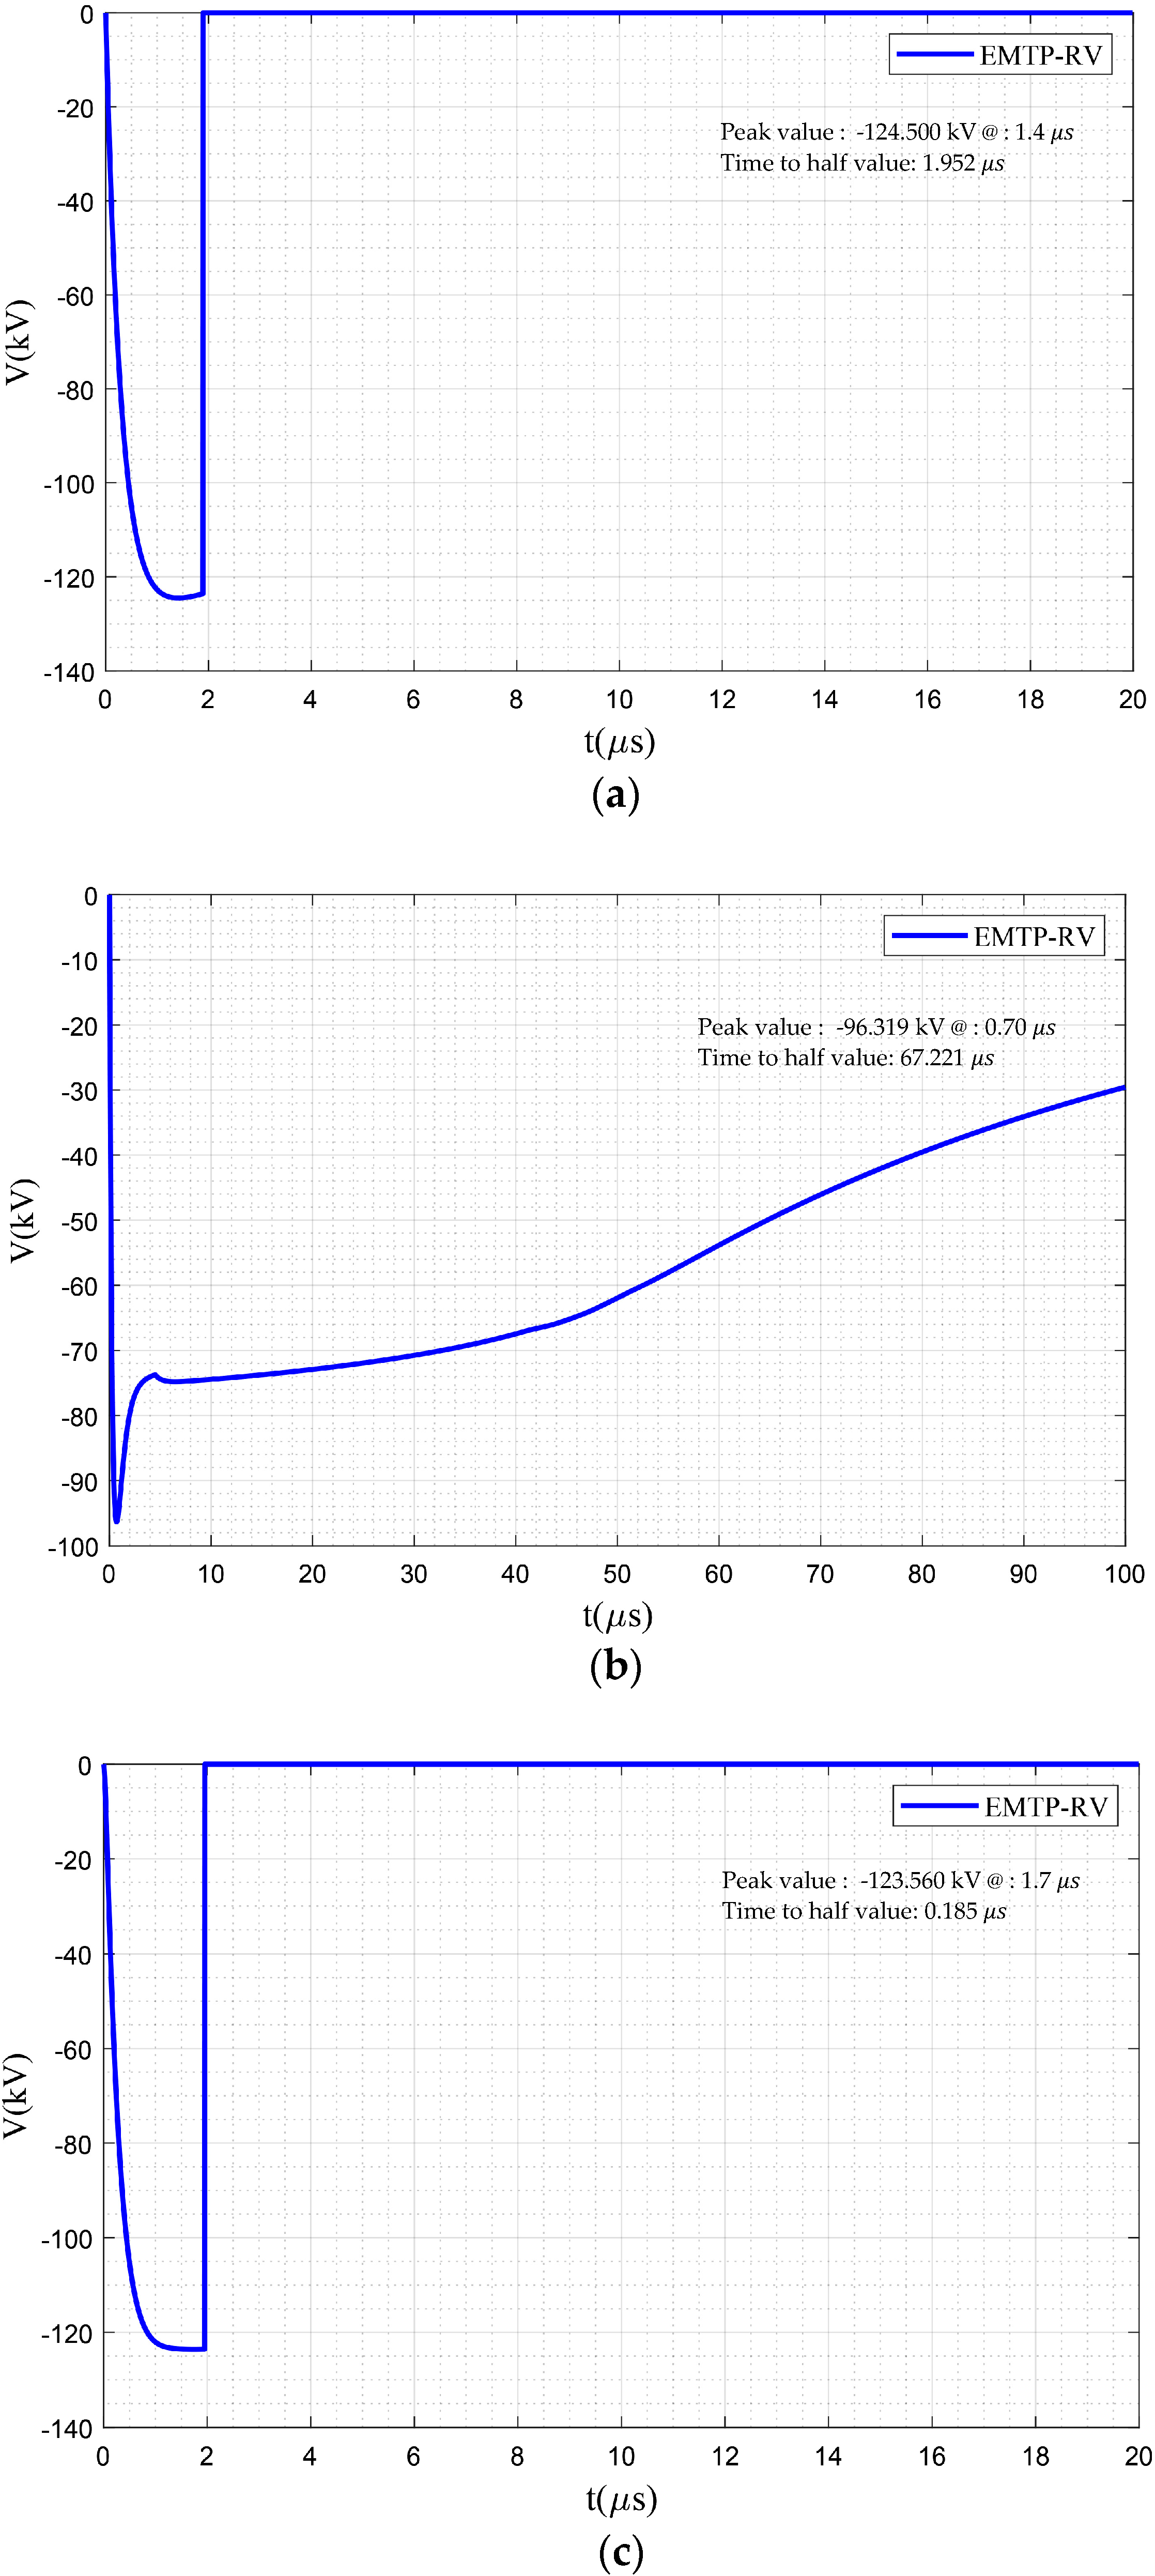
3.1. Test 1) Applying 110 kV and 125 kV Impulses in the Presence of the Spark Gap

In this case, the behavior of the spark gap, which was simulated via the DE method (13), was evaluated. However, before comparing the simulation results with the laboratory test, similar to the reproduction of 125 kV applied impulse voltage, an optimization model was developed to determine the parameters of two double exponential functions (1) connected in series as Figure 4. Similar to the 125 kV impulse voltage, the optimization model was used to adjust the parameters of the double exponential model for reproducing a 110 kV impulse voltage close to the applied laboratory impulse. By using the optimization model, the parameters were obtained as follows: V m 1 = 113.5 ,   α 1 = 28847 ,   β 1 = 3933683 and V m 2 = 40 ,   α 2 = 8518 ,   and β 2 = 64185 . It is worth mentioning that the same parameters α 1 , β 1 , α 2 , and β 2 found for reproducing 125 kV impulse voltage could have been used for reproducing 110 kV too, however, new adjustments were performed to obtain better simulation results. Figure 10 presents a comparison among the laboratory impulse voltage and the 110 kV impulse reproduced by using the coefficient adjusted for the 125 kV, in Section 2.2.1, and the aforementioned coefficients adjusted for the 110 kV impulse. As can be seen, the main difference starts at the turning point where the reproduced impulse voltage with the parameters adjusted for the 110 kV follows the laboratory applied an impulse more accurately. Note that after adjusting the parameters of the 110 kV and 125 kV voltage sources in the EMTP-RV environment, these parameters remained unchanged throughout the test.
After setting up the spark gap, the 110 kV and 125 kV impulses were applied, and the measurements were performed at the connection point of the spark gap. Figure 11 shows that after applying the 110 kV impulse voltage in the presence of the spark gap, the results of the software simulation, the blue curve, and the laboratory test, the green curve, were in very good agreement with each other.
Figure 12 shows the results of both the laboratory test and EMTP-RV simulation for a transformer protected by a spark gap under 125 kV applied impulse voltage. It can be seen that for this test, a flashover occurs across the spark gap to protect the transformer against the overvoltage. Although the peak value for the EMTP-RV model was 2.46% higher than the peak value of the experimental case, the front time for both cases was practically the same (1.400 μ s and 1.401 μ s , respectively). Moreover the flashovers in these cases occurred within a negligible difference, only about 0.06 μ s , while the time-to-half value was also comparable, 2.030 μ s and 1.952 μ s respectively for the laboratory test and EMTP-RV simulation. To examine the functionality of the spark gap in more detail, Case 2 investigates the reaction of the system under critical condition and in the presence of two different inductors.

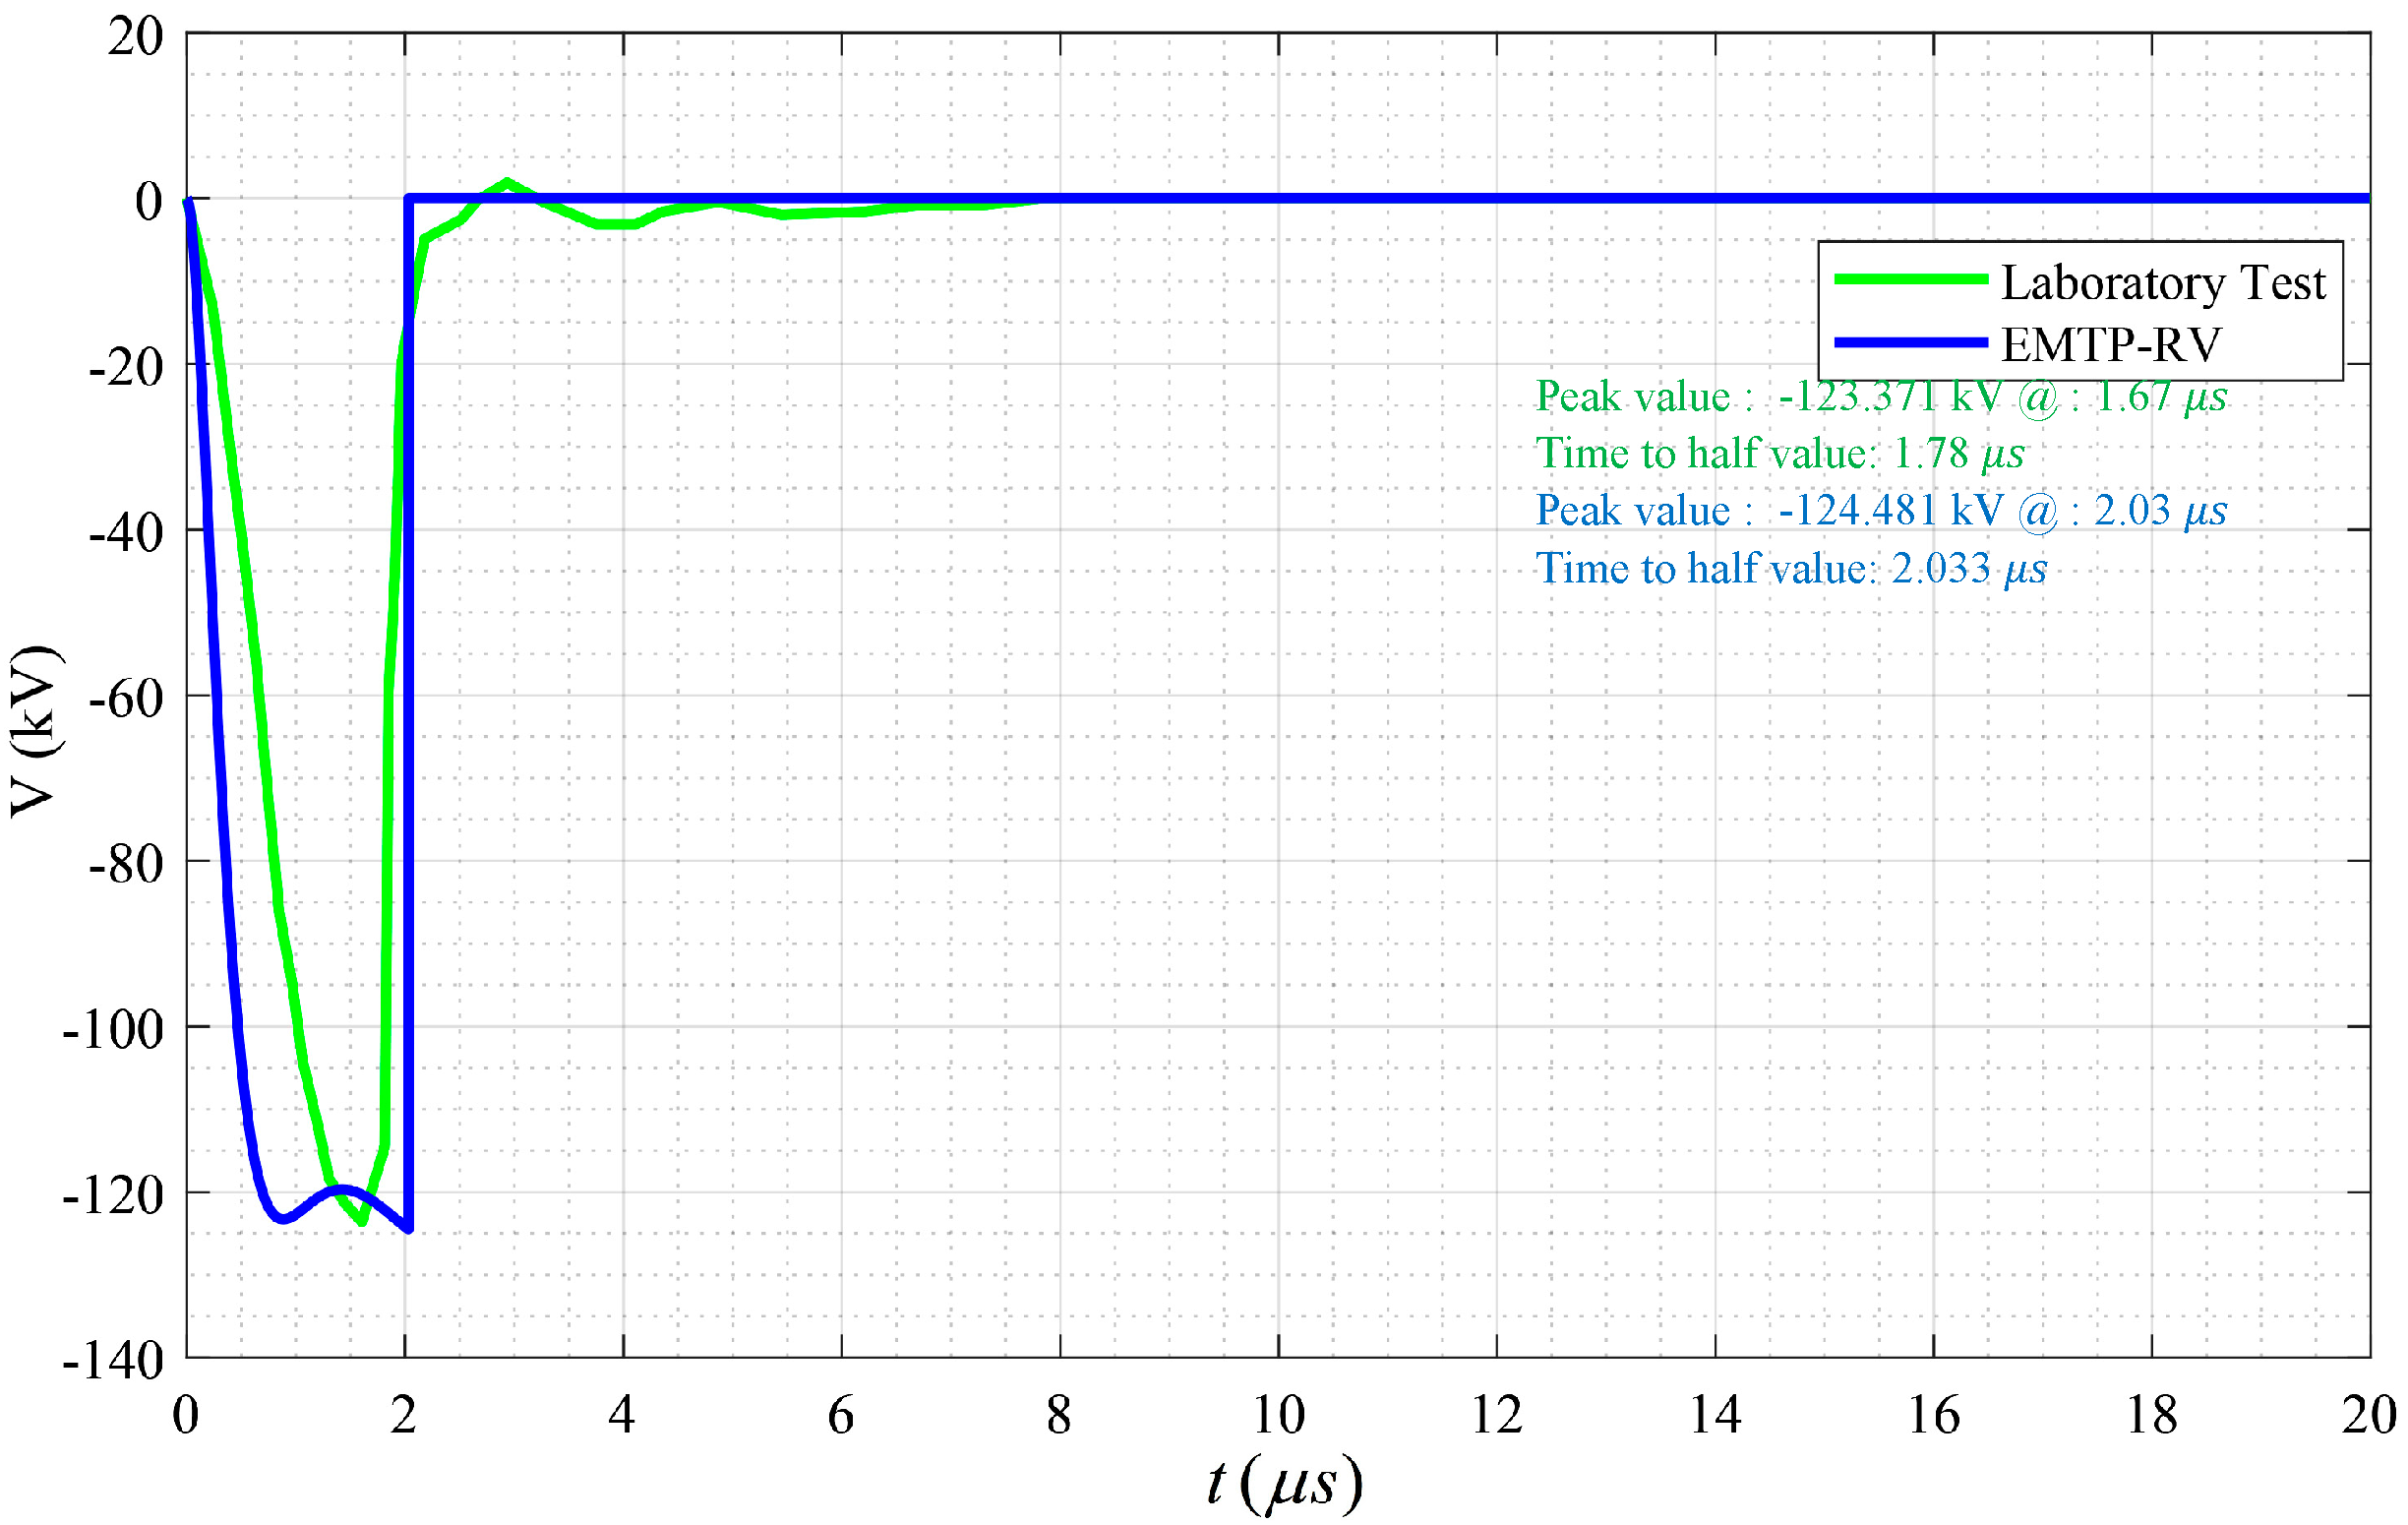
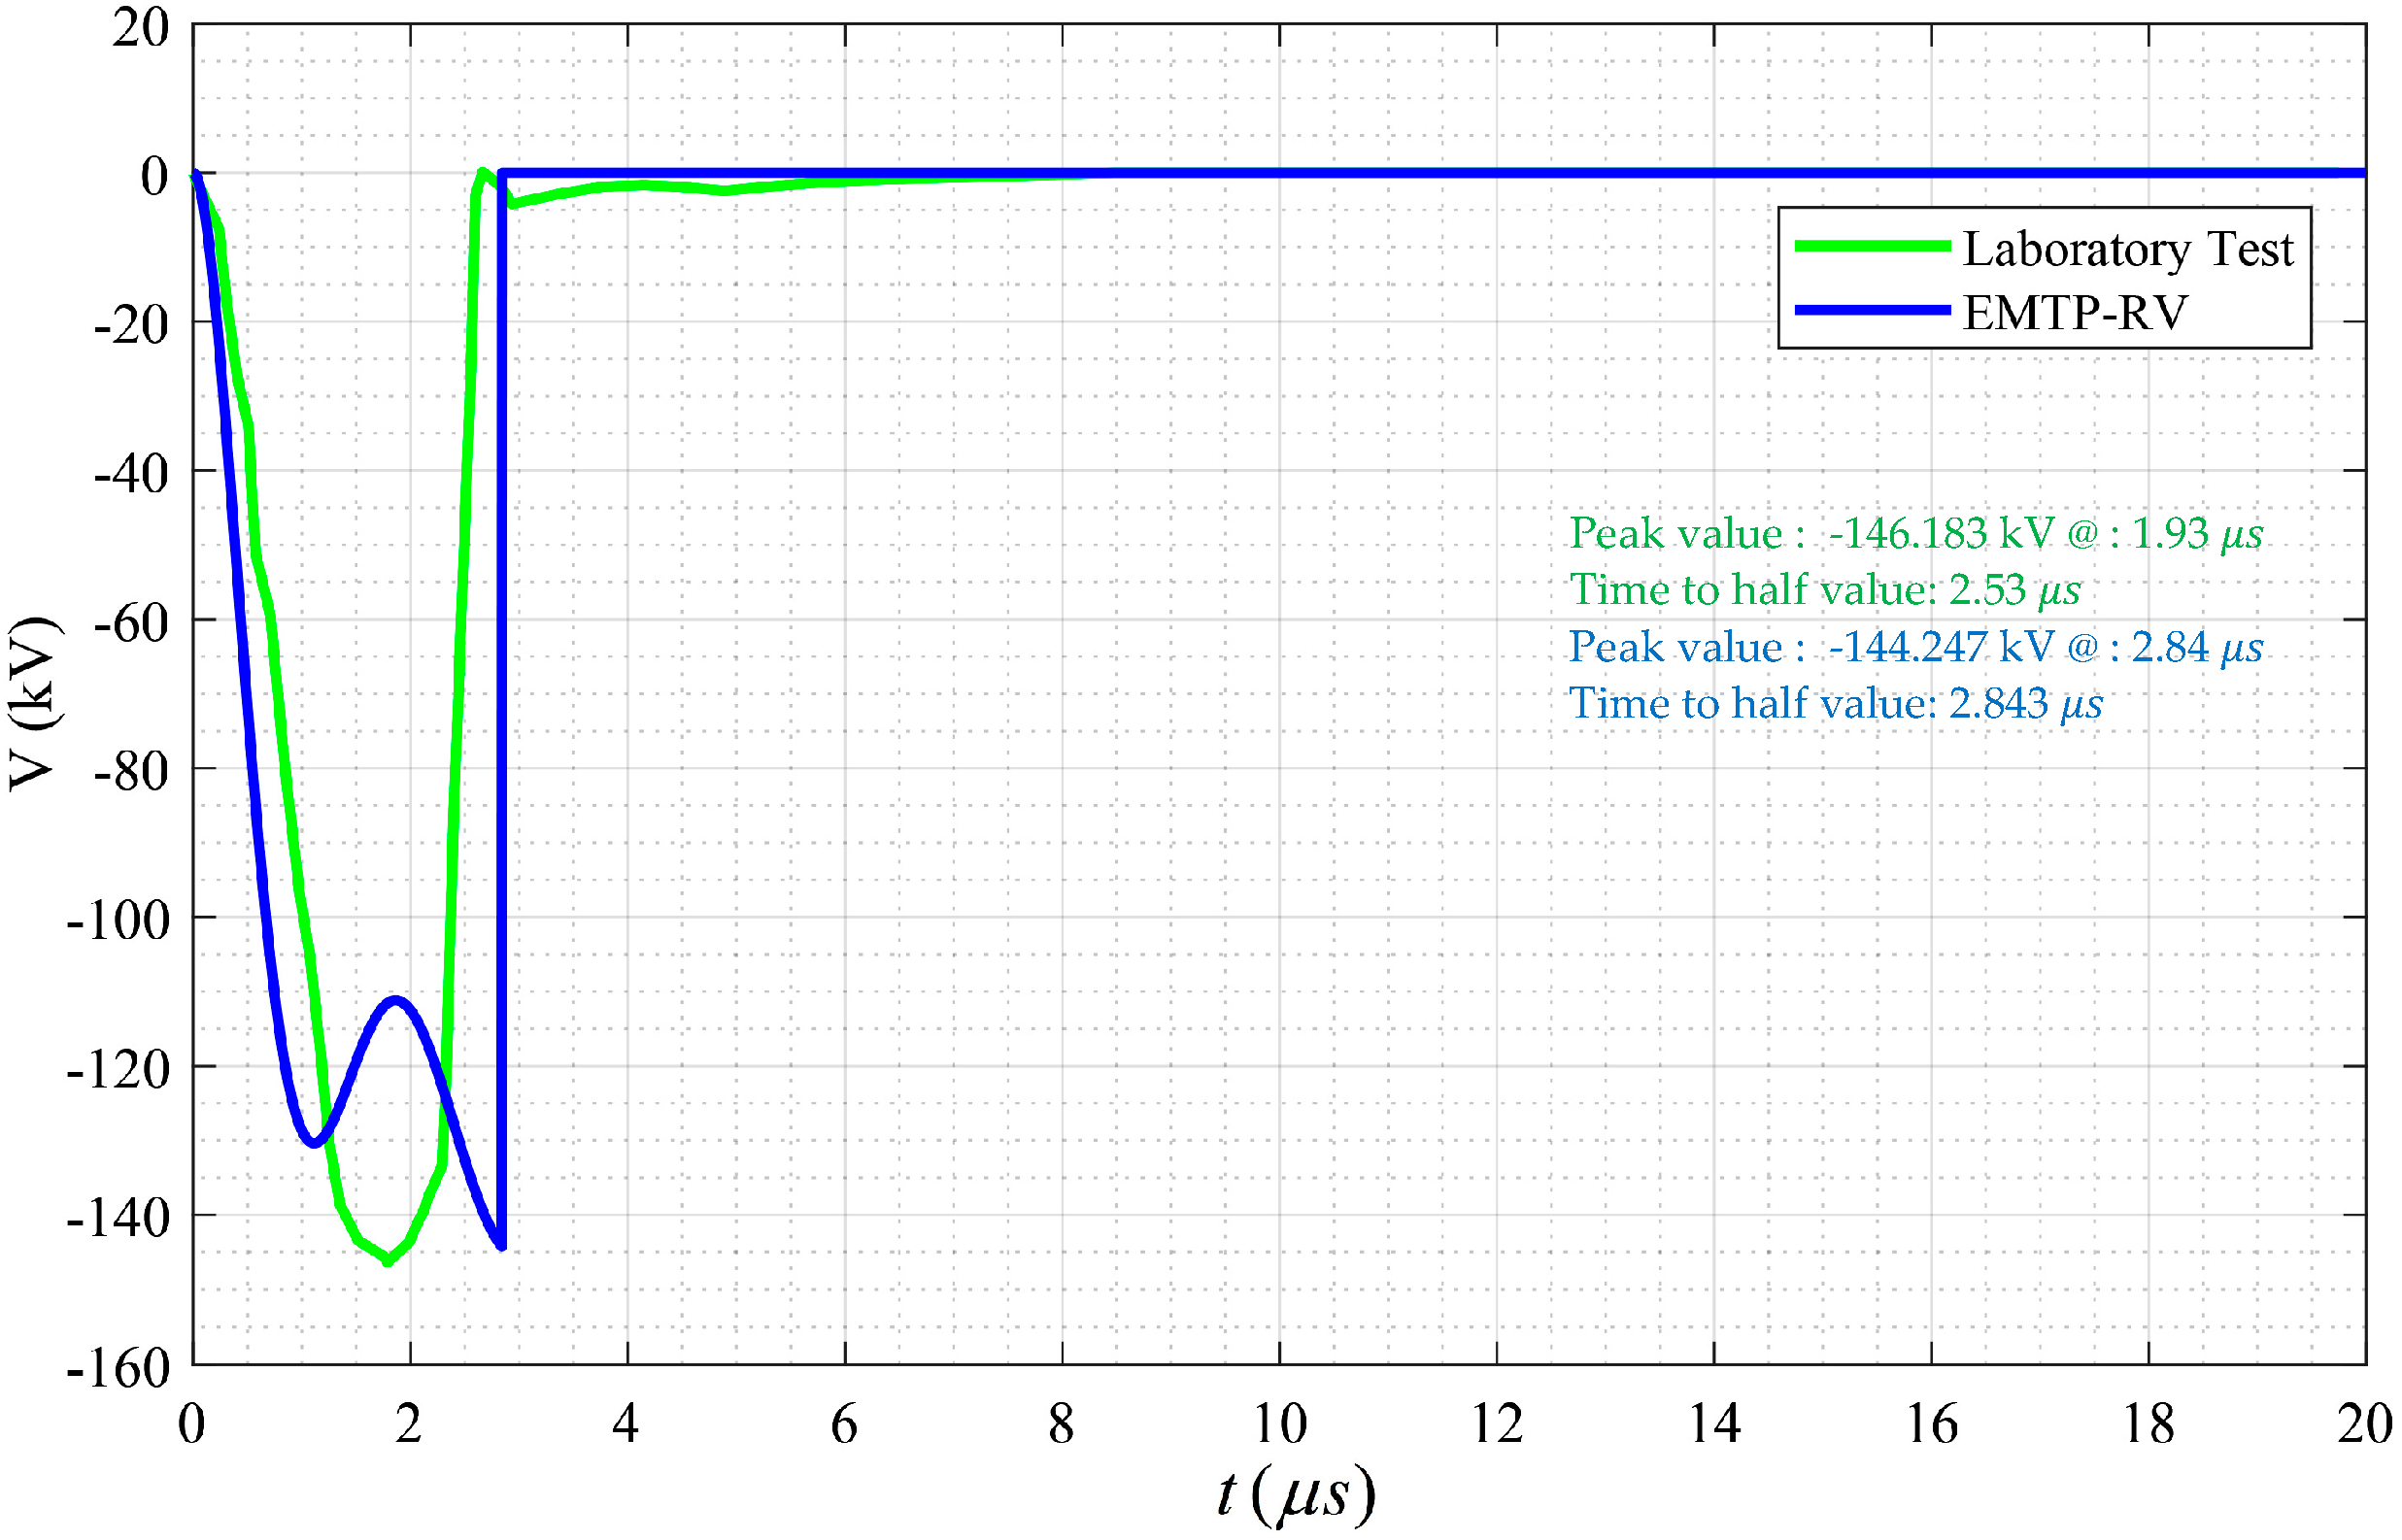
3.2. Test 2) Applying 110 kV and 125 kV Impulses in the Presence of the Proposed Filtered Spark Gap

This case investigated the effects of the proposed filtered spark gap on the protection level of the transformer under overvoltage conditions. Inductors with different sizes such as 35   μ H and 119 μ H were placed before the spark gap, and the simulations results of the EMTP-RV software were compared with the laboratory tests.
Figure 13 shows the results of the laboratory test and the software simulation after considering a 35   μ H filtered spark gap under the 110 kV applied impulse voltage. By comparing the green and blue curves in this figure, it can be seen that the difference between the peak voltage of the software simulation with the laboratory test is only about 0.91%. To reveal the effects of the 35   μ H filtered spark gap, a comparison between Figure 13 with Figure 11 is performed. The results show that by installing the 35   μ H inductor, the amplitude of the overvoltages, at point B in Figure 9, increased by about 0.32% for the laboratory tests and 2.2% for the EMTP-RV simulations. Therefore, installing the 35   μ H inductor resulted in increasing the applied voltage and did not help in reducing the amplitude of overvoltage induced by lightning.
Figure 14 shows the effects of installing a 119   μ H inductor on the protection level of the transformer. Comparing this figure with the case without considering any inductor, Figure 11, shows a considerable increase in the amplitude of overvoltage by about 13.5% and 17% for the laboratory test and software simulation, respectively. As can be seen, the voltage increase was much higher than the case with the 35   μ H inductor, in Figure 13. The important thing is that the difference between the amplitudes of the overvoltages for the laboratory test and the software simulation was about 2.1%, while the differences between the front time and time-to-half values of these cases were negligible, 0.750 μ s and 0.678 μ s , respectively. Therefore, it can be deduced that considering the 119   μ H filtered spark gap resulted in a huge increase in the amplitude of the lightning overvoltage and did not provide any support in reducing the tension over the spark gap.
At this stage, the effects of the filtered spark gap on the 125 kV applied voltage was considered. Figure 15 presents the results of the experimental laboratory test as well as the EMTP-RV model for a transformer protected by a 35   μ H filtered spark gap under a 125 kV impulse. As can be seen from this figure, for the laboratory test, the flashover of the spark gap occurred at about 123.4 kV with a time-to-half value of 1.672 μ s . Comparing the laboratory results of this figure and Figure 12, which stands for the case without any filter, shows that the 35   μ H inductor caused an increase of about 1.5% in the peak value in which the spark gap started to flashover. Moreover, comparing the simulation results of EMTP-RV in Figure 15 and Figure 12 confirmed the same situation in which by installing a 35   μ H inductor, an increase in the flashover voltage occurred on the spark gap. On the other hand, a comparison between two curves in Figure 15 revealed a negligible difference of about 0.9% between the laboratory test and the software simulation. Comparing this case with the similar case but under 110 kV impulse voltage shows that although in both cases the inductor resulted in increasing the applied voltage, the 125 kV applied impulse activated the spark gap to protect the transformer against the dangerous condition. This case revealed that considering the 35   μ H filtered spark gap under the 125 kV applied voltage may endanger the healthy operating condition of the transformer by increasing the amplitude of the impulse voltage on the high voltage terminal of the transformer.
In Figure 16, the green line presents the experimental laboratory test of the 119   μ H filtered spark gap under 125 kV impulse voltage. In this case, the flashover of the spark gap occurred at a voltage around 146 kV, while for the case with a 35   μ H inductor, in Figure 15, the flashover took place at around 123 kV. This shows that the utilized inductors did not mitigate the overvoltages and, the bigger the inductor is, the higher the amplitude of overvoltage across the spark gap becomes. However, this requires more investigations that will be conducted in Section 4. Moreover, a comparison between the laboratory results in the presence of the 119   μ H filtered spark gap, in Figure 16, and the case without any inductor, in Figure 12, shows that this inductor resulted in an increase of about 20% in the flashover voltage, which confirms the ineffectiveness of installing large inductors in reducing the amplitude of lightning overvoltages. Moreover, comparing the simulation results in Figure 16 and Figure 12, for similar situations, confirms that like the experimental case, by installing a 119   μ H inductor, the overvoltage amplitude shows an increase, by about 16.7%. It is noteworthy to mention that although the patterns of the overvoltage curves for the laboratory test and software simulation were different for this very short period of time, the difference between the flashover times was quite acceptable, only about 0.9 μ s .
Similarly, comparing this case with the 119 μ H filtered spark gap under the 110 kV impulse voltage shows that in both cases, considering the inductor resulted in increasing the applied voltage much higher than the applied voltage. The considerable difference was that under the 125 kV applied impulse, the spark gap reached its withstand voltage and protected the transformer against high voltage impulses.

4. Case Studies

In Section 3, the model simulated in EMTP-RV was validated by comparing its results with the experimental laboratory outcomes. In this section, this model was used for further analysis of the proposed filtered spark gap and to recognize whether it is useful for enhancing the protection level of the transformer or not. First, two extreme cases with very large and very small inductors were studied. Then a sensitivity analysis was carried out to show the degree of effectiveness of the proposed filtered spark gap device in protecting distribution transformers and mainly finding the effective range for the size of the inductor. It is noteworthy to mention that to reproduce the simulation results as close as possible to the practical situation, the frequency dependency characteristics of the devices such as transformer, inductor, and even the resistors should be taken into account, which requires an appropriate estimation of the transformer’s parameters by knowing its internal formation, the inter-turn (or parasitic) capacitances of inductors, and analyzing the degree of frequency dependency of the resistors.

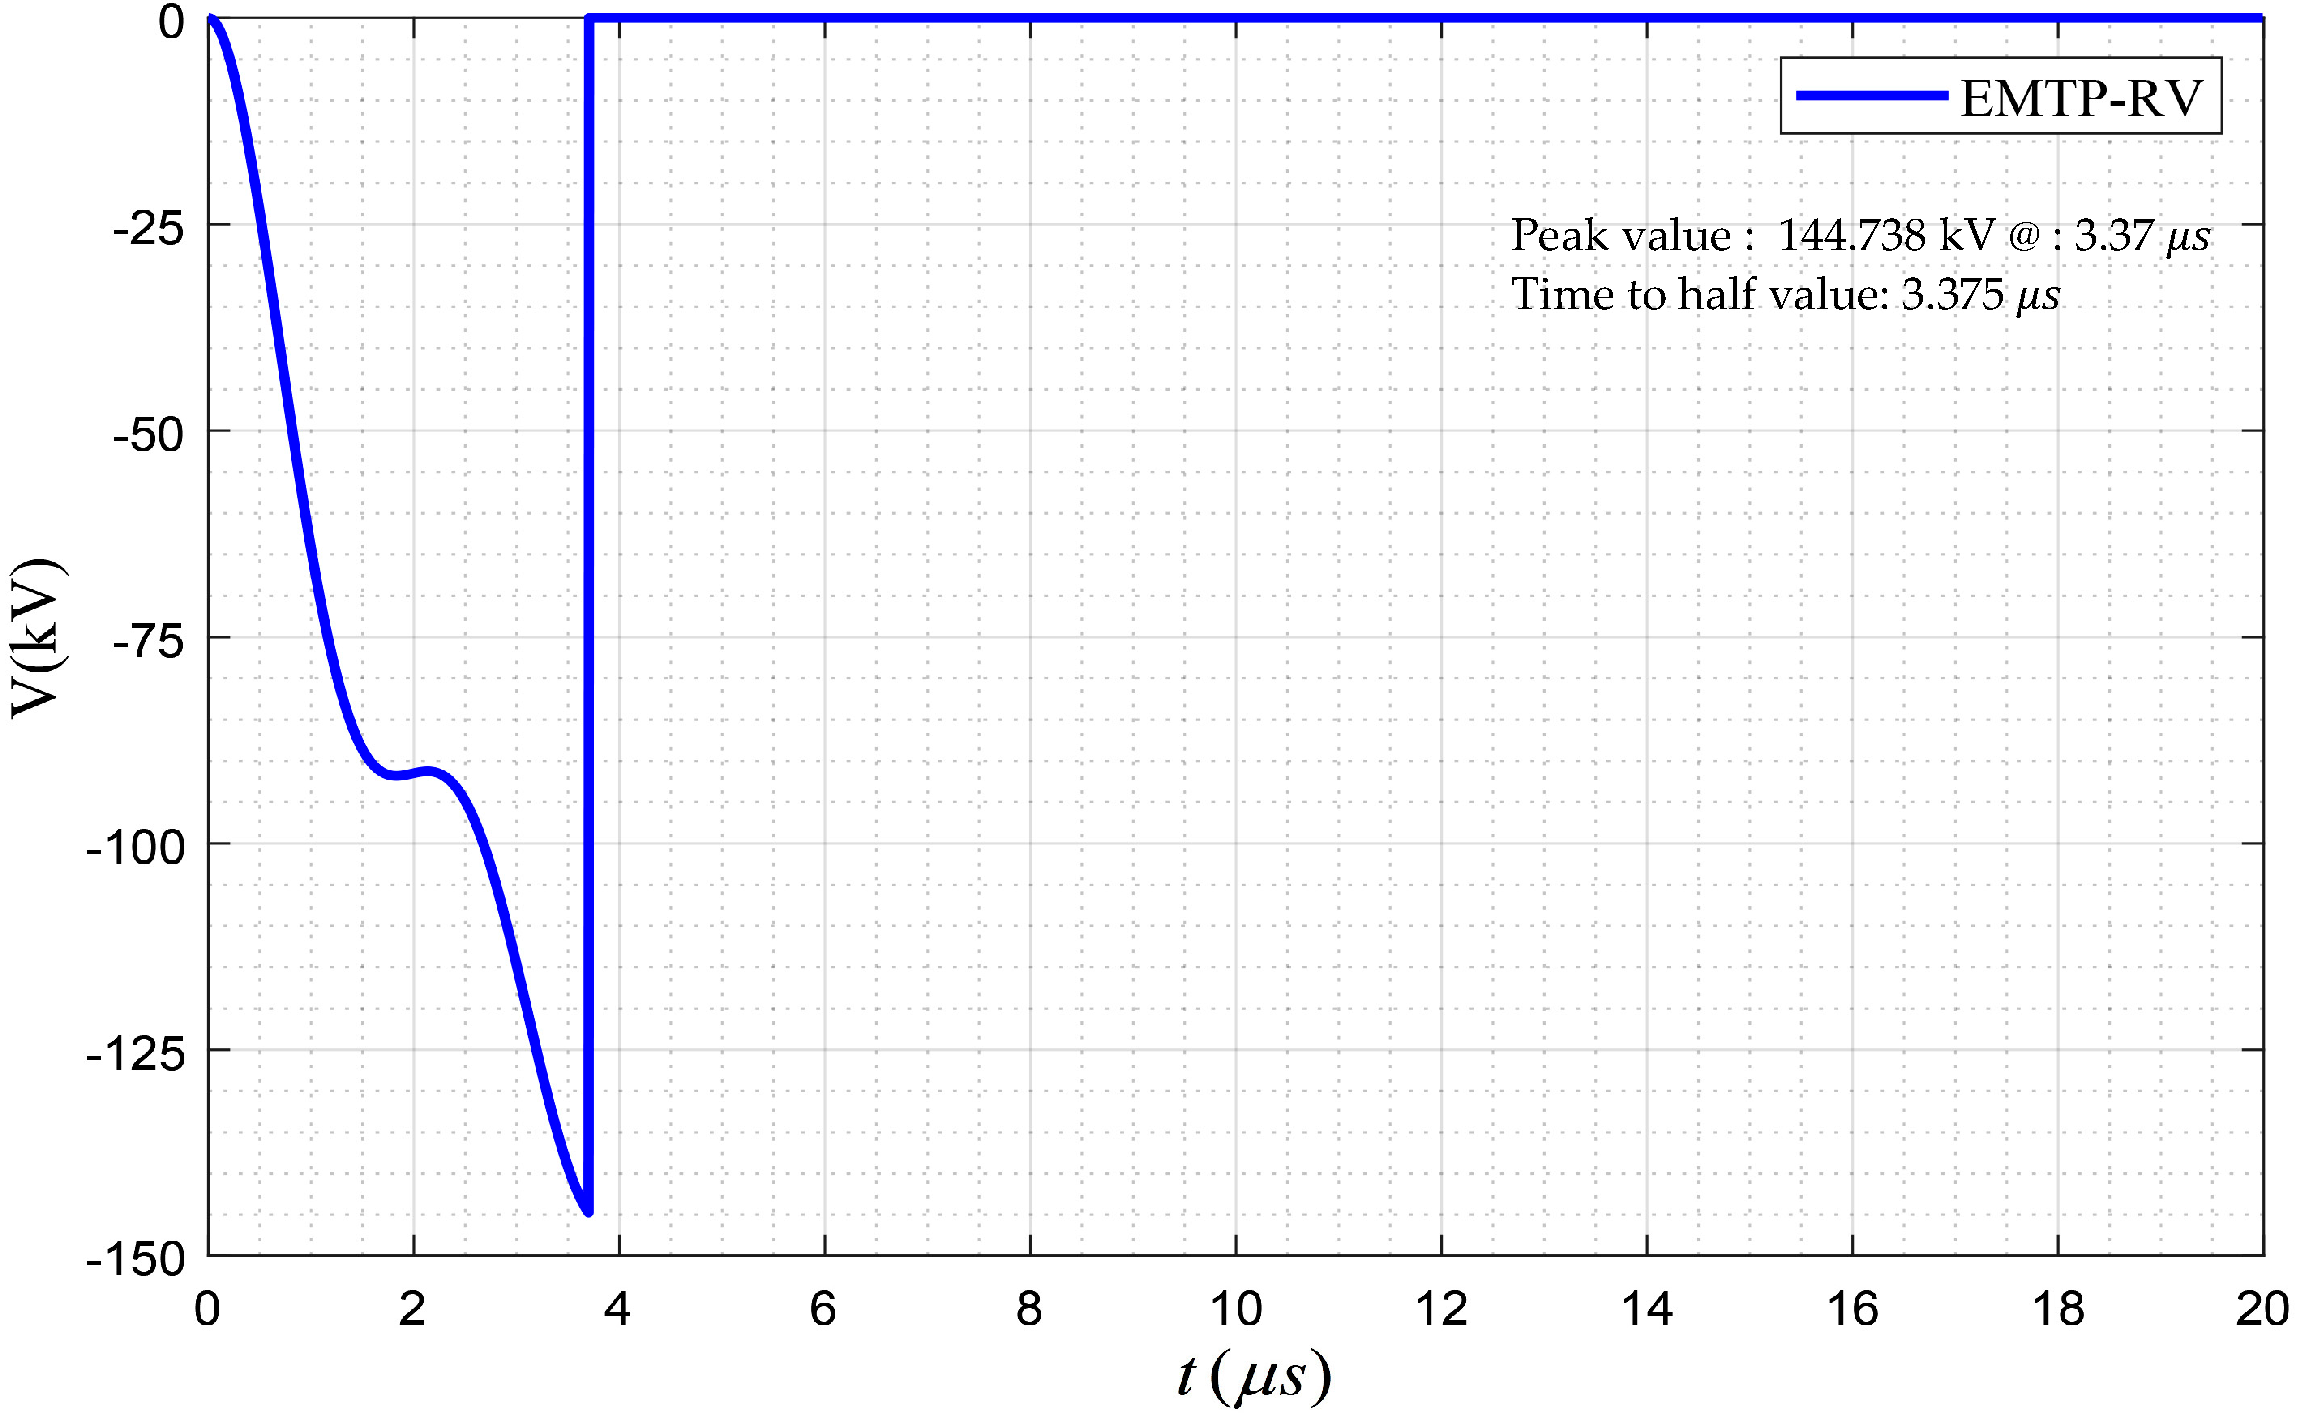
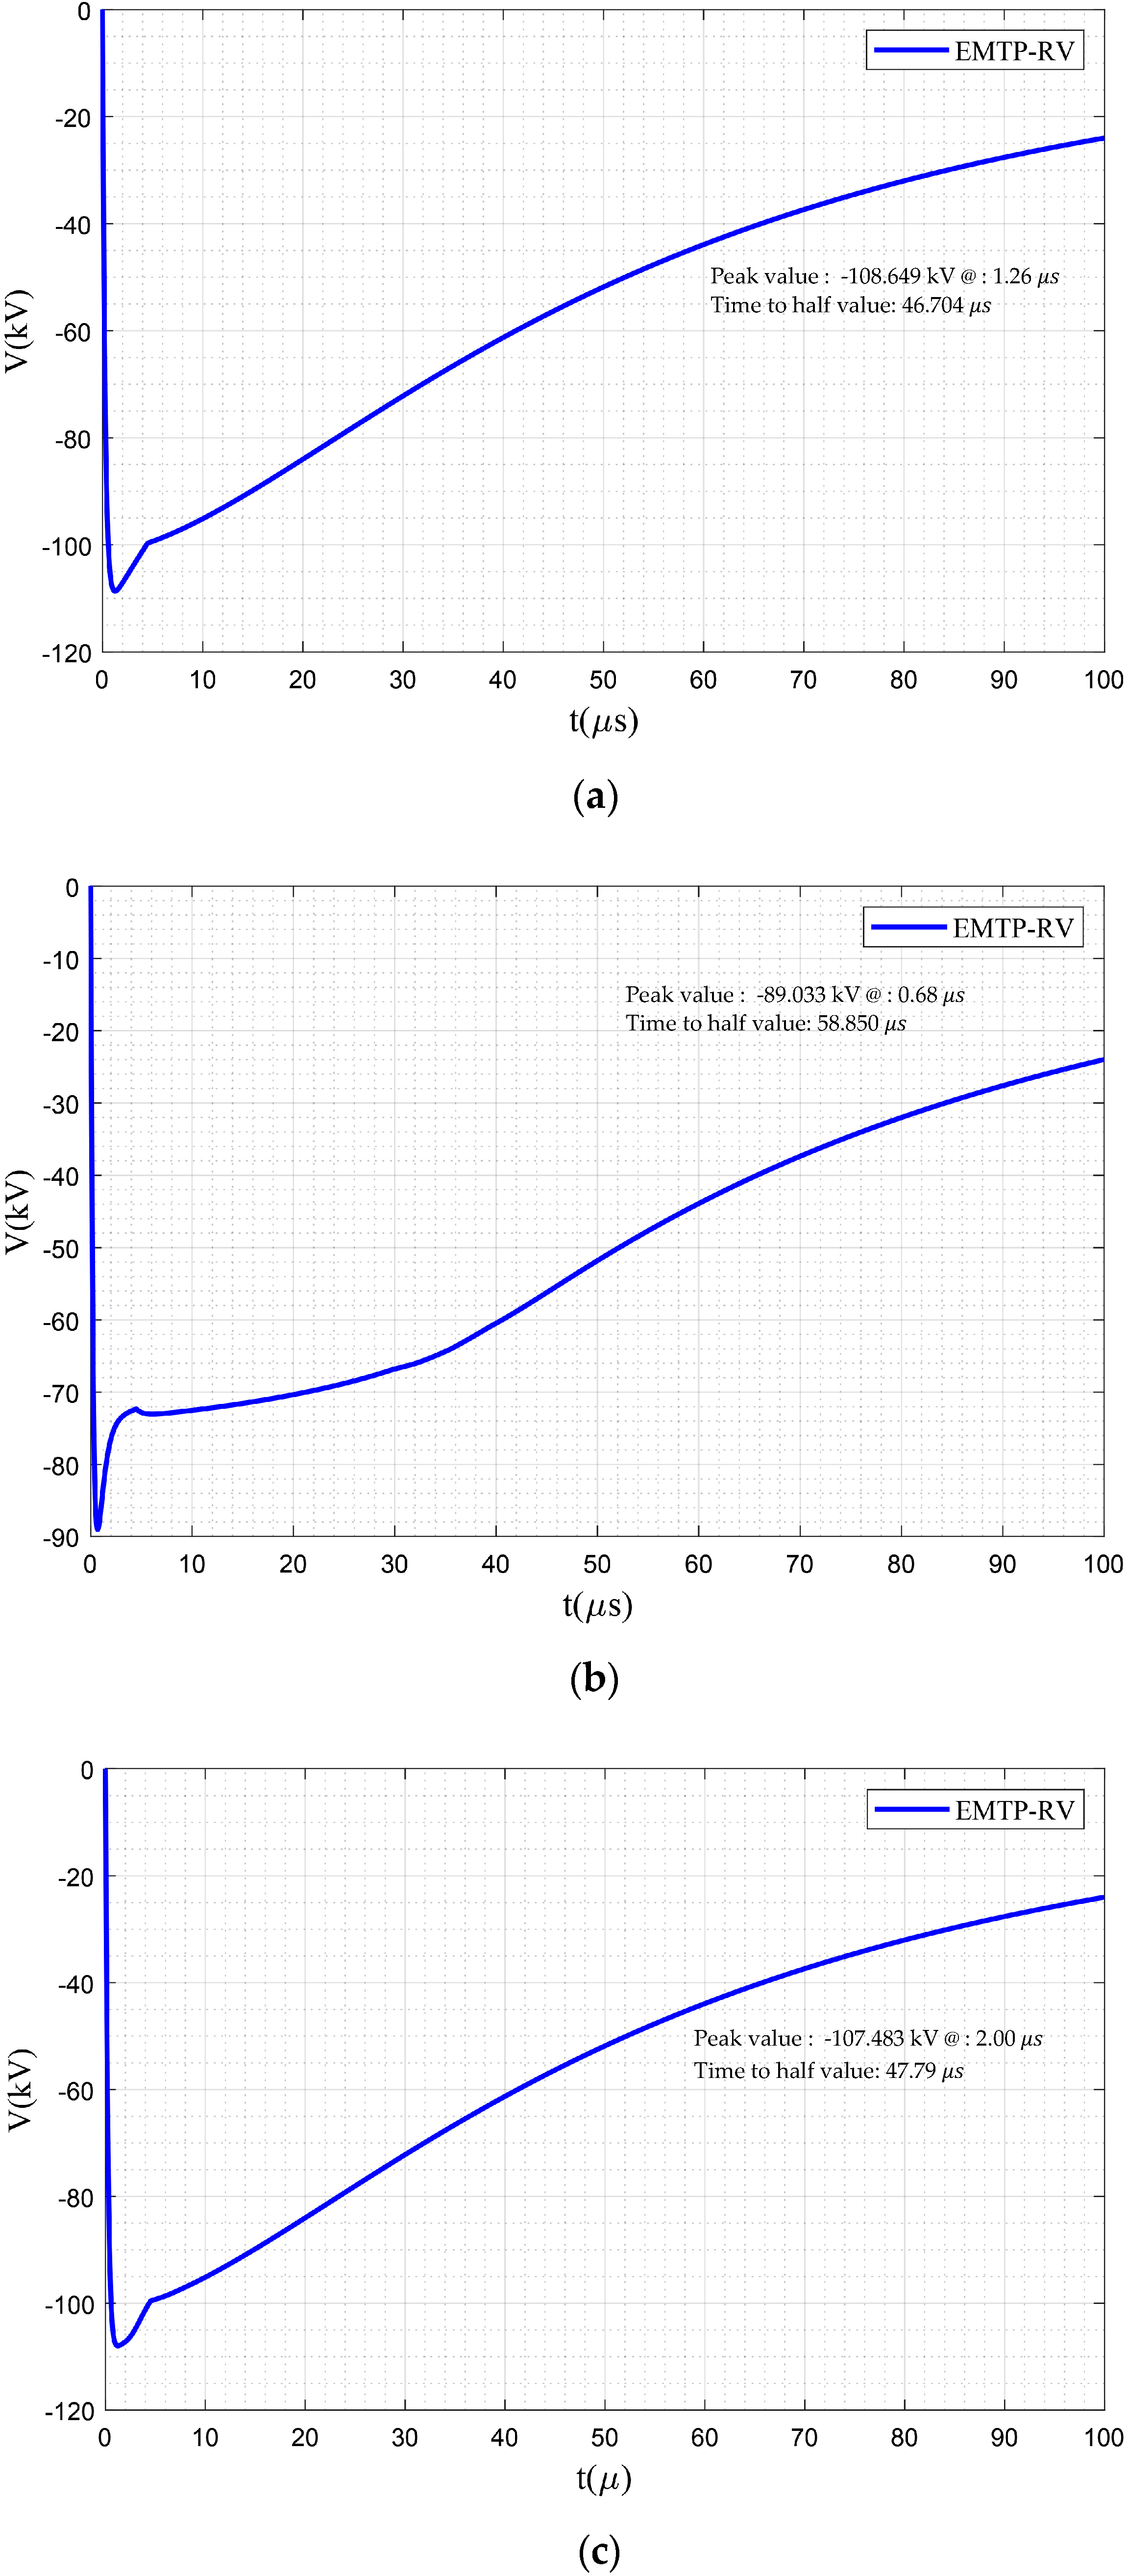
4.1. Case 1) Applying 110 kV and 125 kV Impulses in the Presence of the Filtered Spark Gap with Large and Small Inductors

This case was used as the base case to define the effective range for the sensitivity analysis. To this end, a large and a small inductors were considered. In this subsection, a large inductor stands for an inductor that is at least four times larger than the largest inductor utilized in the laboratory tests. Therefore, a 500 μ H inductor was used to investigate the effects of large inductors on the protection level of the transformer. On the other hand, the small inductor was considered to be at least four times smaller than the smallest inductor utilized in the laboratory test, which was set to 5   μ H .
Figure 17 and Figure 18 present the measured voltage in the presence of the filtered spark gap with 500 μ H under applied impulse 110 kV and 125 kV, respectively. Comparing Figure 17 with Figure 14, which stands for the filtered spark gap with 119 μ H under 110 kV applied impulse, shows that increasing the inductance results in increasing the voltage stress of the spark gap such that the flashover occurred at 144.738 kV. The same situation was observed for the 125 kV applied impulse voltage where with a 500 μ H inductor, the flashover occurred at 151.727 kV, which was higher than the case with a 119 μ H inductor.
Figure 19 and Figure 20 show that contrary to the case with a large inductor, the small inductor had reduced the applied impulse voltages 110 kV and 125 kV by 228 V and 268 V, respectively.
The main reason for such increases and decreases in the voltage amplitude might be the intercorrelation between the inductor-based filter and the internal circuit of the transformer. The appropriate size of the filter was investigated in the following case study and via sensitivity analysis. It is noteworthy to mention that for obtaining more reliable and precise results, the internal circuit of the transformer needs to be modeled appropriately and validated via a frequency response analysis.

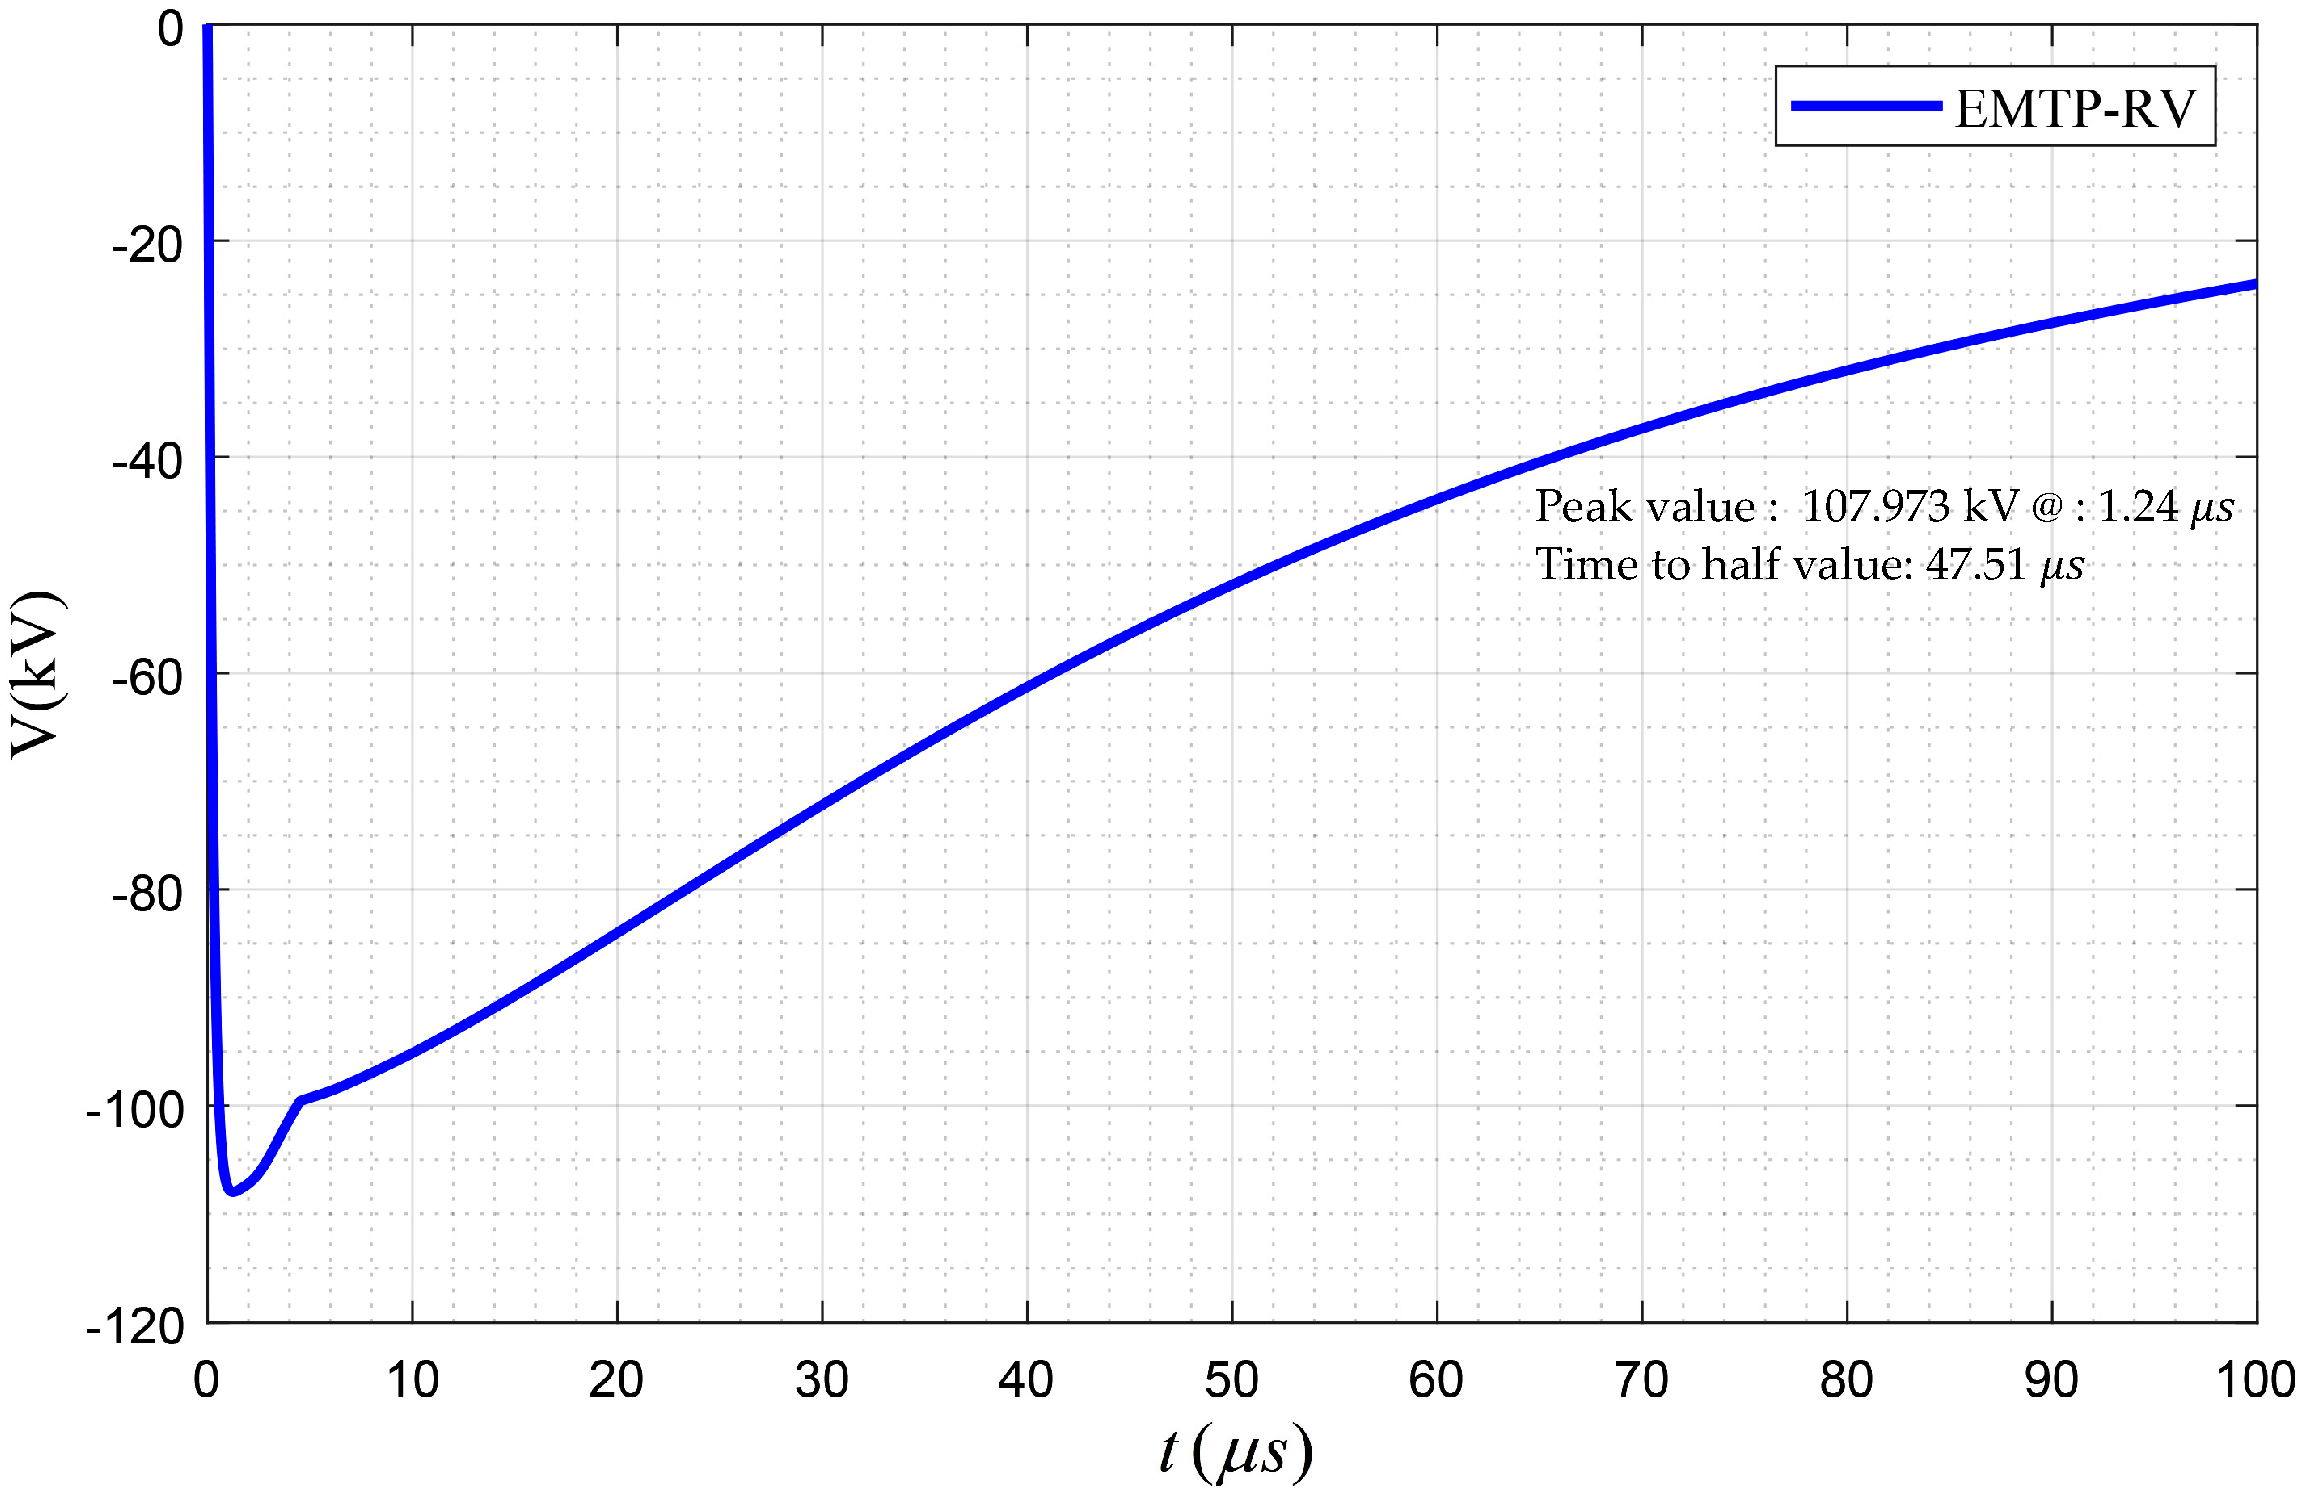
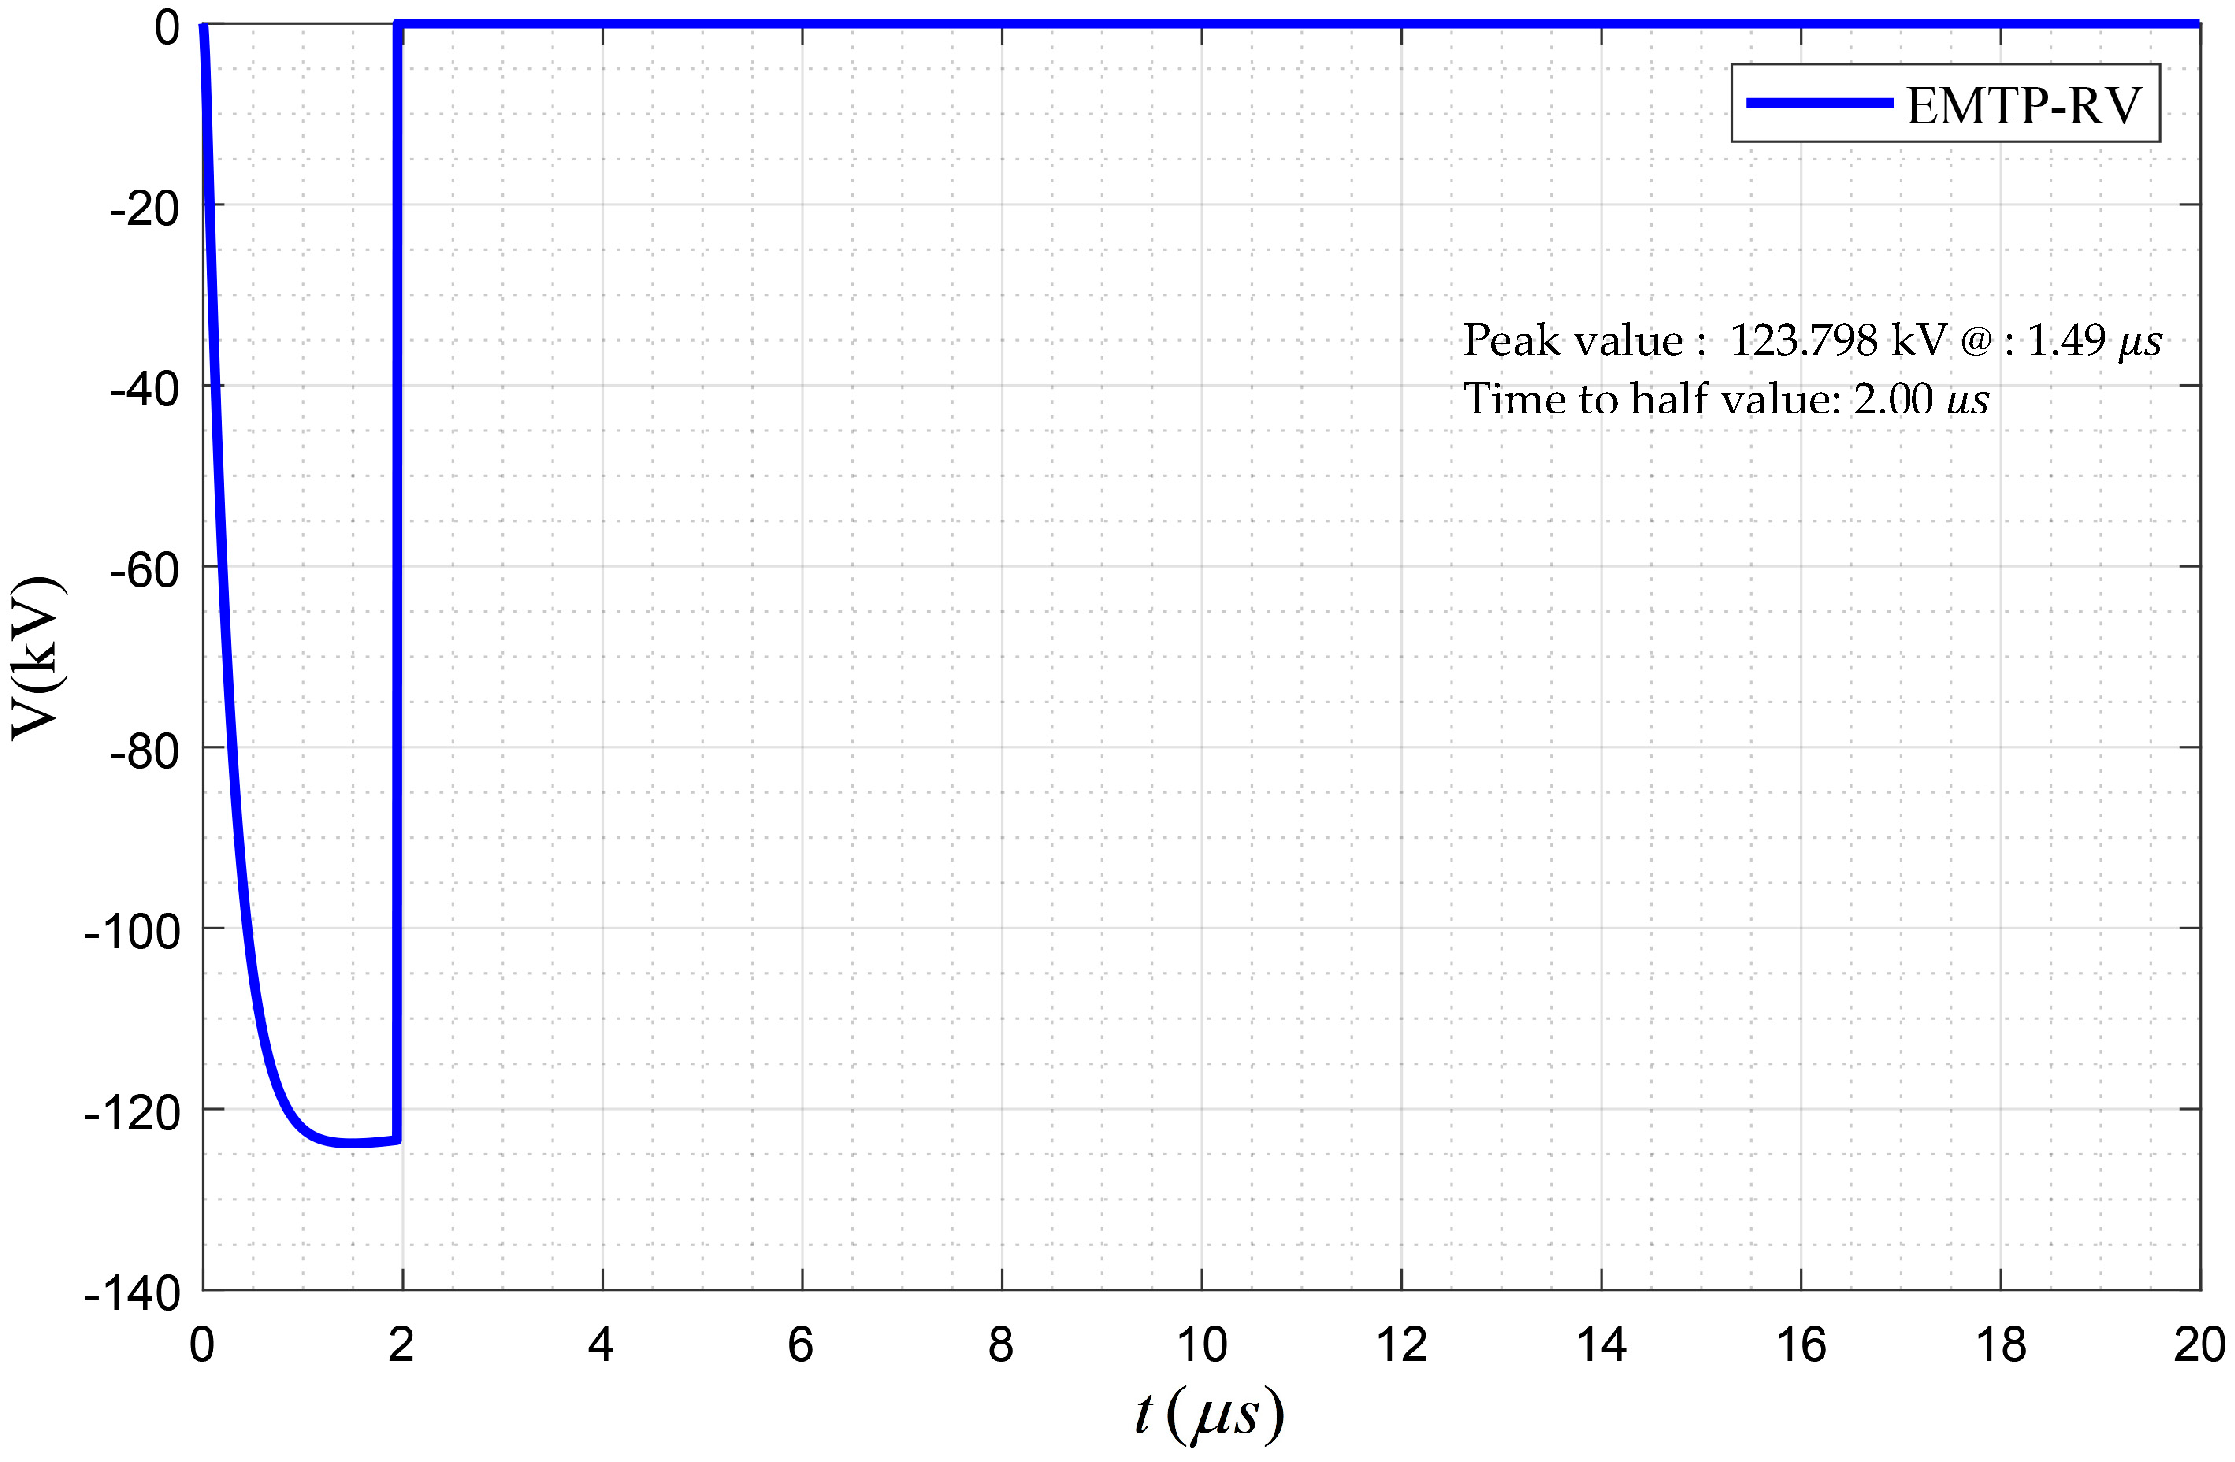
4.2. Case 2) Sensitivity Analysis over the Inductor Size Under 110 kV and 125 kV Impulses in the Presence of the Filtered Spark Gap

In this case, the sensitivity analysis was conducted over the inductor size. Since, according to the laboratory test and simulation results, the inductors above 35 μ H failed to decrease the overvoltage amplitude over the spark gap, in the sensitivity analysis, only the sizes below 35 μ H were considered. The inductance was decreased stepwise with the step of 5 μ H .
Table 1 presents the results of utilizing different sizes of filters under the 110 kV applied overvoltage impulse. Comparing the results of the 30 μ H and the 35 μ H filtered spark gap filter, Figure 13, shows that by using the 30 μ H filter, the amplitude of overvoltage decreased by about 0.84 kV, however, this voltage was still 1.57 kV higher than the applied overvoltage impulse, see Figure 11. This revealed that still the 30 μ H filter was worsening the situation. Considering all the results in Table 1 shows that by reducing the size of inductors from 30 to 10 μ H with step 5 μ H , the voltage level was reduced where for the case with the 20 μ H filter, it reached to the level of the applied impulse, and after that, it started decreasing below the applied impulse. Within these filter sizes, the best result obtained by installing the 10 μ H filtered spark gap. Contrarily, by reducing the size of the filter from 10 to 5 μ H , the amplitude of the overvoltage shows an increase, although, it did not go above the applied impulse. Therefore, the effectiveness of the filter spark gap for the 110 kV applied impulse started when the inductor size was below 20 μ H . Moreover, by comparing the front times in this table with the reproduced 110 kV applied impulse, Figure 11, it could be observed that by using the optimal filter size (10 μ H ) as well as the filters larger than the optimal size, the steepness of the overvoltage was reduced.
Table 2 presents the effects of different sizes of filter on the amplitude of the 125 kV applied overvoltage impulse. The results in this table reveal that for all sizes of filters, the overvoltage amplitude is below the applied impulse, 124.50 kV (see Figure 6). Note that in this case, the amplitude of the overvoltage over the spark gap by utilizing the 35 μ H filter decreases to 124.48 kV (see Figure 15), which is already below the applied impulse. This shows that unlike the case with 110 kV applied impulse in which the effectiveness of the protection device started by utilizing filter sizes bellow 20 μ H inductor, in this case, the effectiveness starts by considering filter sizes below 35 μ H , i.e., a wider range of inductor is applicable to reduce the amplitude of the lightning overvoltages. Similar to the case with 110 kV applied impulse, in this case, reducing the size of the inductor enhances the voltage reduction, where with a 10 μ H inductor, it reaches to its minimum value, 123.60 kV, which is 0.9 kV lower than the applied impulse voltage. However, by reducing the size of the inductor from 10 μ H to 5 μ H , the amplitude of the overvoltage shows an increse of 0.198 kV. In addition, comparing the front times in Table 2 with reproduced 125 kV applied impulse in Figure 6 shows that the filtered spark gap has reduced the steepness of the overvoltage, even by installing the 5 μ H filtered spark gap.
The results presented in this section revealed that a proper design of a filtered spark gap could alleviate the overvoltage impulses and enhance the protection level of the transformer. The most important stage was determining the effective range of inductors to be installed. The optimal size of the inductor depends on the internal circuit of the transformer since the amplification or weakening of the overvoltage impulses on the transformer terminals can be explained by the intercorrelation between the filter coil and the transformer’s inductances, capacitances, and resistances.

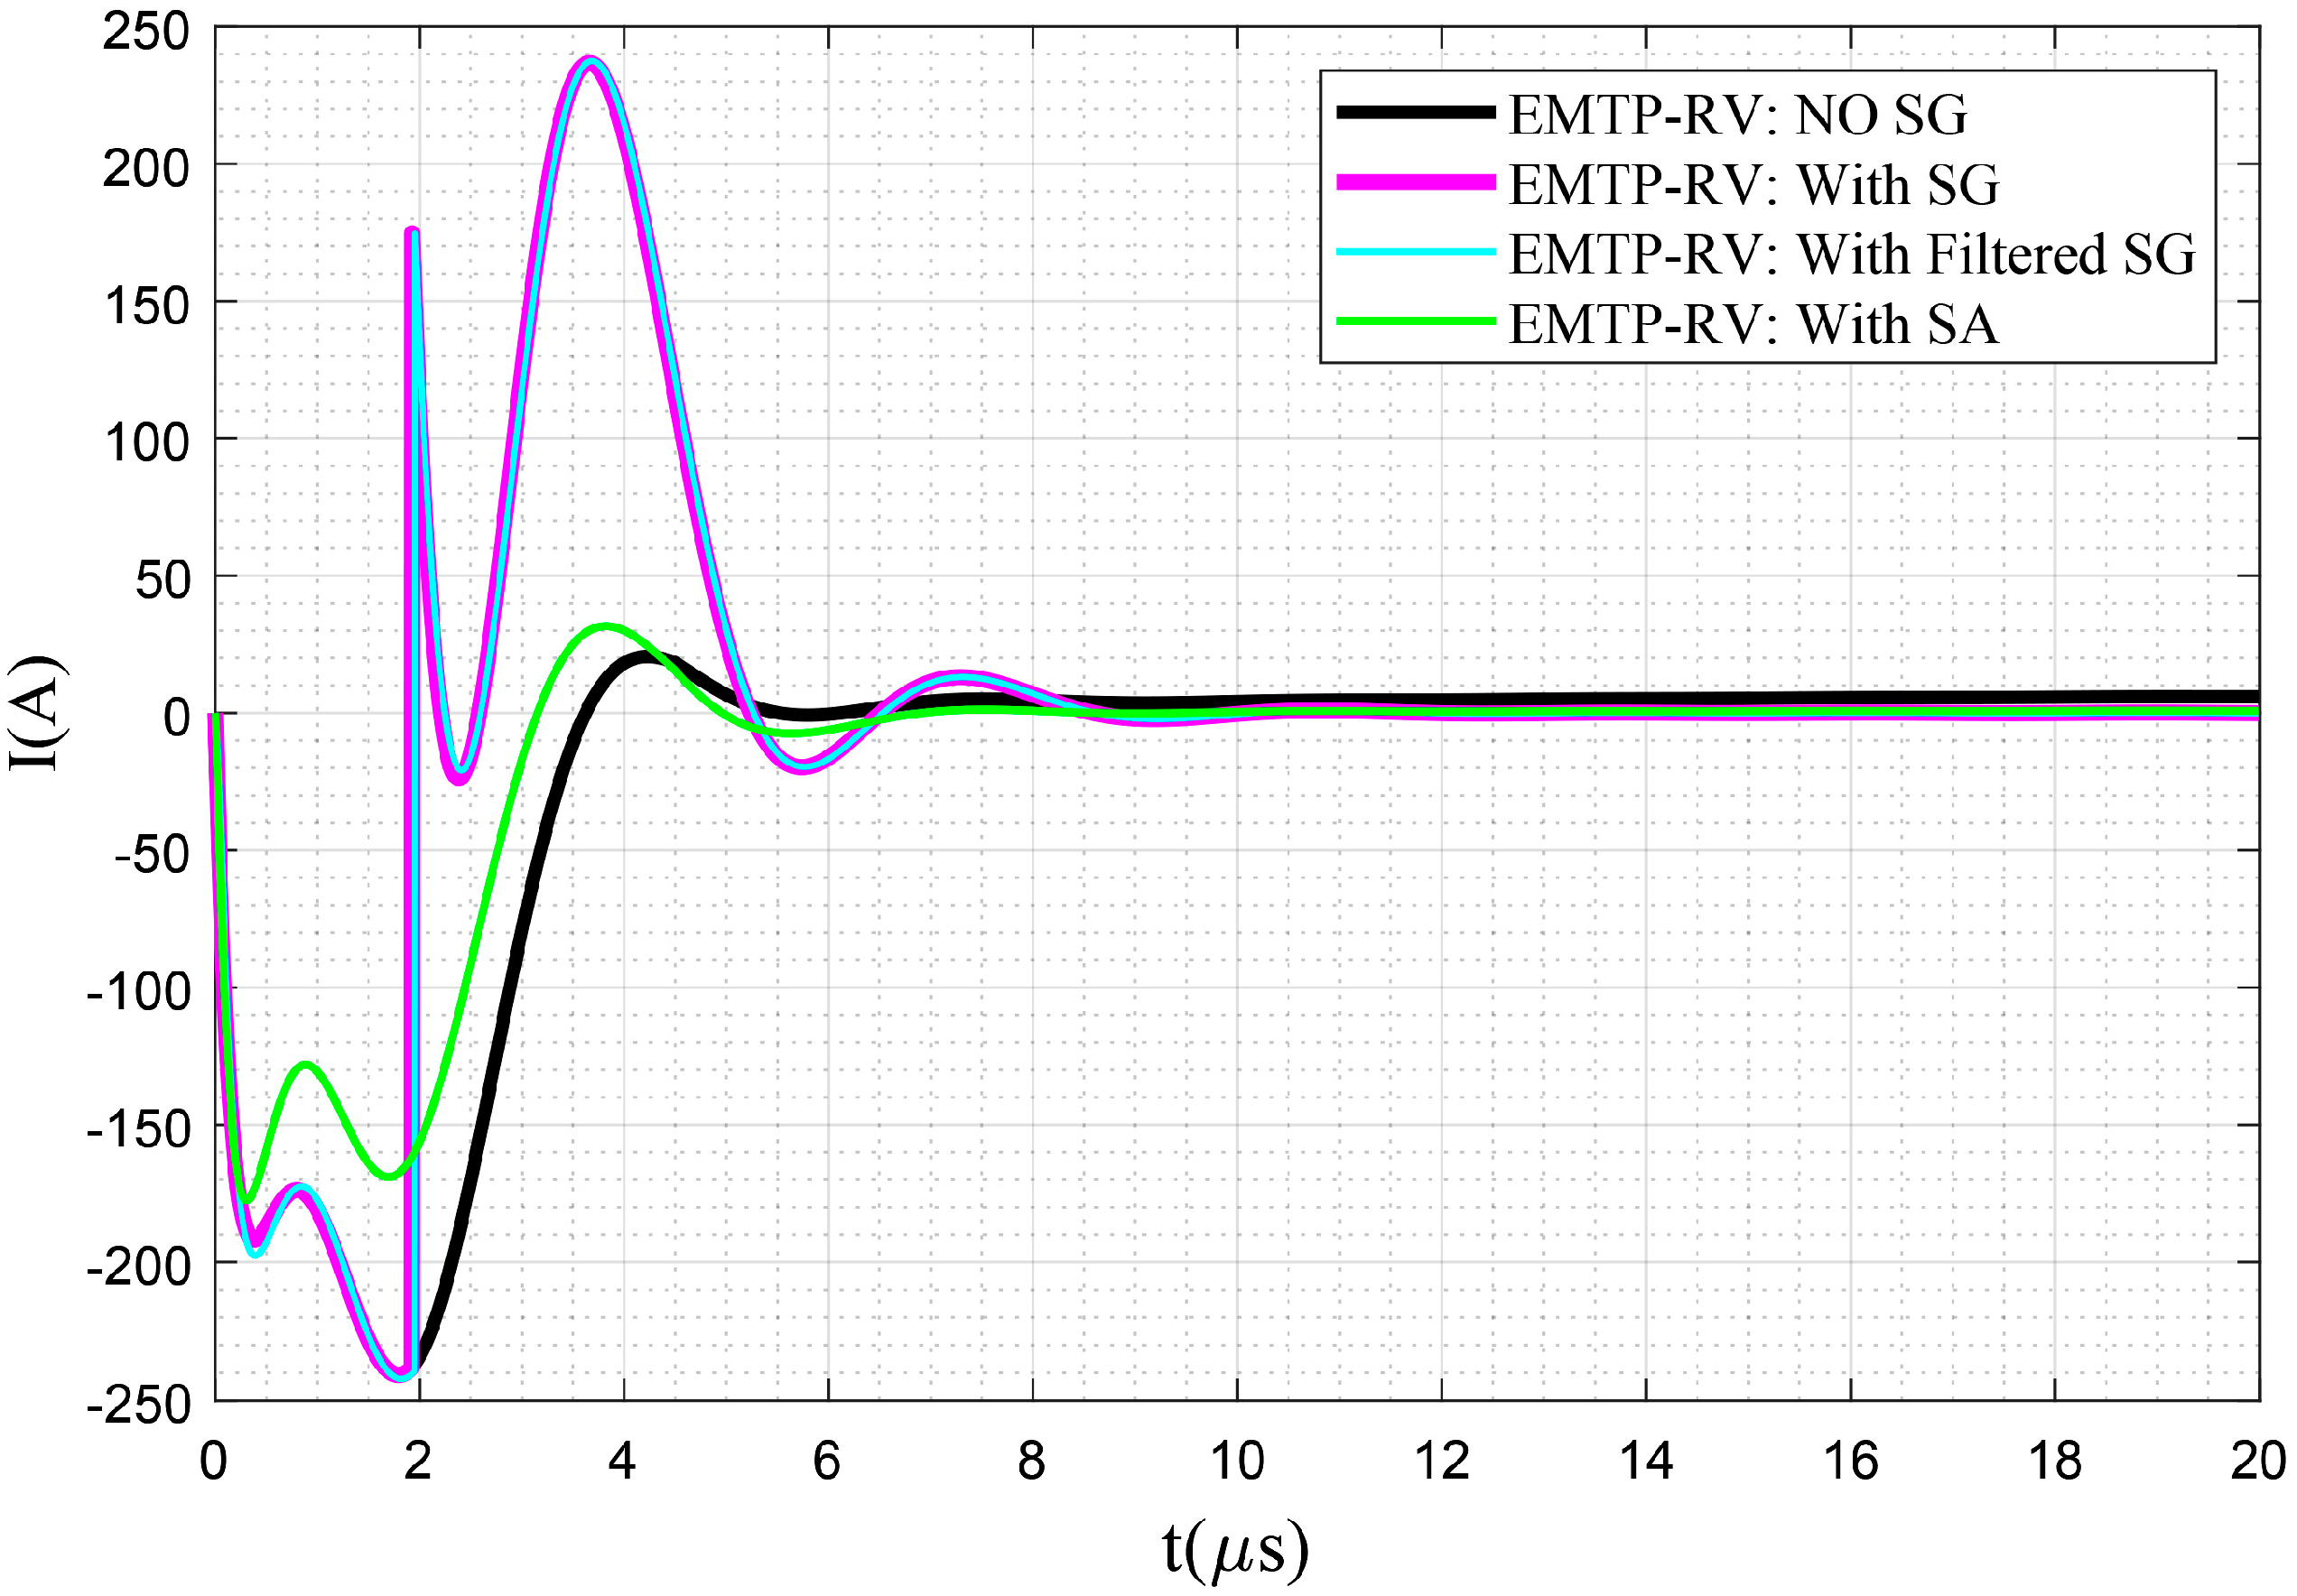
5. Comparisons and Discussion

This section performed a comparison among the proposed filtered spark gap, the conventional spark gap, and surge arrester. To do so, the voltage stress of these cases under different applied voltages, namely below and over the flashover voltage of the spark gap, was analyzed. The metal oxide surge arrester was modeled based on the guidelines provided by the IEEE Working Group 3.4.11, as Figure 21 [34] that simulates the frequency-dependent behavior of a surge arrester by using two nonlinear resistance Ao and A1, separated by an R–L filter. The information to simulate the 20 kV surge arrester was derived from [35], while the V–I characteristics of the nonlinear resistances were derived from [34]. The validity of the model was verified by performing a simulation-based test under 20 kA current impulse (8/20 μs) and comparing the results with laboratory tests provided in [35].
Figure 22 provides the results of a test of different protection devices such as the conventional spark gap, surge arrester, and the proposed filtered spark gap in subfigures (a), (b), and (c), respectively, under a 125 kV impulse, which is a voltage higher than the flashover voltage of the spark gap. Similarly, Figure 23 provides the results of testing these devices under 110 kV, which is a voltage under the flashover voltage of the spark gap. It is worth mentioning that the filter in Figure 22 and Figure 23 were set to 8 μH and 10 μH, respectively. As can be seen from both figures, it is obvious that the surge arrester in (b) shows a better performance compared to the other devices. However, it should be noted that the surge arrester is an expensive protection device and due to cost optimization, the conventional spark gap was widely used in the cases with small pole-mounted transformers to protect these devices against overvoltage situations but at the cost that the spark gap operation makes a temporary outage in the whole feeder. Therefore, any inexpensive solution to enhance the performance of the spark gap is welcome.
Comparing subfigures (c) with (a) in Figure 22 reveals that the proposed filtered spark gap resulted in a reduction of the voltage over the spark gap by about 1 kV, while for the case with applied voltage under the flashover voltage of the spark gap, in Figure 23, the reduction was about 1.2 kV. The key point in using the filtered spark gap is to increase the induced voltage level needed for spark gap operation, thus reducing the number of outages due to the spark gap flashovers. Our assumption was that even though the voltage difference is small, it still leads to a noticeable reduction in the number of outages due to induced lightning overvoltages.
In order to investigate more deeply the effects of the proposed filtered spark gap, some analyses on the current flows were performed. The currents were measured before and after the connection points of the spark gap and surge arrester.
Figure 24 presents the effects of the protection devices on the current flow due to induced lightning overvoltages. As expected, the winner among the presented devices was the surge arrester, which kept the current amplitude lower than the other cases. The conventional spark gap and the proposed filtered spark gap performed almost the same. At the spike moment, the proposed device worked negligibly better; the current amplitude was about 1 A lower than the case with the conventional spark gap. The effects of these devices on the current flow before their connection point (point B in Figure 9) might provide more information on their performance.
Figure 25 presents a comparison among the current flows of spark gap, filtered spark gap, and surge arrester before connection B (see Figure 9). Note that (1) the scale for this figure is in kA, while the scale of Figure 24 was in A, and (2) the current flow for the case without SG is similar to the curve presented in Figure 24, therefore, it is not presented in Figure 25. Similar to the previous case, the best performance belongs to surge arresters. However, between the spark gap and filtered spark gap, the latter one shows much better performance by smoothening the current waveforms and reducing its amplitude before the spark gap. A deep understanding of the performances of these devices requires investigation on the inter-correlation of the inductor-based filter and the internal circuit of the transformer.

6. Conclusions

In this paper, a filtered spark gap was proposed, and its effect on enhancing the protection level of the transformers against lightning overvoltage impulses was considered. To do so, an inductor, as a filter, was placed before the spark gap. The proposed device was tested under different conditions in a laboratory, and the obtained results were used to validate the simulated model in the EMTP-RV software environment. In order to design a model as close as possible to the laboratory test, optimization and trial and error techniques were used. Results show that utilizing a filtered spark gap with large inductors deteriorated the protection level by increasing the level of the applied overvoltage impulse across the spark gap. However, within the effective range of the inductor size, the filtered spark gap positively affected the protection level by decreasing the peak voltage over the spark gap.
The comparison shows that although the performance of the proposed filtered spark gap was not better than an expensive protection device such as surge arrester, it decreased the induced voltage amplitude over the spark gap. Moreover, results revealed that the optimal inductor size, in the filtered spark gap, reduced the steepness of the overvoltage. Therefore, in general, placing the filtered spark gap may result in reducing the number of spark gap flashovers and thus outages. This number is system and area-specific and is the subject of further research, however. Moreover, finding the optimum size of the filter coil for decreasing the tension over the transformer is highly dependent on the intercorrelation of the internal circuit of a transformer and the size of the inductor-based filter. However, this requires modeling the transformer more precisely and verifying the models via frequency analysis, which is the prospect of future works.
Future works will study the frequency dependency characteristics of the devices such as the transformer, inductor, and even the resistors to verify the correlation between the filtered spark gap and the internal circuit of the transformer. To this end, the inter-turn (or parasitic) capacitances of the inductor are modeled, the internal formation of the transformer is estimated, and the degree of frequency dependency of the resistors is also investigated. This way, the disruptive effects of lightning on both the filter as well as the internal circuit of the transformer can be investigated.

Author Contributions

M.P.-K. performed the simulations and prepared the original research draft. F.M. provided the support in parameter adjustments of some analytical models. M.K., L.P., J.O., and P.T. conducted the laboratory test and analysis. M.L. proposed the main idea and supervised the work. All authors have read and agreed to the published version of the manuscript.

Funding

This research was funded by Ministry of Education, Youth and Sports of the Czech Republic with support of the project LM2015092 And The APC was funded by Aalto University.

Acknowledgments

This research work has been carried out in the Centre for Research and Utilization of Renewable Energy (CVVOZE) in the research infrastructure CVVOZEPowerLab.

Conflicts of Interest

The authors declare no conflict of interest.

References

  1. Hou, M.; Gao, H.; Zhang, S.; Wang, F. Simulation study on lightning protection of distribution transformer with zinc oxide arrester. In Proceedings of the 2015 5th International Conference on Electric Utility Deregulation and Restructuring and Power Technologies (DRPT), Changsha, China, 26–29 November 2015; pp. 1763–1767. [Google Scholar]
  2. Furgał, J. Influence of Lightning Current Model on Simulations of Overvoltages in High Voltage Overhead Transmission Systems. Energies 2020, 13, 296. [Google Scholar] [CrossRef] [Green Version]
  3. Li, W.; Liu, L.; Sun, L.; Hu, J.; Wang, J.; Xie, Y. Analysis and countermeasures of the tilt of lightning rod in transformer substation. IOP Conf. Ser. Earth Environ. Sci. 2019, 358, 042073. [Google Scholar] [CrossRef]
  4. Piantini, A. Analysis of the effectiveness of shield wires in mitigating lightning-induced voltages on power distribution lines. Electr. Power Syst. Res. 2018, 159, 9–16. [Google Scholar] [CrossRef]
  5. Brignone, M.; Mestriner, D.; Procopio, R.; Piantini, A.; Rachidi, F. Evaluation of the Mitigation Effect of the Shield Wires on Lightning Induced Overvoltages in MV Distribution Systems Using Statistical Analysis. IEEE Trans. Electromagn. Compat. 2018, 60, 1400–1408. [Google Scholar] [CrossRef]
  6. Yokoyama, S. Designing Concept on Lightning Protection of Overhead Power Distribution Line. In Proceedings of the IX International Symposium on Lightning Protection, Foz do Iguaçu, Brazil, 26–30 November 2007; pp. 1–16. [Google Scholar]
  7. Araneo, R.; Andreotti, A.; Brandao Faria, J.A.; Celozzi, S.; Assante, D.; Verolino, L. Utilization of Underbuilt Shield Wires to Improve the Lightning Performance of Overhead Distribution Lines hit by Direct Strokes. IEEE Trans. Power Deliv. 2019. [Google Scholar] [CrossRef]
  8. Piantini, A. Lightning-induced voltages on distribution lines with shield wires. In Proceedings of the 2016 33rd International Conference on Lightning Protection (ICLP), Aveiro, Portugal, 25–30 September 2016; pp. 1–5. [Google Scholar]
  9. Florkowski, M.; Furgał, J.; Kuniewski, M. Propagation of Overvoltages in the Form of Impulse, Chopped and Oscillating Waveforms in Transformer Windings—Time and Frequency Domain Approach. Energies 2020, 13, 304. [Google Scholar] [CrossRef] [Green Version]
  10. AIEE Committee on Electrical Machinery—Transformer Subcommittee. Protection of Power Transformers Against Lighting Surges. Trans. Am. Inst. Electr. Eng. 1941, 60, 568–577. [Google Scholar] [CrossRef]
  11. Cigre Working Group 02 (Internal Overvoltages) of Study Committee 33. Guidelines for Representation of Network Elements when Calculating Transients; CIGRÉ: Paris, France, 1990; p. 30. [Google Scholar]
  12. Mahmood, F.; Rizk, M.E.M.; Lehtonen, M. Evaluation of Lightning Overvoltage Protection Schemes for Pole-Mounted Distribution Transformers. Int. Rev. Electr. Eng. 2015, 10, 616. [Google Scholar] [CrossRef]
  13. Sabiha, N.A.; Lehtonen, M. Lightning-Induced Overvoltages Transmitted Over Distribution Transformer With MV Spark-Gap Operation—Part I: High-Frequency Transformer Model. IEEE Trans. Power Deliv. 2010, 25, 2472–2480. [Google Scholar] [CrossRef]
  14. Sabiha, N.A.; Lehtonen, M. Lightning-Induced Overvoltages Transmitted Over Distribution Transformer With MV Spark-Gap Operation—Part II: Mitigation Using LV Surge Arrester. IEEE Trans. Power Deliv. 2010, 25, 2565–2573. [Google Scholar] [CrossRef]
  15. Somogyi, A.; Vizi, L. Overvoltage protection of pole mounted distribution transformers. Period. Polytech. Electr. Eng. 1997, 41, 27–40. [Google Scholar]
  16. Christodoulou, C.A.; Vita, V.; Maris, T.I. On the optimal placement of surge arresters for the efficient protection of medium voltage distribution networks against atmospheric overvoltages. In Proceedings of the 2019 54th International Universities Power Engineering Conference (UPEC), Bucharest, Romania, 3–6 September 2019; pp. 1–4. [Google Scholar]
  17. Rocha, G.V.S.; de Souza Barradas, R.P.; Muniz, J.R.S.; Bezerra, U.H.; de Araújo, I.M.; de Souza Avelar da Costa, D.; da Silva, A.C.; Nunes, M.V.A.; e Silva, J.S. Optimized Surge Arrester Allocation Based on Genetic Algorithm and ATP Simulation in Electric Distribution Systems. Energies 2019, 12, 4110. [Google Scholar] [CrossRef] [Green Version]
  18. Opsahl, A.M.; Brookes, A.S.; Southgate, R.N. Lightning Protection for Distribution Transformers. Trans. Am. Inst. Electr. Eng. 1932, 51, 245–251. [Google Scholar] [CrossRef]
  19. Borghetti, A.; Ferraz, G.M.F.; Napolitano, F.; Nucci, C.A.; Piantini, A.; Tossani, F. Lightning protection of a multi-circuit HV-MV overhead line. Electr. Power Syst. Res. 2020, 180, 106119. [Google Scholar] [CrossRef]
  20. Heine, P.; Lehtonen, M.; Oikarinen, A. Overvoltage protection, faults and voltage sags. In Proceedings of the 2004 11th International Conference on Harmonics and Quality of Power (IEEE Cat. No.04EX951), New York, NY, USA, 12–15 September 2004; pp. 100–105. [Google Scholar]
  21. Mahmood, F.; Elkalashy, N.I.; Lehtonen, M. Modeling of flashover arcs in medium voltage networks due to direct lightning strikes. Int. J. Electr. Power Energy Syst. 2015, 65, 59–69. [Google Scholar] [CrossRef]
  22. Pourakbari-Kasmaei, M.; Mahmoud, F.; Krbal, M.; Pelikan, L.; Orságová, J.; Toman, P.; Lehtonen, M. Transformer with Serial Inductors and Protection Spark Gap. Available online: https://drive.google.com/file/d/1ztdvBW2QNNZx1t6XsAY6IMTzq-nxAlVc/view?usp=sharing (accessed on 15 July 2020).
  23. The GAMS Development Corporation Website. Available online: https://www.gams.com/ (accessed on 15 July 2020).
  24. CONOPT, a Solver for Large-Scale Nonlinear Optimization (NLP). Available online: http://www.conopt.com/ (accessed on 15 July 2020).
  25. Electromagnetic Transients Program-Restructured Version (EMTP-RV). Available online: https://www.emtp-software.com/ (accessed on 15 July 2020).
  26. MATLAB and Statistics Toolbox Release 2018b. Available online: https://se.mathworks.com/products/matlab.html (accessed on 15 July 2020).
  27. Miyazaki, S.; Goshima, H.; Amano, T.; Shinkai, H.; Yashima, M.; Wakimoto, T.; Ishii, M. Uncertainty of Peak-value Measurement of Lightning Impulse High Voltage By National-Standard-Class Measuring System. In Proceedings of the XVII International Symposium on High Voltage Engineering, Hannover, Germany, 22–26 August 2011; pp. 1–6. [Google Scholar]
  28. Kuffel, E.; Zaengl, W.S.; Kuffel, J. High Voltage Engineering Fundamentals; Elsevier: Amsterdam, The Netherlands, 2000; ISBN 9780750636346. [Google Scholar]
  29. Pourakbari-Kasmaei, M.; Mahmoud, F.; Krbal, M.; Pelikan, L.; Orságová, J.; Toman, P.; Lehtonen, M. Optimal Adjustment of Double Exponential Model Parameters to Reproduce the Laboratory Volt-Time Curve of Lightning Impulse. In Proceedings of the 21st International Conference on Electricity Distribution International Scientific Conference on Electric Power Engineering (EPE), Prague, Czech Republic, 19–21 October 2020. [Google Scholar]
  30. Savadamuthu, U.; Udayakumar, K.; Jayashankar, V. Modified disruptive effect method as a measure of insulation strength for non-standard lightning waveforms. IEEE Trans. Power Deliv. 2002, 17, 510–515. [Google Scholar] [CrossRef]
  31. Rodrigues, A.R.; Guimarães, G.C.; Boaventura, W.C.; Lima, J.L.C.; Chaves, M.L.R.; Silva, A.M.B. Volt–Time Curve Prediction of Distribution Insulators Under Standard and Typical Lightning Overvoltages Using the Disruptive Effect Method. J. Control Autom. Electr. Syst. 2017, 28, 259–270. [Google Scholar] [CrossRef]
  32. Krithika, G.; Usa, S. v-t Characteristics using extended disruptive effect model for impulses of varying front times. IEEE Trans. Dielectr. Electr. Insul. 2015, 22, 2191–2195. [Google Scholar] [CrossRef]
  33. Darveniza, M. The generalized integration method for predicting impulse volt-time characteristics for non-standard wave shapes—A theoretical basis. IEEE Trans. Electr. Insul. 1988, 23, 373–381. [Google Scholar] [CrossRef]
  34. IEEE Working Group 3.4.11: Application of Surge Protective Devices Subcommittee-Surge Protective Device Committee. Modeling of metal oxide surge arresters. IEEE Trans. Power Deliv. 1992, 7, 302–309. [Google Scholar] [CrossRef]
  35. Christodoulou, C.A.; Assimakopoulou, F.A.; Gonos, I.F.; Stathopulos, I.A. Simulation of metal oxide surge arresters behavior. In Proceedings of the 2008 IEEE Power Electronics Specialists Conference, Rhodes, Greece, 15–19 June 2008; pp. 1862–1866. [Google Scholar]
Figure 1. Laboratory setup: (a) complete laboratory setup and (b) close-up for connecting the inductor and spark gap to the transformer terminal.
Energies 13 03799 g001
Figure 2. (a) Adjustable spark gap with a brass electrode and (b) connection of the spark gap to the middle terminal.
Energies 13 03799 g002
Figure 3. Quasi double peak impulse voltage, laboratory test, 125 kV.
Energies 13 03799 g003
Figure 4. Connecting two voltage surges in series in Electromagnetic Transients Program-Restructured Version (EMTP-RV).
Energies 13 03799 g004
Figure 5. The curve corresponding to the first peak.
Energies 13 03799 g005
Figure 6. Generated lightning impulse voltage by connecting two surges in series, 125 kV, Laboratory Test and EMTP-RV model.
Energies 13 03799 g006
Figure 7. Basic building block for each phase of the transformer, EMTP-RV model.
Energies 13 03799 g007
Figure 8. Δ Y -connection model of the transformer with measured capacitances.
Energies 13 03799 g008
Figure 9. Placement of the proposed filtered spark gap, EMTP-RV model.
Energies 13 03799 g009
Figure 10. Comparison of the 110 kV laboratory impulse voltage with the impulses simulated in EMTP-RV by using the coefficients of double exponential functions adjusted for the 110 kV and 125 kV impulses.
Energies 13 03799 g010
Figure 11. Applied impulse 110 kV in the presence of the spark gap, laboratory test and EMTP-RV model.
Energies 13 03799 g011
Figure 12. Applied impulse 125 kV in the presence of the spark gap, laboratory test and EMTP-RV model.
Energies 13 03799 g012
Figure 13. Applied impulse 110 kV in the presence of 35   μ H filtered spark gap, laboratory test and EMTP-RV model.
Energies 13 03799 g013
Figure 14. Applied impulse 110 kV in the presence of 119   μ H filtered spark gap, laboratory test and EMTP-RV model.
Energies 13 03799 g014
Figure 15. Applied impulse 125 kV in the presence of the 35   μ H filtered spark gap, laboratory test and EMTP-RV model.
Energies 13 03799 g015
Figure 16. Applied impulse 125 kV in the presence of 119   μ H filtered spark gap, laboratory test and EMTP-RV model.
Energies 13 03799 g016
Figure 17. Applied impulse 110 kV in the presence of 500   μ H filtered spark gap, EMTP-RV model.
Energies 13 03799 g017
Figure 18. Applied impulse 125 kV in the presence of 500   μ H filtered spark gap, EMTP-RV model.
Energies 13 03799 g018
Figure 19. Applied impulse 110 kV in the presence of the 5   μ H filtered spark gap, EMTP-RV model.
Energies 13 03799 g019
Figure 20. Applied impulse 125 kV in the presence of the 5   μ H filtered spark gap, EMTP-RV model.
Energies 13 03799 g020
Figure 21. Frequency-dependent metal oxide surge arrester.
Energies 13 03799 g021
Figure 22. Applied impulse 125 kV in the presence of the (a) spark gap, (b) surge arrester, and (c) filtered spark gap.
Energies 13 03799 g022
Figure 23. Applied impulse 110 kV in the presence of the (a) spark gap, (b) surge arrester, and (c) filtered spark gap.
Energies 13 03799 g023
Figure 24. Comparison of the current flows after the connection points of the spark gap (SG) and surge arrester (SA).
Energies 13 03799 g024
Figure 25. Comparison of the current flows before the connection points of the spark gap (SG) and surge arrester (SA).
Energies 13 03799 g025
Table 1. Effects of different filter sizes on the overvoltage amplitude 110 kV applied impulse.
Inductor Size 30   μ H 25   μ H 20   μ H 15   μ H 10   μ H 5   μ H
Peak value (kV)−110.222−109.417−108.659−107.977−107.483−107.973
Front time ( μ s )2.512.472.402.292.001.24
Table 2. Effects of different filter sizes on the overvoltage amplitude 125 kV applied impulse.
Inductor Size 30   μ H 25   μ H 20   μ H 15   μ H 10   μ H 5   μ H
Peak value (kV)−124.361−124.202−124.018−123.799−123.600−123.798
Front time ( μ s )2.052.012.001.981.961.49

