Article

Thermoelectric Generation in Hybrid Electric Vehicles

by
Muhamad Shazrul bin Dzulkfli
1,
Apostolos Pesyridis
1,2,* and
Dhrumil Gohil
1,2
1
Department of Mechanical and Aerospace Engineering, Brunel University, London UB8 3PH, UK
2
Metapower Limited, Northwood HA6 2NP, UK
*
Author to whom correspondence should be addressed.
Energies 2020, 13(14), 3742; https://doi.org/10.3390/en13143742
Submission received: 15 June 2020 / Revised: 6 July 2020 / Accepted: 15 July 2020 / Published: 20 July 2020
(This article belongs to the Section D1: Advanced Energy Materials)

Abstract

:
Improving the efficiency of an internal combustion engine (ICE) leads to the reduction of fuel consumption, which improves the performance of a hybrid vehicle. Waste heat recovery (WHR) systems offer options to improve the efficiency of an ICE. This is due to the ICE releasing approximately one third of the combustion energy as waste heat into the atmosphere. This paper focuses on one such upcoming system by analysing the efficiency of a thermoelectric generator (TEG) used as a waste heat recovery system in a hybrid electric vehicle (HEV). It summarises how the efficiency of the TEG can be improved by considering parameters such as the size of module, materials used, and the number of modules needed for the TEG system. The results obtained are then compared with other types of WHR system such as the Organic Rankine Cycle (ORC) and turbocompounding (T/C) implemented on the same type of engine. The research is based on a 1.8 L Toyota Prius-type engine. The TEG model simulated in this research can generate a maximum power of 1015 W at an engine speed of 5200 RPM. The overall system efficiency of TEG implemented on the HEV model is 6% with the average engine speed operating at 2000 RPM.

1. Introduction

By 2040 it is estimated that the world’s energy consumption will increase by almost 50% [1]. The development of electric vehicles such as hybrid electric vehicles (HEVs), battery electric vehicles (BEVs) and fuel cell electric vehicles (FCEVs) is ramping up at differing rates. Several electric vehicles are already in the market, developed by companies such as Toyota, Honda, BMW, Chevrolet and Mitsubishi.
A HEV contains both an internal combustion engine (ICE) and an electric propulsion system. All vehicles that use combustion engines experience energy loss in terms of heat loss. Current internal combustion engines are approximately 25% efficient under current driving cycle certification [2]. The range of efficiency can vary between 35% and 45% for modern engines depending on the type of engine and driving cycle. The remainder of this process results in the generation of heat losses down the coolant and exhaust systems. Waste heat recovery systems are very helpful in reducing the energy loss as well as improving the efficiency of the vehicle. The waste heat recovery (WHR) systems under investigation most often include the Organic Rankine Cycle (ORC), turbocompounding (T/C) and the thermoelectric generator (TEG) [3].
TEG is one of the most recent forms of WHR considered for automotive applications and is known to be one of the least efficient systems compared to other WHR technologies. However, in the past few years, the interest in the development of TEG as a more efficient system has grown. This is due to the advantages on offer of no moving mechanical parts, which results in low maintenance, a smaller size, a lighter weight, and a noiseless system. The TEG system converts the heat loss directly into electrical power.
This research paper aims to present the evaluation of the TEG system as a WHR system in HEVs considering a number of different properties of this system (size, module number and materials effects). Comparison with other WHR systems such as ORC and turbocompounding (T/C) is made to evaluate which WHR is most suitable for a typical HEV passenger car application. Generally, no WHR systems have seen widespread (production) use and near-future legislative mandates may well force auto-makers to integrate such systems onboard an HEV vehicle’s architecture. The cost for fuel saving by the consumer is $400 for a 23.5 mpg vehicle, assuming $2/gallon and 15,000 miles per year [4]. The aim of this research was to investigate the thermoelectric generator used for waste heat recovery systems in hybrid electric vehicles (HEVs) and the objectives comprised the modelling of the thermoelectric generator in GT-Suite software, to study the conversion of heat energy to the source, the investigation of the thermoelectric generator module in different sizes and number of thermoelectric modules and the efficiency analysis of the thermoelectric generator in HEV. A comparison to known experimental engine data for the selected engine is, also, provided.

2. Literature

2.1. Hybrid Electric Vehicle Configuration

2.1.1. Series Hybrid Configuration

In a series hybrid, the prime movers are set in series and only the electric motor drives the drivetrain. The ICE engine acts as an electric generator for the battery to power the electric motor. Since the IC engine is not coupled directly to the wheels, it can work independently from any road resistance [5]. Most of the series hybrids have a larger battery pack than the parallel hybrids (below).

2.1.2. Parallel Hybrid Configuration

In a parallel hybrid configuration, both power sources (ICE and electric motor) operate on the same mechanical transmission. The power flow from the engine is used to drive the wheels, usually through a conventional transmission. The energy from the battery is used to provide extra power. With this, the efficiency of this configuration is higher than for the series configuration [5].

2.1.3. Series-Parallel Hybrid Configuration

The configuration of a combined hybrid is a combination of both configurations (series and parallel) which has all the advantages of both setups. It can operate more or less independent of the road resistance for the engine while maintaining a minimum energy conversion [5]. It can obtain better overall efficiency than the independent series and parallel hybrid configurations.

2.2. Thermoelectric Generators in Automotive Use

Nowadays, more research on the TEG model is being proposed in the automotive field. Earlier research is focussed more on larger-sized vehicles or trucks. This is due to the larger engine itself providing higher heat loss and higher temperature variation compared to a conventional vehicle. The development of this study was started by Hi-Z Technology Inc. USA. The research was based on a Cummins L-10 engine truck exhaust and they found that the TEG can generate only 126.6 W of power [6]. Another study on a TEG that mounts onto the exhaust of a truck was performed in 2007. The TEG generated around 180 W of electrical power [7].
A study on a passenger vehicle was done in 2009, only 300 W of power was generated by a 2.5 L engine of a hybrid vehicle [8]. Then, the research on TEG was added to by involving the heat pipe as the heat sink based and using BiTe (Bismuth Telluride) as the thermoelectric material. In 2011, the output power generated by TEG was increased up to 350 W [2].
A study that tested TEG on a Caterpillar diesel engine for a high temperature, high power density of TEG was performed in 2015 [9]. They used a 0.2 mm thick heat exchanger, a 1.0 value of ZT (figure of merit or performance of the thermoelectric material used) at 500 ℃ of p-type and a 0.9 value of ZT at 700 ℃ of n-type thermoelectric modules. The higher the ZT value the higher the thermoelectric performance of the material The temperature of exhaust gas was 550 ℃. The output power of TEG was 1002.6 W.
Big companies such as BMW, Ford, Renault and Honda have started to show interest in developing the TEG for waste heat recovery in automobiles in recent years. BMW developed a TEG-based model that reached an output power roughly around 750 W [10]. Ford used a lot of small parallel flows lined to the thermoelectric materials, and the model produced about 400 W using 4.6 kg of thermoelectric materials [8]. Renault conducted research on TEG on a diesel engine. They used a TEG with size of 10 cm × 50 cm × 31 cm and a modelled system produced around 1 kW [11]. Honda used a simple rectangular TEG model with dimensions of 30 mm × 30 mm on a series hybrid vehicle. They used 32 modules and it produced around 500 W output power [12].
With the use of BiTe at the hot side of TEG and aluminium at the cold side, the TEG generated 400 W power initially; with a few modifications on the hot side heat exchanger, the TEG generated 1068 W of power at 1700 RPM and 300 HP [13].
Most of the previous research on TEG has only focused on the electrical power output of the device to predict the performance. One of the first papers to study the effect of TEG on fuel saving was done by Lan et al [14]. The study was based on a light duty vehicle (2 L gasoline engine) using skutterudite as the TEG material. The results showed that TEG can achieve reduction of 4% at a constant speed (120 km/h). The fuel saving was in the range of 0.5% to 1.7% for the New European Driving Cycle (NEDC) and 1.4% to 3.1% for the Worldwide Harmonised Light Vehicle Test Procedure (WLTP) drive cycle depending on driving scenario.
Skutterudite has recently been used in the development of high temperature thermoelectric materials [15]. The TEG efficiency is expected to increase up to 20% for a higher temperature. For the time being, the device efficiency of the TEG is from 5% to 12% for a ZT value of 0.85 to 1.25, and can go up to 20% [16].
Based on the literature review, this paper will focus on increasing the efficiency of the TEG system by considering the factors that may affect the efficiency of TEG such as size and materials used. It will also study how efficient the TEG is in increasing the ICE engine efficiency as well as improving the fuel economy of a hybrid vehicle.

2.3. Thermoelectric Efficiency

TEG device efficiency shows how efficiently the device converts the heat input into the device into the electrical power. It can be calculated by using amount of power generated by the TEG module divided by the heat input of TEG [16]. The heat input is the amount of heat at the hot side of the TEG module.
The device efficiency and system efficiency of TEG can be measured by using Equations (1) and (2). To analyse the TEG performance, the thermal efficiency improvement of the TEG system on the gasoline engine was calculated by using Equation (3). The level of BSFC reduction achieved by TEG was calculated by using Equation (4).
η d e v i c e = Total   energy   provided   by   TEG Heat   input
TEG overall system efficiency in vehicle is the amount of power generated by TEG for a specific amount of heat input produced by the engine exhaust heat [16].
η s y s = Total   energy   provided   by   TEG Engine   exhaust   heat
For a combined TEG system with the engine, the thermal efficiency improvement and the Brake Specific Fuel Consumption (BSFC) reduction can be calculated by using Equations (3) and (4) [17]. The thermal efficiency improvement is defined by the ratio of added power from the WHR when it is used back in the system divided the amount of fuel power input over a cycle or at a given engine operating condition.
The reduction of BSFC occurs when the power from the WHR system is added back into the engine to increase the output power without changing the fuel mass flow rate. The power from the TEG WHR system is additional power that is generated.
Thermal efficiency improvement,
Δ η = Total   energy   provided   by   TEG   ( kW ) Fuel   power ,   Qfu   ( kW )
BSFC reduction of engine,
Δ BSFC = m ˙ f u W e m ˙ f u W e w
m ˙ f u
= fuel mass flow rate (g/h)
W e
= engine power (kW)
W e w
= engine power added with TEG power (kW)

3. Methodology

The study of the WHR system was based on a HEV model simulated in GT- Suite software. A model of series-parallel HEV was simulated by using two types of drive cycle to investigate the fuel consumption. The engine and vehicle model specifications were based on a 1.8 L Toyota Prius. However, since the fully validated Prius engine model was not available, it was enough to use a Prius-class engine with corresponding data for which there was available information. The focus was on analysing the merits of the WHR technologies involved, rather than on modelling with absolute precision any particular production engine model. The specifications of the engine were: a four cylinder in-line, 1.8 L, 16-valve DOHC, Euro 6 engine with VVT-i, delivering 72 kW at 5200 RPM and 142 Nm at 3600 RPM. Its battery system has a 1.31 kWh capacity from 28 modules and its electric motor delivering a maximum of 53 kW and 163 Nm of torque. A TEG model was simulated to study the efficiency of TEG on HEV.

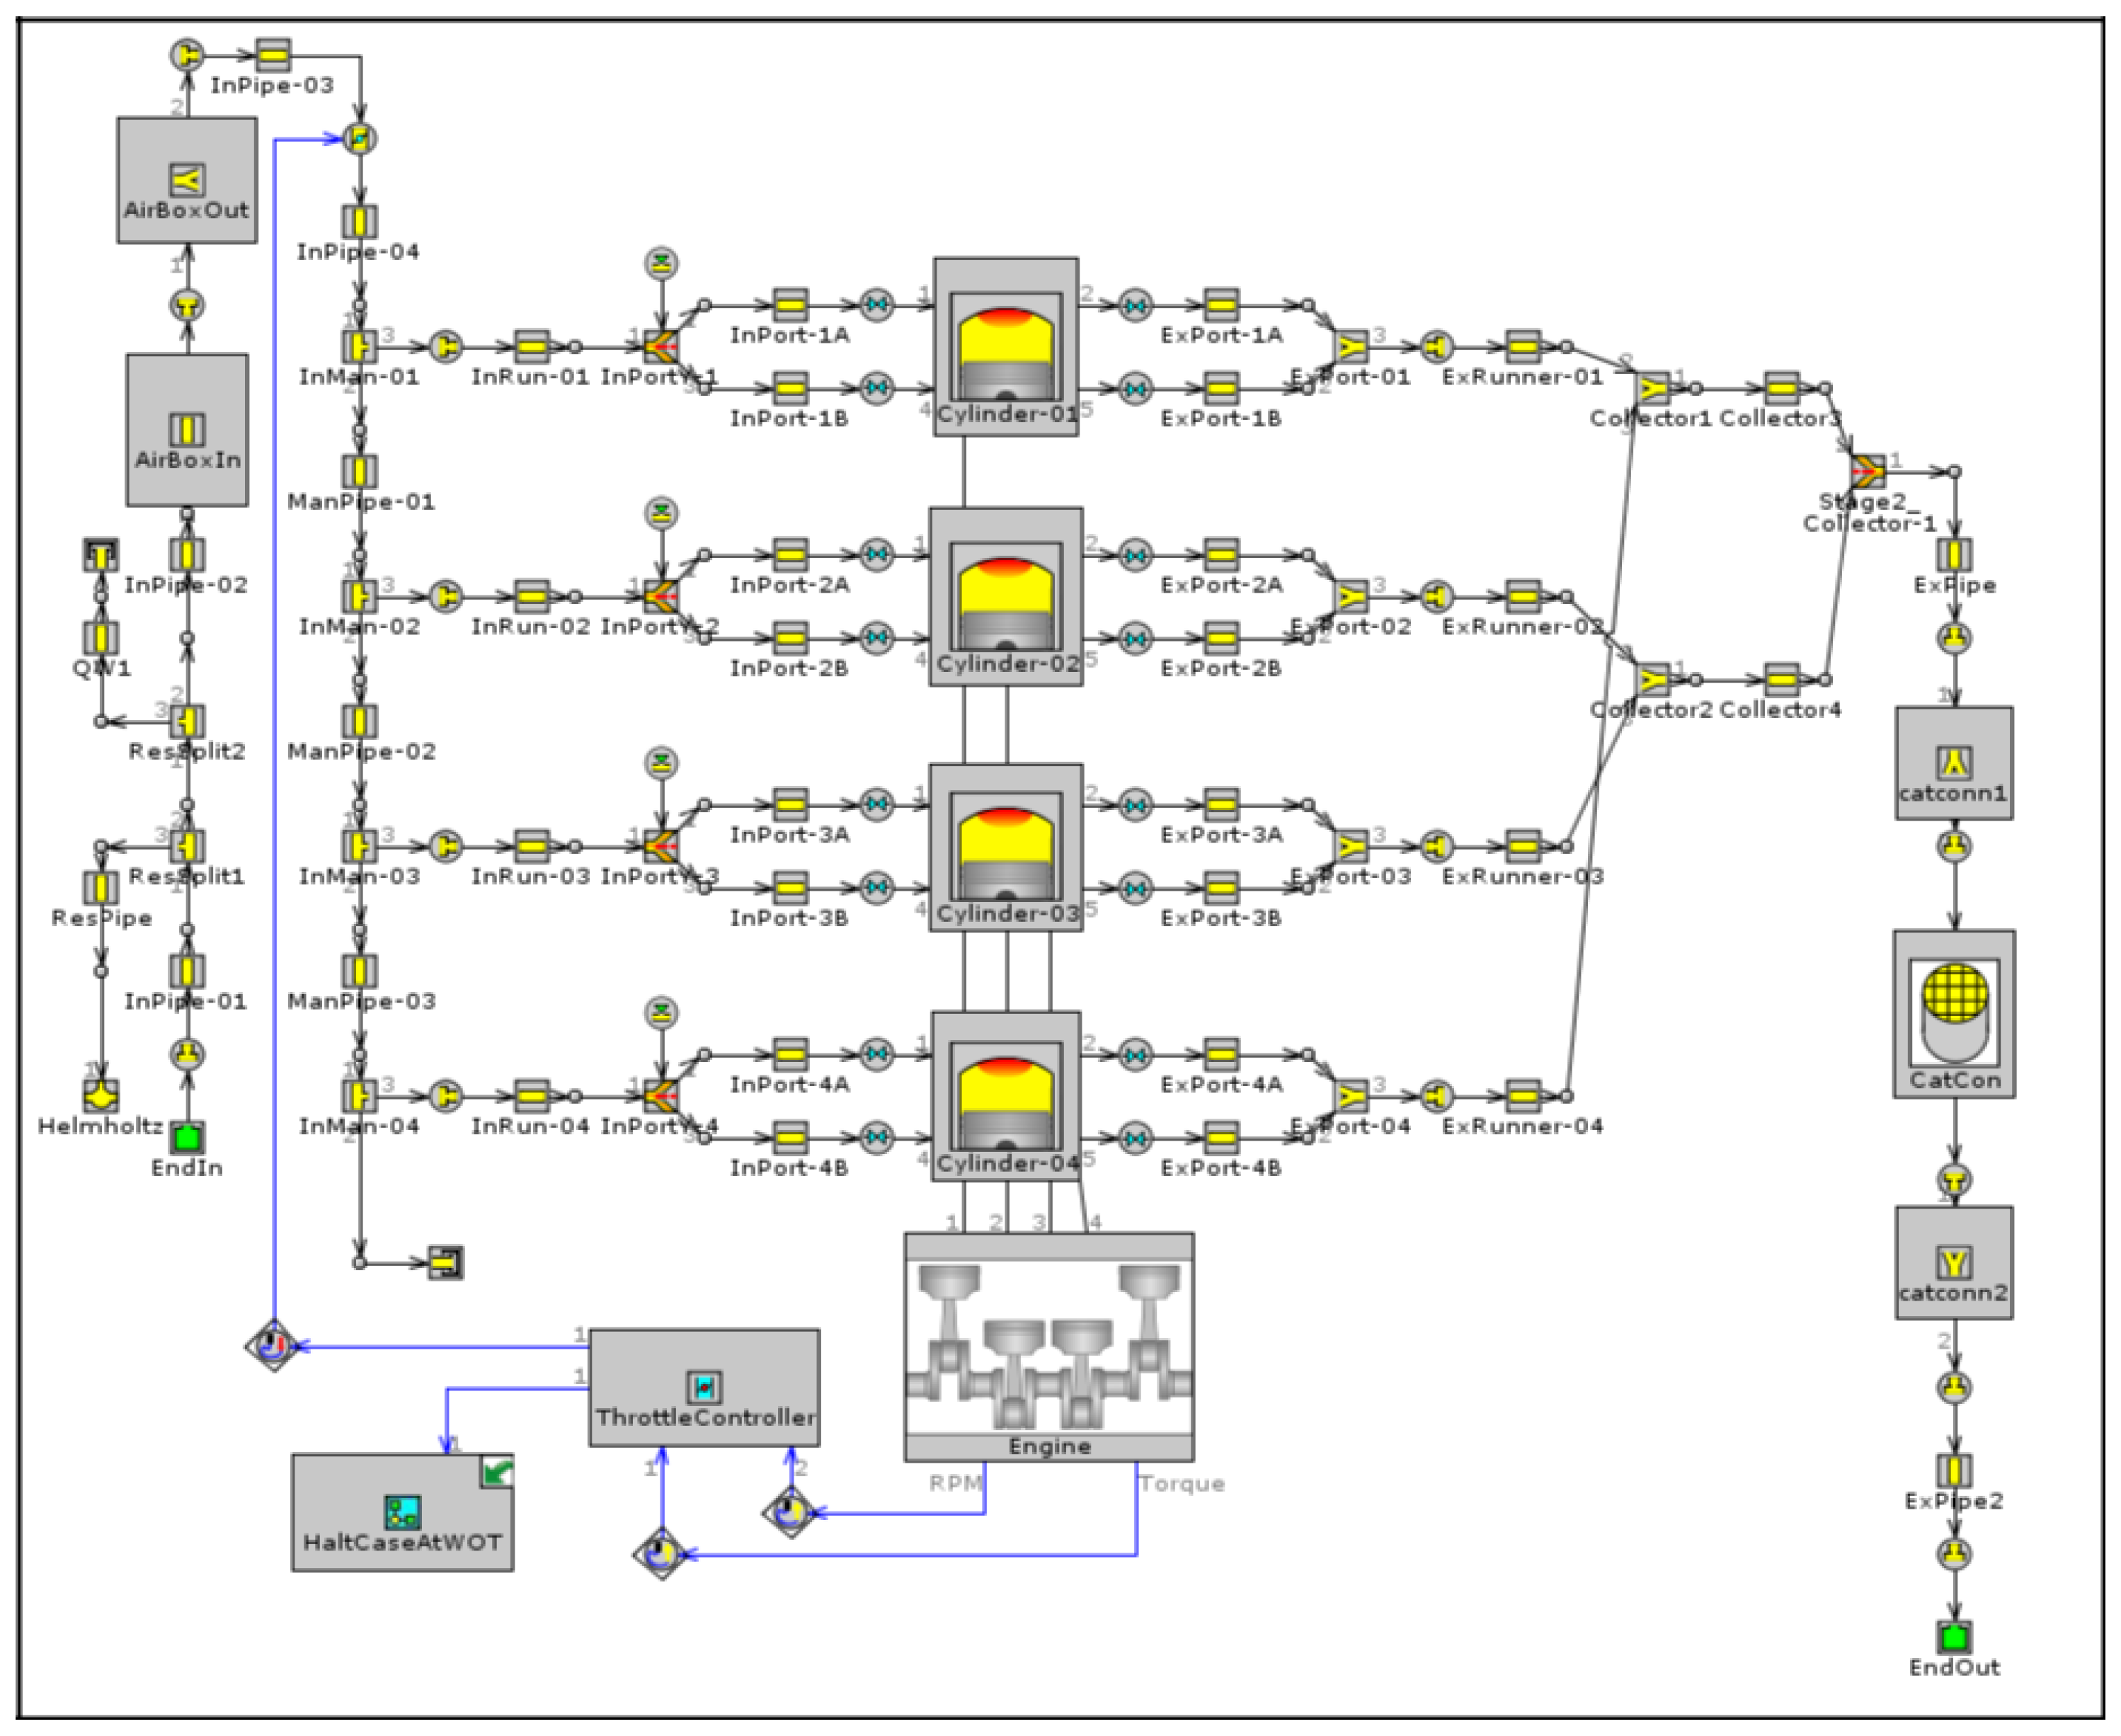
3.1. GT-SUITE Simulation

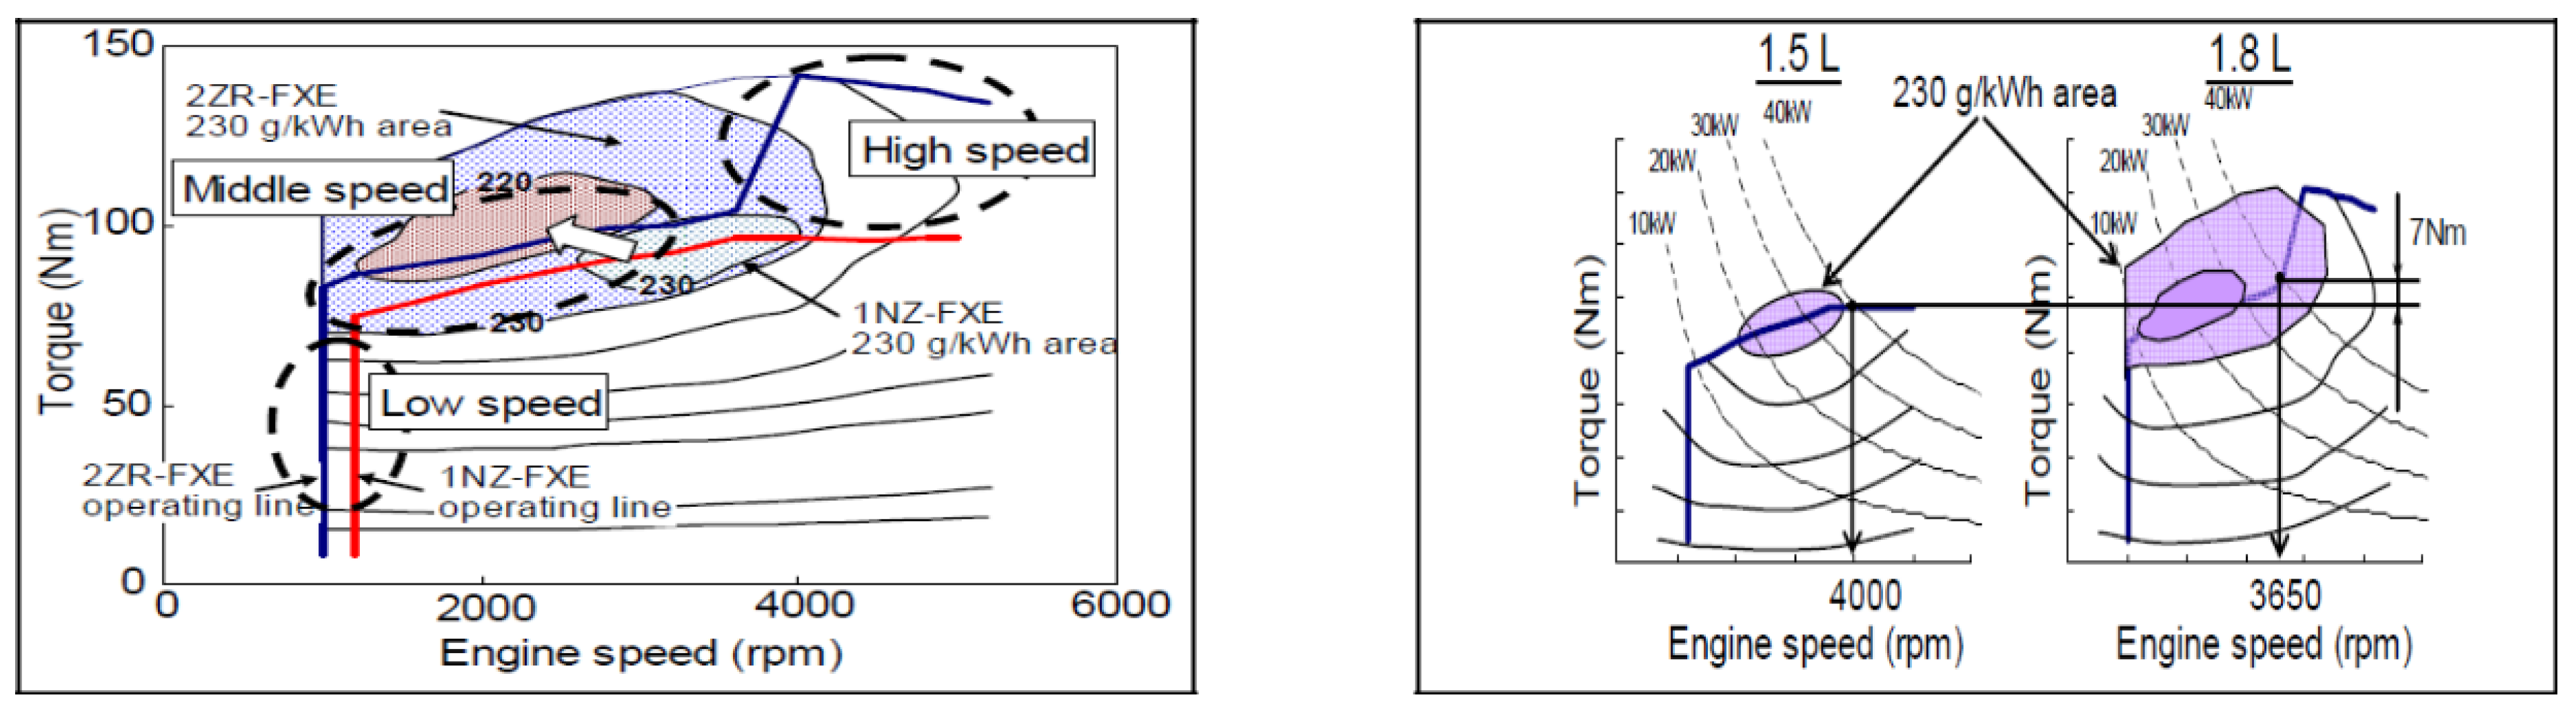
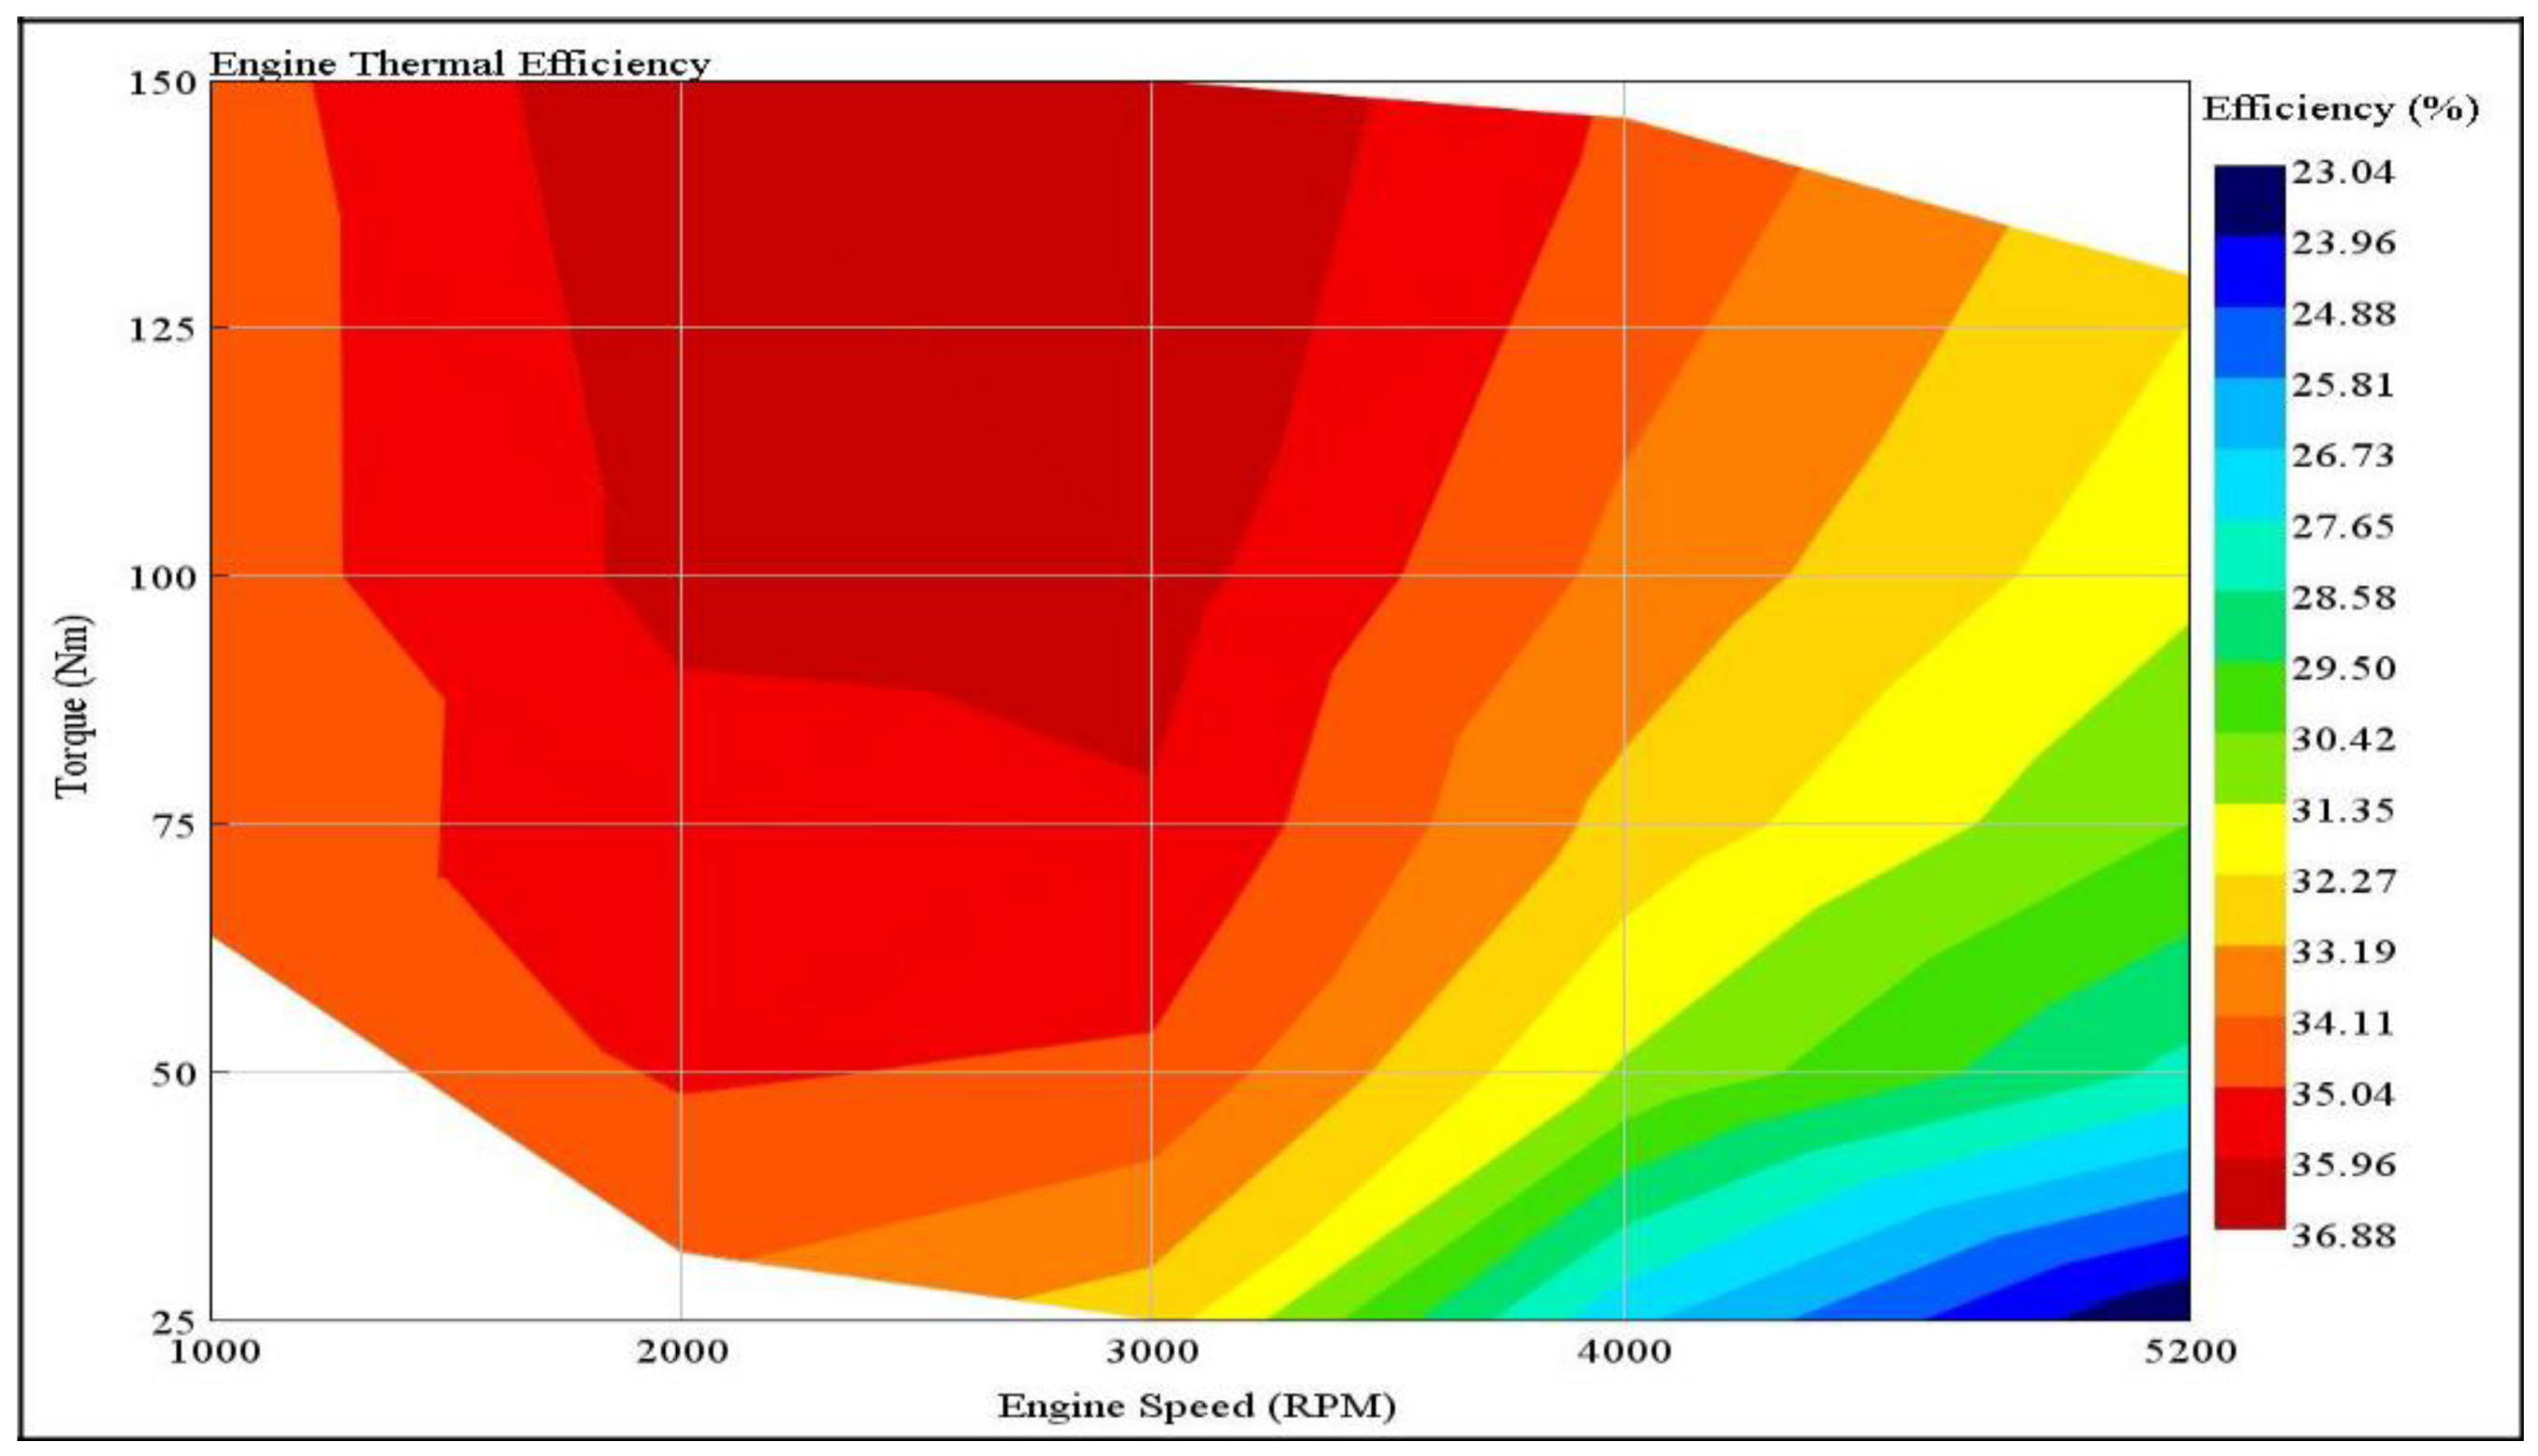
3.1.1. Engine Model Calibration

Figure 1 shows the 4-cylinder (SI) engine model used for the simulation. The validation of the engine model used for the simulation was done by comparing the Brake Specific Fuel Consumption (BSFC) value in the engine model that has a maximum power of 71 kW at the speed of 5200 RPM with the theoretical BSFC map. The theoretical BSFC map was selected from the engine specification of a 1.8 L Toyota Prius 2016 [18]. The data of BSFC from the 4-cylinder engine model was generated by using the throttle control connected to the engine. This control was set up to target different values of torque at different engine speeds to be in line with the operating line of the theoretical BSFC. Twenty-five different operating points ranging from 1000 RPM to 5200 RPM were used for 25 different cases to obtain the engine model BSFC map. Full specification data are provided in Table 1 and Figure 2, and corresponding BSFC and brake power data in Figure 3 and Figure 4, respectively, below.
To obtain the desired output data for validation, the cylinder stroke was modified. The new value used for the stroke was 97.6 mm.
The BSFC value of both engine model and theoretical value at 2000 RPM with torque value 100 Nm was around 220 g/kWh. The power generated was roughly 20 kW for both at 200 RPM and the maximum power was 71 kW. This shows that the engine model can be used to simulate the 1.8 L gasoline engine of Toyota Prius.
For the engine model simulation, the main objective was to explore the exhaust pipe, which provides an amount of heat loss to the surroundings by the engine. The exhaust temperature, mass flow rate and the pressure were observed. The heat energy release by the exhaust was calculated by using the equation below.
Q e x h a u s t = mass   flow   rate ,   m ( k g s ) × specific   heat ,   C p ( J k g K ) × Δ T   ( K )

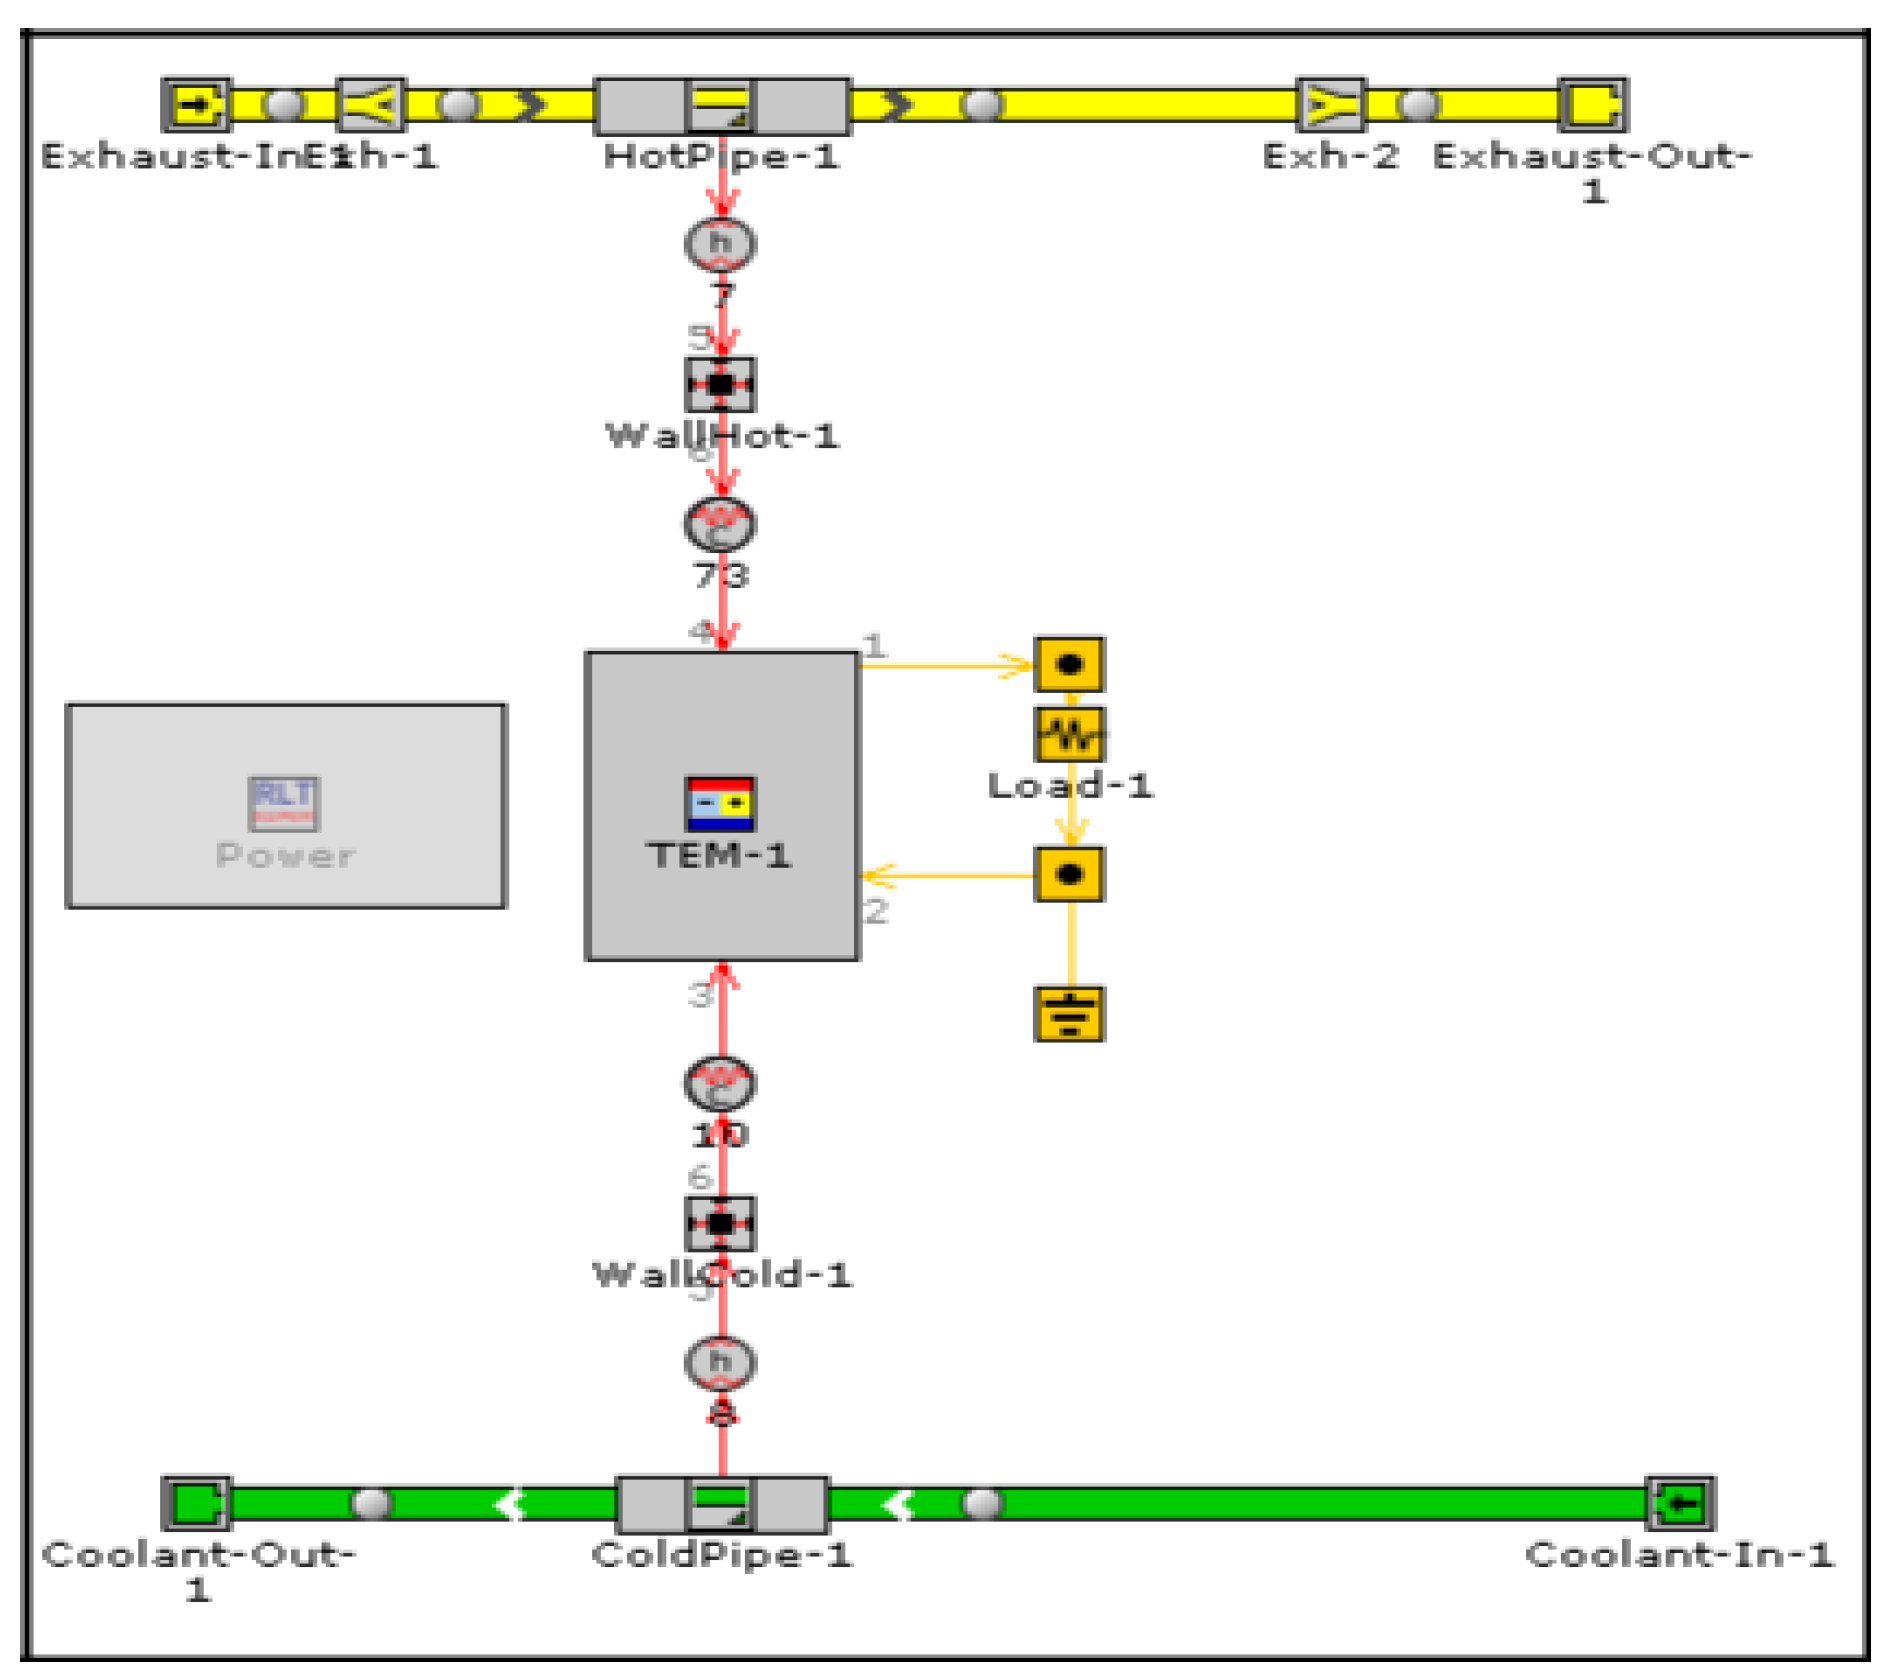
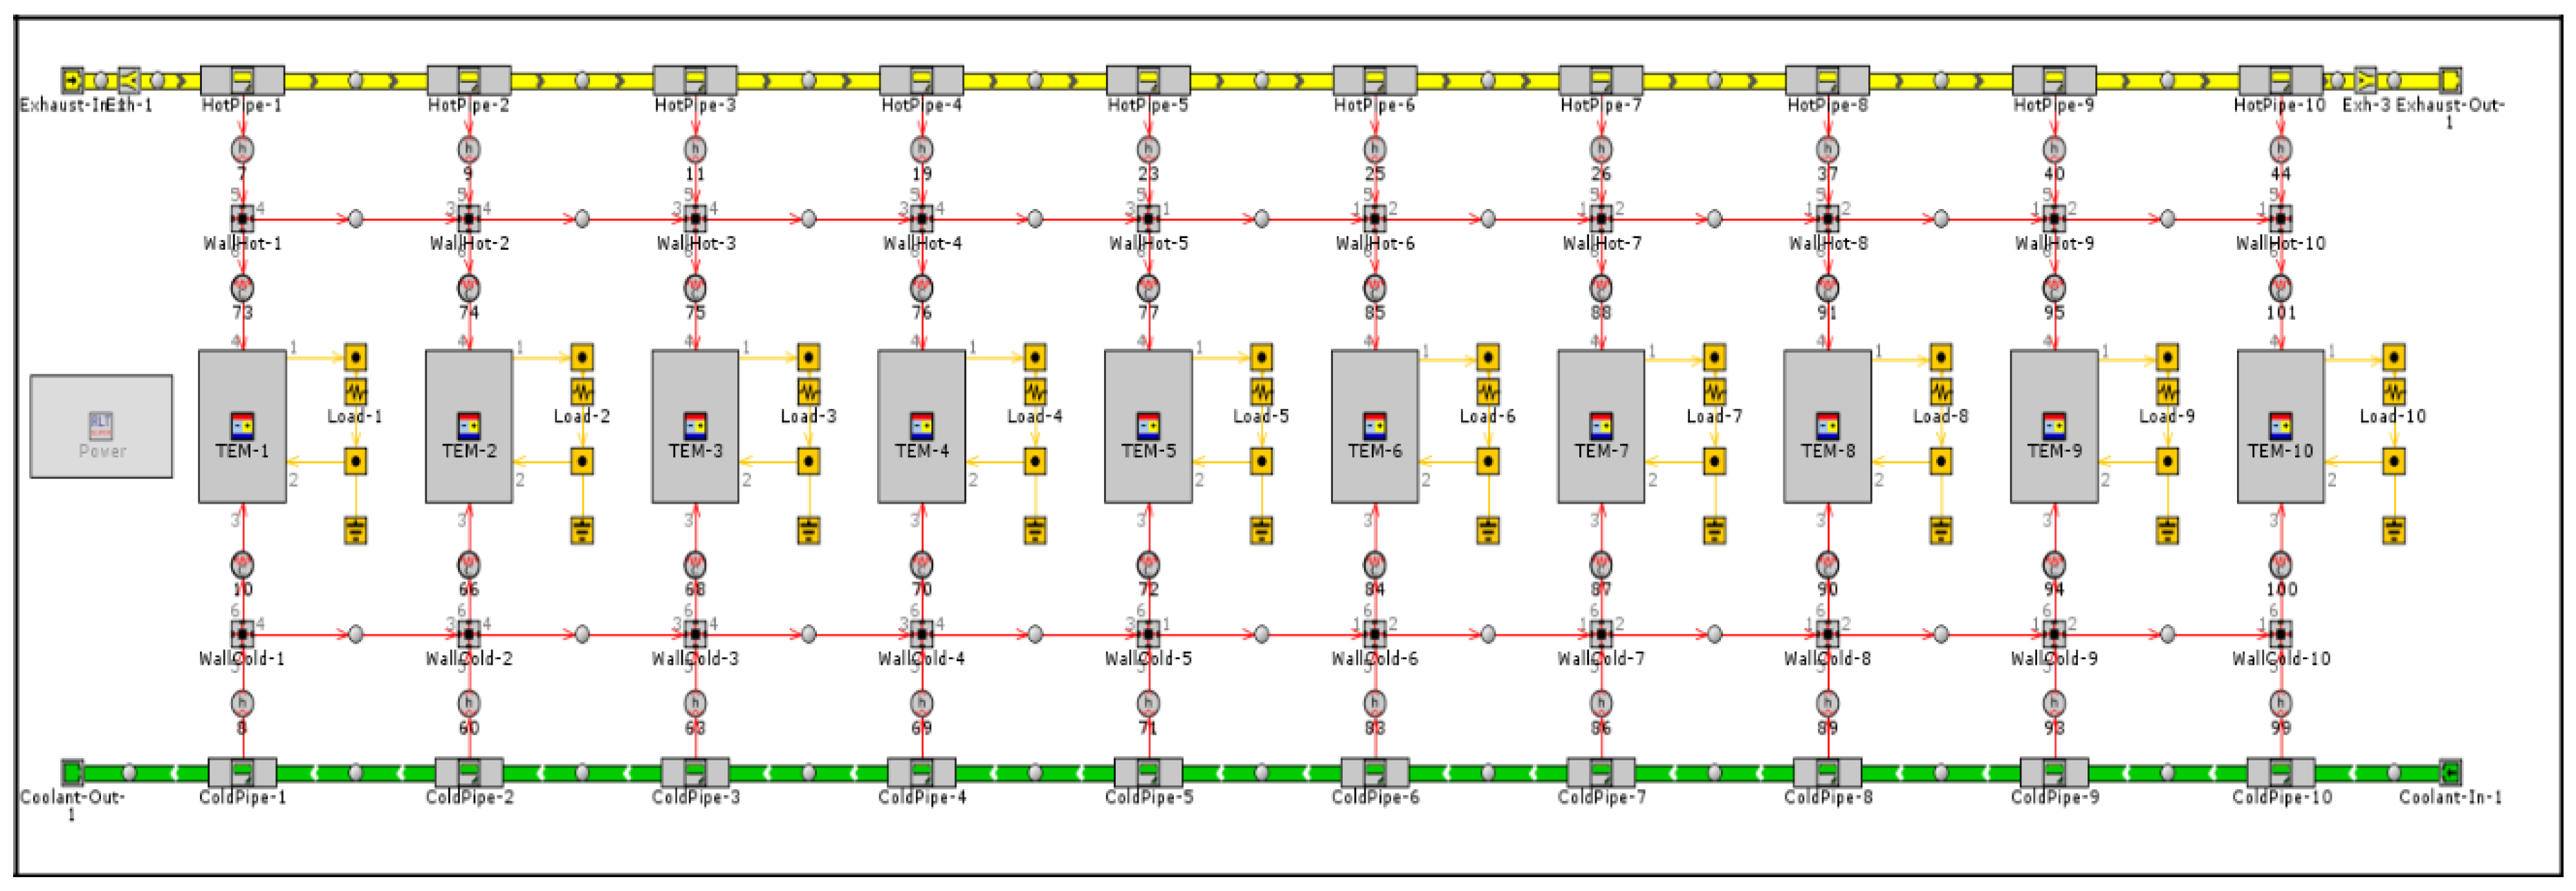
3.1.2. Thermoelectric Generator Model

A single module TEG was constructed in GT-Suite as shown in Figure 5 to study the effect of changing the size of module and the materials used. Research done by [19] proved that GT-Suite is a useful tool to model a TEG.
The size of the area of TEG module was varied and the height of the module was set to be 1 mm. The module must be thin to provide a better heat conversion. The materials used in the simulation were ceramic due to the unavailability of a valid commercial properties of other materials such as BiTe and PbTe. The Seebeck coefficient of the ceramic was varied to show how the Seebeck coefficient of a material can improve the efficiency of TEG. The data generated were duly analysed.
As shown in Figure 5, the TEG module was placed in between the hot pipe and cold sides of the pipe. The hot pipe refers to the exhaust pipe which shows the TEG is mounted on the exhaust of the vehicle. The cold pipe refers to the coolant temperature. The TEG module was placed in between these two pipes to create the temperature difference. The temperature difference generates voltage. The behaviour of the exhaust pipe in the TEG model used the data generated from the exhaust pipe in the engine model simulation in Section 3. The TEG was observed under 25 different cases (same as in Section 3) at the engine speed range from 1000 RPM to 5200 RPM with a torque value increment of 25 Nm, because every operating point of engine speed provides a different exhaust temperature.
The values of exhaust inlet temperature and the mass flow rate were the data obtained from simulation in Section 3. The pressure was set to be 1 bar because the average pressure value analysed at the exhaust was approximately equal to 1 bar. The pressure was assumed to be constant and did not affect the heat exchange of the TEG module. The cold side was set to be 25 ℃ coolant water. This was to make sure a higher temperature difference occurs on the TEG module. Specifications of materials used are shown in Figure 5 and the thermal conductivity (k) was 30 W/(m.k) at 300 K.
The TEG module was constructed in series next to each other to increase the operating voltage, so that more power could be generated (Figure 6). A different number of modules with the same size were tested. The shape of TEG was chosen to be rectangular. The total area of TEM was the area that covered the exhaust pipe of the vehicle. TEG was mounted before the catalytic converter because the highest temperature can be achieved in that location.

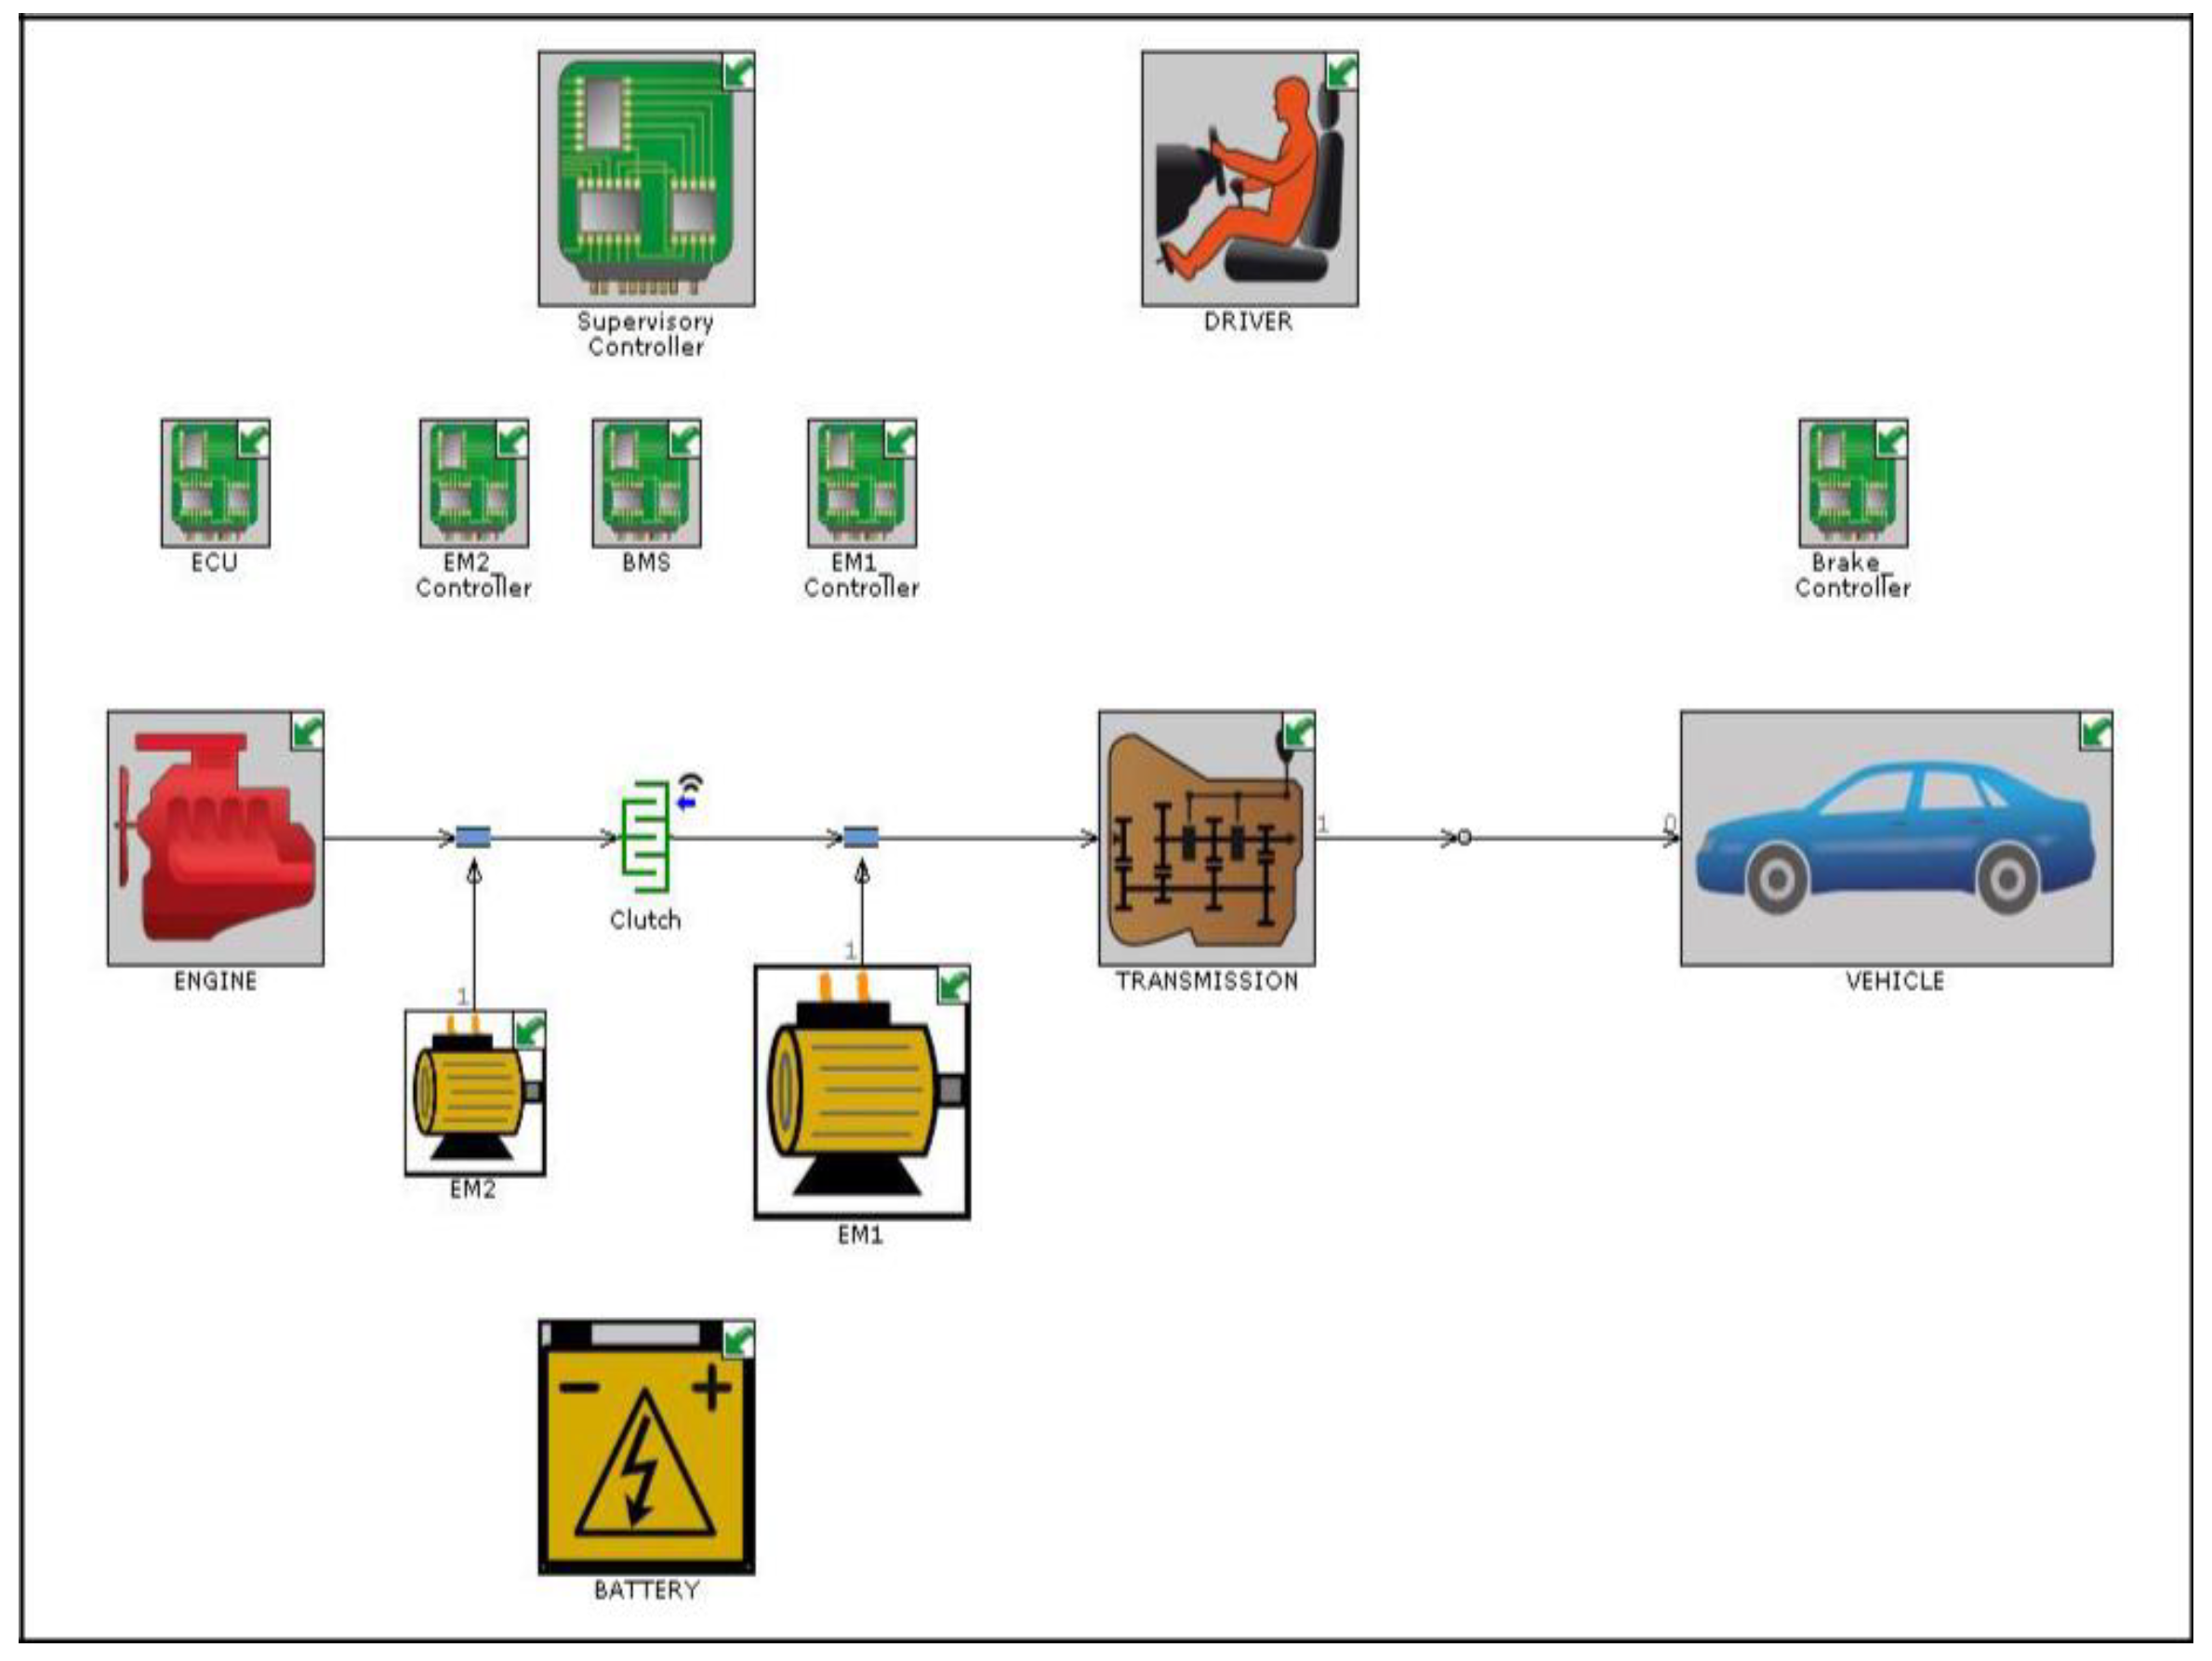
3.1.3. Series-Parallel Hybrid Electric Vehicle Model

Figure 7 shows the HEV model simulated in GT-Suite. The model used was a series-parallel hybrid electric vehicle. This was to make sure it exhibited the same behaviour as the 1.8 L Toyota Prius. This model was simulated under two different drive cycles which (NEDC and WLTC). The engine specifications used in the HEV model were the same as the 4-cylinder engine model simulated in Section 3.
The control strategy of this model was mainly taken from [20]. In series mode, the EM1 (traction motor) provides the propulsion system of the vehicle until it reaches its limits to provide the needed tractive power. When the limits are reached, the system will change to parallel mode and the engine is turned on. The ICE then provides the propulsion. If the battery state of charge (SOC) falls below a limit, the engine is also be used to charge the battery through generator EM2.
To validate the HEV model, the BSFC used was the same as in Figure 3, which was obtained from the 4-cylinder engine model, and the fuel consumption was observed for two different drive cycles. The fuel consumption was then compared with the testing data of WLTP and NEDC data obtained from Toyota UK [21] and provided in Table 2 below.
The values of fuel economy from the test data and simulation were slightly different but the HEV model simulation was mainly performed to observe the fuel consumption improvement after improving the engine efficiency. No further modification was done on the HEV model. The new BSFC was calculated using Equation (4) and the HEV model was simulated again after the engine efficiency improvement done by TEG, as described in Section 3.

4. Results

This section discusses the results obtained from the simulations that have been described in Section 3. The first part will provide the results for the engine model, TEG model and HEV model simulations. The engine simulation was performed in order to study the engine performance and the heat released that is available for the WHR system. The TEG simulation demonstrated that the changing of certain parameters can increase the efficiency of TEG. The TEG WHR performance is also presented. HEV simulation was focused on the performance of the hybrid vehicle when the TEG was implemented on the vehicle. The last part of this section features a comparison of the effectiveness of different WHR systems implemented on the same vehicle and the efficiency of TEG on different types of vehicle.

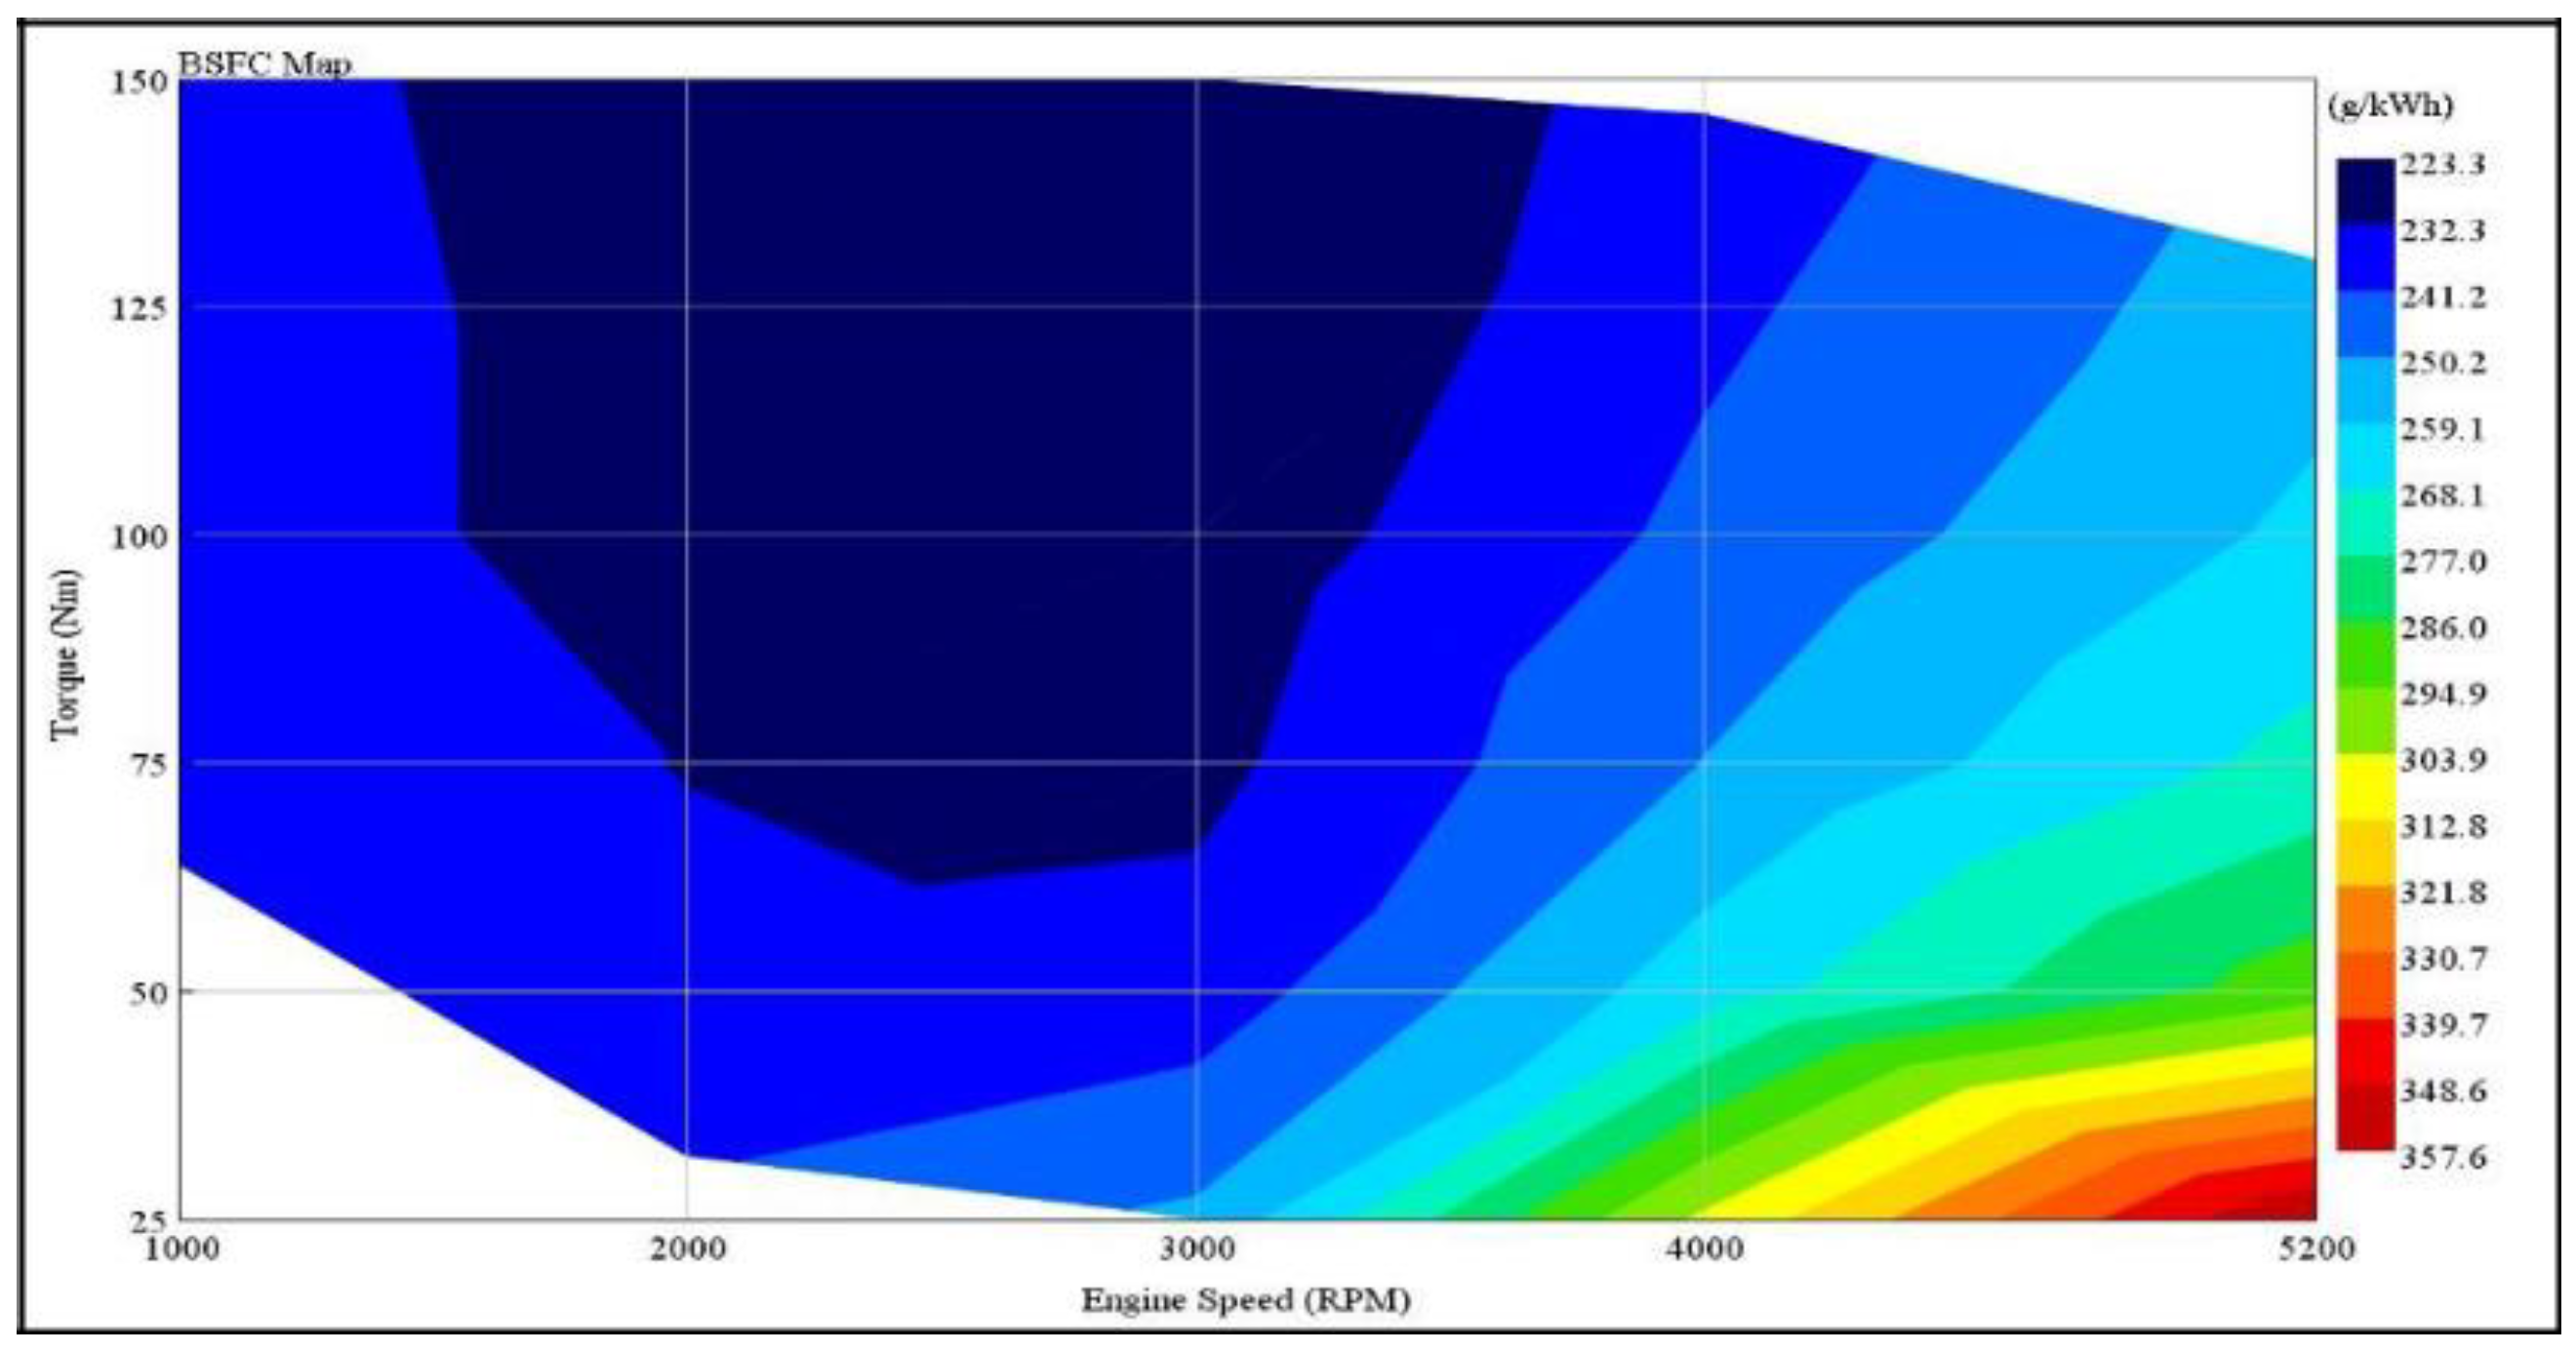
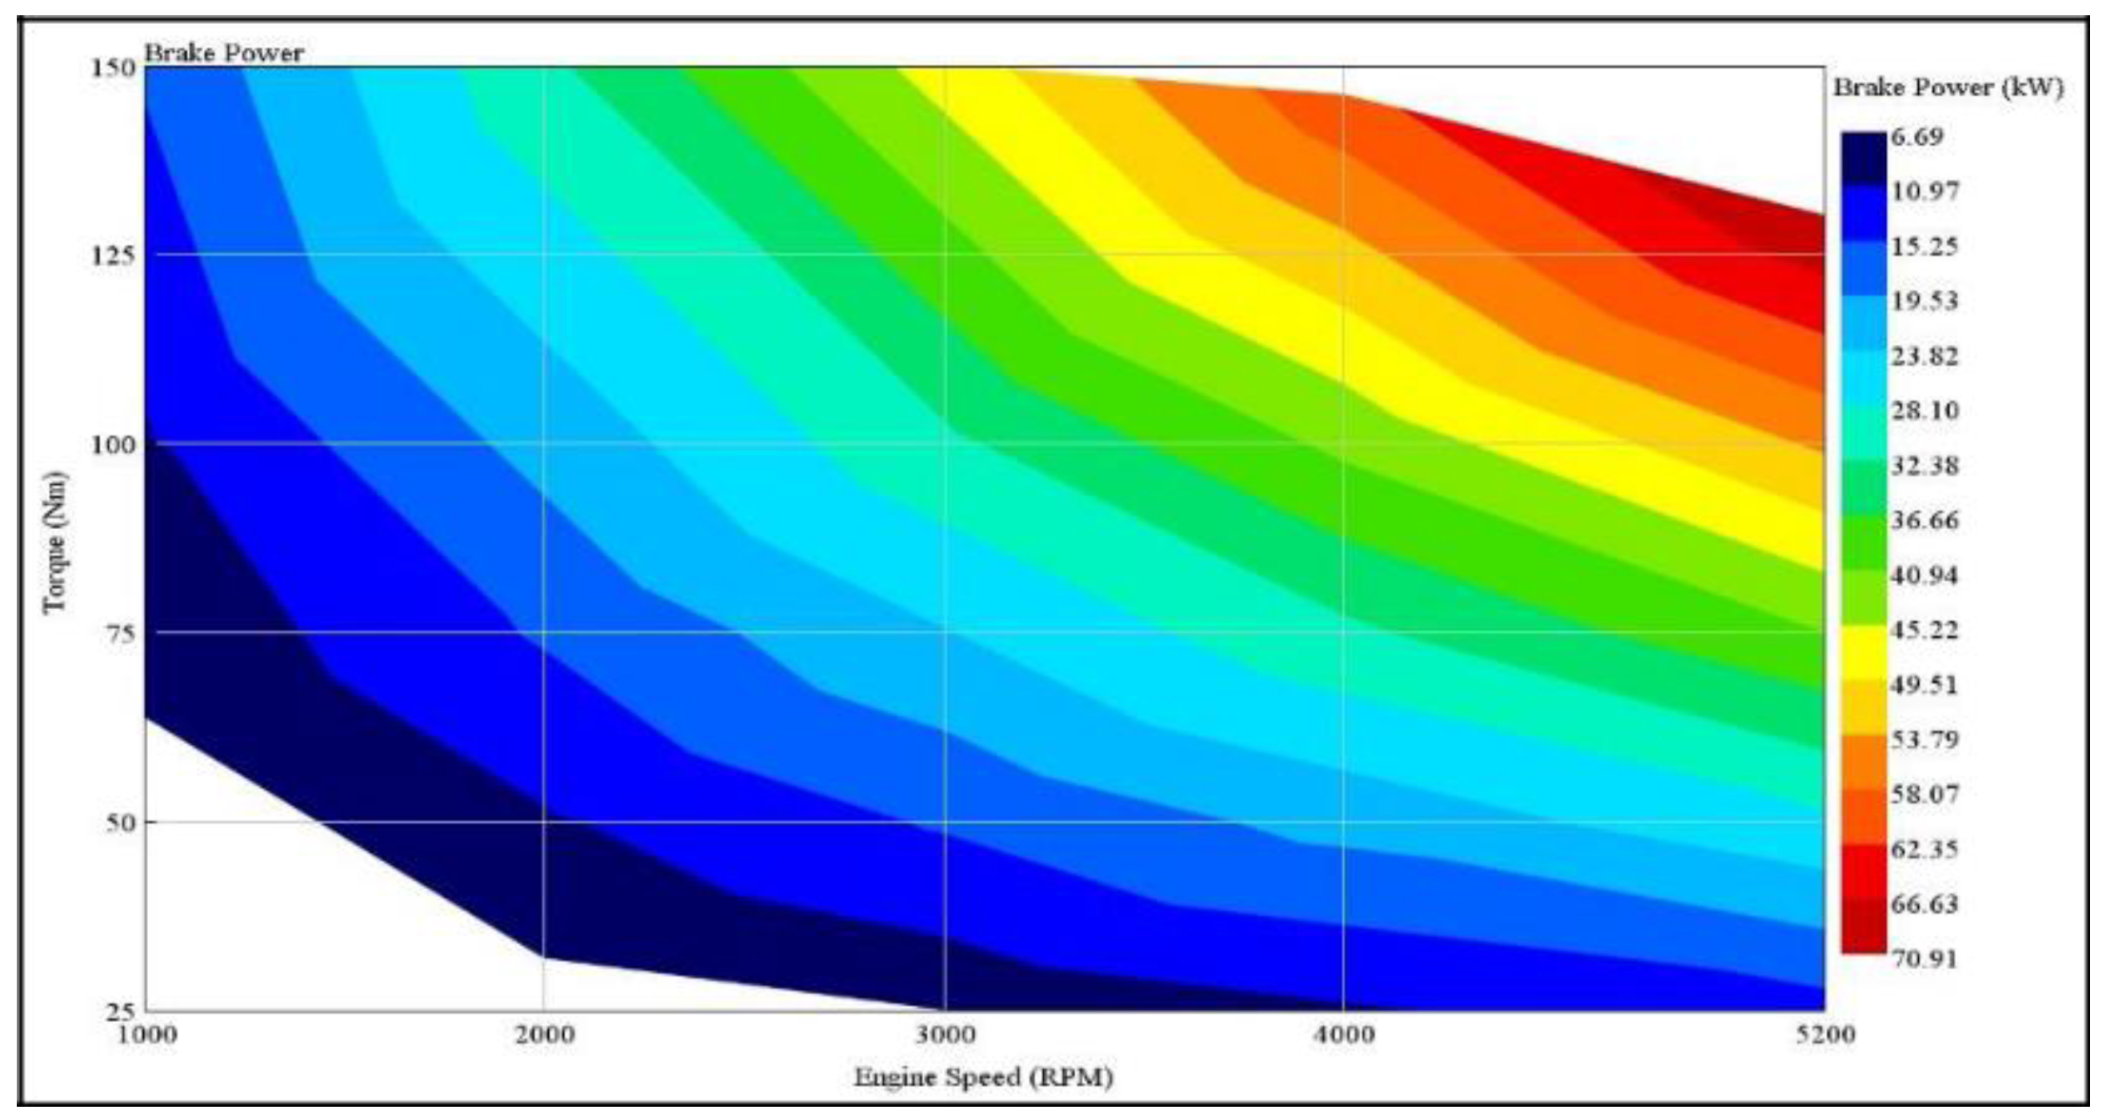
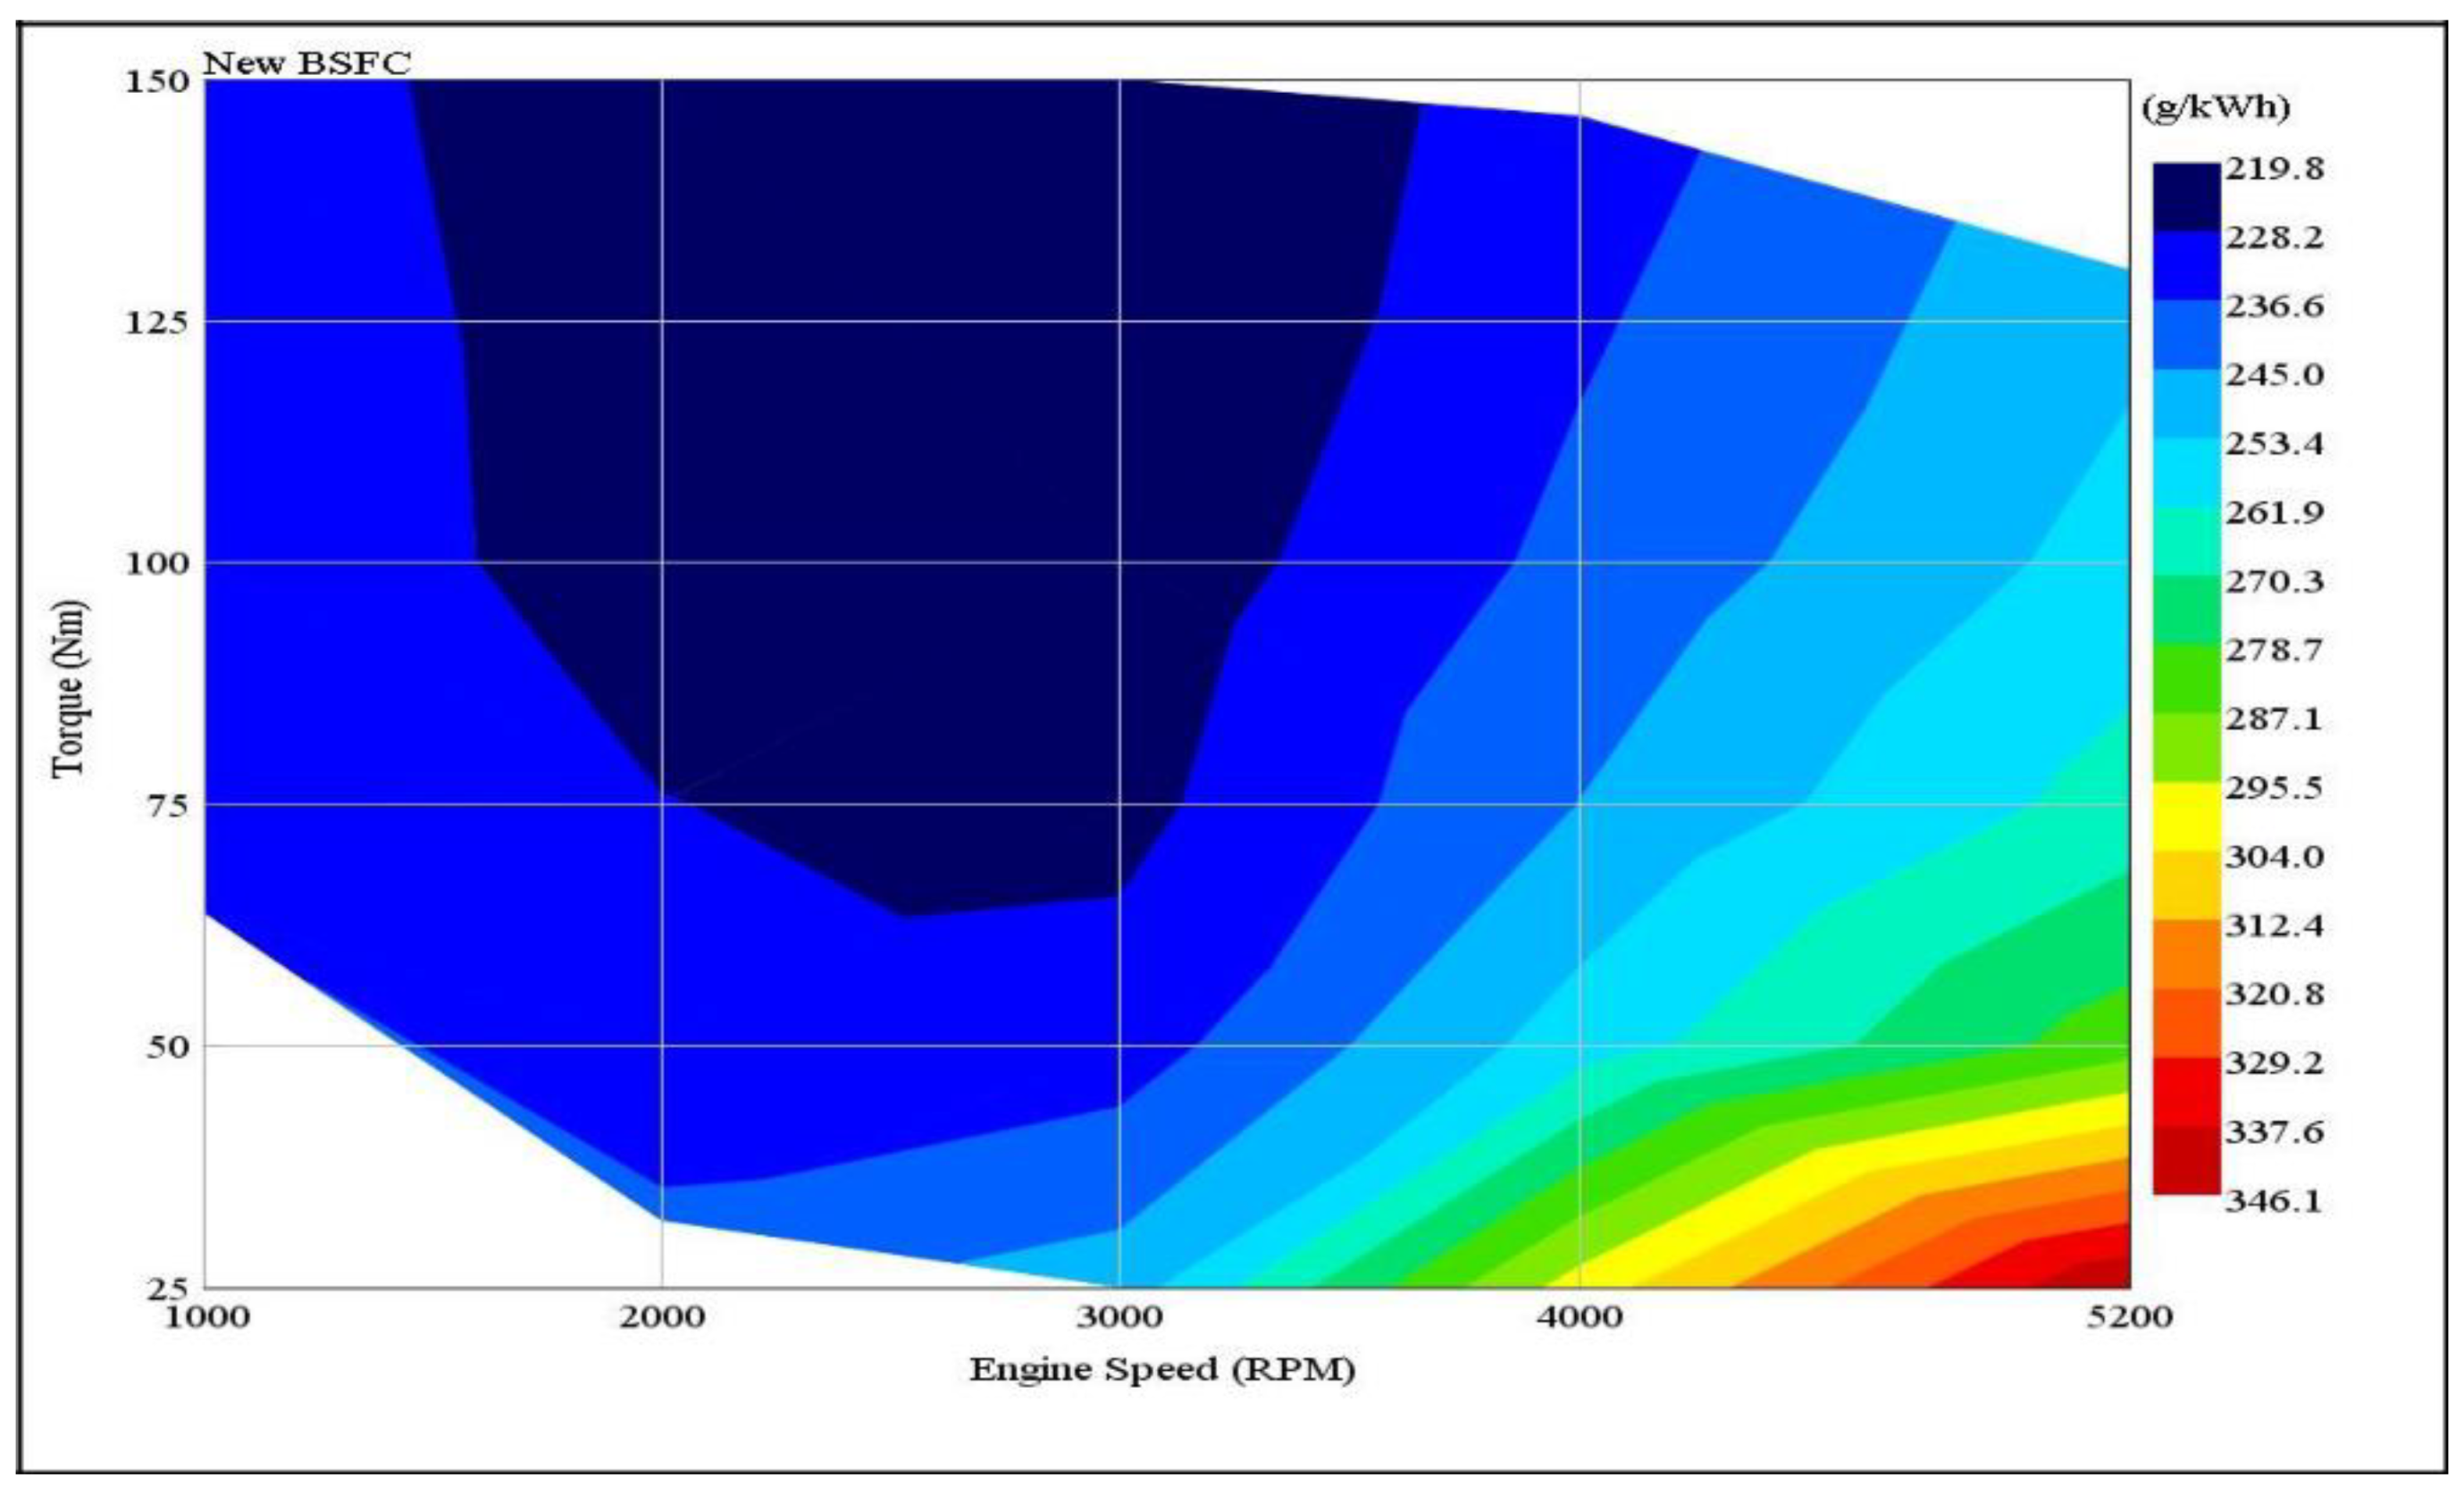
4.1. Engine Simulation

The engine model simulated showed the average efficiency of an ICE in Figure 8. The maximum efficiency of the engine was 36.88% operating at the lower engine speed with a high torque value. The engine was not very efficient at higher engine speeds. The remaining percentage of the efficiency is the waste heat that is released either to the cooling system or the exhaust.
The exhaust pressure and exhaust mass flow rate increased as the engine speed and torque increase (Figure 9 and Figure 10, respectively). The mass flow rate was in the range of 0.00598 kg/s to 0.6379 kg/s and the exhaust pressure was in the range of 1.006 bar to 1.139 bar when the engine speed operates between 1000 RPM to 5200 RPM with torque range from 25 to 150 Nm.
The increment in the temperature (Figure 11) of the exhaust was affected by the high pressure of the exhaust and the mass flow rate. The range of exhaust temperatures was from 326.5 ℃ to 664.2 ℃. The highest exhaust temperature occurred at the highest engine speed and torque. The TEG operates mainly based on the temperature difference. A higher temperature difference will produce more power through the TEG system. This means that the TEG system would be very efficient at a higher engine speed and torque to convert the waste heat into useful energy, as the maximum temperature difference occurs at this point.
The energy released by the exhaust was calculated using Equation (5). The amount of heat energy released by the exhaust was relatively affected by the exhaust temperature and the mass flow rate of the exhaust. As seen in Figure 12, the exhaust heat released does not significantly correlate with the efficiency of the engine. The highest heat released through the exhaust was not at the lowest engine efficiency. This is because the waste heat released was also rejected through the liquid coolant, lubrication oil or charge-air heat exchangers [22]. Hence, the highest amount of waste heat available for TEG to recover was at the highest engine speed and torque.

4.2. Thermoelectric Generator Simulation
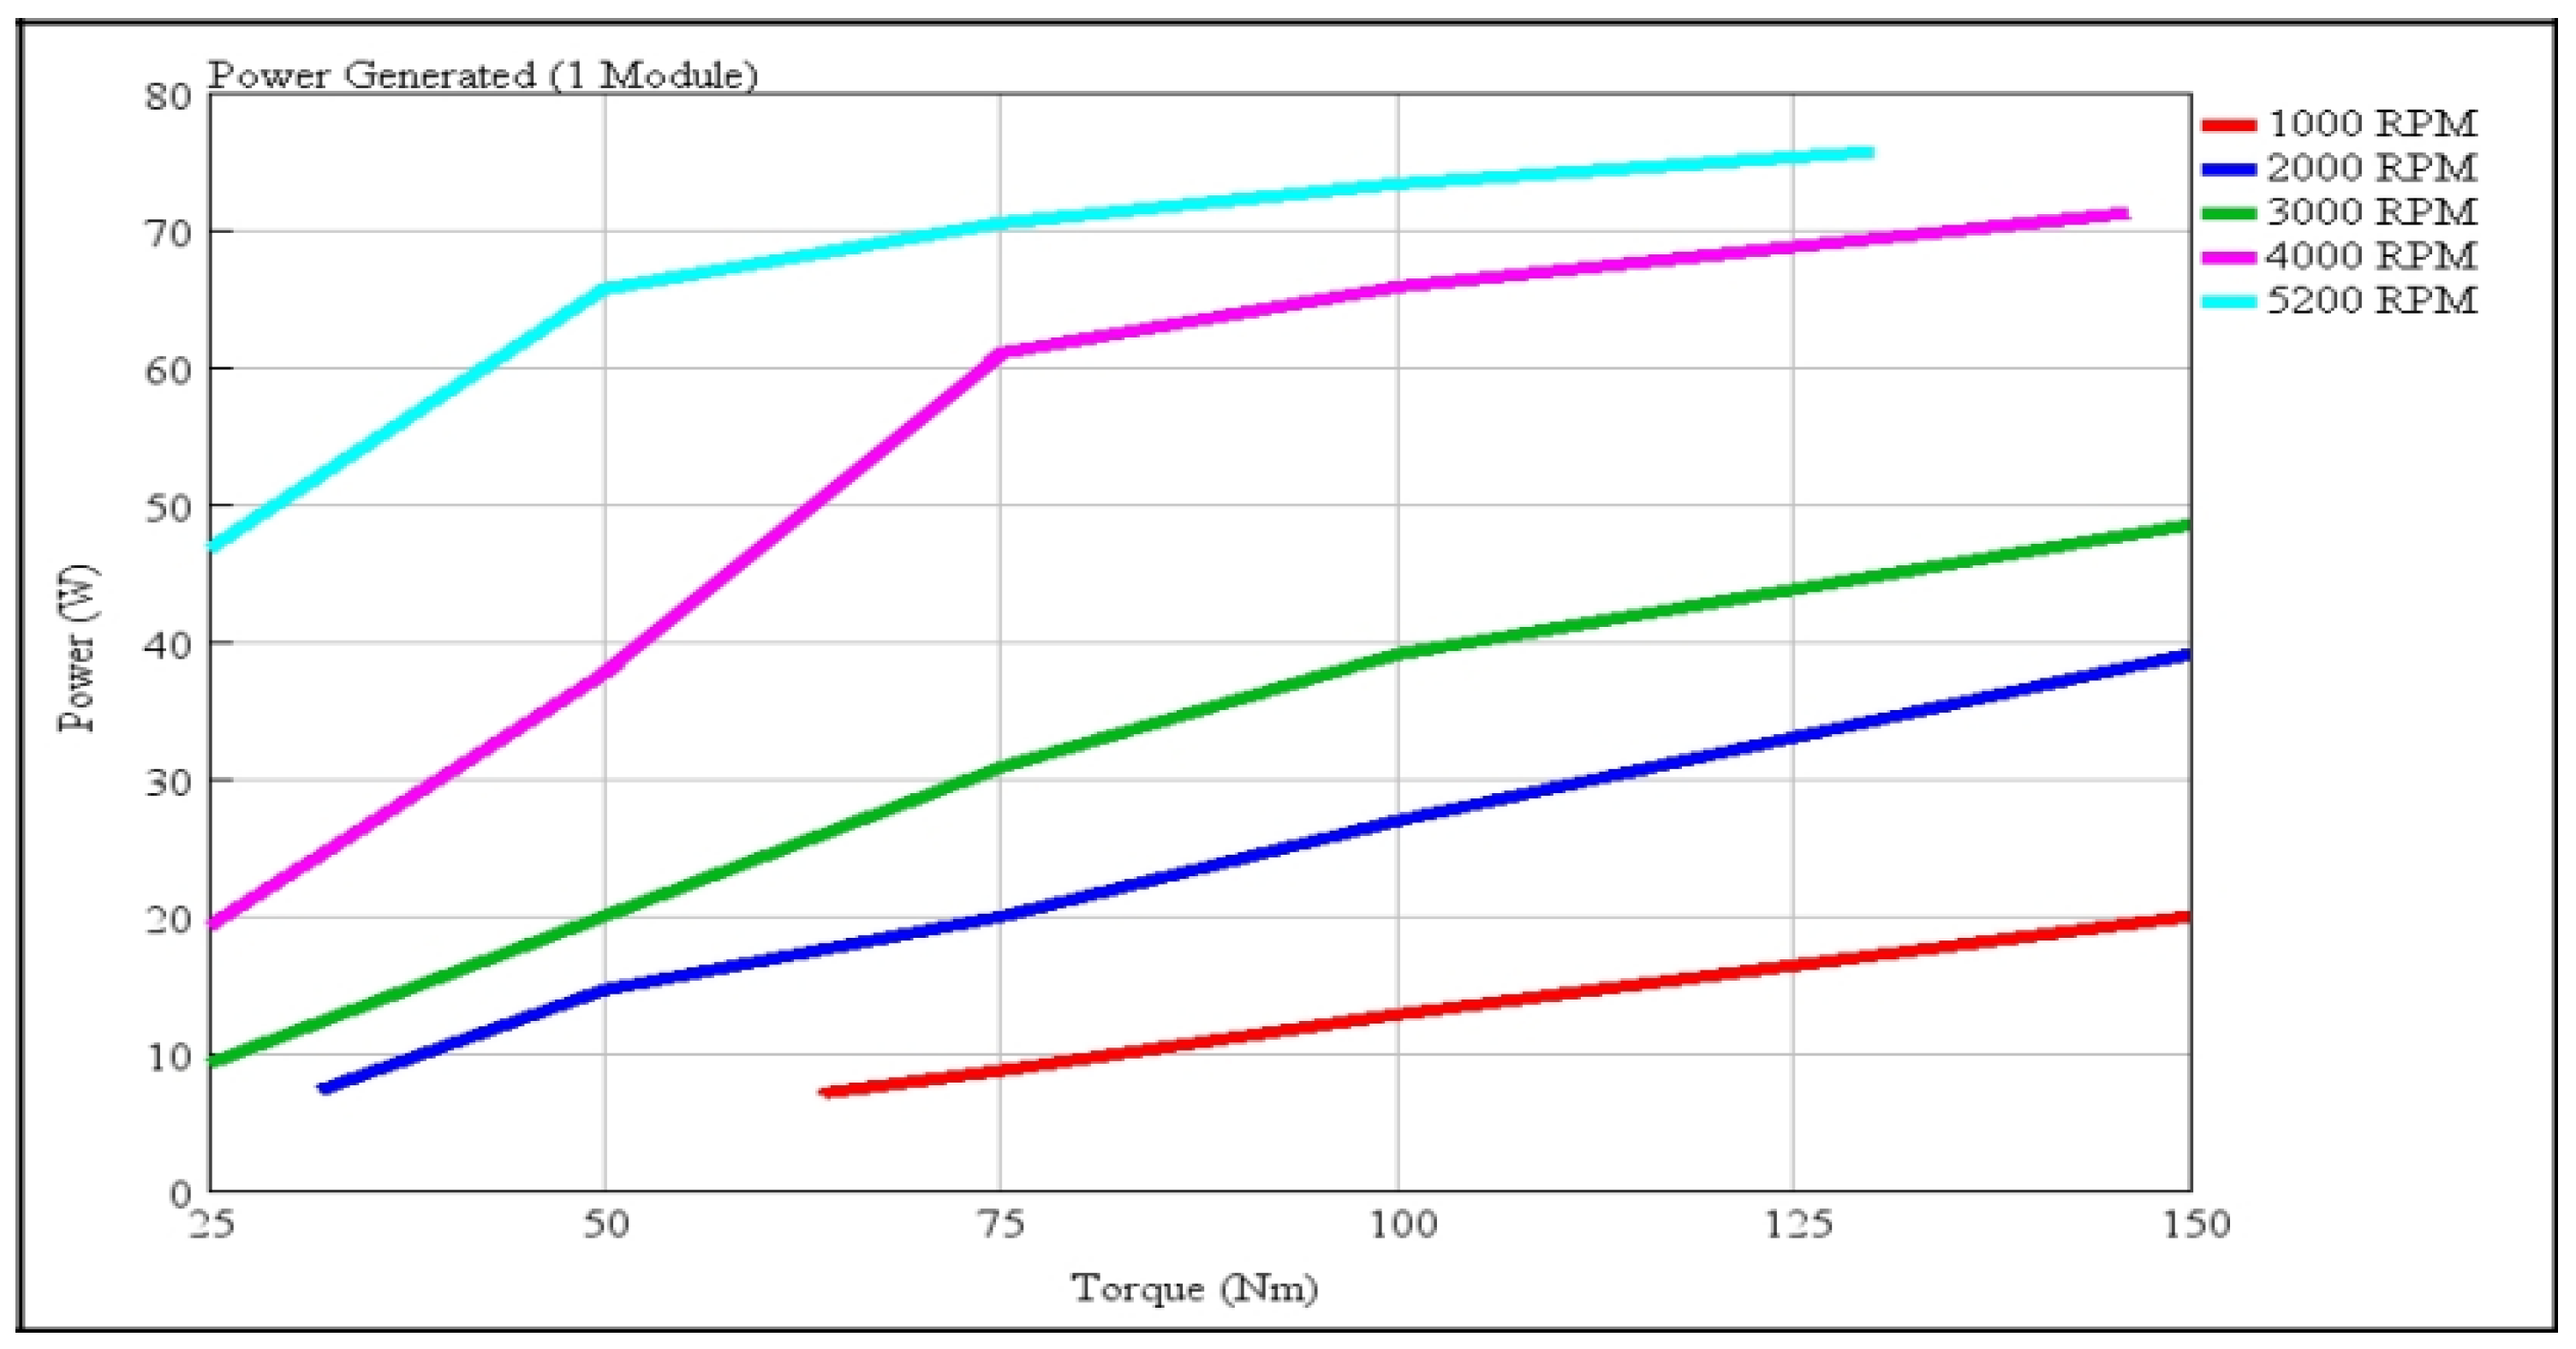
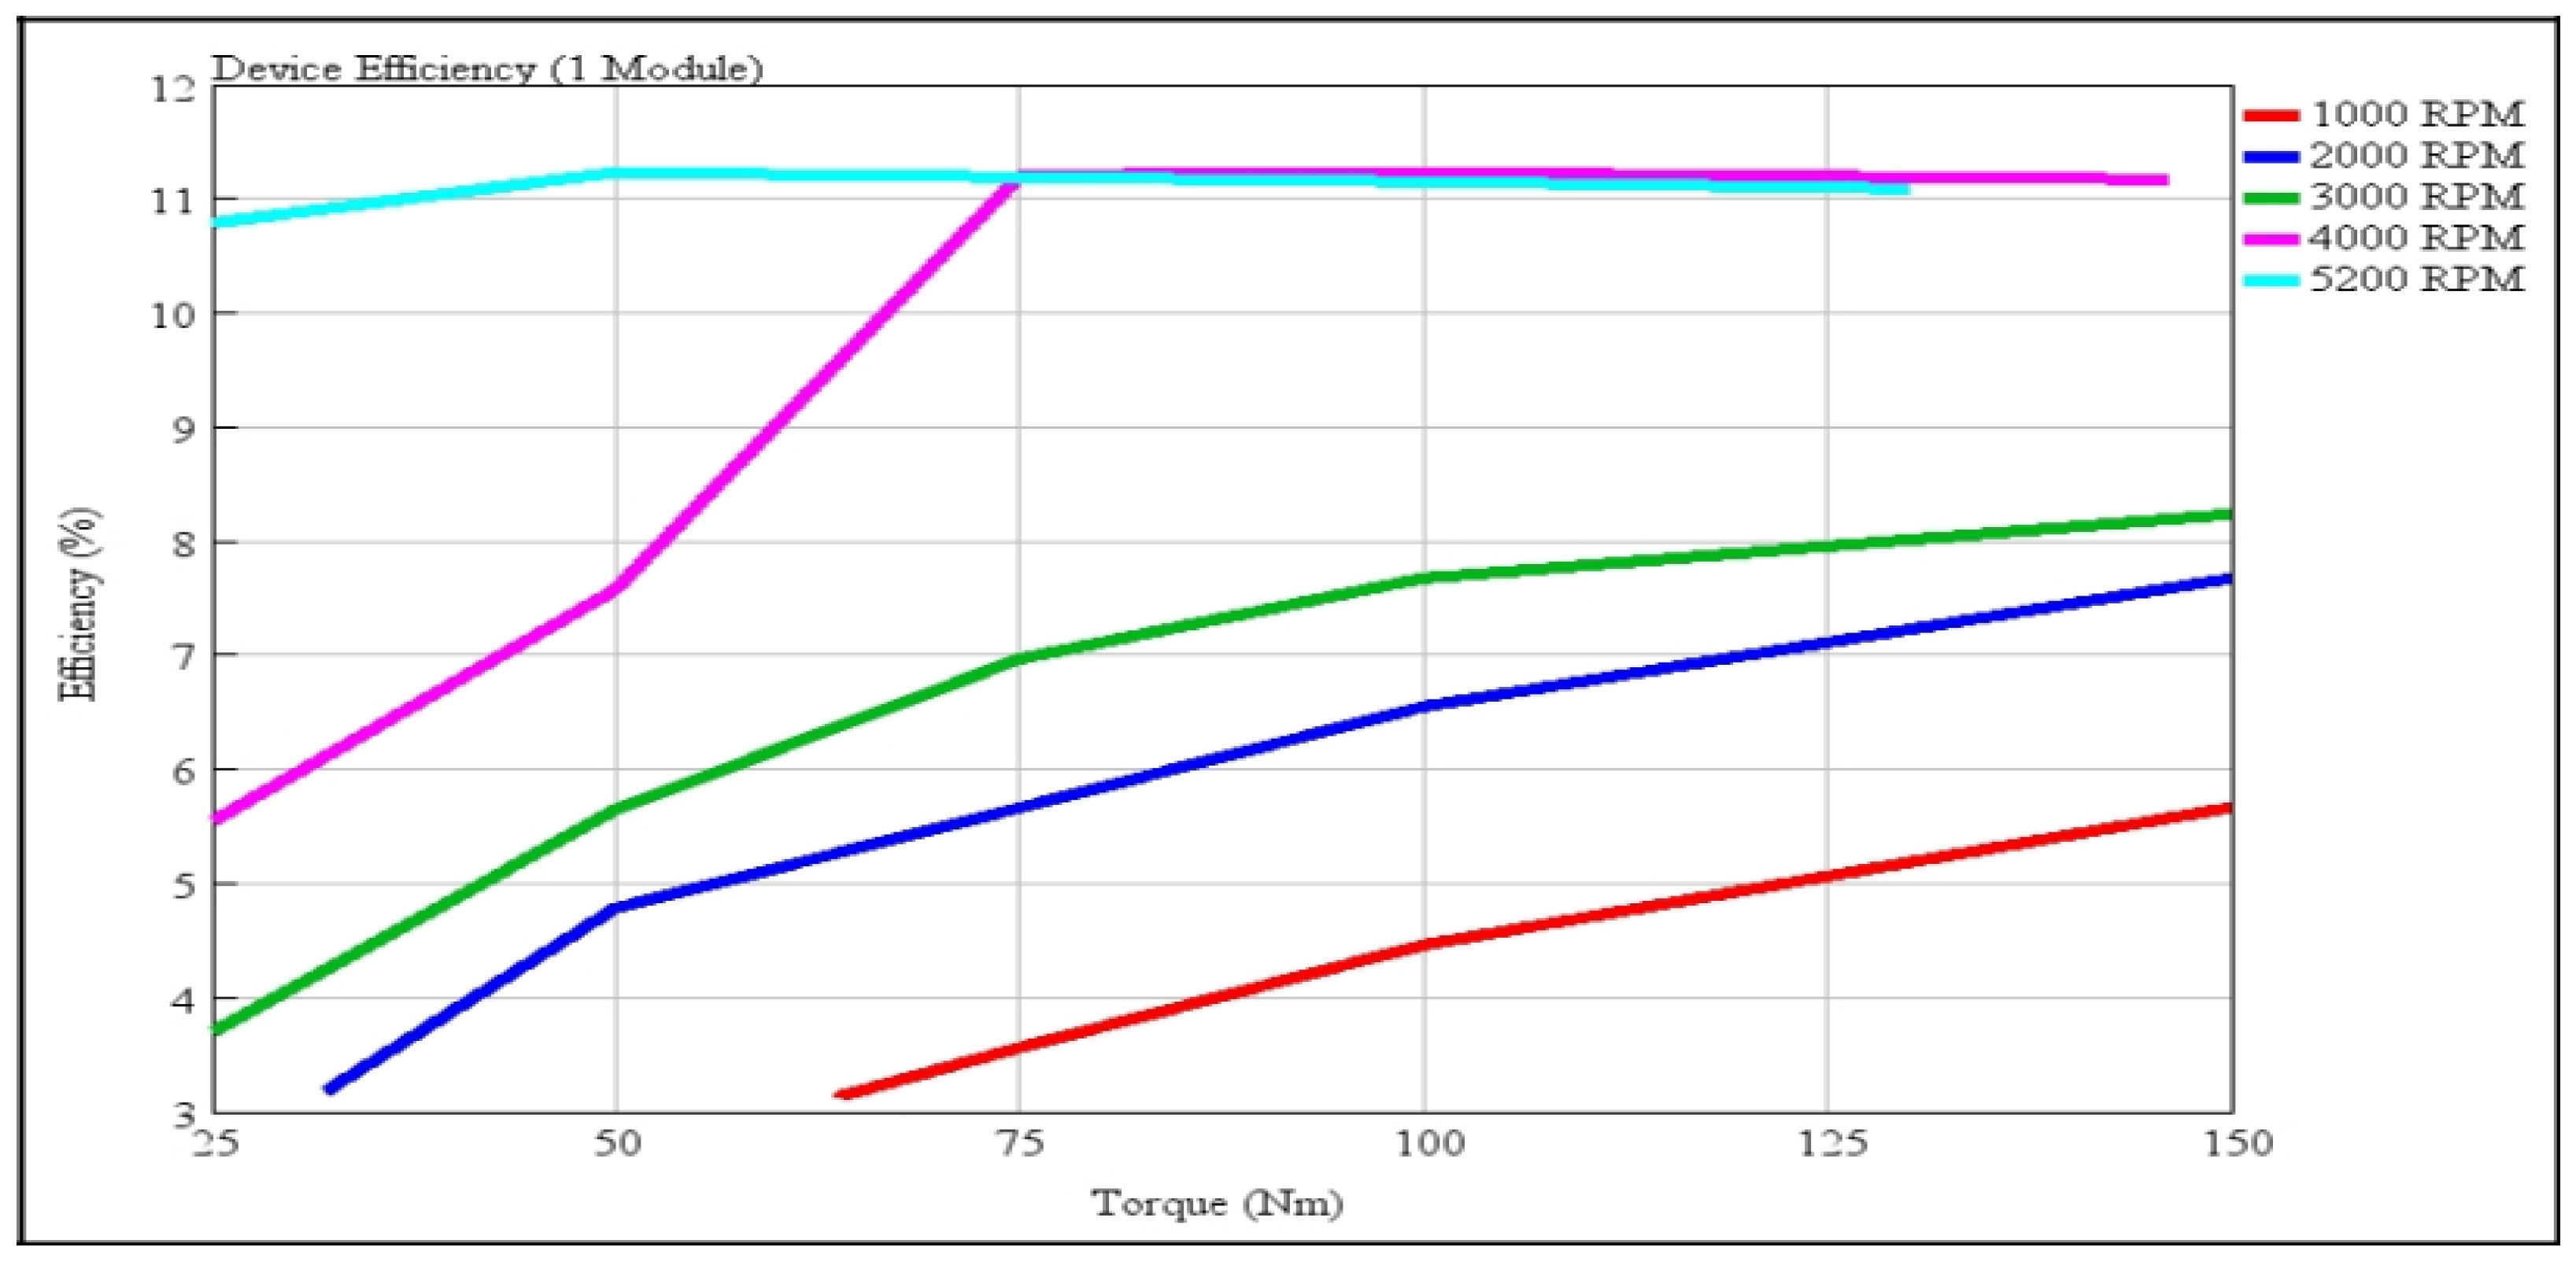
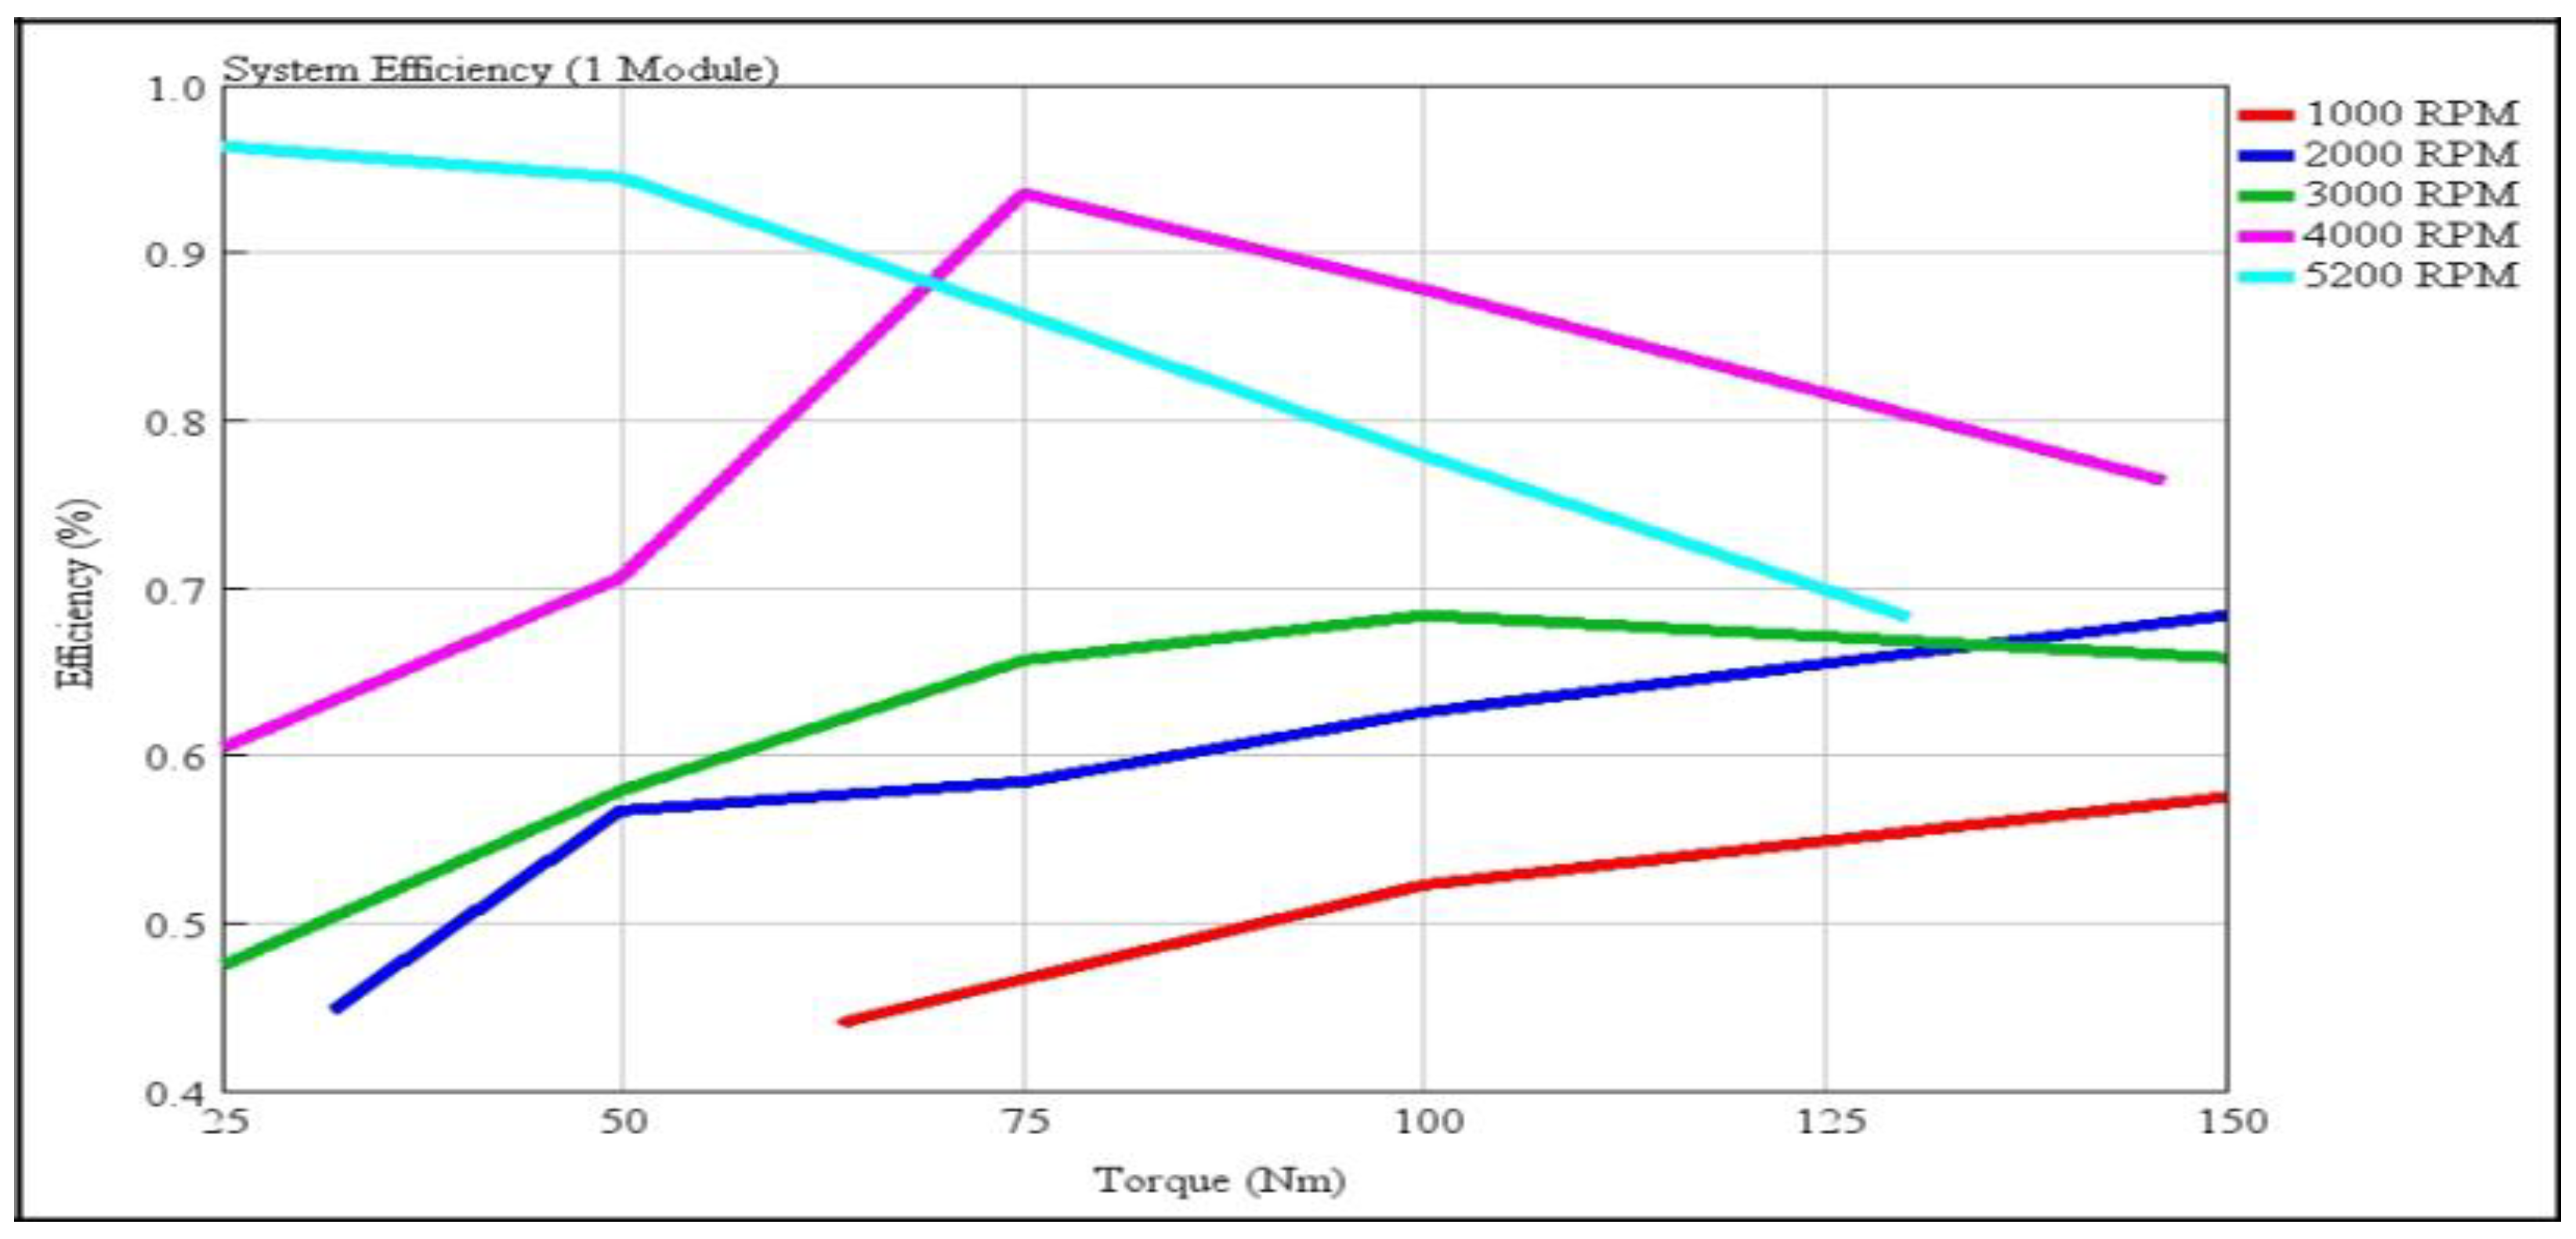
This section shows the effects of varying the parameters relevant to the TEG system operation. The work started with a single module of TEG with a size of 25 mm × 25 mm. The module was simulated at different engine speeds to study device efficiency and system efficiency of the TEG by varying the module size and materials used. The most efficient single module was selected to be added in series. Different numbers of modules were investigated.

4.2.1. Module

The power generated is illustrated in Figure 13 and arises due to the voltage produced across the device, known as the Seebeck effect. The module can generate a maximum power of 75 W at the highest engine speed. This is because the highest temperature difference can be achieved at the highest engine speed. A higher temperature difference will produce a bigger voltage.
Figure 14 shows how efficient the TEG device was in converting the heat energy at the input into electrical power. The maximum device efficiency was around 11%. This was nearly the highest efficiency that a TEG device can achieve, according to [16]. This high device efficiency was achieved because of the usage of the materials that have a higher Seebeck coefficient. The materials used for this simulation can also withstand a higher temperature, which was 900 K or 627 ℃. The low efficiency of TEG previously, which was 5% BiTe, was achieved due to the maximum temperature that the materials can withstand which is 250 ℃. The system efficiency (Figure 15) was less than 1% due to a very small value of power generated compared to the heat released by the exhaust. Hence, one module of TEG is not suitable to be used as a WHR system due to the lower relative power it can generate, making investment in the integration of the technology with these characteristics hard to justify.

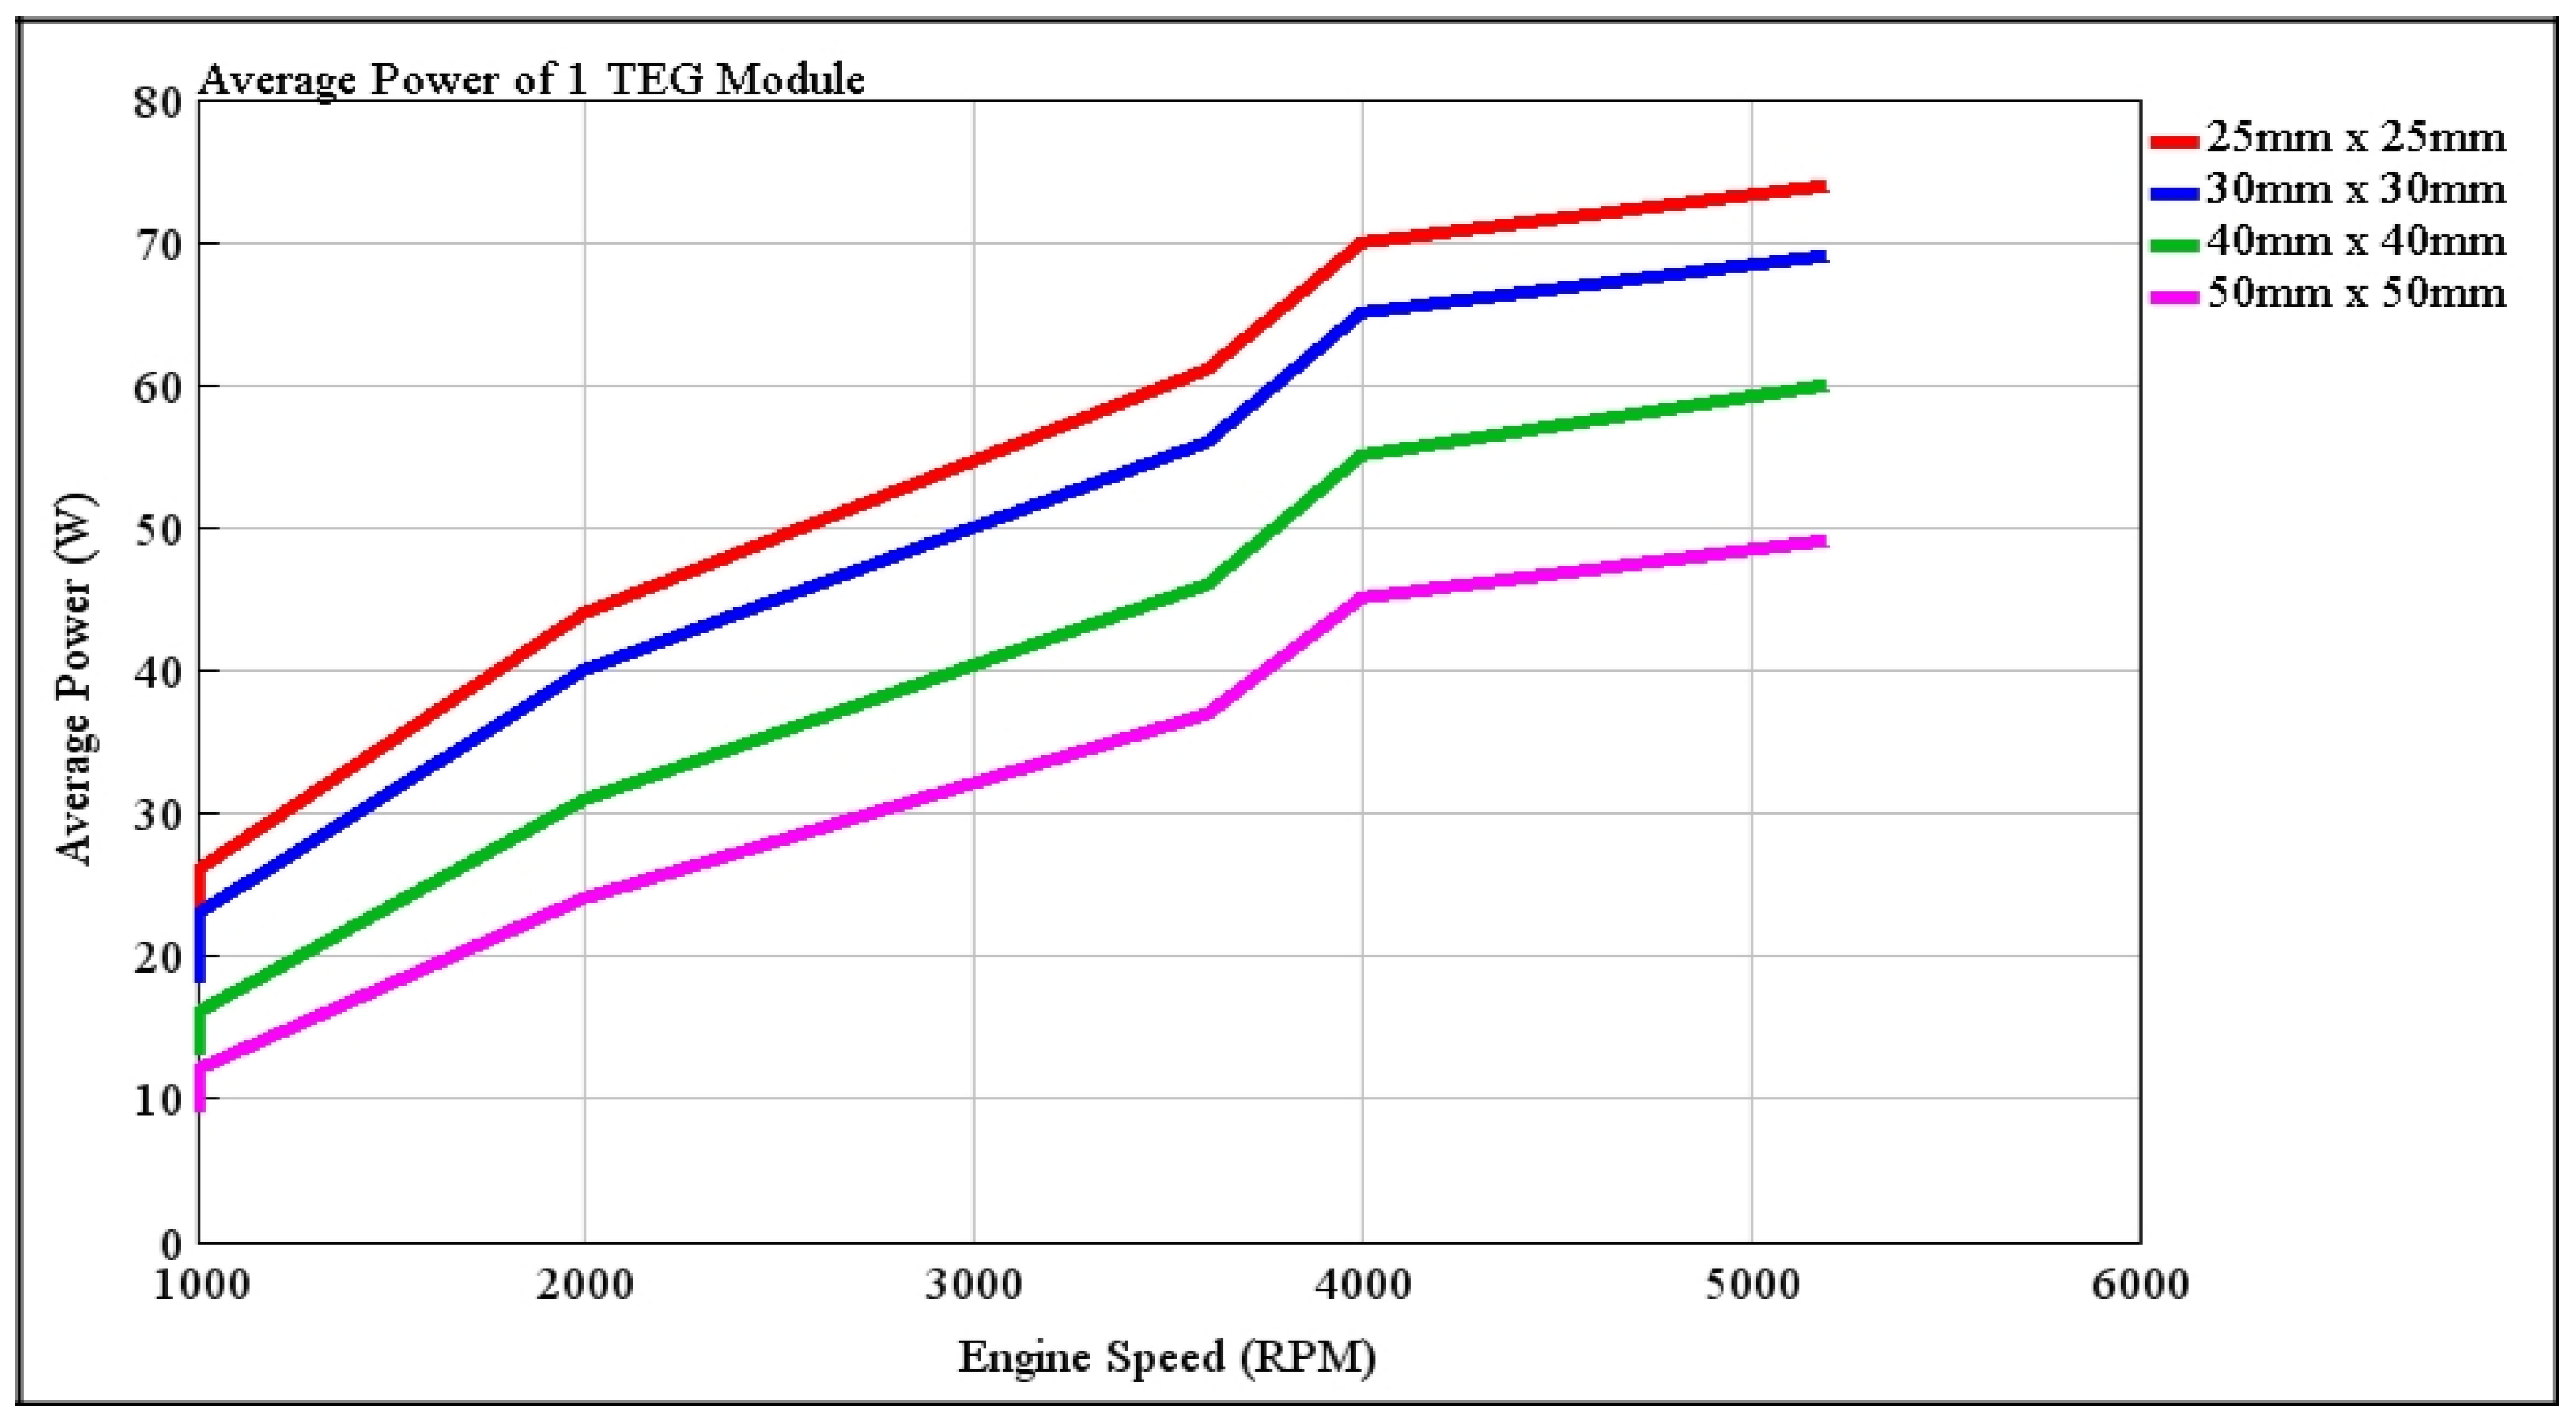
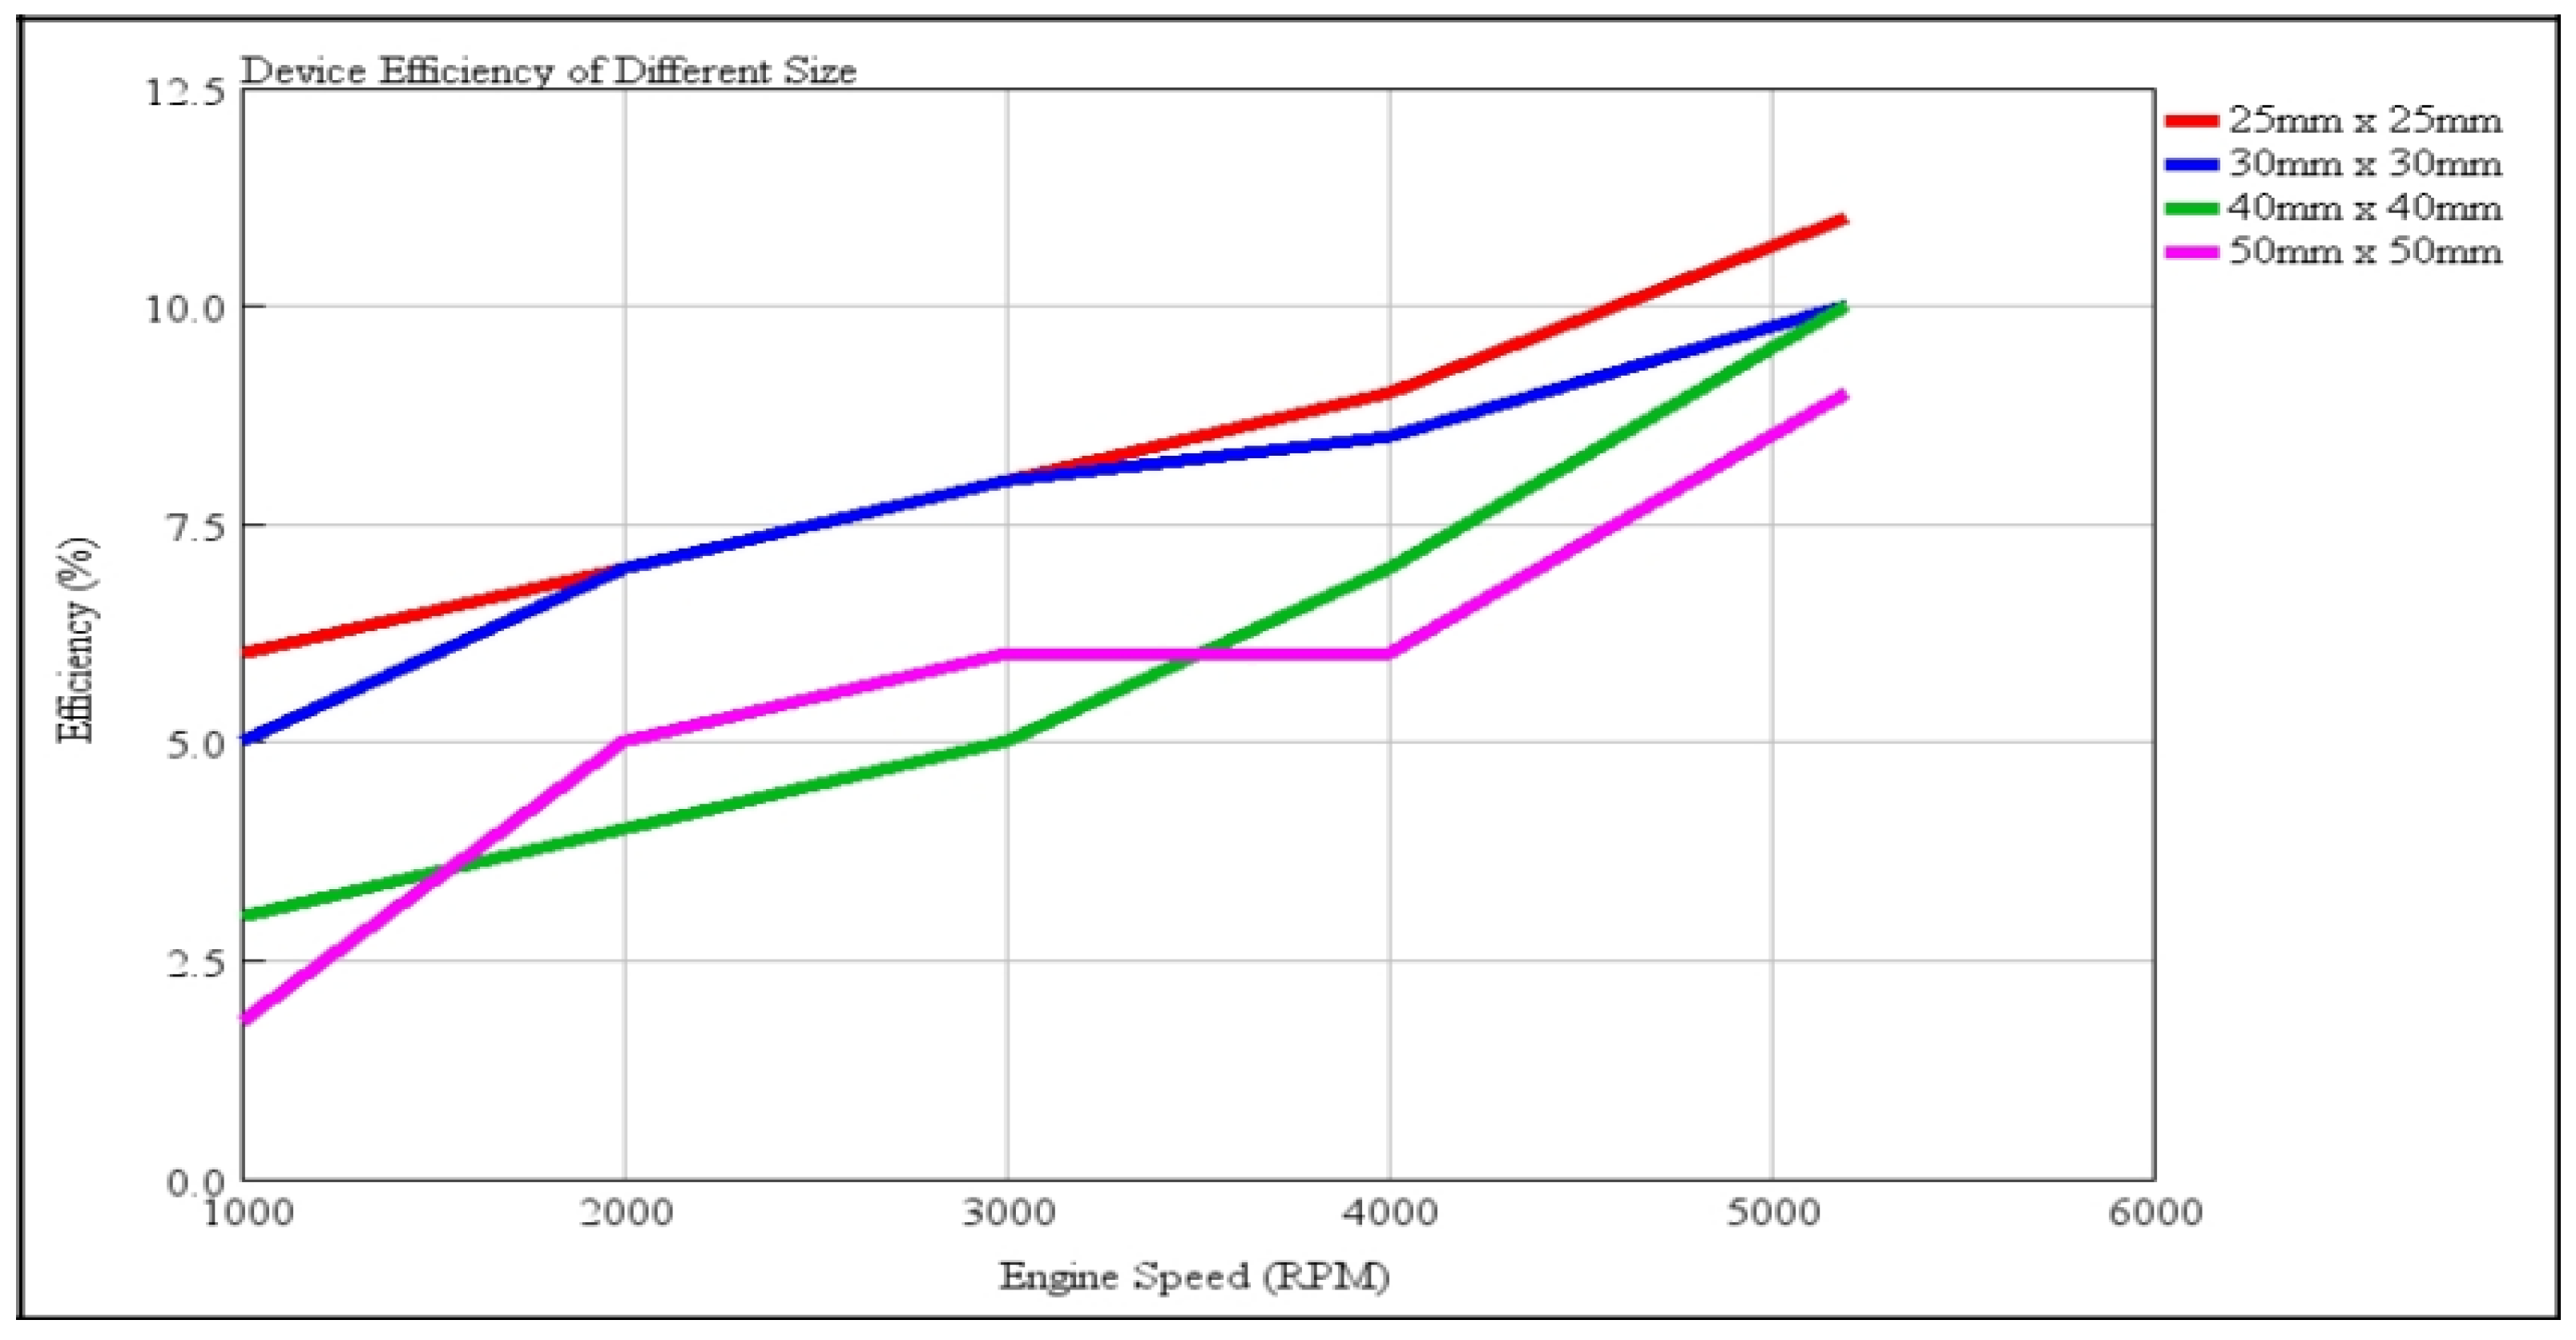
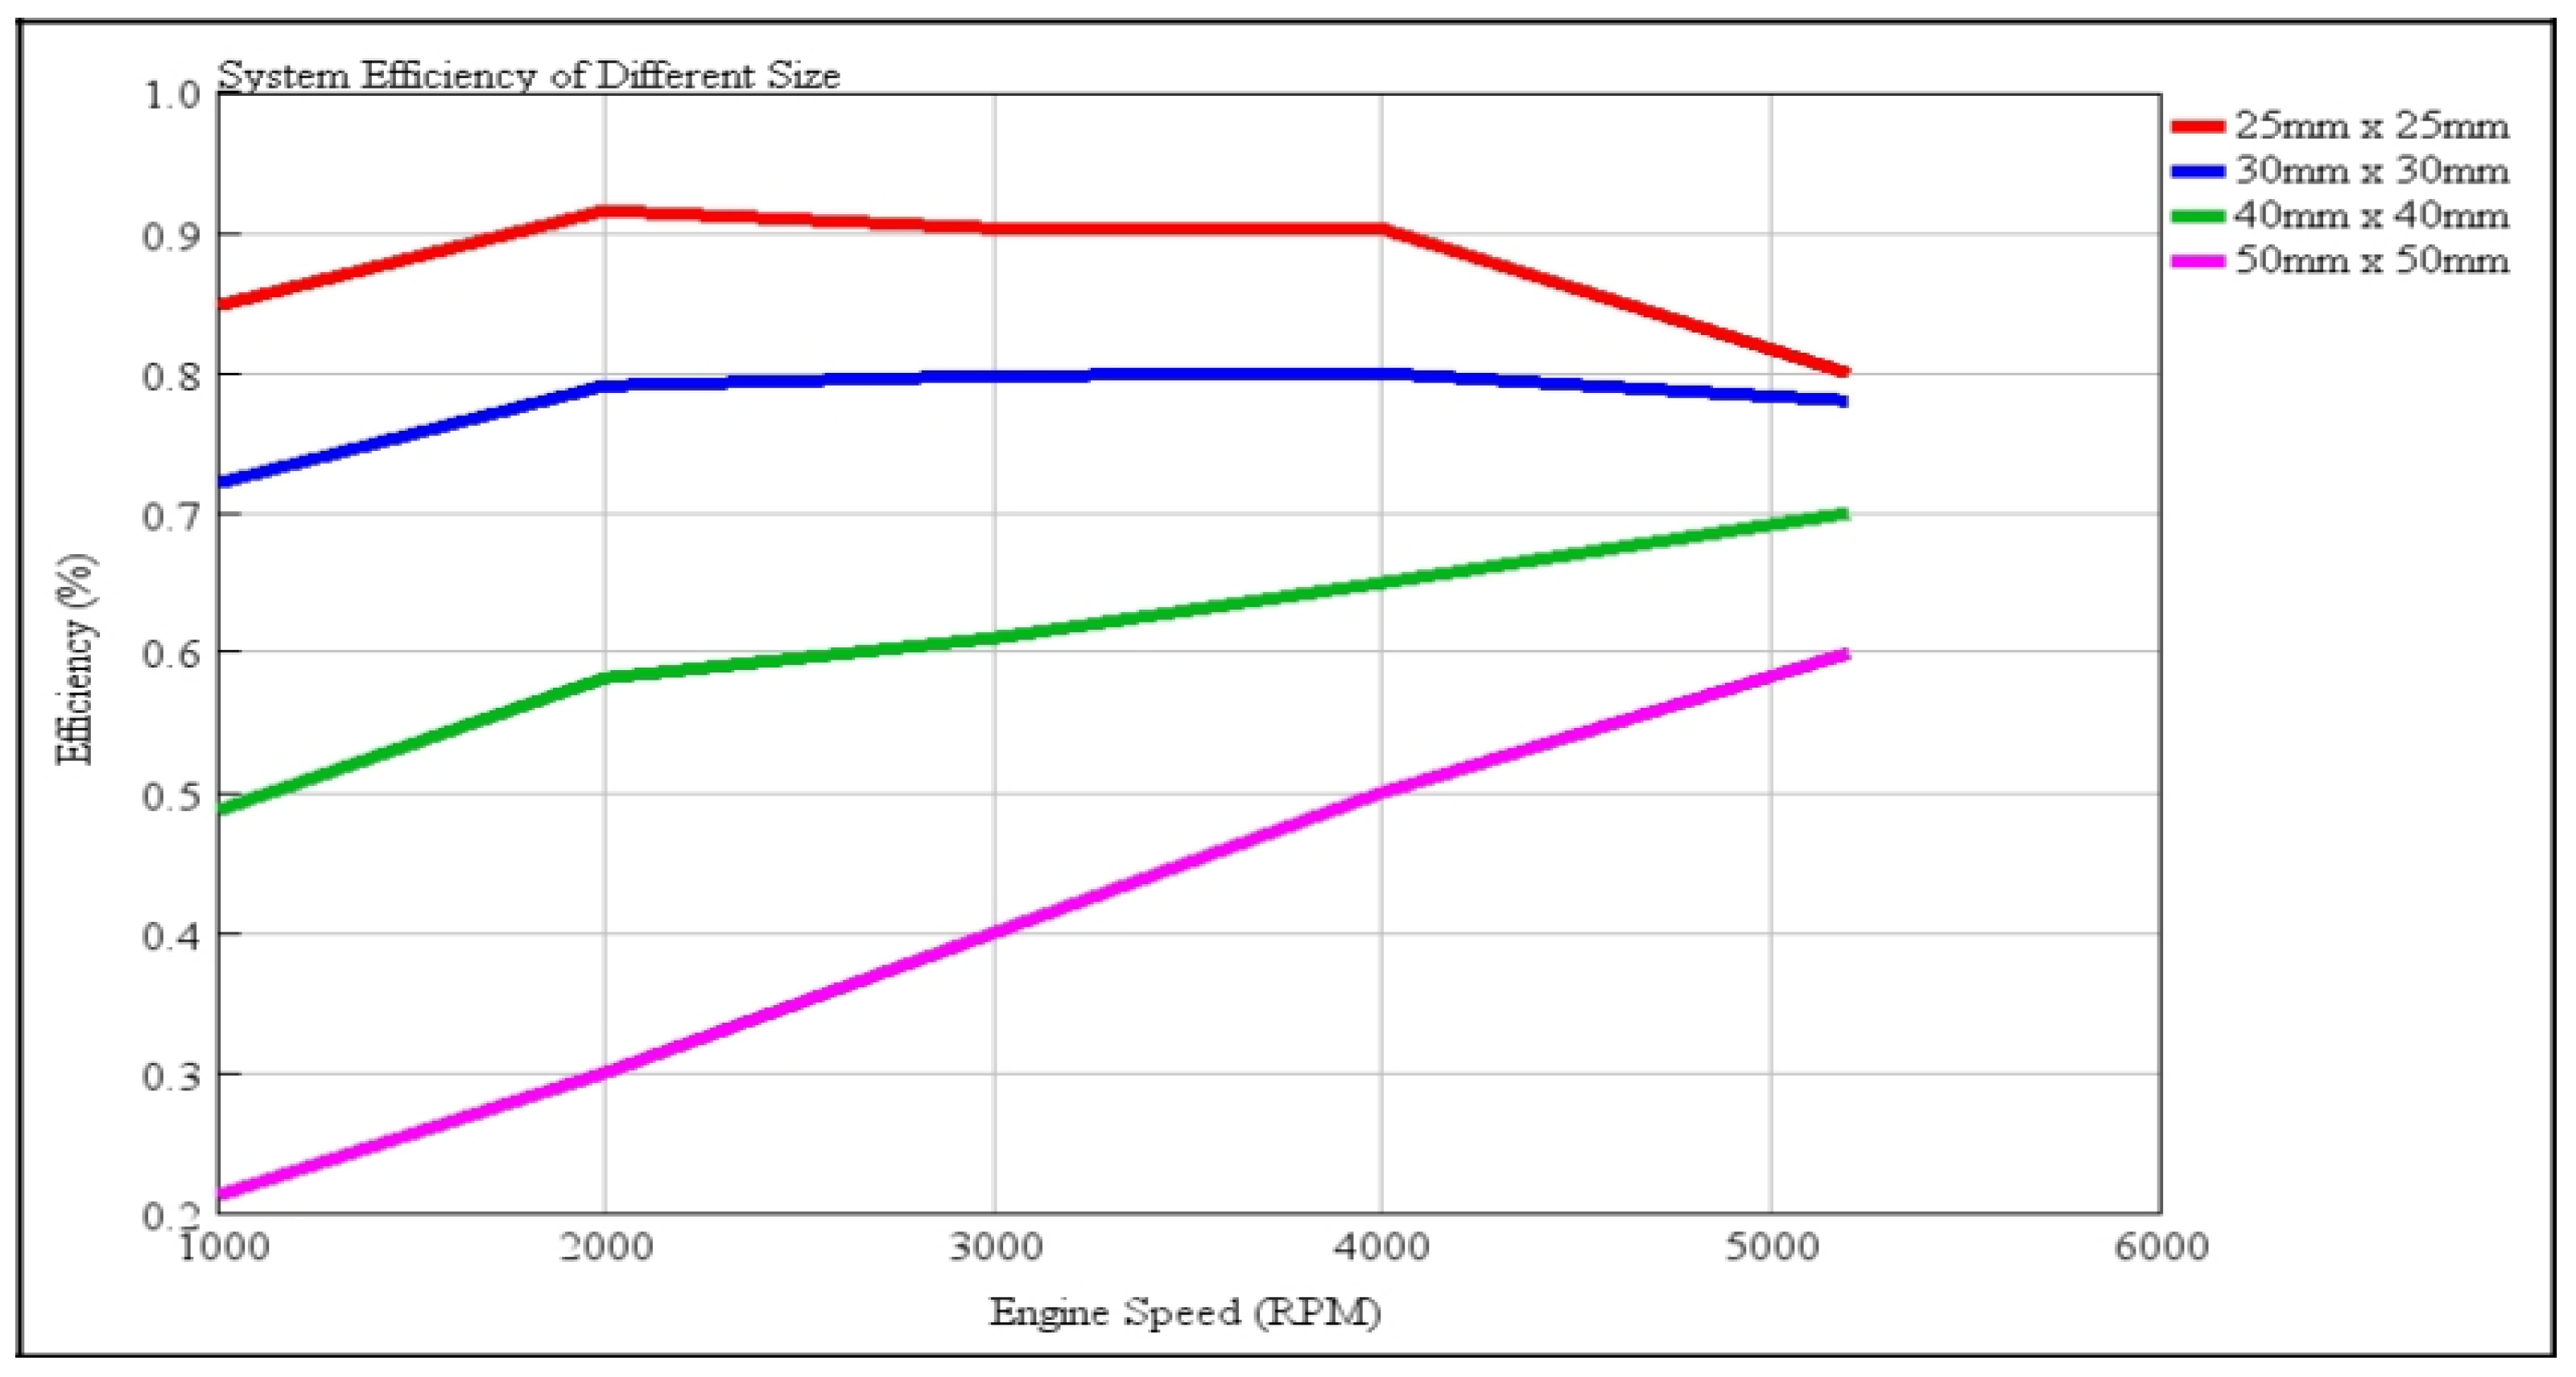
4.2.2. TEG with Different Size

As the size of TEG was increased, the power generated decreased (Figure 16). This is due to the higher thermal inertia associated with larger modules (time to transfer the heat across the module). This makes the heat transfer rate across the module slow, and the temperature difference across the module for a short period of time was lower as well. The module needs a larger temperature difference to occur to produce more power.
As mentioned in Section 4.2.1, one module of TEG was not efficient in converting a larger amount of heat released through the exhaust. Changing the size of the TEG module also could not make the TEG generate more power, instead a bigger size of module generated less. Similarly, both device (Figure 17) and system (Figure 18) efficiencies suffered with the larger, single module as a result of the reduction in power produced in the first place (effect of Equations (1) and (2)).

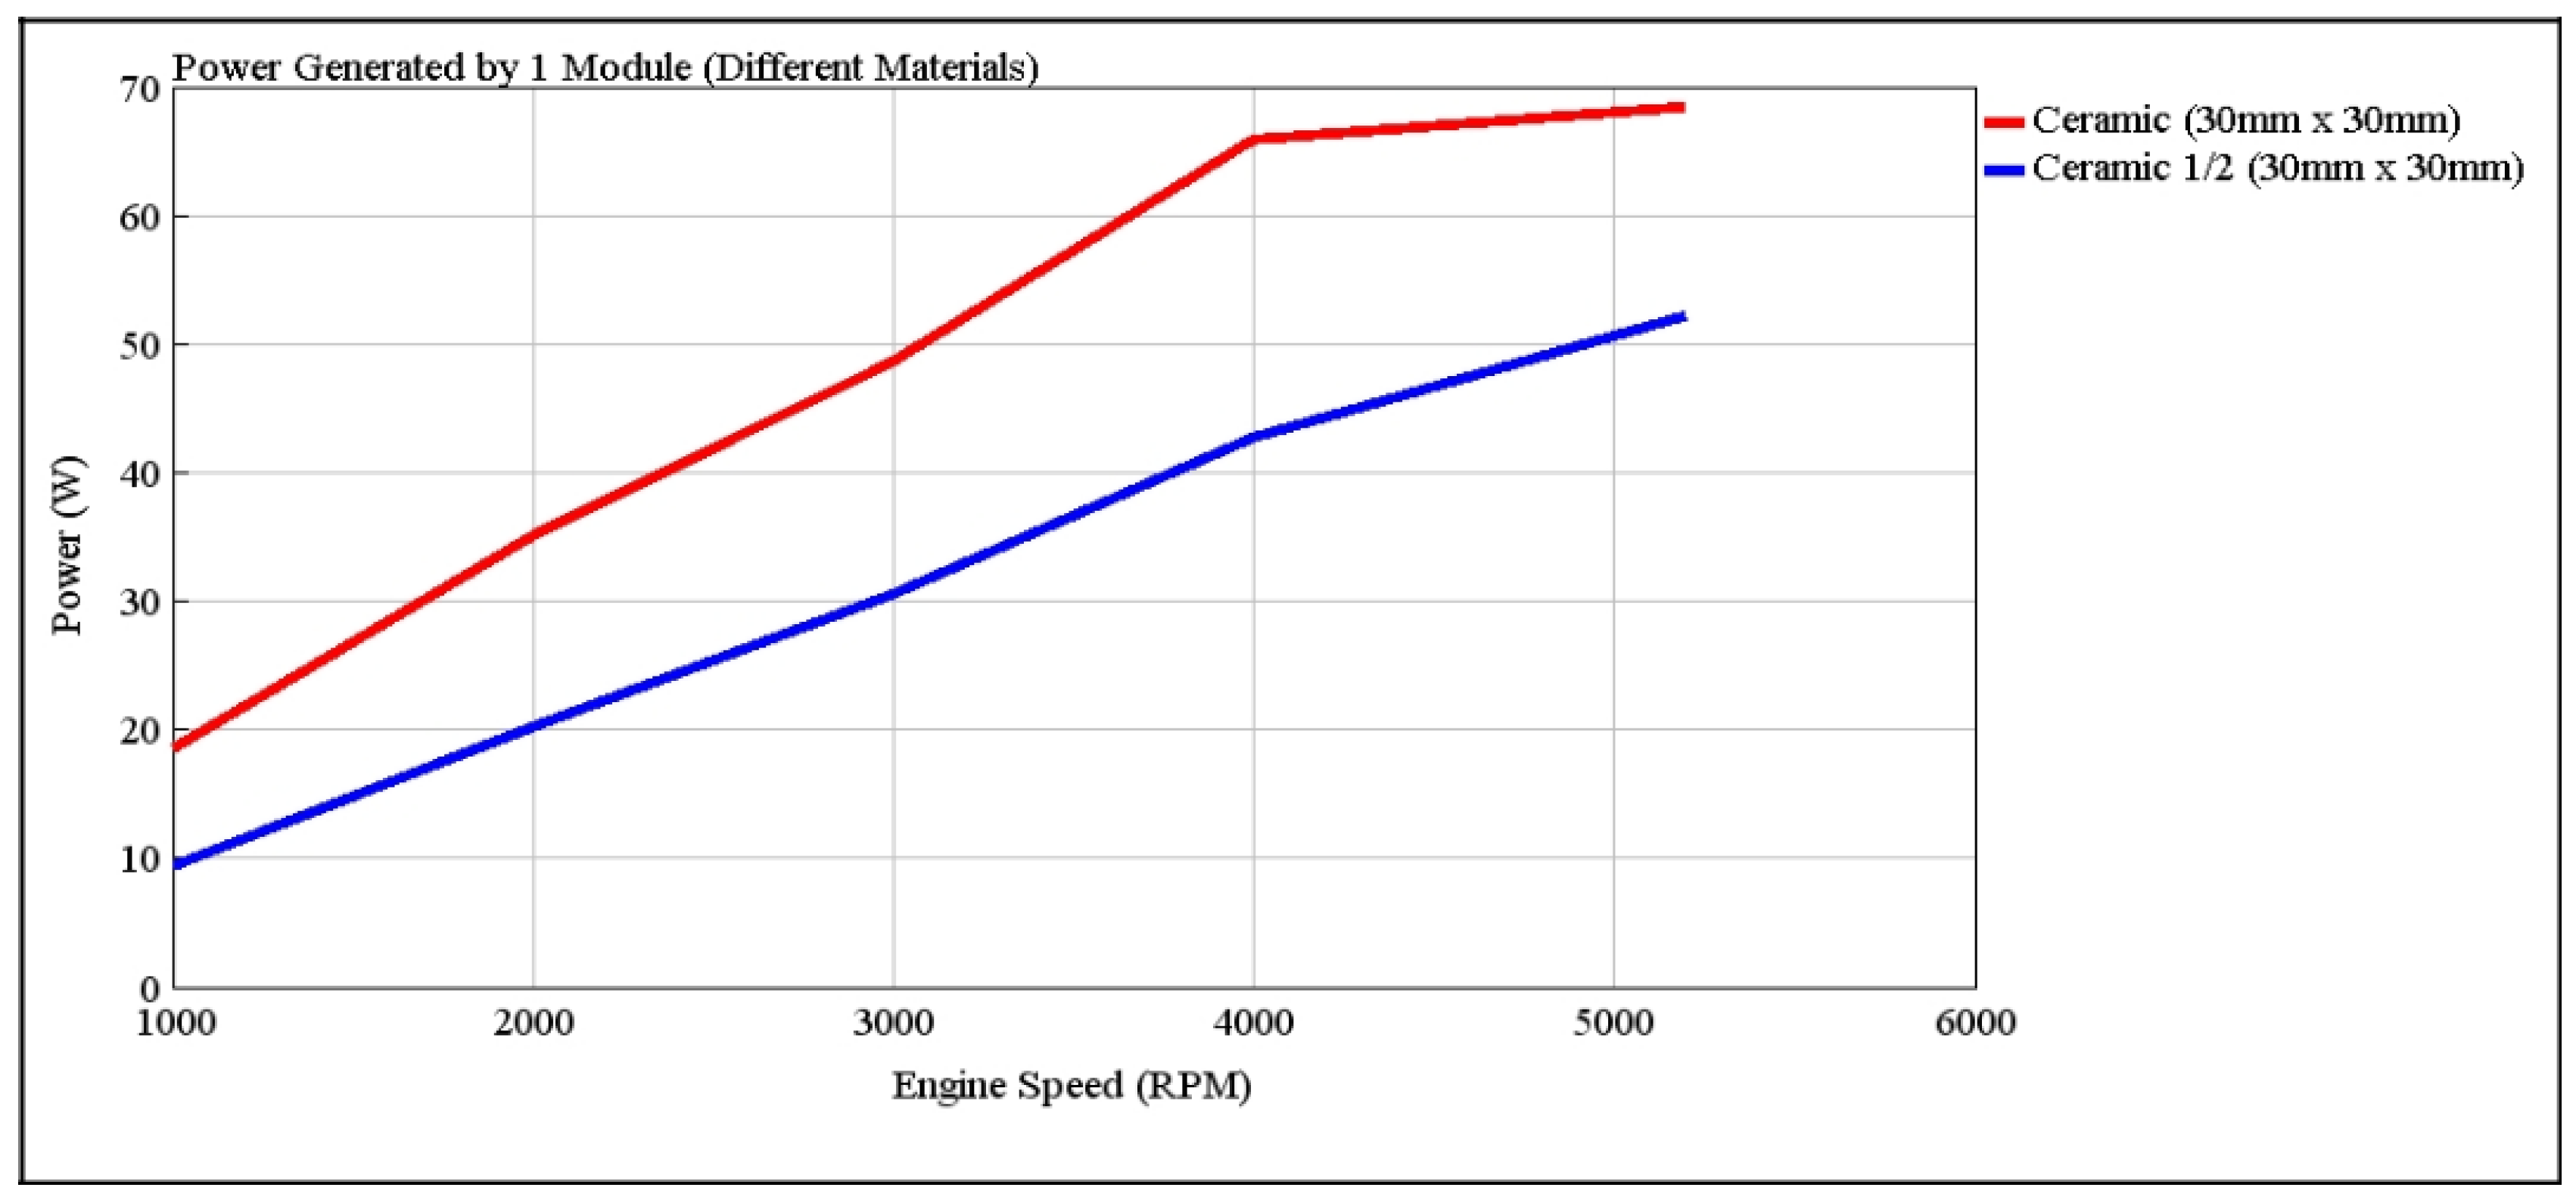
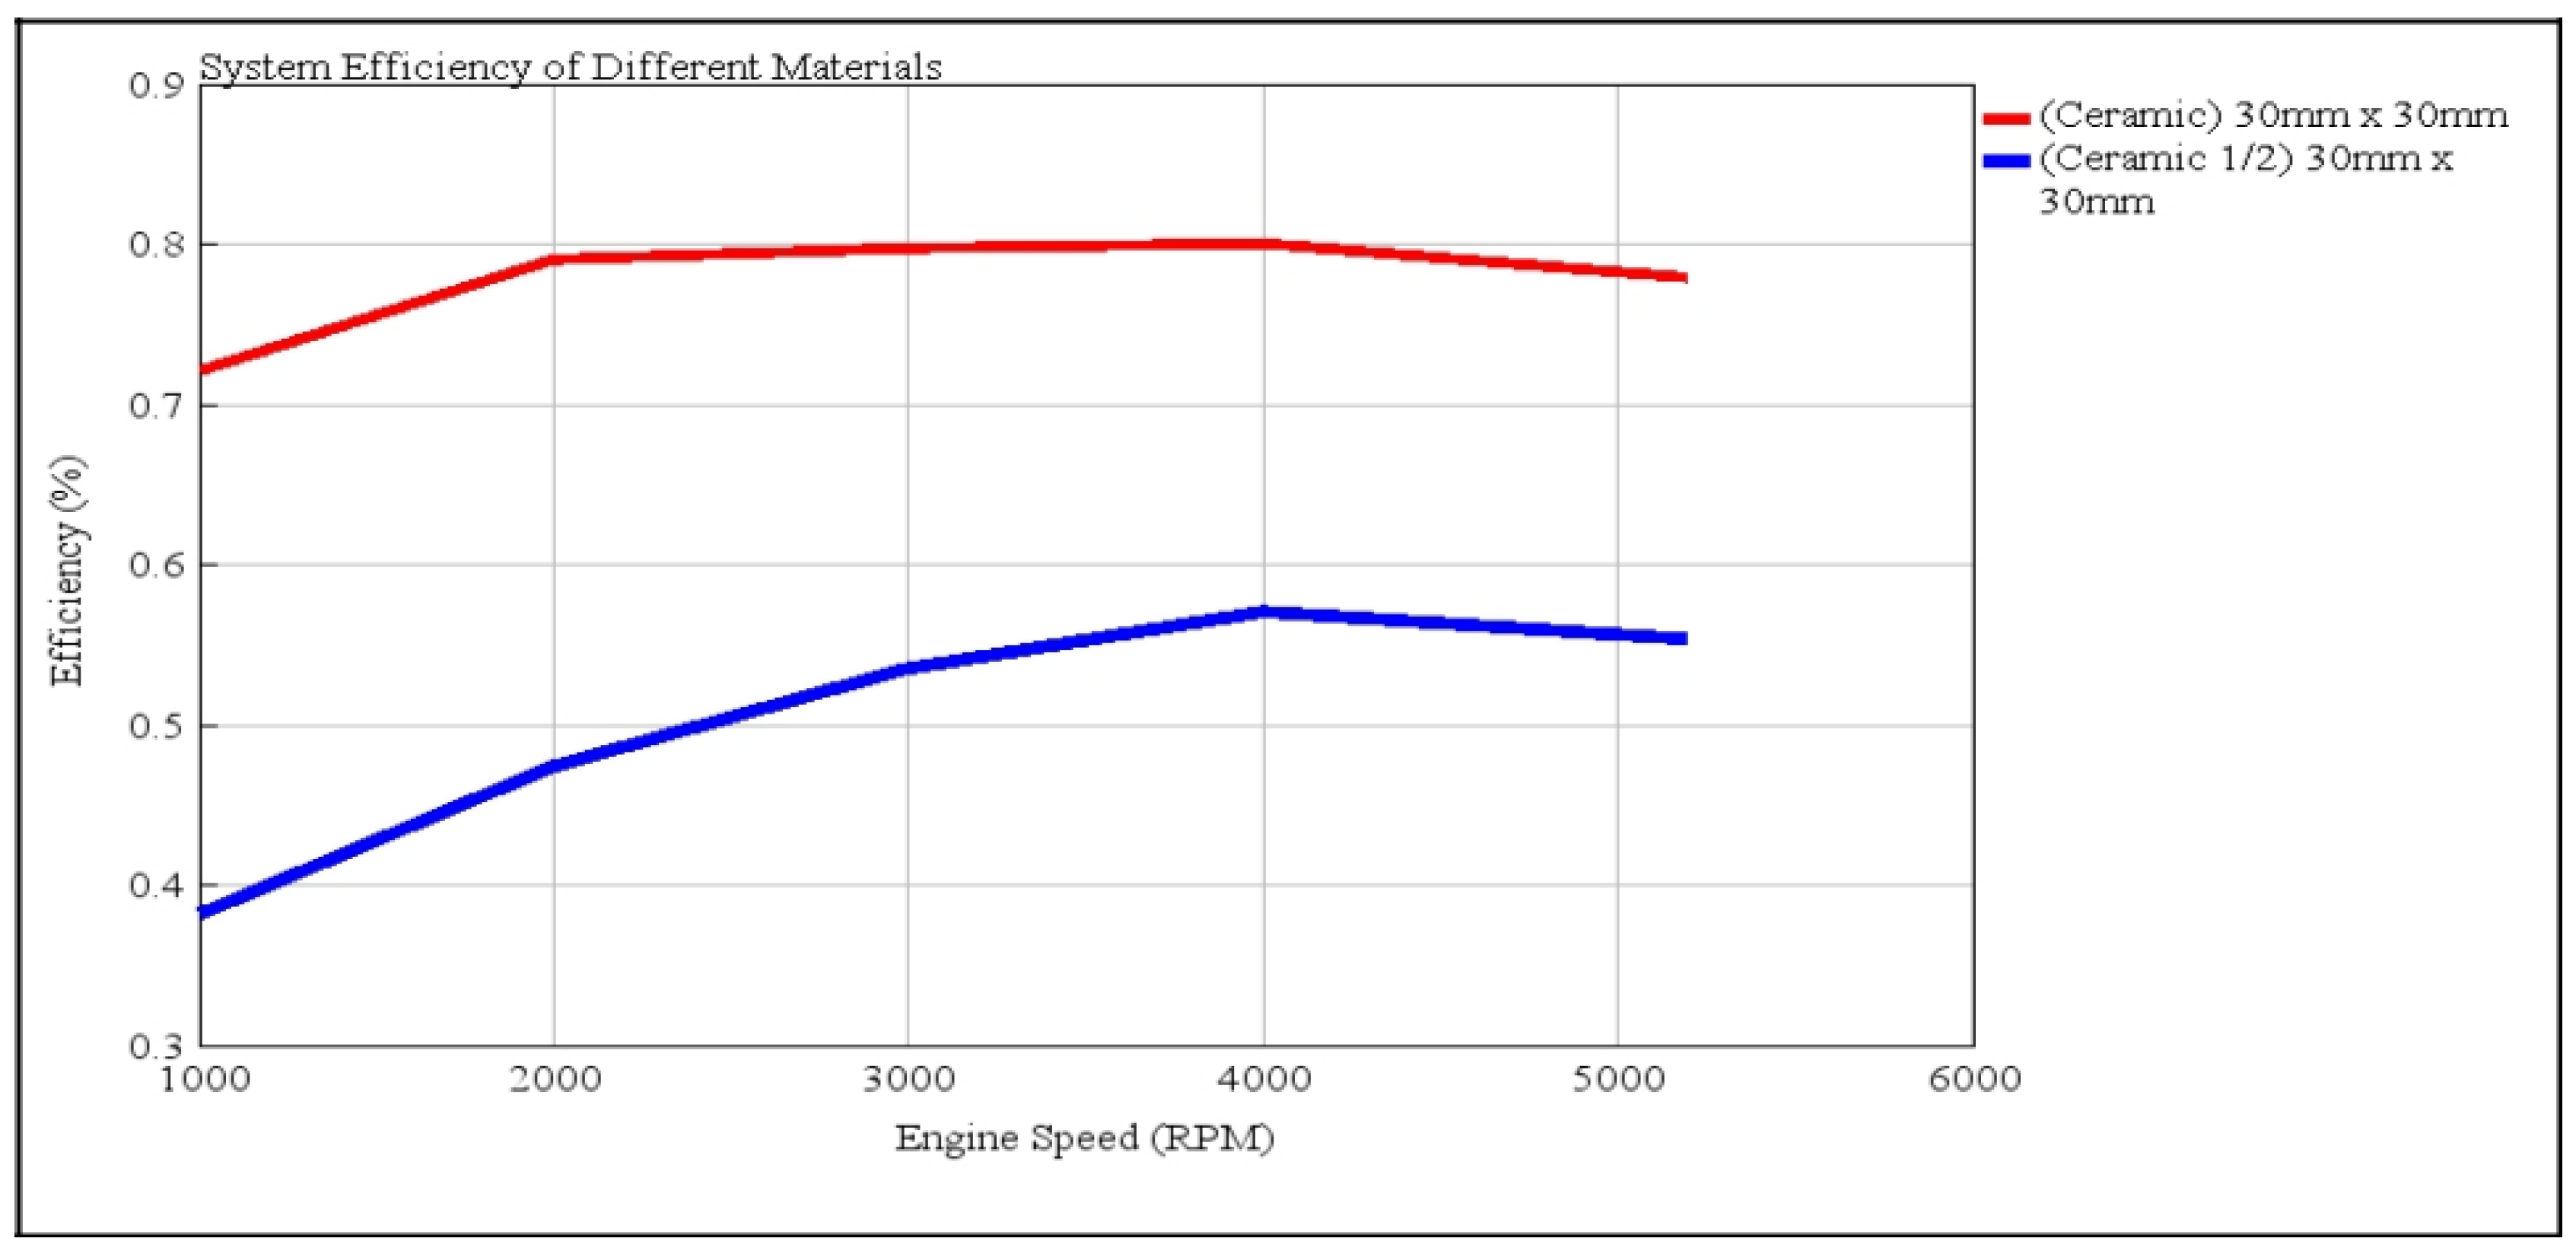
4.2.3. TEG with Different Materials

The changing of different materials was simulated by reducing the Seebeck coefficient (S) of the same materials used by half by keeping other parameters such as thermal conductivity (k) and electrical conductivity (ρ) the same. This change made the figure of merit (ZT) change to a smaller value.
In Figure 19 and Figure 20 it can be seen that the power generated and the efficiency of TEG can be varied by the changing material used for TEG. Ceramic was the material used for all TEG simulations in this research and Ceramic 1/2 was the reduced S value to show the effect of a smaller ZT material. Ceramic produced more power and higher efficiency than Ceramic 1/2. A higher material ZT value should be chosen to generate higher power and efficiency. The results of higher efficiency with a higher ZT value were in agreement with [16].

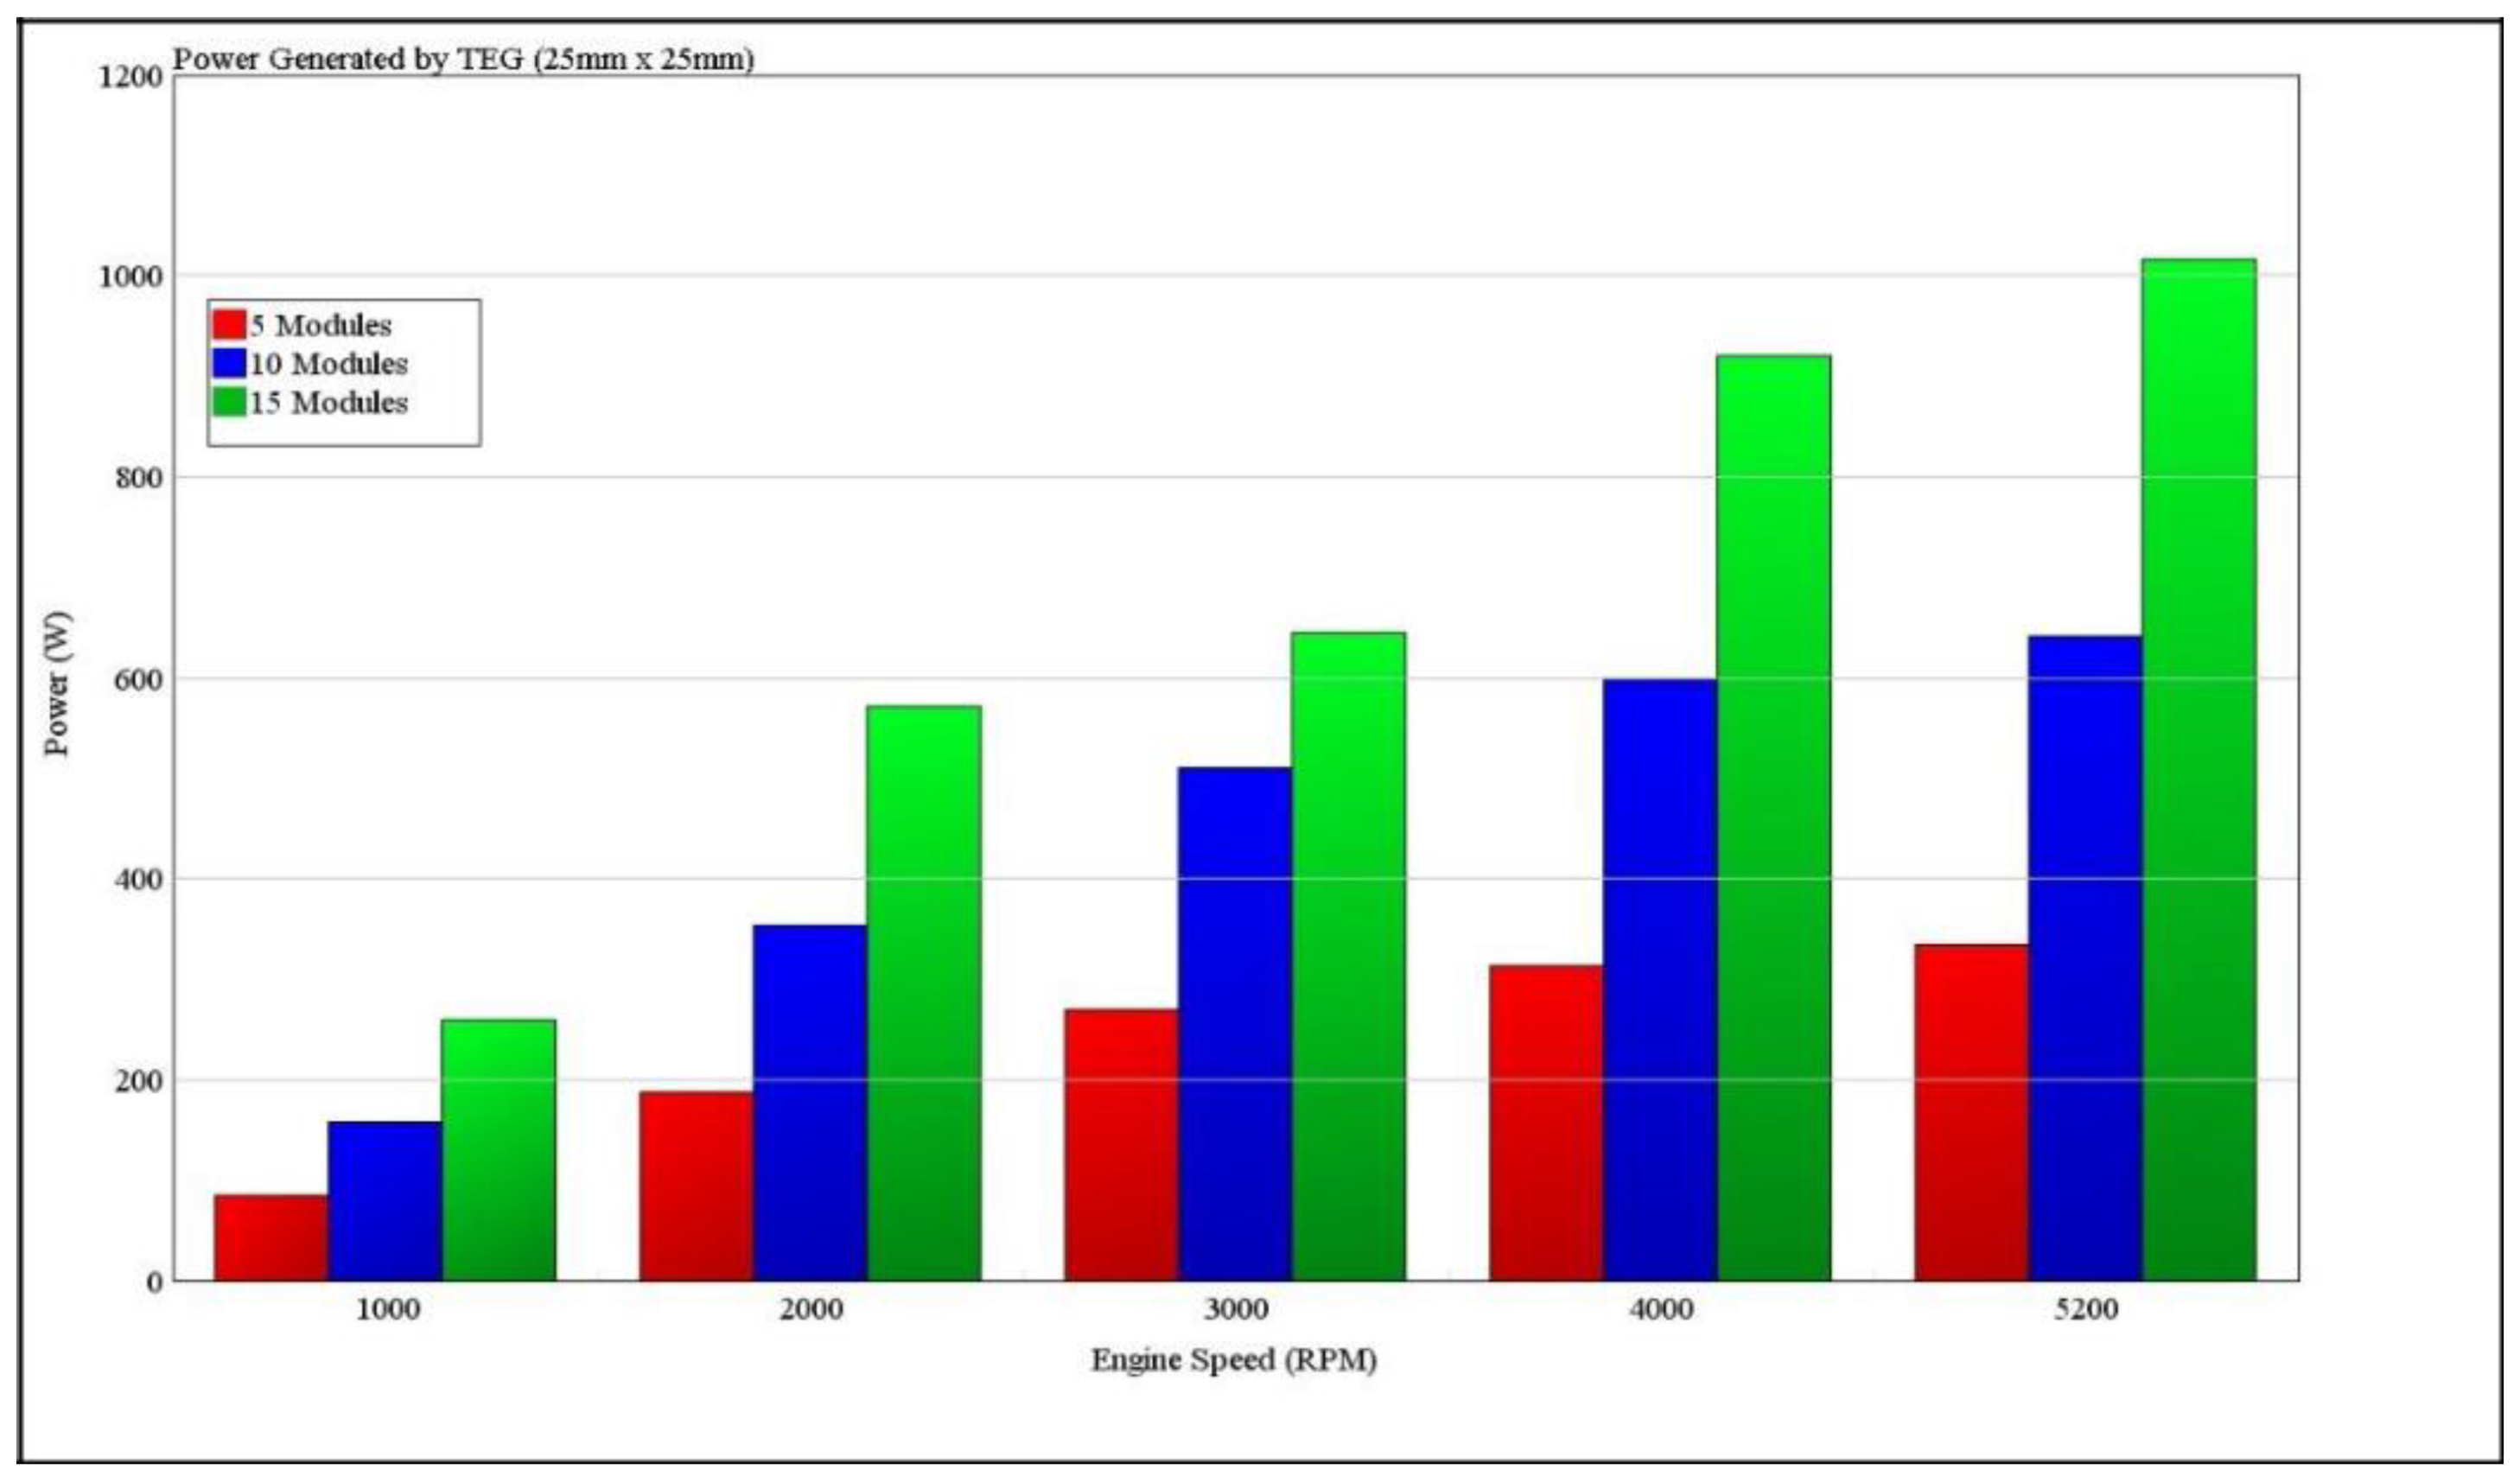
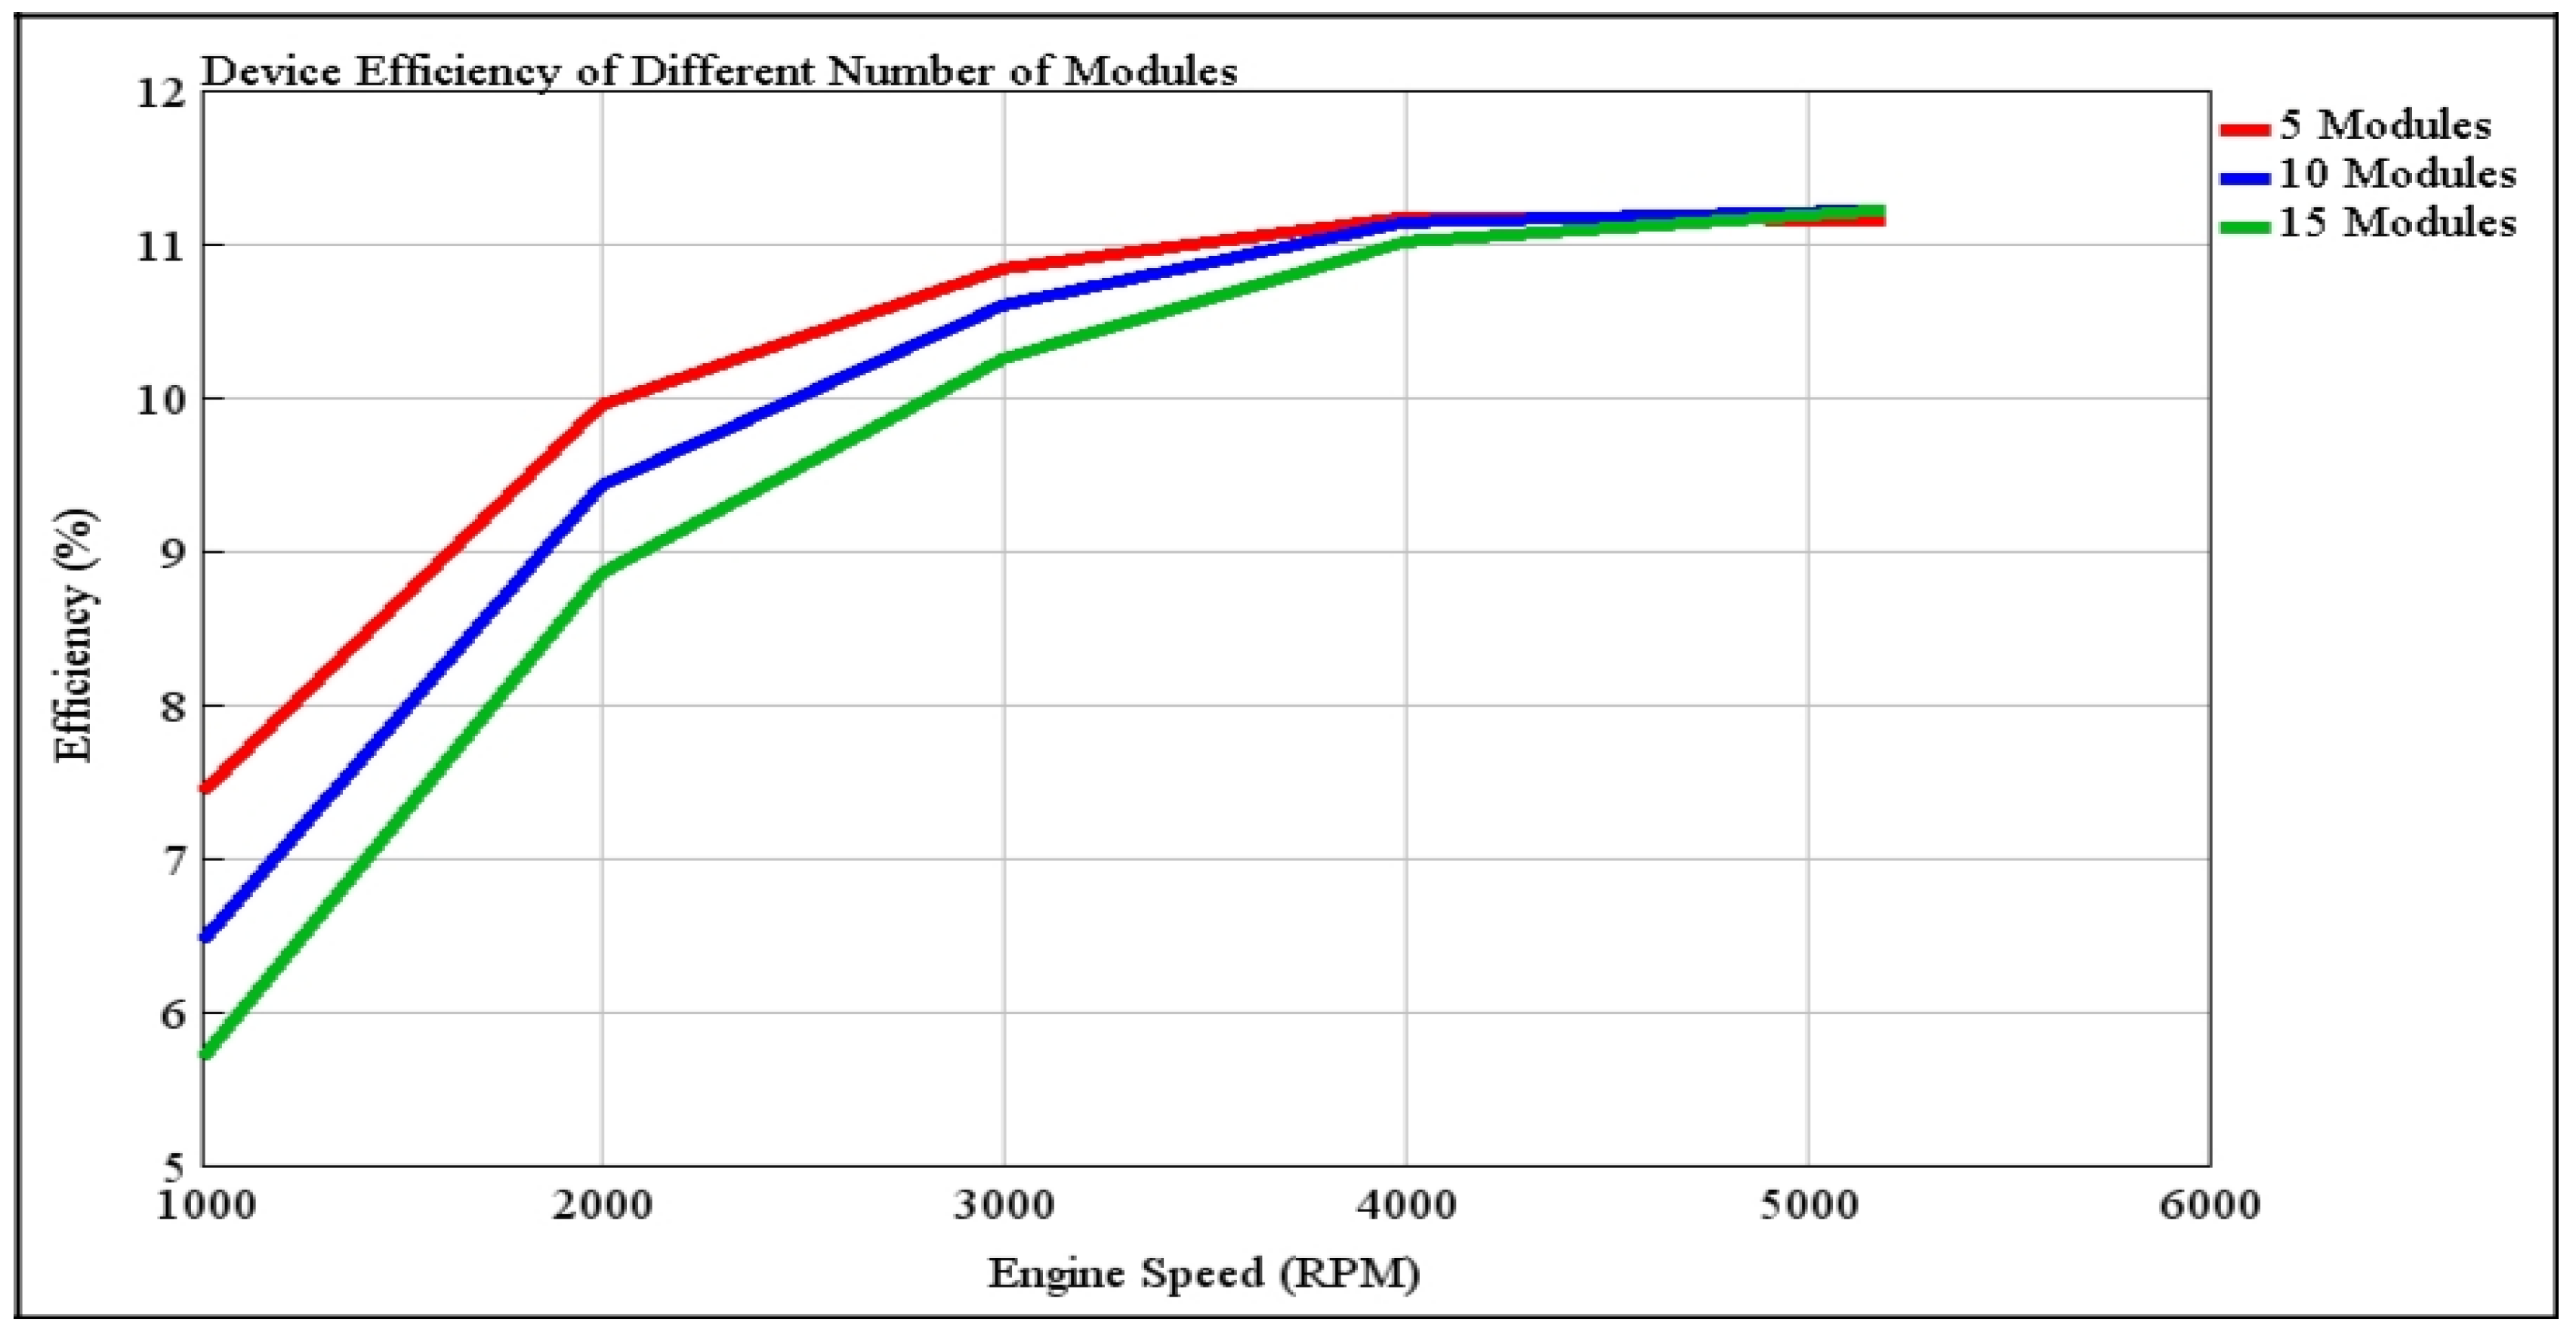
4.2.4. TEG with Different Number of Modules

The previous section already discussed the single module TEG performance and the best parameters to provide a maximised efficiency of TEG in terms of size and material used. In this section, the best option of a single module was added in series to add up the operating voltage and increase the power generated by the whole TEG system. Different numbers of modules were simulated to see how the addition of more modules affects the power and efficiency of TEG (Figure 21 and Figure 22, respectively). 5, 10 and 15 modules were used. Table 3 shows the best selection of module for this section.
The power generated by the TEG system was increased by adding a number of modules in series (voltage of an electric circuit is added up when connected in series). However, the increase in number of modules make individual TEG efficiency lower at a lower engine speed, where the corresponding level of heat released is minimised and where the multi-module version of TEG suffers disproportionately in terms of its ability to recover waste heat. However, the maximum achievable efficiency of the device still converges to very similar values at a higher engine speed, with the increase in exhaust heat availability. Conversely, as the power levels achieved by the 10- and 15-module TEGs increased, the system efficiency also increased, as per Figure 23.
Figure 24 shows that to achieve a better conversion of heat energy released by the exhaust, a greater number of modules are required. Previous sections explained the parameters needed to provide a better TEG system. In order to achieve a better efficiency, the TEG must have a smaller module size, a material with a higher ZT value and a larger number of modules. However, the increase in the number of modules will increase system cost. The total area of the TEG system will also increase as the number of modules increases. The total area of TEG must fit the size of the area where the TEG is going to be placed on the exhaust system.

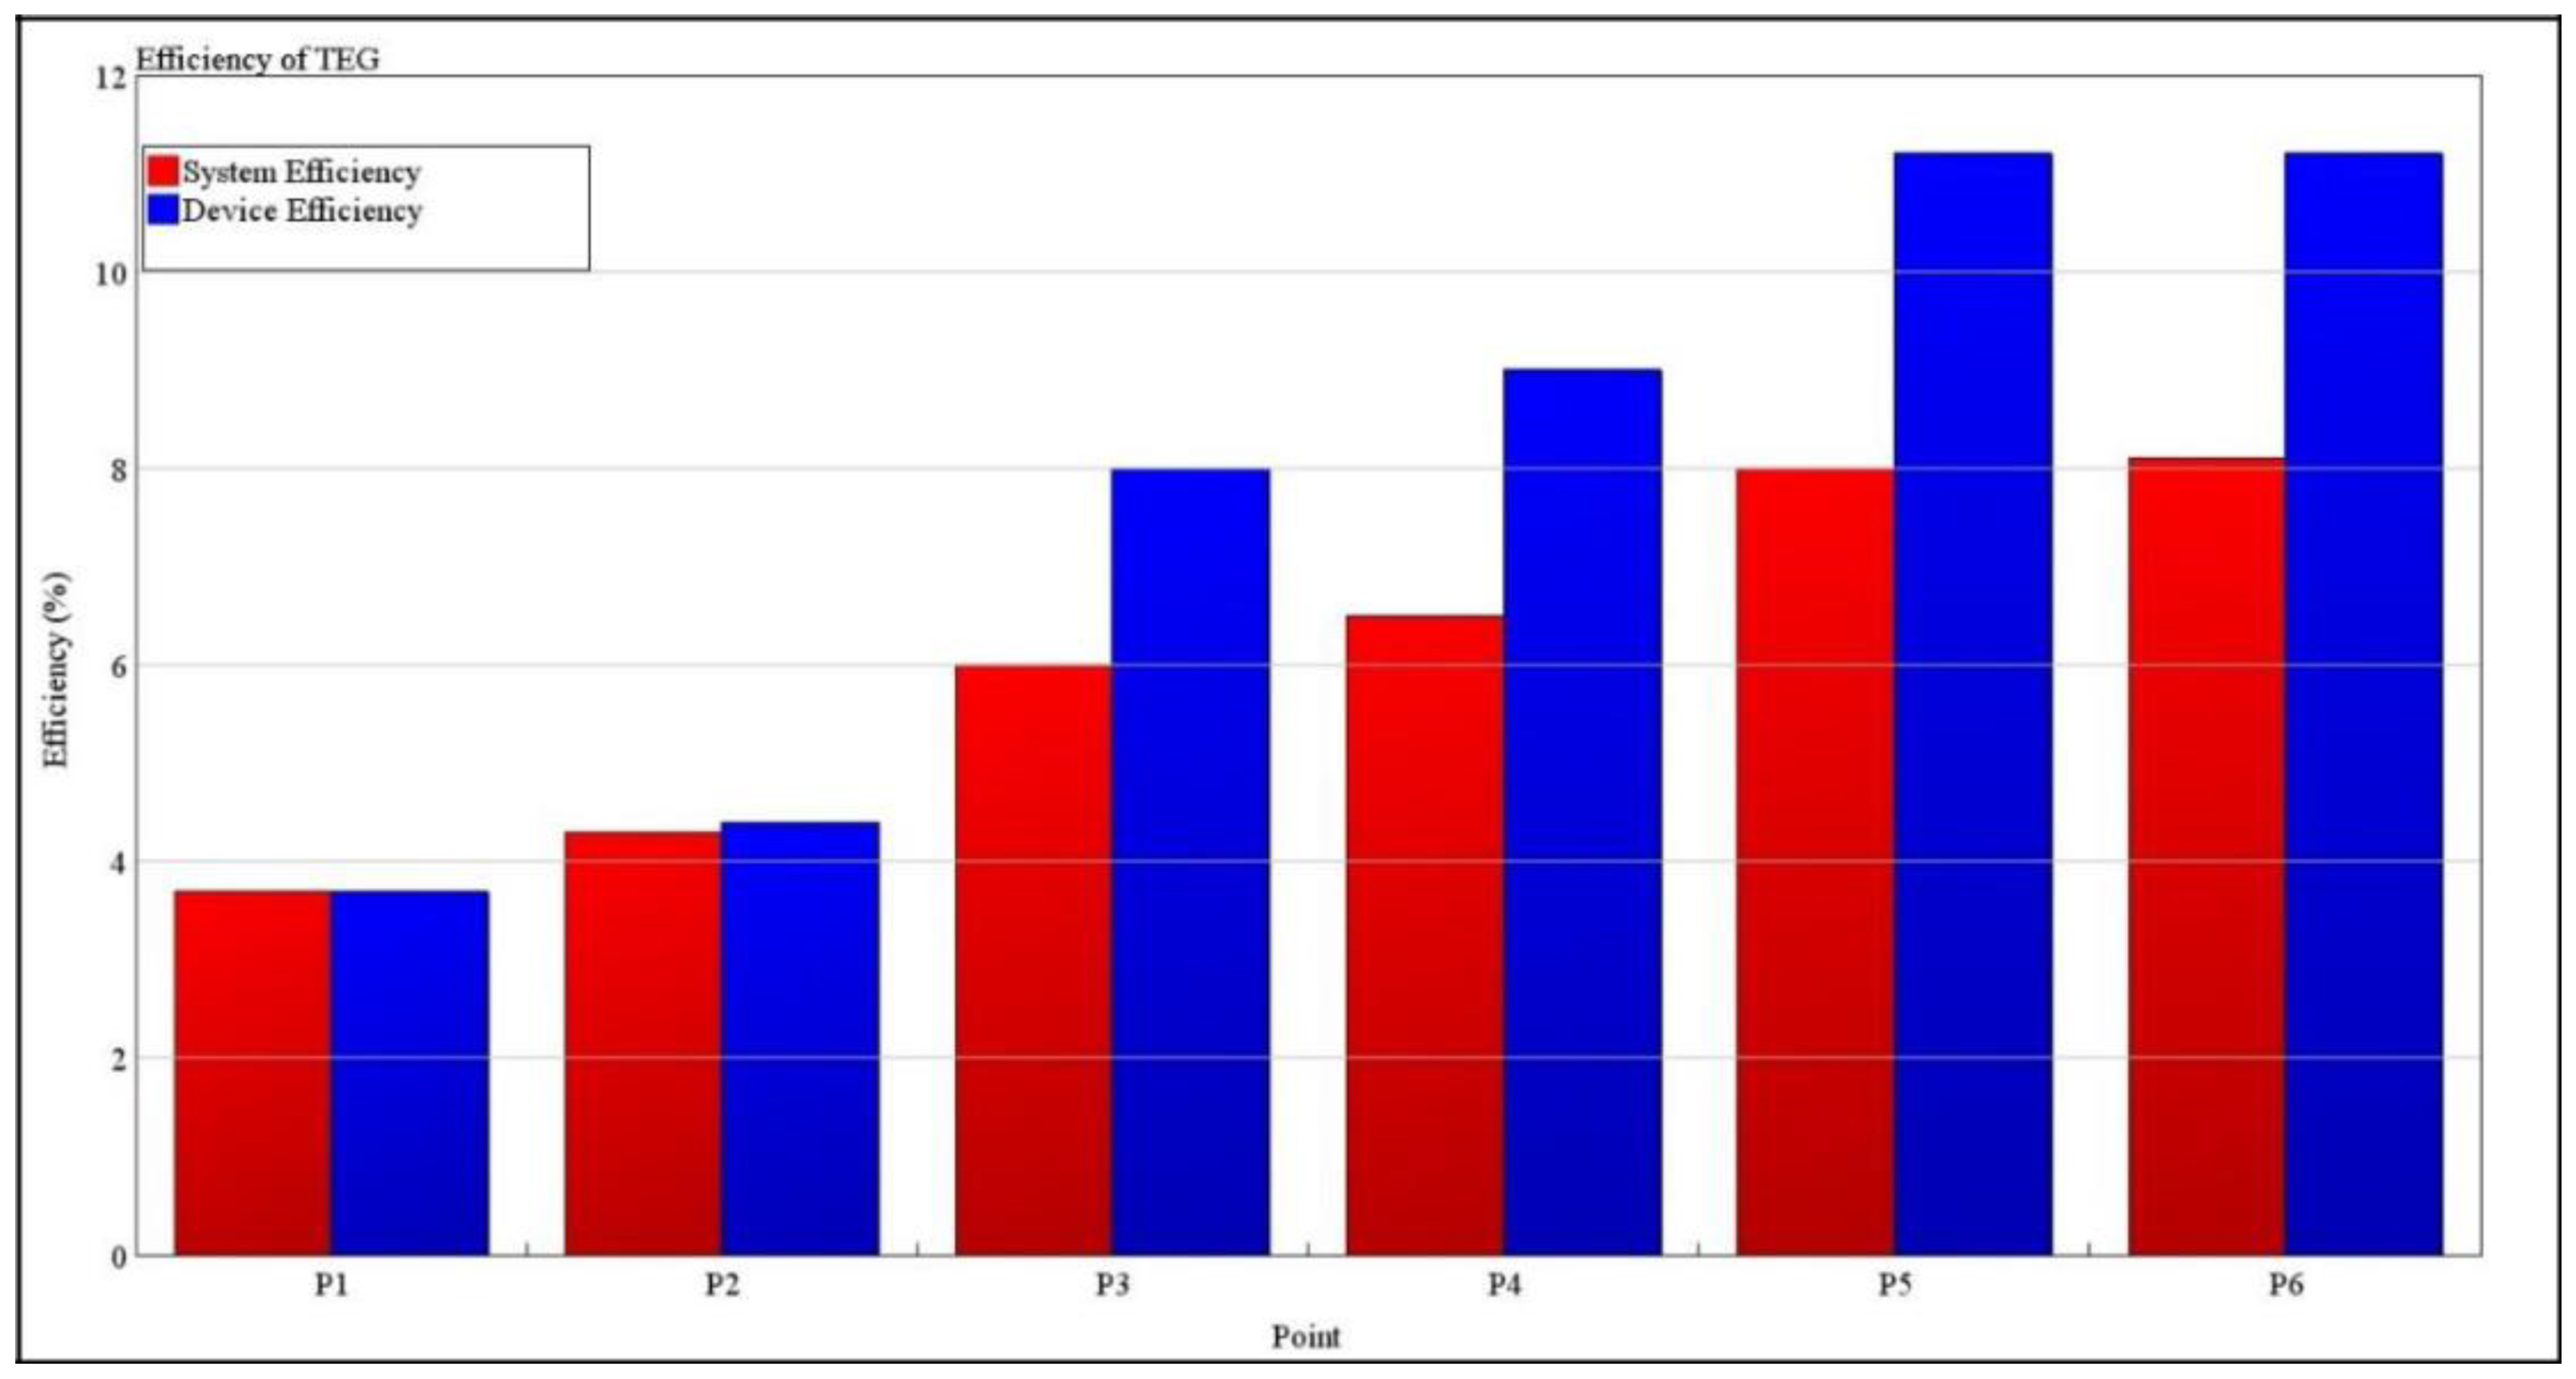
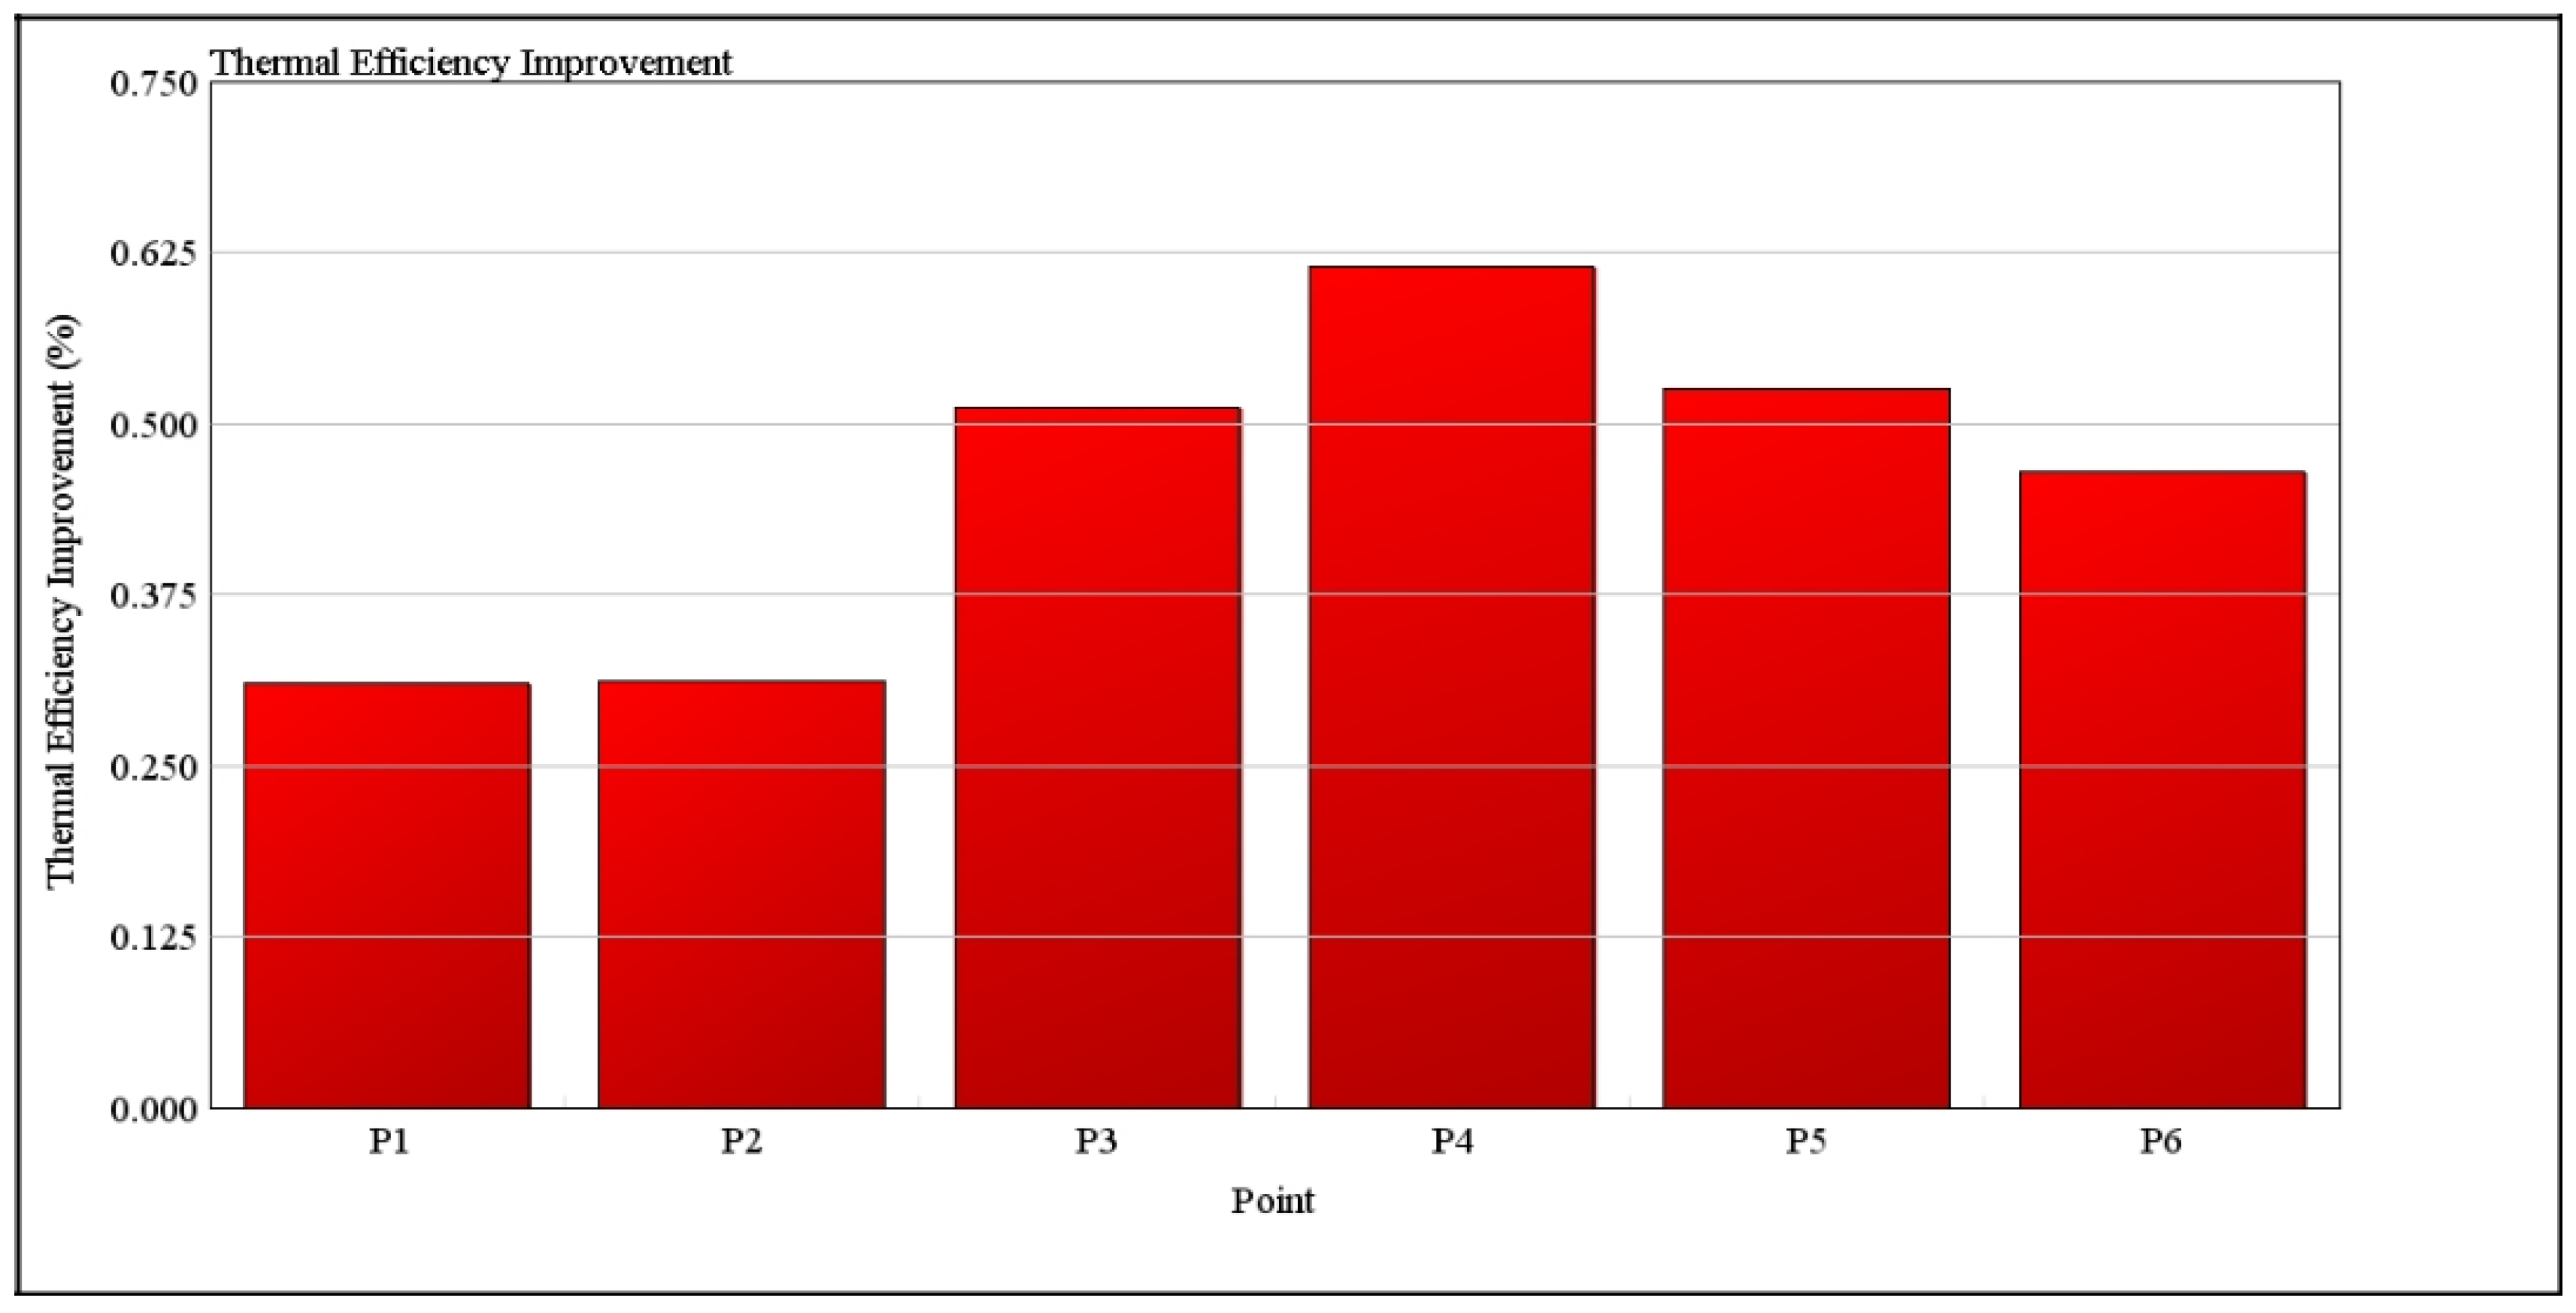
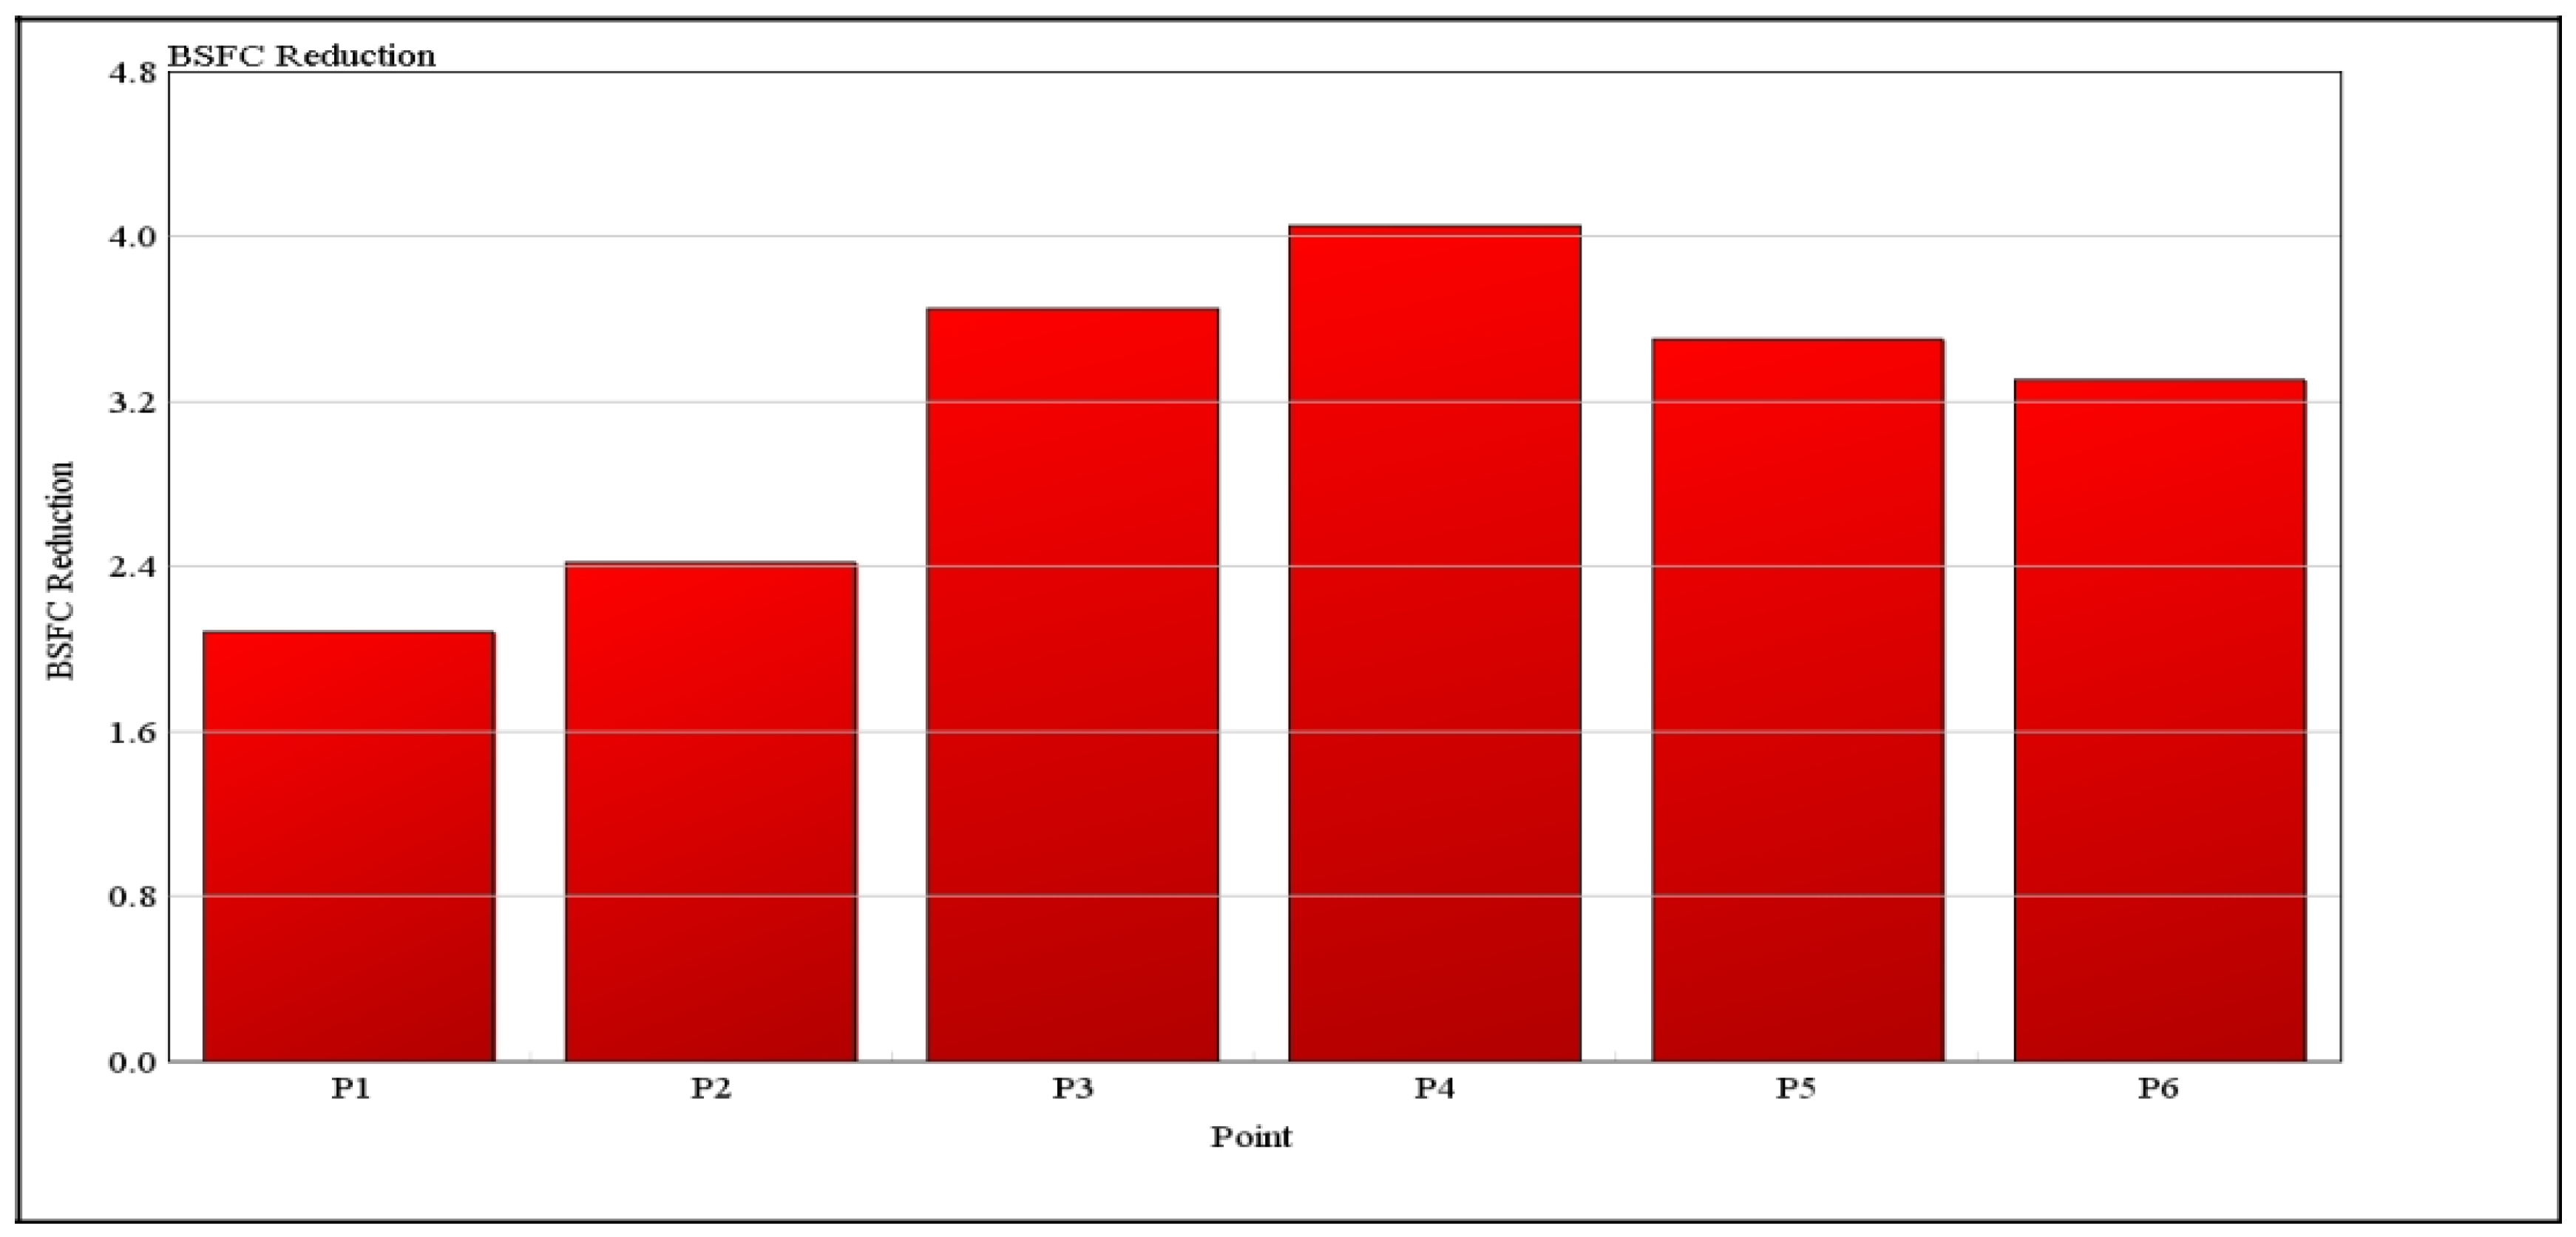
4.2.5. Performance of TEG

The 15 module TEG with a size of 25 mm × 25 mm using Ceramic was chosen for the TEG system performance investigation. It was simulated on 6 different operating points, as shown in Table 4.
The efficiency of TEG increased as the engine speed increased due to the corresponding higher exhaust temperature and mass flow rate. Hence, the temperature difference across TEG was greater and more power is produced. Figure 25 shows that the overall system efficiency of TEG was still low even though the device efficiency already achieved a greater value. This statement is supported by [16], as the overall system efficiency of TEG is less than the device efficiency due to the parasitic loss in the electric power conversion.
However, the average efficiency of the TEG system was 6%, which was greater than the previous efficiency of the TEG investigated. The increase in efficiency is because this TEG model can withstand a higher temperature, which makes it useful in higher temperatures. This is the most important design choice in improving the efficiency of TEG. A temperature limitation of the material makes the TEG less efficient. A high temperature thermoelectric material is in recent development by [15] and the efficiency of TEG is expected to reach 20%.
The thermal efficiency improvement of the TEG was performed to evaluate how efficient the TEG system was in improving the thermal efficiency of the engine when extra power generated by the TEG system could be re-used in the engine system. The average thermal efficiency of TEG was 0.4%. As the engine speed increased, the thermal efficiency was increasied but the efficiency started to decrease after the engine speed reached 3000 RPM. This decrease in the thermal efficiency was due to the power generated by the TEG system being too low compared to the engine power. The low thermal efficiency improvement also reflects that the TEG system cannot take advantage of the higher amount of waste heat available at higher engine speeds to produce more power. The TEG was not sufficiently effective to increase the efficiency at a higher engine speeds.
BSFC reduction was observed by increasing the output power without changing the mass flow rate (Figure 26). The additional power provided by the TEG was used to increase the engine output power. Equation (4) in Section 2.3 explains this mathematically. Figure 27 shows the reduction of BSFC as a result of TEG operation. The reduction increased as the engine speed increased up to a mid-level peak, then started to decline beyond 3000 RPM. This is because the thermal efficiency improvement of the engine offered by TEG at higher engine speeds is low. TEG is not as efficient in improving the engine efficiency at higher engine speeds as it is in the mid-speed range.
The new BSFC map shown in Figure 27 was obtained from 25 different operating points, the same as the BSFC map plotted in Section 3. The BSFC reduction was also calculated at the same 25 different operating points. The reduction of BSFC occurred at all engine speeds, as the TEG can generate power at all engine speeds. The lowest BSFC achieved due to TEG was 219.8 g/kWh, while the lowest original BSFC was 223.3 g/kWh, as shown in Figure 16. The BSFC reduction percentage was 1.56%. It is a small value, but it shows that the TEG can still make an important impact on vehicle performance.

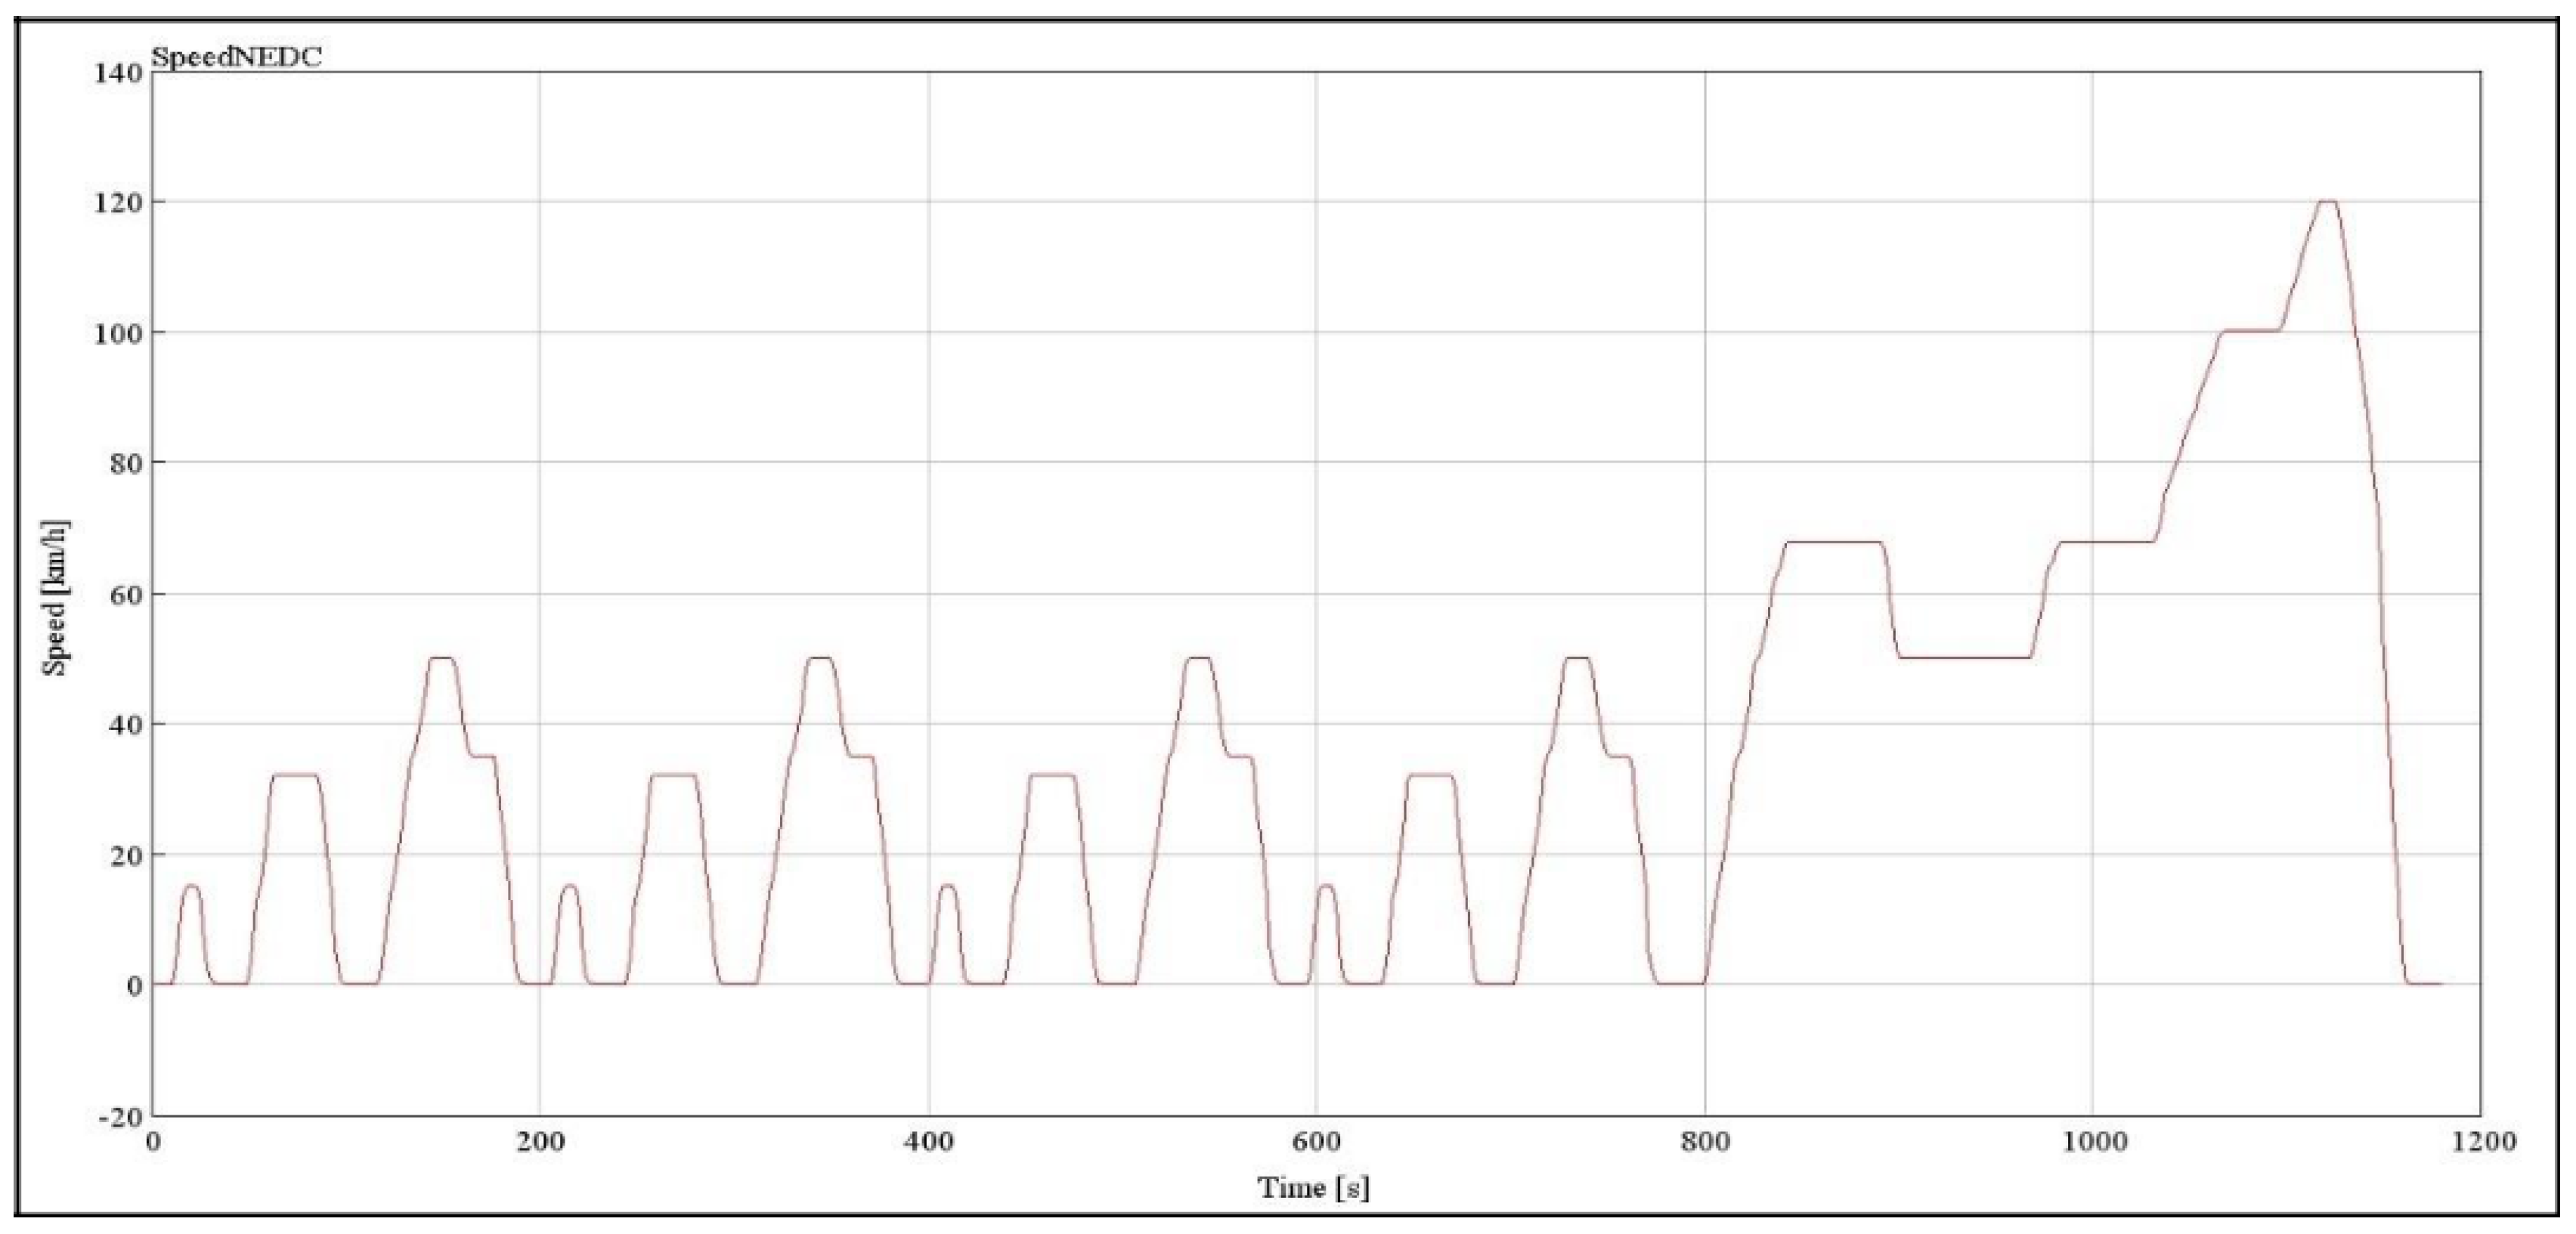
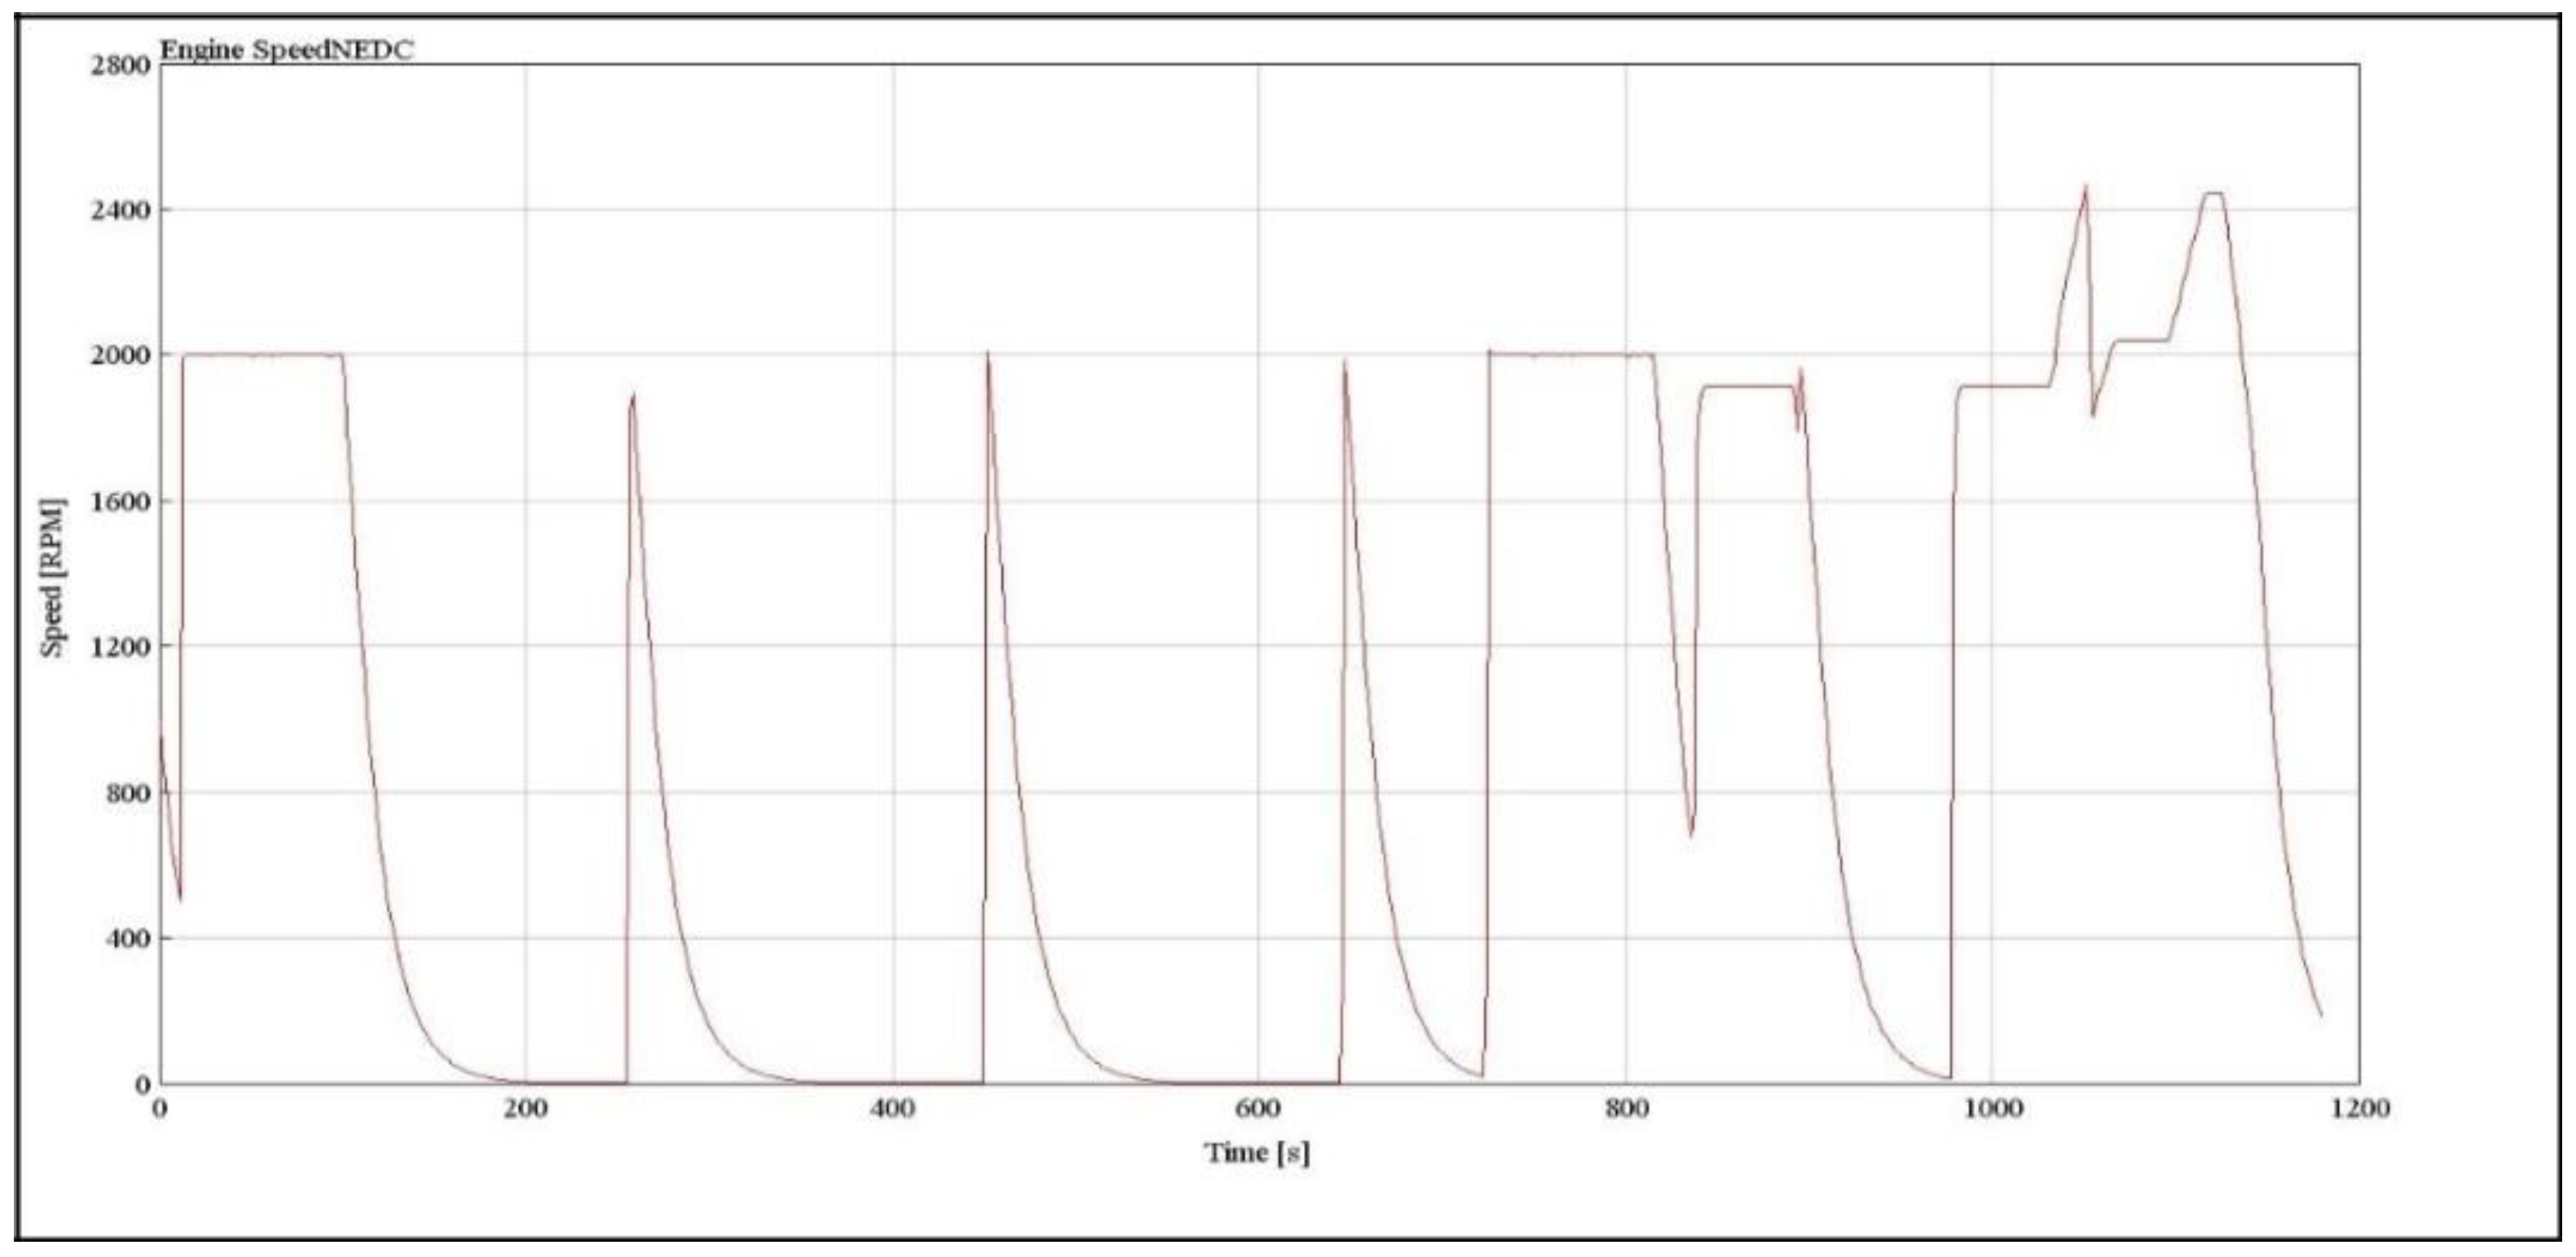
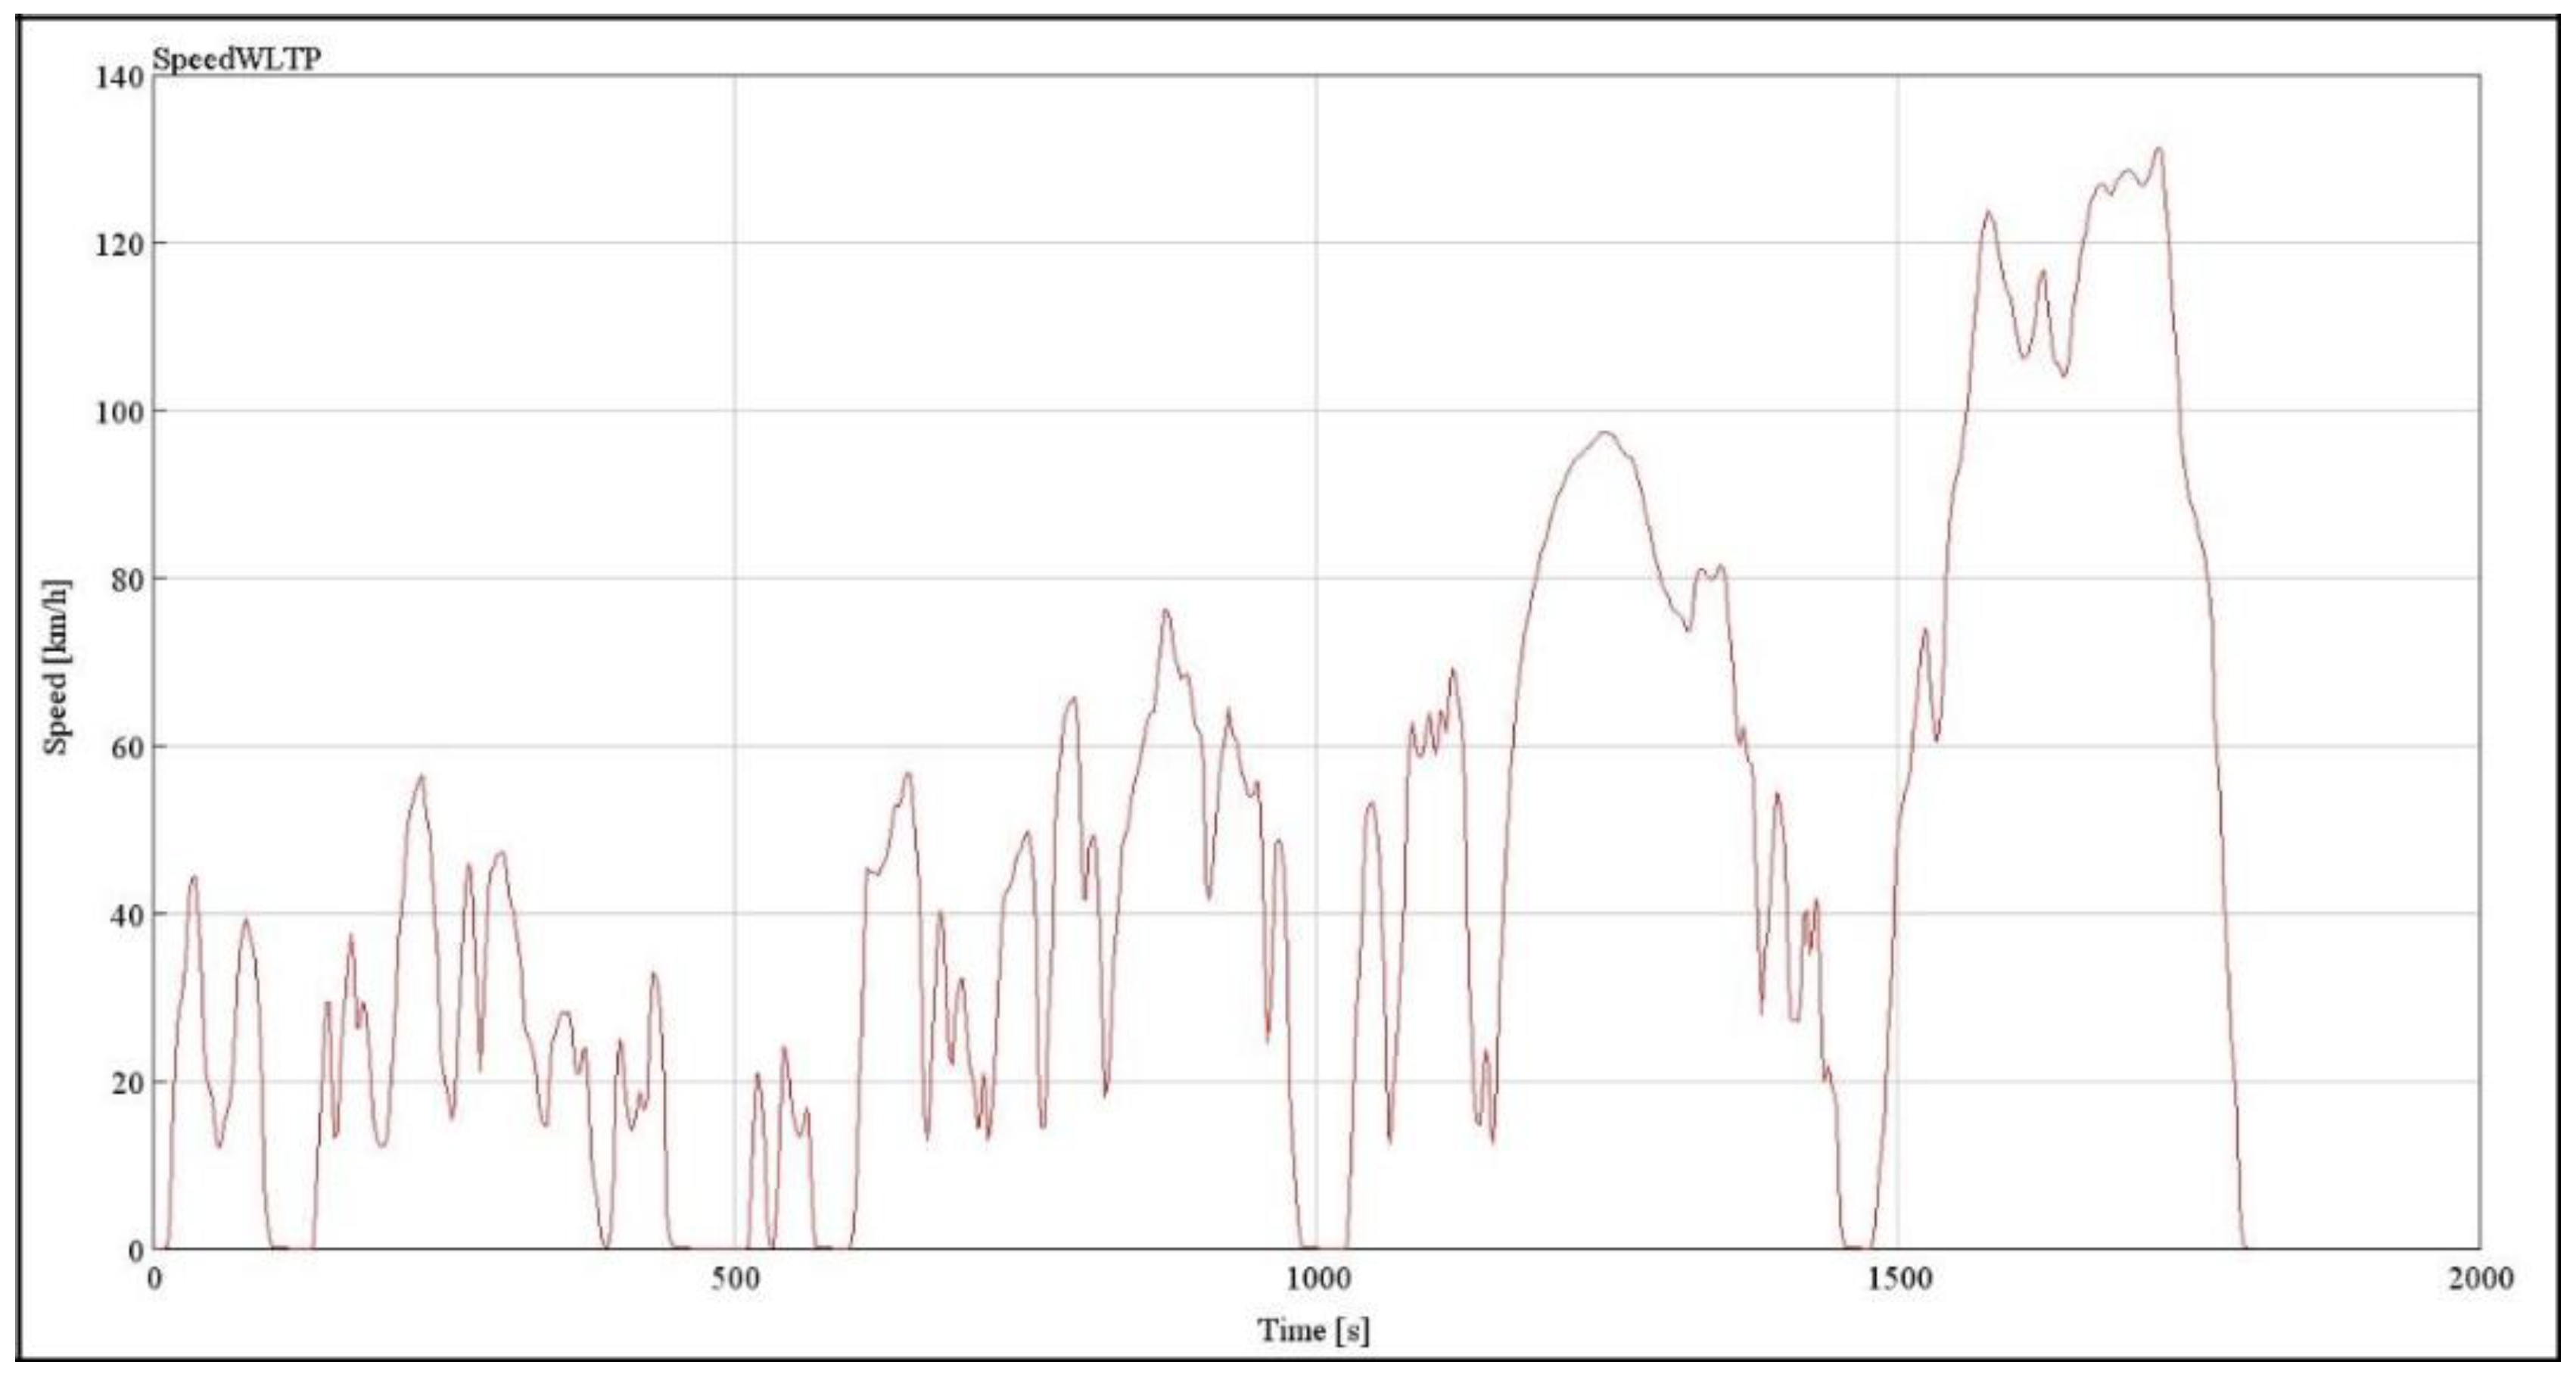
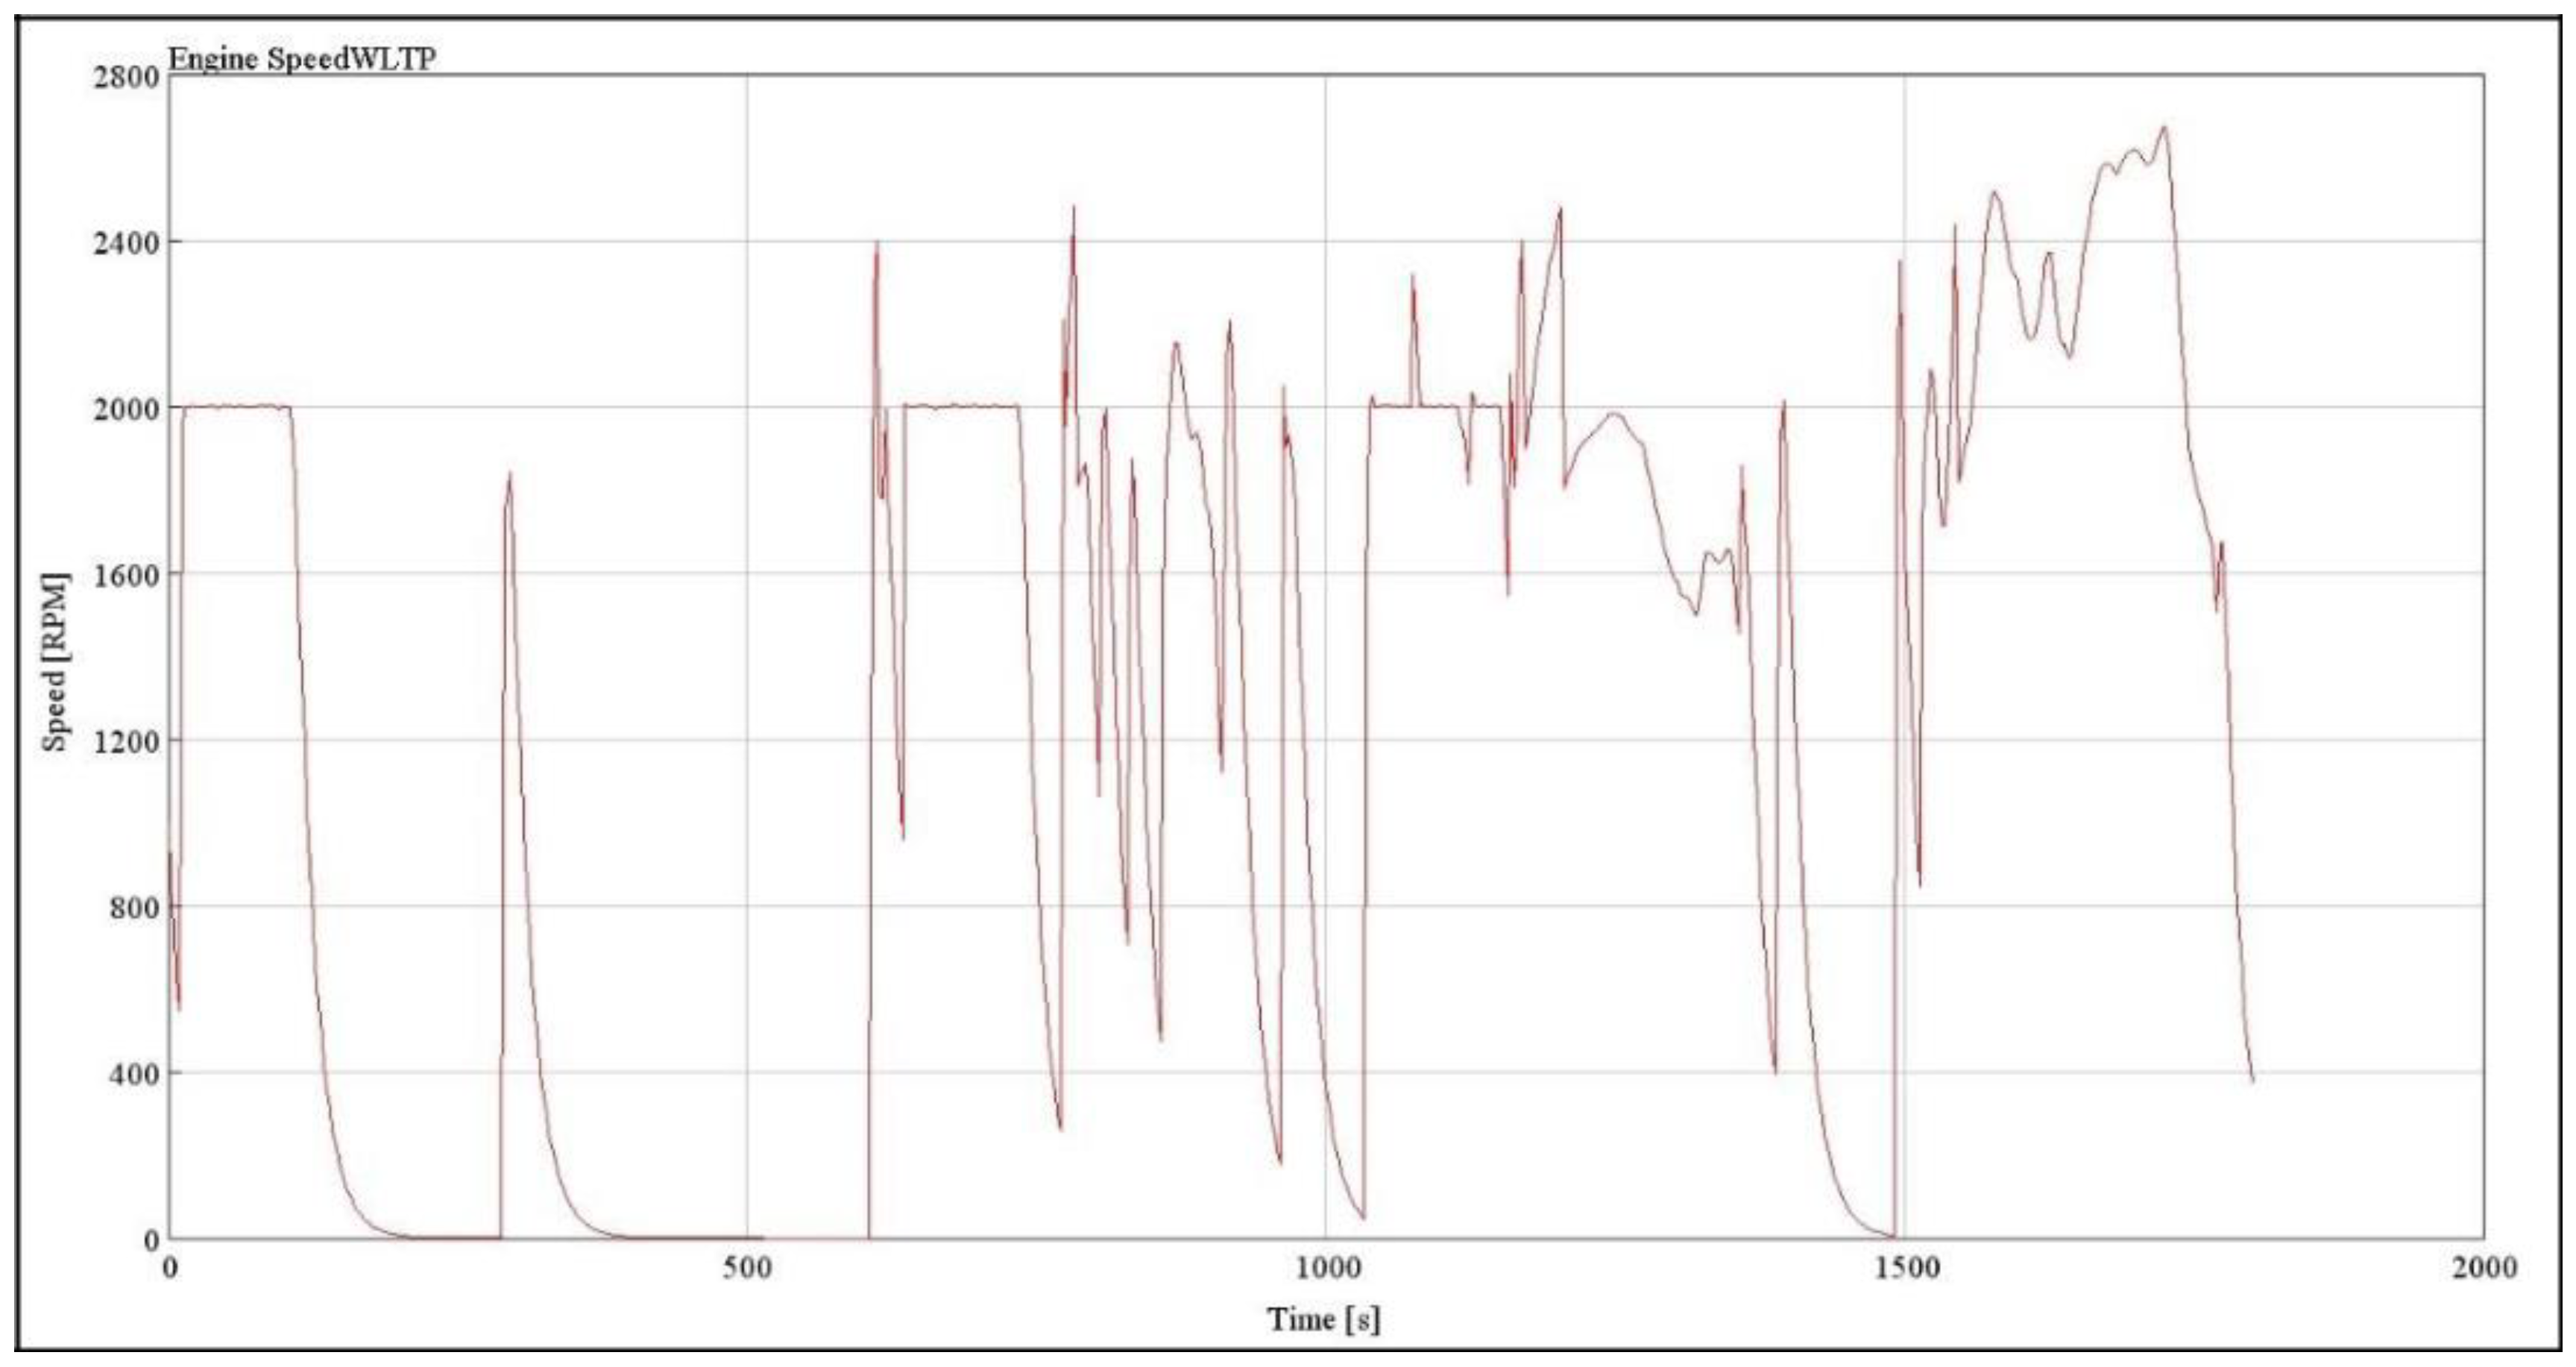
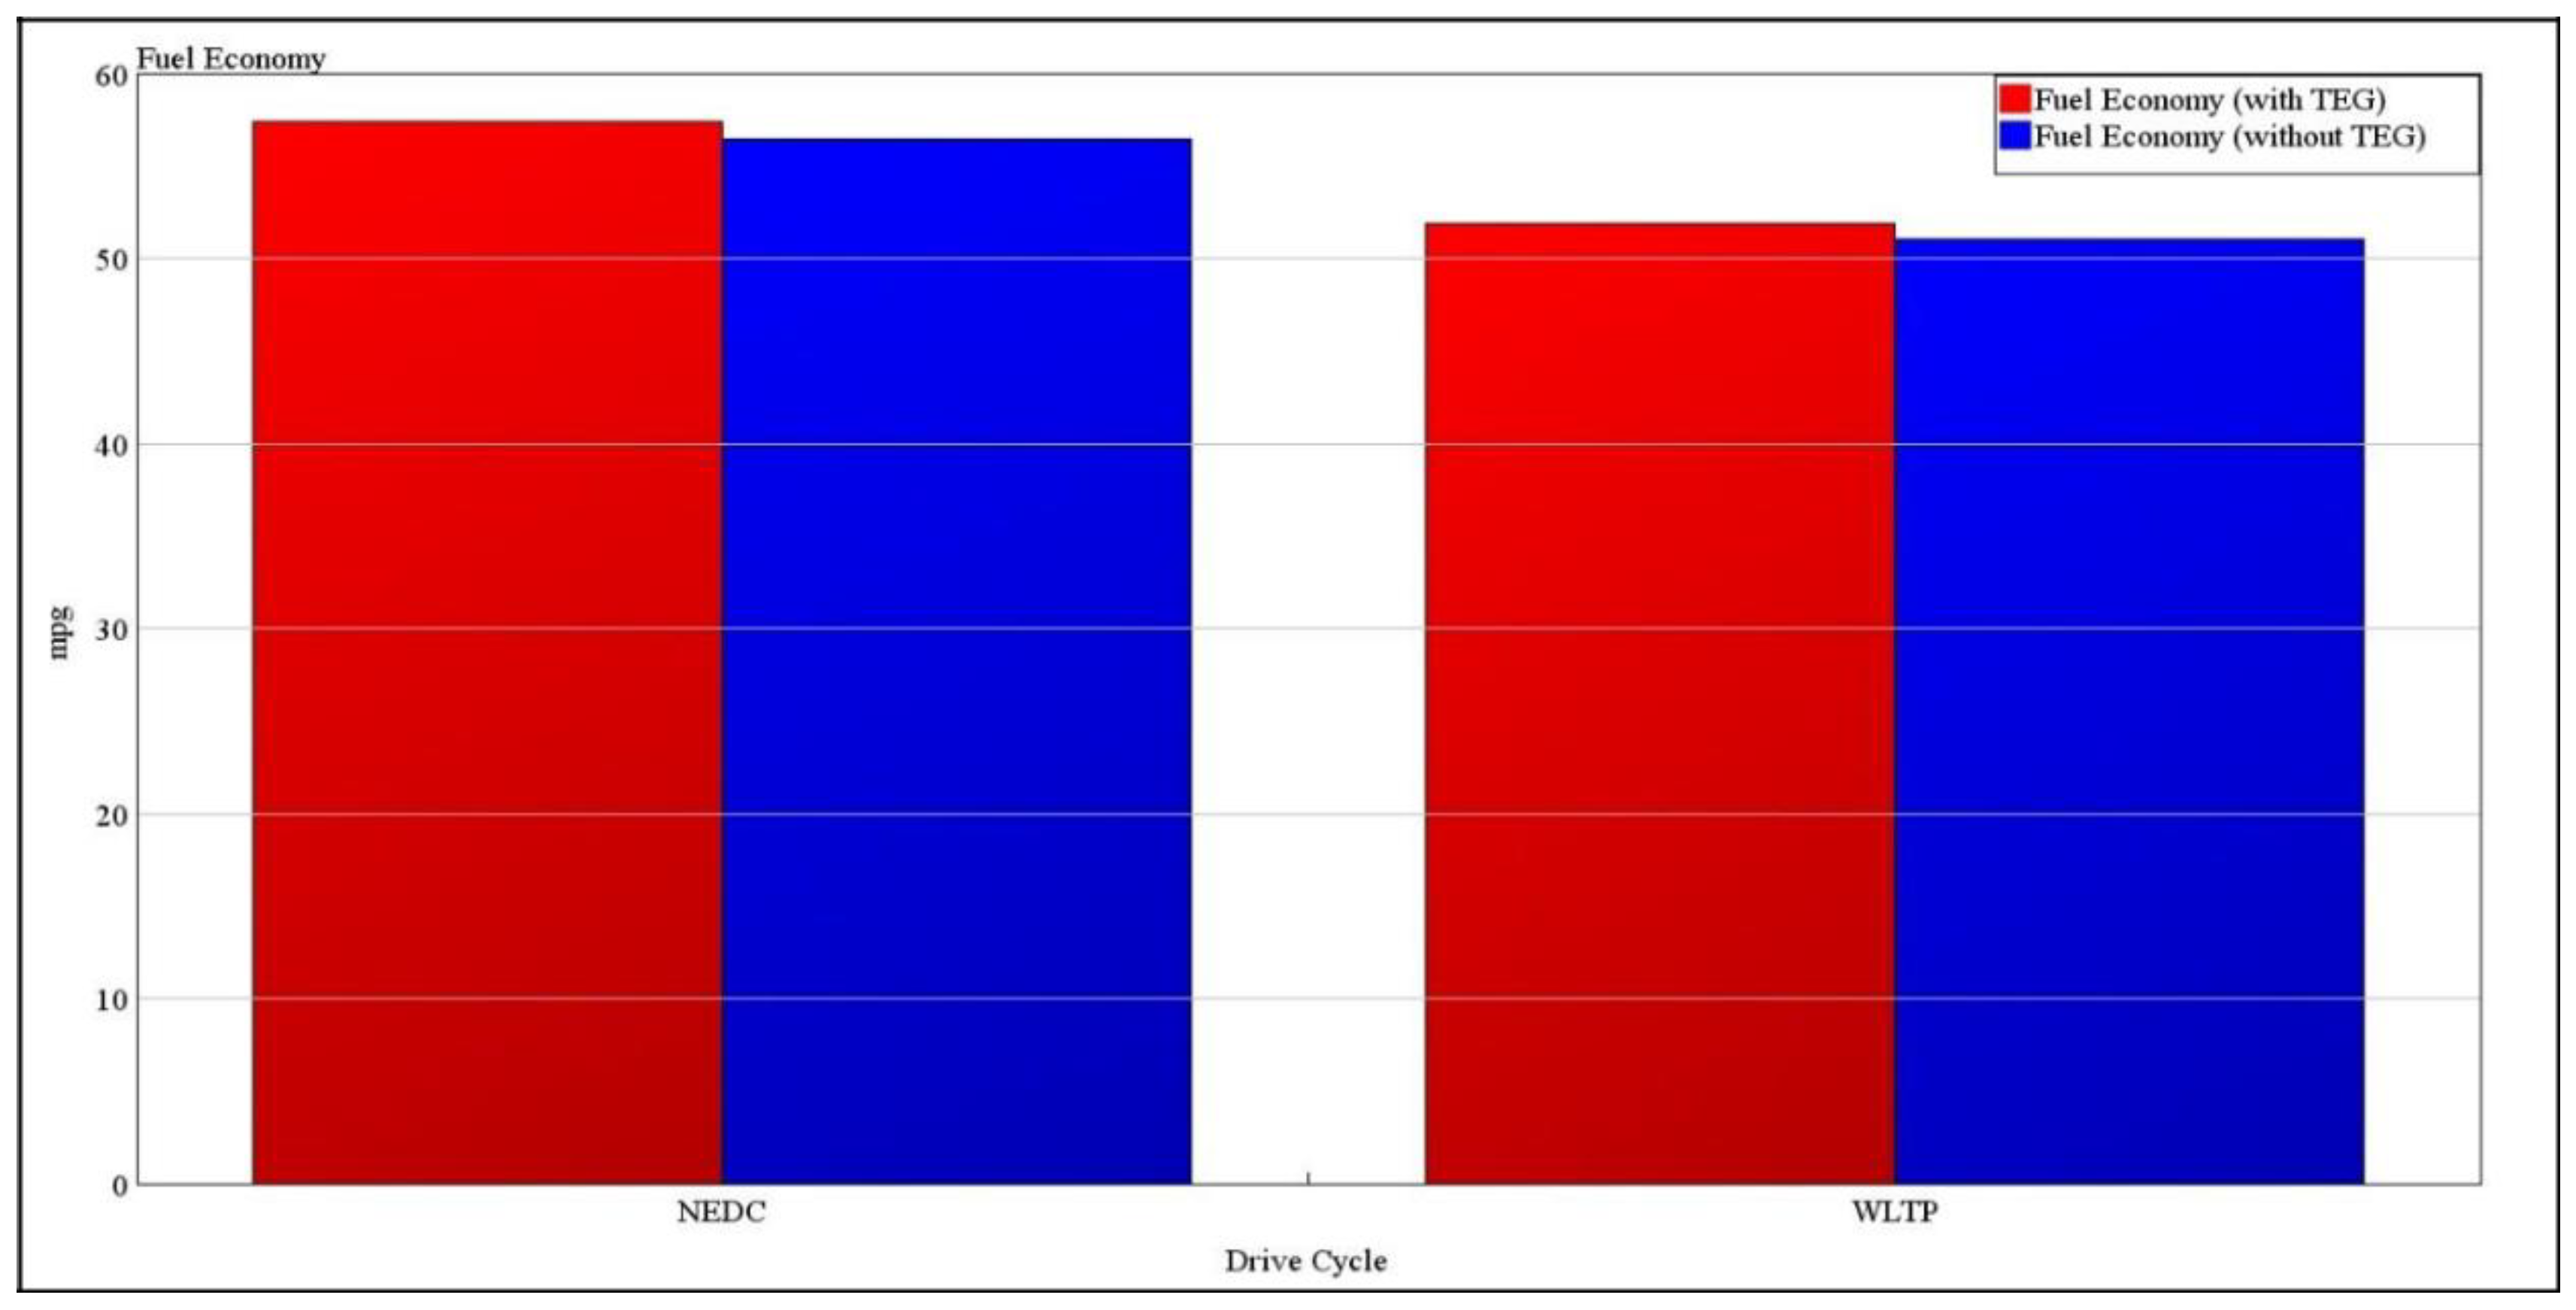
4.3. Series-Parallel HEV Simulation

This section will show the impact of implementing the TEG on a hybrid vehicle. Two different drive cycles were simulated by using the original BSFC and the new BSFC after reduction.
The engine of the vehicle simulated in this model for the NEDC drive cycle was operating at moderate vehicle and low engine speeds (Figure 28 and Figure 29). The engine speed was operated at a maximum of 2400 RPM. This low engine speed can affect the efficiency of TEG as discussed previously - the TEG was very efficient in producing more power at a higher engine speed.
Same as for the NEDC drive cycle, the engine for the WLTP drive cycle in this simulation was also run at a low speeds while operating at slightly higher vehicle speeds in a more dynamic fashion compared to the old NEDC (Figure 30 for vehicle speed and Figure 31 for engine speed, respectively). The low engine speed caused lower exhaust temperatures, resulting in a lower efficiency of TEG.
The improvement in fuel economy provided by TEG for both drive cycle can be seen in Figure 32. The percentage of fuel economy improvement 1.74% for NEDC and 1.73% for WLTP. It proves that even increasing the efficiency of the TEG does not have a dramatic impact on improving cycle-averaged and the overall results were in fact very similar. This relatively low, yet important, fuel economy improvement was certainly the effect of operating at lower averages engine speeds. The efficiency of TEG at the engine speed of 2000 RPM was around 6%.

4.4. Cost of TEG

The cost of the TEG system was considered by considering the main areas of raw materials cost, the cost of the components such as the heat exchanger and cooling system, and the manufacturing cost. Since TEGs in automotive application have not yet been commercially released, the TEG cost was estimated by the comparison made by [23] for the power generation technologies.
Table 5 shows that the TEG is among the most expensive power generation technologies. However, the cost of the TEG can be lowered by improving the efficiency of the materials. As shown in Table 5, the Chalcogenide thermoelectric cost is lowered when the system can operate at a higher temperature. The cost of the TEG system is reduced due to the improvement of the materials, as presented by [23].
As for this research, the model design was based on the materials that can operate at a higher temperature, hence the estimated cost for the model design was $5/W (equivalent to £3.8/W). The maximum power that can be generated by the model design was 1 kW. So, the estimated cost for the whole TEG system was £3800/kW. This is still considered an expensive system with other WHR technologies looking at achieving specific cost of lower than £1500-2000/kW in order to justify investment in the technology for mass production. However, the cost can be reduced by looking at other factors, such as the heat exchanger and cooling system design.

5. Conclusions

This research evaluated the efficiency of TEGs in the automotive field and the performance of a TEG as a WHR in a hybrid vehicle. The performance evaluations were based on a 1.8 L Toyota Prius simulation model implemented in GT-Suite software. A higher efficiency TEG system was achieved by considering parameters such as size, materials used, and the number of modules needed for the TEG system. The main factor that affects the TEG system efficiency was the thermoelectric material used to produce the TEG module. Material with a higher temperature operating limitation makes the TEG more powerful. A gasoline ICE exhaust temperature can exceed 700 ℃ and a TEG system needs be able to capitalise on this heat availability to produce more power as the power generated is based on the temperature difference occurs on the device. In term of size, a smaller TEG module size with greater number of modules is better than a bigger one with smaller number of modules. The TEG model investigated in this research can produce a maximum power of 1015 W at the speed of 5200 RPM, with 11% device efficiency. The overall system efficiency of TEG is dependent on the engine speed. A higher engine speed will provide a greater exhaust temperature, which leads to a higher system efficiency. As for the fuel economy evaluation of HEV after increasing the thermal efficiency of the engine with TEG, the fuel economy increased by 1.74% for NEDC and 1.73% for WLTP. This work found that the TEG system efficiency implemented on HEV at a mean engine speed of 2000 RPM was 6%. On the other hand, by considering the performance of TEG with other WHR systems such as ORC and T/C on the HEV, the TEG was still considered the least efficient among those WHR, producing clearly lower levels of power. Further efficiency improvements are necessary in order to reach turbocompounding and even ORC levels of payback [24].

Author Contributions

Conceptualization, A.P. and M.S.b.D.; methodology, A.P. and M.S.b.D.; software, A.P.; validation, D.G.; formal analysis and investigation, D.G.; resources, A.P.; data curation, X.X.; writing—original draft preparation, D.G.; writing—review and editing, A.P. visualization, M.S.b.D.; supervision, A.P.; project administration, A.P. All authors have read and agreed to the published version of the manuscript.

Funding

This research received no external funding.

Conflicts of Interest

The authors declare no conflict of interest.

Nomenclature

HEVHybrid Electric Vehicle
BEVBattery Electric Vehicle
FCEVFuel Cell Electric Vehicle
ICEInternal Combustion Engine
SISpark Ignition
GDIGasoline Direct Engine
BSFCBrake Specific Fuel Consumption (g/kWh)
WHRWaste Heat Recovery
TEGThermoelectric Generator
ORCOrganic Rankine Cycle
T/CTurbocompounding
NEDCNew European Driving Cycle
WLTPWorldwide Harmonised Light Vehicle Test Procedure
Mass Flow Rate
kWKilowatt
NmNewton meter

References

  1. International Energy Agency. World Energy Outlook; International Energy Agency: Paris, France, 2017. [CrossRef]
  2. Mahmoudzadeh Andwari, A.; Pesiridis, A.; Karvountzis-Kontakiotis, A. Hybrid Electric Vehicle Performance with Organic Rankine Cycle Waste Heat Recovery System. Appl. Sci. (Bucureşti) 2017, 7, 437. [Google Scholar] [CrossRef] [Green Version]
  3. Pesyridis, A. Automotive Exhaust Emissions and Energy Recovery; NOVA Science Publishers: Hauppage, NY, USA, 2014; pp. 265–281. ISBN 978-1-63321-493-4. [Google Scholar]
  4. Yang, J. Potential applications of thermoelectric waste heat recovery in the automotive industry. In Proceedings of the 24th International Conference on Thermoelectrics, Clemson, SC, USA, 19–23 June 2005. [Google Scholar]
  5. Guzzella, L.; Sciarretta, A. Vehicle Propulsion Systems; Springer: Berlin, Germany, 2013. [Google Scholar]
  6. Bass, J.C.; Campana, R.J.; Elsner, N.B. Thermoelectric Generator Development for Heavy Duty Truck Applications. In Proceedings of the Annual Automotive Technology Development Contractors’ Coordination Meeting, Dearnborn, MI, USA, 22 February 1991. [Google Scholar]
  7. Thacher, E.F.; Helenbrook, B.T.; Karri, M.A. Testing of an automobile exhaust thermoelectric generator in a light truck. J. Automob. Eng. 2007, 221, 95–107. [Google Scholar] [CrossRef]
  8. Hussain, Q.E.; Birgham, D.R.; Maranville, C.W. Thermoelectric Exhaust Heat Recovery for Hybrid Vehicles. SAE Int. J. Engines 2009, 2, 1132–1142. [Google Scholar] [CrossRef]
  9. Zhang, Y.; Cleary, M.; Wang, X.; Kempf, N.; Schoensee, L.; Yang, J.; Joshi, G.; Meda, L. High-temperature and high-power-density nanostructured thermoelectric generator for automotive waste heat recovery. Energy Convers. Manag. 2015, 105, 946–950. [Google Scholar] [CrossRef] [Green Version]
  10. LaGrandeur, J.; Crane, D.; Hung, S.; Mazar, B.; Eder, A. Automotive Waste Heat Conversion to Electric Power using Skutterudite, TAGS, PbTe and BiTe. In Proceedings of the Diesel Engine-Efficiency and Emissions Research (DEER) Conference, Detroit, MI, USA, 20–24 August 2006. [Google Scholar] [CrossRef]
  11. Espinosa, N.; Lazard, M.; Aixala, L.; Scherrer, H. Modeling a Thermoelectric Generator Applied to Diesel Automotive Heat Recovery. J. Electron. Mater. 2010, 39, 1446–1455. [Google Scholar] [CrossRef]
  12. Mori, M.; Yamagami, T.; Sorazawa, M.; Miyabe, T.; Takahashi, S.; Haraguchi, T. Simulation of Fuel Economy Effectiveness of Exhaust Heat Recovery System Using Thermoelectric Generator in a Series Hybrid. SAE Int. J. Mater. Manuf. 2011, 4, 1268–1276. [Google Scholar] [CrossRef]
  13. Sivaprahasam, D.; Harish, S.; Gopalan, R.; Sundararajan, G. Automotive Waste Heat Recovery by Thermoelectric Generator Technology. In Automotive Waste Heat Recovery by Thermoelectric Generator Technology; IntechOpen: London, UK, 2018; pp. 163–183. [Google Scholar] [CrossRef] [Green Version]
  14. Lan, S.; Yang, Z.; Stobart, R.; Chen, R. Prediction of the fuel economy potential for a skutterudite thermoelectric generator in light-duty vehicle applications. Appl. Energy 2018, 231, 68–79. [Google Scholar] [CrossRef]
  15. Yang, Z.; PradoGonjal, J.; Phillips, M.; Lan, S.; Powell, A.; Vaqueiro, P.; Gao, M.; Stobart, R.; Chen, R. Improved Thermoelectric Generator Performance Using High Temperature Thermoelectric Materials. In Proceedings of the WCX™ 17: SAE World Congress Experience, Detroit, MI, USA, 28 March 2017. [Google Scholar] [CrossRef] [Green Version]
  16. Smith, K.; Thornton, M. Feasibility of Thermoelectrics for Waste Heat Recovery in Conventional Vehicles; National Renewable Energy Laboratory: Golden, CO, USA, 2009. [Google Scholar]
  17. Zhao, M.; Wei, M.; Song, P.; Liu, Z.; Tian, G. Performance evaluation of a diesel engine integrated with ORC system. Appl. Therm. Eng. 2017, 115, 221–228. [Google Scholar] [CrossRef] [Green Version]
  18. Matsuo, S.; Ikeda, E.; Ito, Y.; Nishiura, H. The New Toyota Inline 4 Cylinder 1.8L ESTEC 2ZR-FXE Gasoline Engine for Hybrid Car. SAE Tech. Pap. 2016, 1, 0684. [Google Scholar] [CrossRef]
  19. Zienna, N. A Model to Evaluate The Potential Benefits of a Thermoelectric Generator in Reducing CO2 Emisssions. In Proceedings of the European GT Conference, Frankfurt, Germany, 9 October 2017. [Google Scholar]
  20. Ehsani, M.; Gao, Y.; Emadi, A. Modern Electric, Hybrid Electric, and Fuel Cell Vehicles: Fundamentals, Theory, and Design; CRC Press LLC: Boca Raton, FL, USA; London, UK; New York, NY, USA; Washington, DC, USA, 2005. [Google Scholar]
  21. ToyotaUK. Prius Full Release WLTP. 2018. Available online: https://media.toyota.co.uk/wp-content/files_mf/1545916724181227M4PriusfullreleaseWLTP.pdf (accessed on 30 October 2018).
  22. Rajoo, S.; Romagnoli, A.; Ricardo, M.-B.; Pesyridis, A.; Copeland, C.; Ihsan Bin Mamat, A.M. Automotive Exhaust Waste Heat Recovery Technologies. In Automotive Exhaust Waste Heat Recovery Technologies; Pesiridis, A., Ed.; NOVA Science Publishers: Hauppauge, NY, USA, 2014. [Google Scholar]
  23. LeBlanc, S.; Yee, S.K.; Scullin, M.L.; Dames, C.; Goodson, K.E. Material and manufacturing cost considerations for thermoelectrics. Renew. Sustain. Energy Rev. 2014, 32, 313–327. [Google Scholar] [CrossRef]
  24. Teo Sheng Jye, A.; Pesiridis, A.; Rajoo, S. Effects of Mechanical Turbo Compounding on a Turbocharged Diesel Engine; SAE Technical Paper 2013-01-0103; SAE International: Warrendale, PA, USA, 2013. [Google Scholar] [CrossRef] [Green Version]
Figure 1. 4-Cylinder Engine.
Energies 13 03742 g001
Figure 2. Theoretical BSFC map of 2 ZR-FXE Engine (left) and theoretical engine power of 2 ZR-FXE Engine (right).
Energies 13 03742 g002
Figure 3. Brake Specific Fuel Consumption (BSFC) model of engine model.
Energies 13 03742 g003
Figure 4. Brake power of engine model.
Energies 13 03742 g004
Figure 5. 1 Module of the thermoelectric generator (TEG).
Energies 13 03742 g005
Figure 6. TEG Model with 10 TEG modules.
Energies 13 03742 g006
Figure 7. Series-parallel hybrid electric vehicle (HEV) model.
Energies 13 03742 g007
Figure 8. Engine thermal efficiency.
Energies 13 03742 g008
Figure 9. Exhaust pressure.
Energies 13 03742 g009
Figure 10. Exhaust mass flow rate.
Energies 13 03742 g010
Figure 11. Exhaust temperature.
Energies 13 03742 g011
Figure 12. Exhaust heat released.
Energies 13 03742 g012
Figure 13. Power generated by 1 module (25 mm × 25 mm).
Energies 13 03742 g013
Figure 14. Device efficiency of 1 module (25 mm × 25 mm).
Energies 13 03742 g014
Figure 15. System efficiency of 1 module (25 mm × 25 mm).
Energies 13 03742 g015
Figure 16. Power generated by different module size (1 module).
Energies 13 03742 g016
Figure 17. Device efficiency of different module size (1 module).
Energies 13 03742 g017
Figure 18. System efficiency of different module size (1 module).
Energies 13 03742 g018
Figure 19. Power generated by different materials (1 module).
Energies 13 03742 g019
Figure 20. System efficiency of different materials (1 module).
Energies 13 03742 g020
Figure 21. Average power generated by TEG at different engine speed (25 mm ×25 mm).
Energies 13 03742 g021
Figure 22. Device efficiency of different number of modules.
Energies 13 03742 g022
Figure 23. System efficiency of different number of modules.
Energies 13 03742 g023
Figure 24. Efficiency of TEG.
Energies 13 03742 g024
Figure 25. Thermal efficiency improvement.
Energies 13 03742 g025
Figure 26. BSFC reduction.
Energies 13 03742 g026
Figure 27. New BSFC.
Energies 13 03742 g027
Figure 28. Driving cycle (New European Driving Cycle (NEDC)).
Energies 13 03742 g028
Figure 29. Engine speed (NEDC).
Energies 13 03742 g029
Figure 30. Drive cycle (Worldwide Harmonised Light Vehicle Test Procedure (WLTP)).
Energies 13 03742 g030
Figure 31. Engine speed (WLTP).
Energies 13 03742 g031
Figure 32. Fuel economy.
Energies 13 03742 g032
Table 1. Engine specifications.
SpecificationsValue
Engine Type2 ZR-FXE (Atkinson Cycle)
Displacement1798 cc
Bore × stroke80.5 mm × 88.3 mm
Compression Ratio13.0:1
FuelGasoline
Max Power72 kW@5200 RPM
Max Torque142 Nm@4200 RPM
Table 2. Fuel economy.
Test DataSimulation
NEDCWLTPNEDCWLTP
65.7 mpg59.6–68.35 mpg56.4 mpg51.0 mpg
Table 3. Best option parameters for the TEG module.
SizeMaterial
25 mm × 25 mmCeramic
Table 4. Engine operating point for TEG.
Operating PointSI Engine
RPMTorque
P1100060
P2100080
P3200090
P43000100
P54000142
P65200130
Table 5. Cost of power generation technologies.
Operating Temperature RangePower Generation TechnologySystem Cost ($/W)
Low (100 °C)Geothermal$4.14
Half-Heusler Thermoelectric$125.05
Chalcogenide Thermoelectric$62.44
Medium (250 °C)Organic Rankine Cycle$4.00
Solar Power$3.60
Skutterudite Thermoelectric$19.02
High (500 °C)Nuclear$5.34
Coal$2.84
Half-Heusler Thermoelectric$4.48
Chalcogenide Thermoelectric$5.06

