1. Introduction
The fuses seem to be a simple structure to those not familiar with their technology, but, actually, fuse operation is not quite so easy to understand in depth, and not even many specialists are familiar with it. Lack of information and application mistakes sometimes lead to faults and errors [
1]. Choosing the right protective device for power distribution systems needs a good knowledge of fuse properties and other protection systems, as well as the actual conditions within those parts of the system, where devices are built in. In a power distribution system, fuses are still utilized because they are quick and capable of interrupting high short-circuit currents [
2].
In telecom power supply grids, high-voltage DC technologies are being implemented more and more. Moreover, the operation of grids is changing, due to the bidirectional power flow. Thus, the protection against short circuits and other electrical hazards demands new ideas for the safety of the system [
3].
In the presented work from [
4], a DC750V fuse was used for an upgraded photovoltaic system at DC1000V, making the system more efficient. The shut-off performance of the fuses was evaluated in tests in which the short circuit current was 200 A or less. The evolution of the protection for photovoltaic systems is presented, as well as a discussion of what challenges appear for fuselink producers. Technical challenges of a global product for photovoltaic protection are also presented with the demands of the various installation standards around the world [
5]. An overview of available fuses and their characteristics for photovoltaic systems applications is considered in [
6], highlighting the shortcomings and overdimensioning, as the voltages are increasing and the fault currents are higher. The need for more coordinated work between PV cell and fuse manufacturers is needed, reflecting the areas where this work is necessary [
7]. In [
8], the authors analyse fast DC fuses used in a series-resonant converter power source. Four stages of the fuse conductor are considered: the linear ageing stage, the nonlinear ageing stage, the fusing and arcing stage, and the arc-extinguishing stage. Some possibilities to improve fuse ageing are also considered.
The DC-arc behaviour of an active fuse integrated into a CMOS technology is presented in [
9] with emphasis on the functionality and reliability of the ‘‘cutout-bridge”. By using a snubber device, the DC-arc behaviour will be significantly reduced and the release time of the fuse will decreased. For higher voltages, when a DC-arc appears, the snubber is able to eliminate the DC-arc fast. Some tests [
10] show that the Joule characteristics of etched fuses are considerably affected by the numbers of parallel and series interruption areas because the patterns in these fuses are too small. With the current possibility of thermal monitoring, the uncontrolled switch-off of HRC fuse damage of electrical equipment due to the melting of fuse elements can be avoided. A test set-up has been designed to estimate the possibility to develop a system for thermal monitoring of HRC fuses [
11].
In [
12], the authors describe stable breaking characteristics and low transient voltage by a specific know-how for interrupting DC voltage and the unique shape of the fuse element. The HVDC fuses for telecommunication power supply systems with stable breaking performance and low transient voltage were achieved by using technologies of an original DC breaking mechanism and suitable fuse element design. Fundamental properties of the OFF to ON state transition of a new type of self-recovering fuse operated by dielectrophoresis are presented in [
13,
14]. The focus of the studies were the effect of the liquid matrix and the substrate material on the OFF and ON resistances of the new fuse and the effect of a mechanical impact or vibration on the ON state properties.
The transient temperature rise of the fuselink and maximum temperature at the constricted area of the fuse element can be achieved by the 3D finite element analysis in place of the classical experiment. In [
15], the authors demonstrate transient temperature rises at any short time duty and at any intermittent duty. An optimization algorithm called Differential Evolution has been used to estimate the convection factor values of LV melting fuses in order to estimate their temperature, based on a 3D simulation model and temperature measurements [
16]. In [
17], the authors present a fuse model that can estimate the fuse current and voltage variations from the start of a shorting accident to the fuse blowing. With the fuse blowing parameters, the characteristics can be estimated by just a single experiment, even if the system is modified. When some systems require increases of the reliability of life-safety-related loads, it is a challenge to design and install systems that operate with currently available fusible and circuit breaker apparatus, because of the size, interrupting rating, short-circuit current rating, and cost. Solutions can give new class of fuse [
18].
A new DC-reactor-type fault current limiter can be obtained through a DC reactor, a bridge rectifier, and antiparalleled IGBTs power electronic switch [
19]. The DC reactor has main and supplementary windings. The main winding has a high inductance and operates as a DC reactor. The supplementary winding operates as a control means for fast fuse operation.
An AC resistance estimation method can be used in calculating the total power losses in fuses for power converter applications. Its precision is verified for various strip ratios, a wide range of strip aspect ratios, and for various temperatures. Thus, power losses into a fuse, from a DC-link circuit of an inverter have been estimated by using Fourier analysis of the DC-link current [
20].
In [
21], the authors present a review of fault characteristics of DC microgrids and the protection challenges. It considers new protection techniques in order to solve the problems and comparative analysis of these techniques, and outlines the strengths and drawbacks of each one.
In [
22], the authors describe an approach to fuse design which is based on optimisation methods. When a feasible solution space has been obtained, the fuse design can be finalised in a way which is robust and less sensitive to dimensional tolerances and other variations. The method varies from conventional design in that the current rating of prototype fuse designs is considered as an unknown quantity until the end of the method. The work from [
23] presents a complex fuse designs with perforated features rather than traditional material thinning, aimed at providing structural stability, using the COMSOL software. It also describes the equivalent thermal capabilities and a structural performance estimation. In [
24], the authors present a mathematical model developed for the designing process of high-voltage current-limiting fuses, which can estimate the heating process of fuses installed in vertical position. Thus, it allows the estimation of the values of the power dissipated and the heat transfer coefficients corresponding to the steady-state conditions. A similar methodology is presented in [
25]. Once these values have been calculated, the temperature distribution at the surface of the complete fuse is obtained.
In [
26], a HV shunt capacitor protection fuse has been designed according to GB15166.5-94 standard for a rated voltage of 3.5 kV and a frequency of 50 Hz in order to protect a single capacitor or parallel capacitor. The analysis in [
27] shows a design of high-voltage vacuum-type hybrid current-limiting fuses for double protection characteristics. These can meet the requirements of both overload protection and short circuit current protection for the external shunt power capacitor. In [
28], the authors present fuse-interrupting tests under DC 4000 V with low inductance. Three large rated-current fuses were connected in parallel and the breaking tests under DC 4000 V were validated through experiment tests.
Therefore, it can be concluded that previous research work has focused on photovoltaic protection systems from an economical point of view, DC fuses for the telecommunication industry and the protection of batteries of electric vehicles, HV current limiting fuses, shunt capacitor protection fuses, and 3D simulation models for HBC and semiconductor fuses. New trends related to DC active fuses based on semiconductor technology and self-recovering fuses operated by dielectrophoresis have also been outlined.
Because, following the reviewed literature, no investigations have been outlined regarding the 3D analysis of DC fuses for the protection of photovoltaic systems, the need for thermal analysis of such a fuse arises. Hence, the novelty of the paper is the 3D thermal analysis of a DC fuse in the range of medium voltage considering different type of fuselink elements. The objectives of the proposed research are the following: the achievement of a three-dimensional thermal model of DC fuse with circular and rhombic notches; three-dimensional thermal simulations of the DC fuse both in steady-state and transient conditions; 3D analysis of the thermal field along the fuselink and outer ceramic housing; analysis of the thermal transient impedance both for fuselink and ceramic housing; comparison between temperature distribution in the case of circular and rhombic notches of the fuselink; and experimental tests and comparison with the thermal simulation results. The study will highlight the influence of the notches’ shape on the temperature distribution and, finally, on the time–current characteristic of the DC fuse which represents a new approach to fuse design.
2. Thermal Model
The general form of the heat transfer equation is:
where it can be noticed that the thermal power because of the current flow through the current path (
ρj2) is in balance with the heat stored because of temperature–time variation (
γc∂θ/∂t) from which is subtracted the heat removed from the current path because of thermal conduction (
div(λgradθ)). The main component of an electric fuse is the fuselink element, which usually does not have constant cross-section. In order to obtain a specific protection characteristic, the fuselink has so-called notches of different geometries: circular, rhombic, or rectangular.
The material parameters of the different components of the fuse depend on the temperature, including electrical resistivity and specific heat. Hence, the differential Equation (1) is nonlinear and has variable coefficients. This type of equation can be solved by using numerical methods, such as the finite element method. There are many commercial software packages based on finite element method, one of them being Pro-ENGINEER, which will be used to perform thermal modelling of the analysed DC electric fuse.
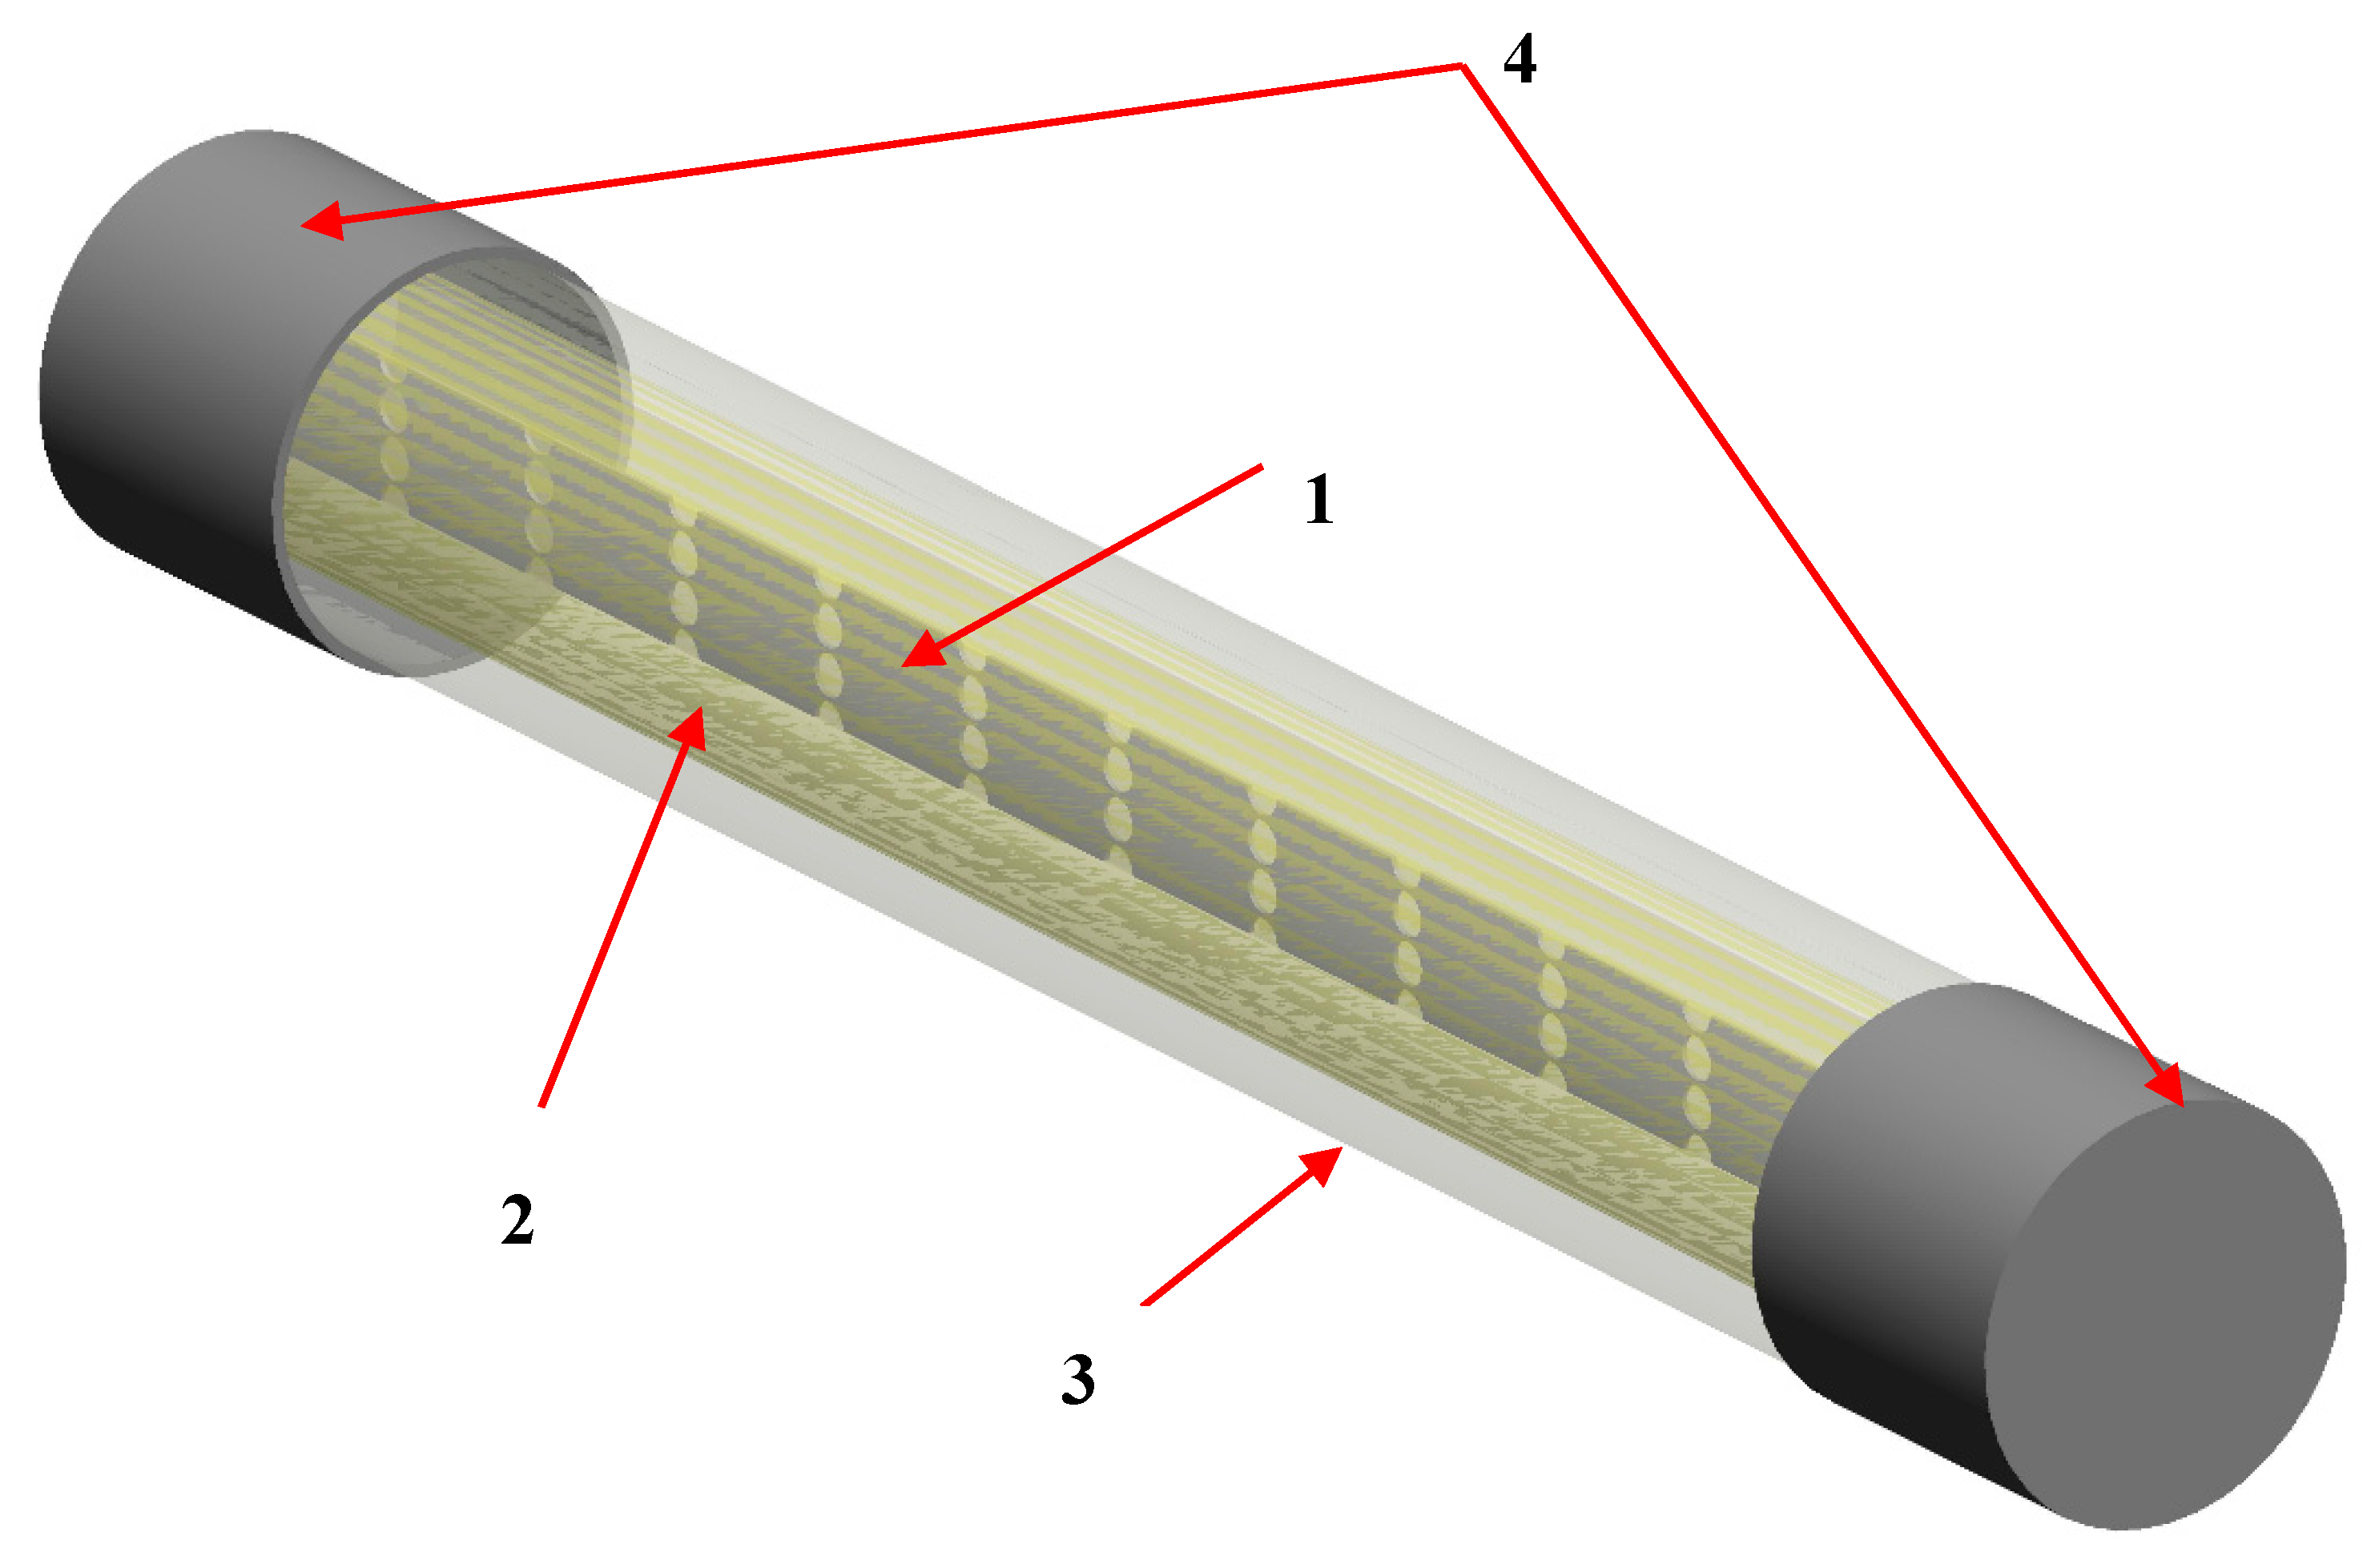
Hence, the three-dimensional model of the DC fuse has been developed using the software package mentioned above, Pro-ENGINEER, which is an integrated thermal design tool for all accurate thermal analysis on different type of devices. The analysed DC fuse, DC1600 V/32 A, has the rated current of 32 A, rated voltage of 1600 V, power losses of 7.3 W, and breaking capacity of 50 kA. The three-dimensional geometry model includes all the main components of the DC fuse, such as end caps, ceramic housing, quartz sand, and the fuselink element, as presented in
Figure 1.
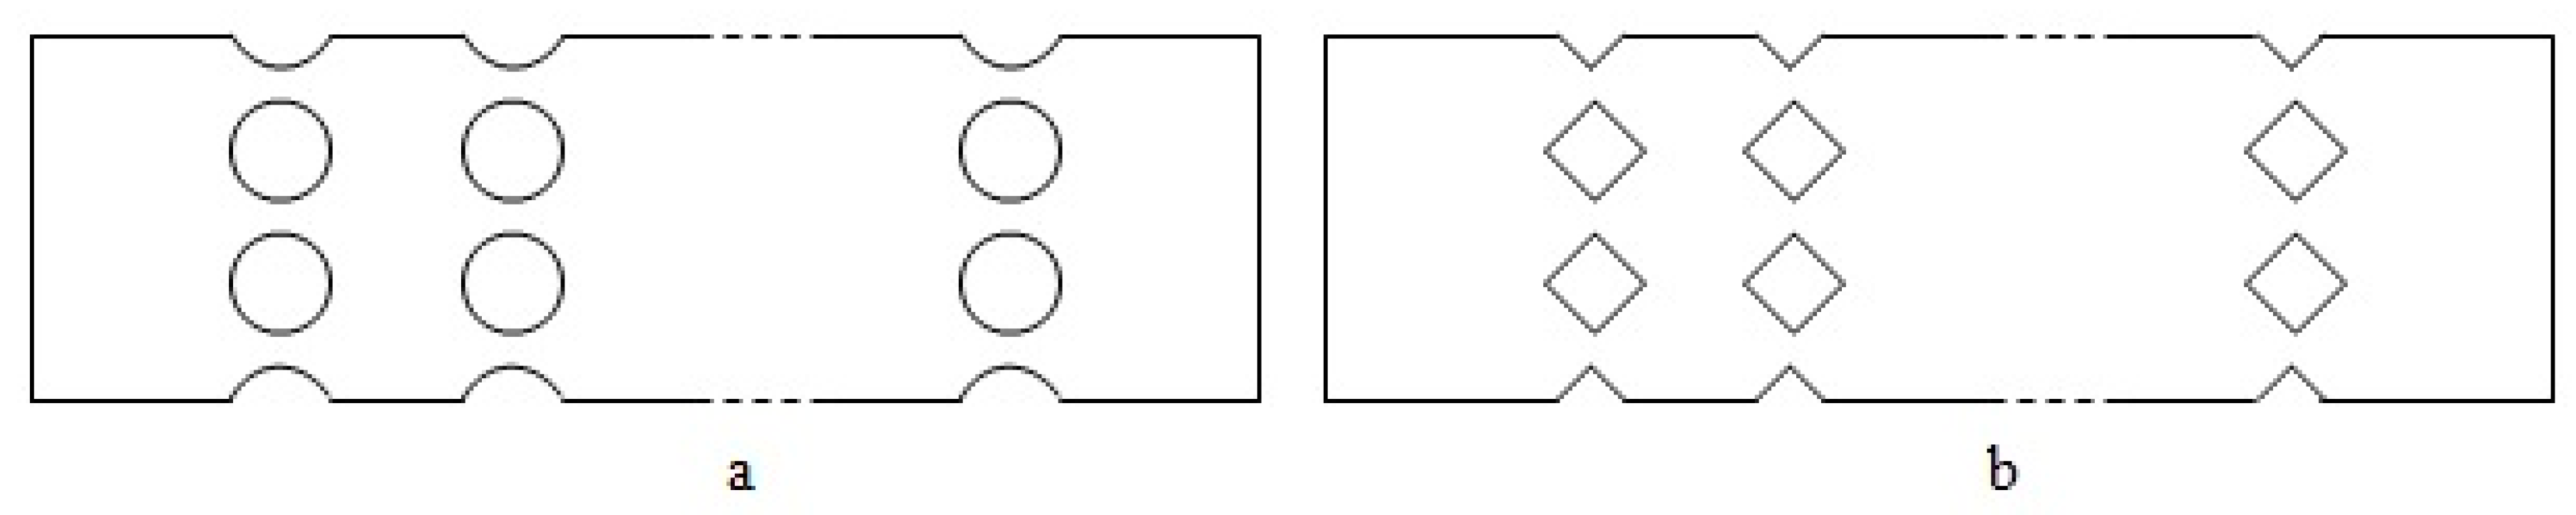
The geometry model had considered two types of the fuselink: the first with circular notches and the second with rhombic notches, as shown in the outline from
Figure 2. The different shapes of the fuselink geometry, especially the number and shape of the notches, lead to a different thermal distribution along the fuselink element and, finally, a different variation of the time–current protection characteristic is obtained. This was the reason to investigate, from a thermal point of view, two different fuselink geometries.
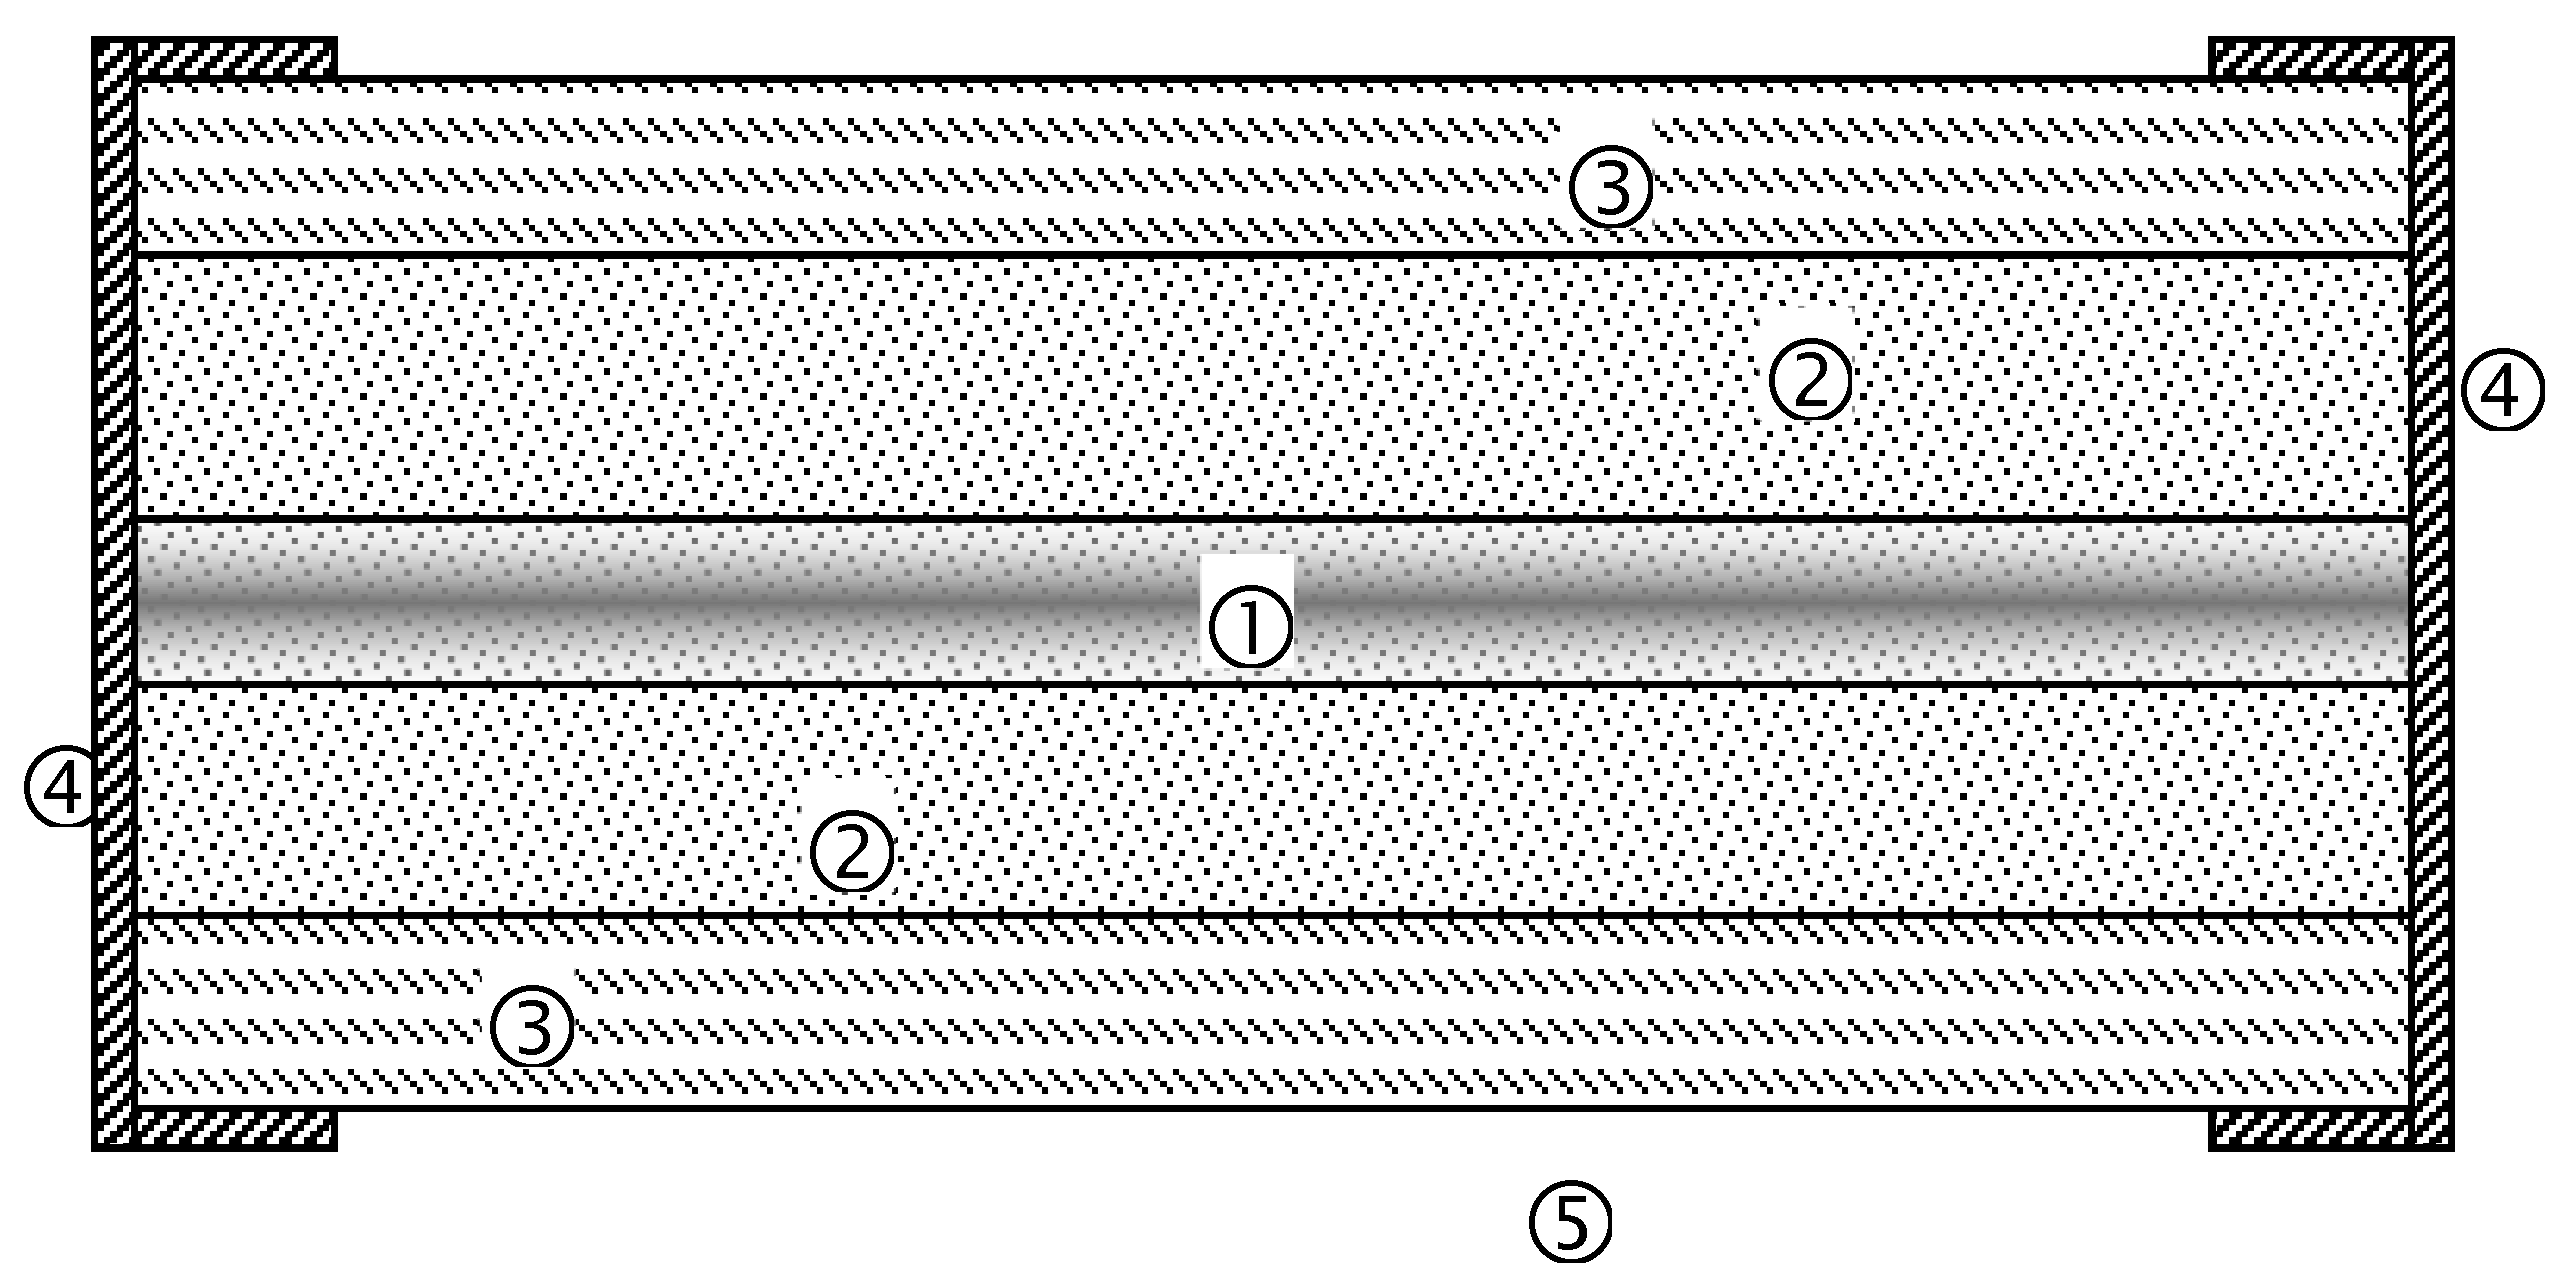
Before starting the thermal simulations, it is important to define the heat transfer equations and boundary and initial conditions of the analysed fuse model. With the aim to define the thermal model, we must consider that the electric fuse is not a homogeneous body and has different components made of materials with very different physical properties. Therefore, the analysed DC fuse has been divided into subassemblies that do represent the main component parts of the electric fuse, as presented in the
Figure 3. Next, for each subdomain, the thermal transfer equation, the boundary and initial conditions will be defined.
Boundary conditions (between solid material from subdomain 1 to subdomain 2 and from subdomain 1 to subdomain 4):
Boundary conditions (between solid material from subdomain 2 to subdomain 3 and from subdomain 2 to subdomain 4):
Subdomain 3: ceramic housing Boundary conditions (between solid material from subdomain 3 to subdomain 4; convection condition to the outer subdomain 5-air):
Subdomain 4: cap contacts Boundary conditions (between solid material from subdomain 4 and subdomain 1; convection condition to the outer subdomain 5-air):
3. Thermal Simulations
As mentioned above, a DC1600V/32A fuse has been investigated from the thermal behaviour point of view both in steady-state and transient conditions. The fuse includes one fuselink element made from silver, which is placed in the middle along the ceramic housing. The silver fuselink is surrounded by quartz sand and is welded on the copper end caps at both terminals of the DC fuse.
The 3D thermal analysis has been considered two types of the fuselink: circular and rhombic notches. In both analysed cases, the fuselink has the thickness of 0.1 mm, length of 120 mm and the width of 6 mm. The notches are placed on the surface of the fuselink as a matrix with two rows and 12 columns. Also, the upper and lower edges of the fuselink have half notches. The 3D fuse assembly with circular notches on the fuselink is presented in the
Figure 2. The material characteristics of each component part of the DC fuse are described in the
Table 1. Moreover, during thermal simulation computations, the temperature variation of the electric resistivity and specific heat for both copper and silver was considered according to the following calculation relationships:
Copper material:
Electric resistivity temperature variation:
Specific heat temperature variation:
Silver material:
Electric resistivity temperature variation:
Specific heat temperature variation:
The thermal simulations both in steady-state and transient conditions were performed using the Pro/MECHANICA software package which uses adaptive p-element technology while conventional finite element codes use nonadaptive h-element technology. The basic geometry can be followed with higher accuracy. The elements use a polynomial equation to describe the stress shape function, which can vary from third to ninth order. This means that fewer elements are required and they can follow high stress gradients very closely. Furthermore, an automatic convergence strategy can be performed, whereby the polynomial order of the elements is increased rather than having to remesh with smaller elements. An important feature of Pro/MECHANICA software is the built-in optimisation capability, so that designs can be optimised efficiently and automatically. The mesh of the DC fuse thermal model has been obtained with tetrahedron solids element types with the following allowable angle limits (degrees): minimum edge: 5; maximum edge: 175; minimum face: 5; maximum face: 178.5. The maximum aspect ratio was 25.45 and the maximum edge turn was 97 degrees. The thermal steady-state simulations have been solved using the single pass adaptive convergence method. The final structured mesh has 59,757 elements.
During all thermal simulations, an ambient temperature θa = 23 °C was considered. From experimental tests, it was obtained the values of the convection coefficient k = 21 W/m2°C for the end caps and k = 14.5 W/m2°C for the outer surface of the ceramic housing. This coefficient has been considered as boundary condition with a uniform spatial variation.
The thermal load has been applied on the fuselink component and it was equal to P = 7.3 W—the power loss of fuse operating at rated current In = 32 A. The bulk temperature was the same as the ambient temperature.
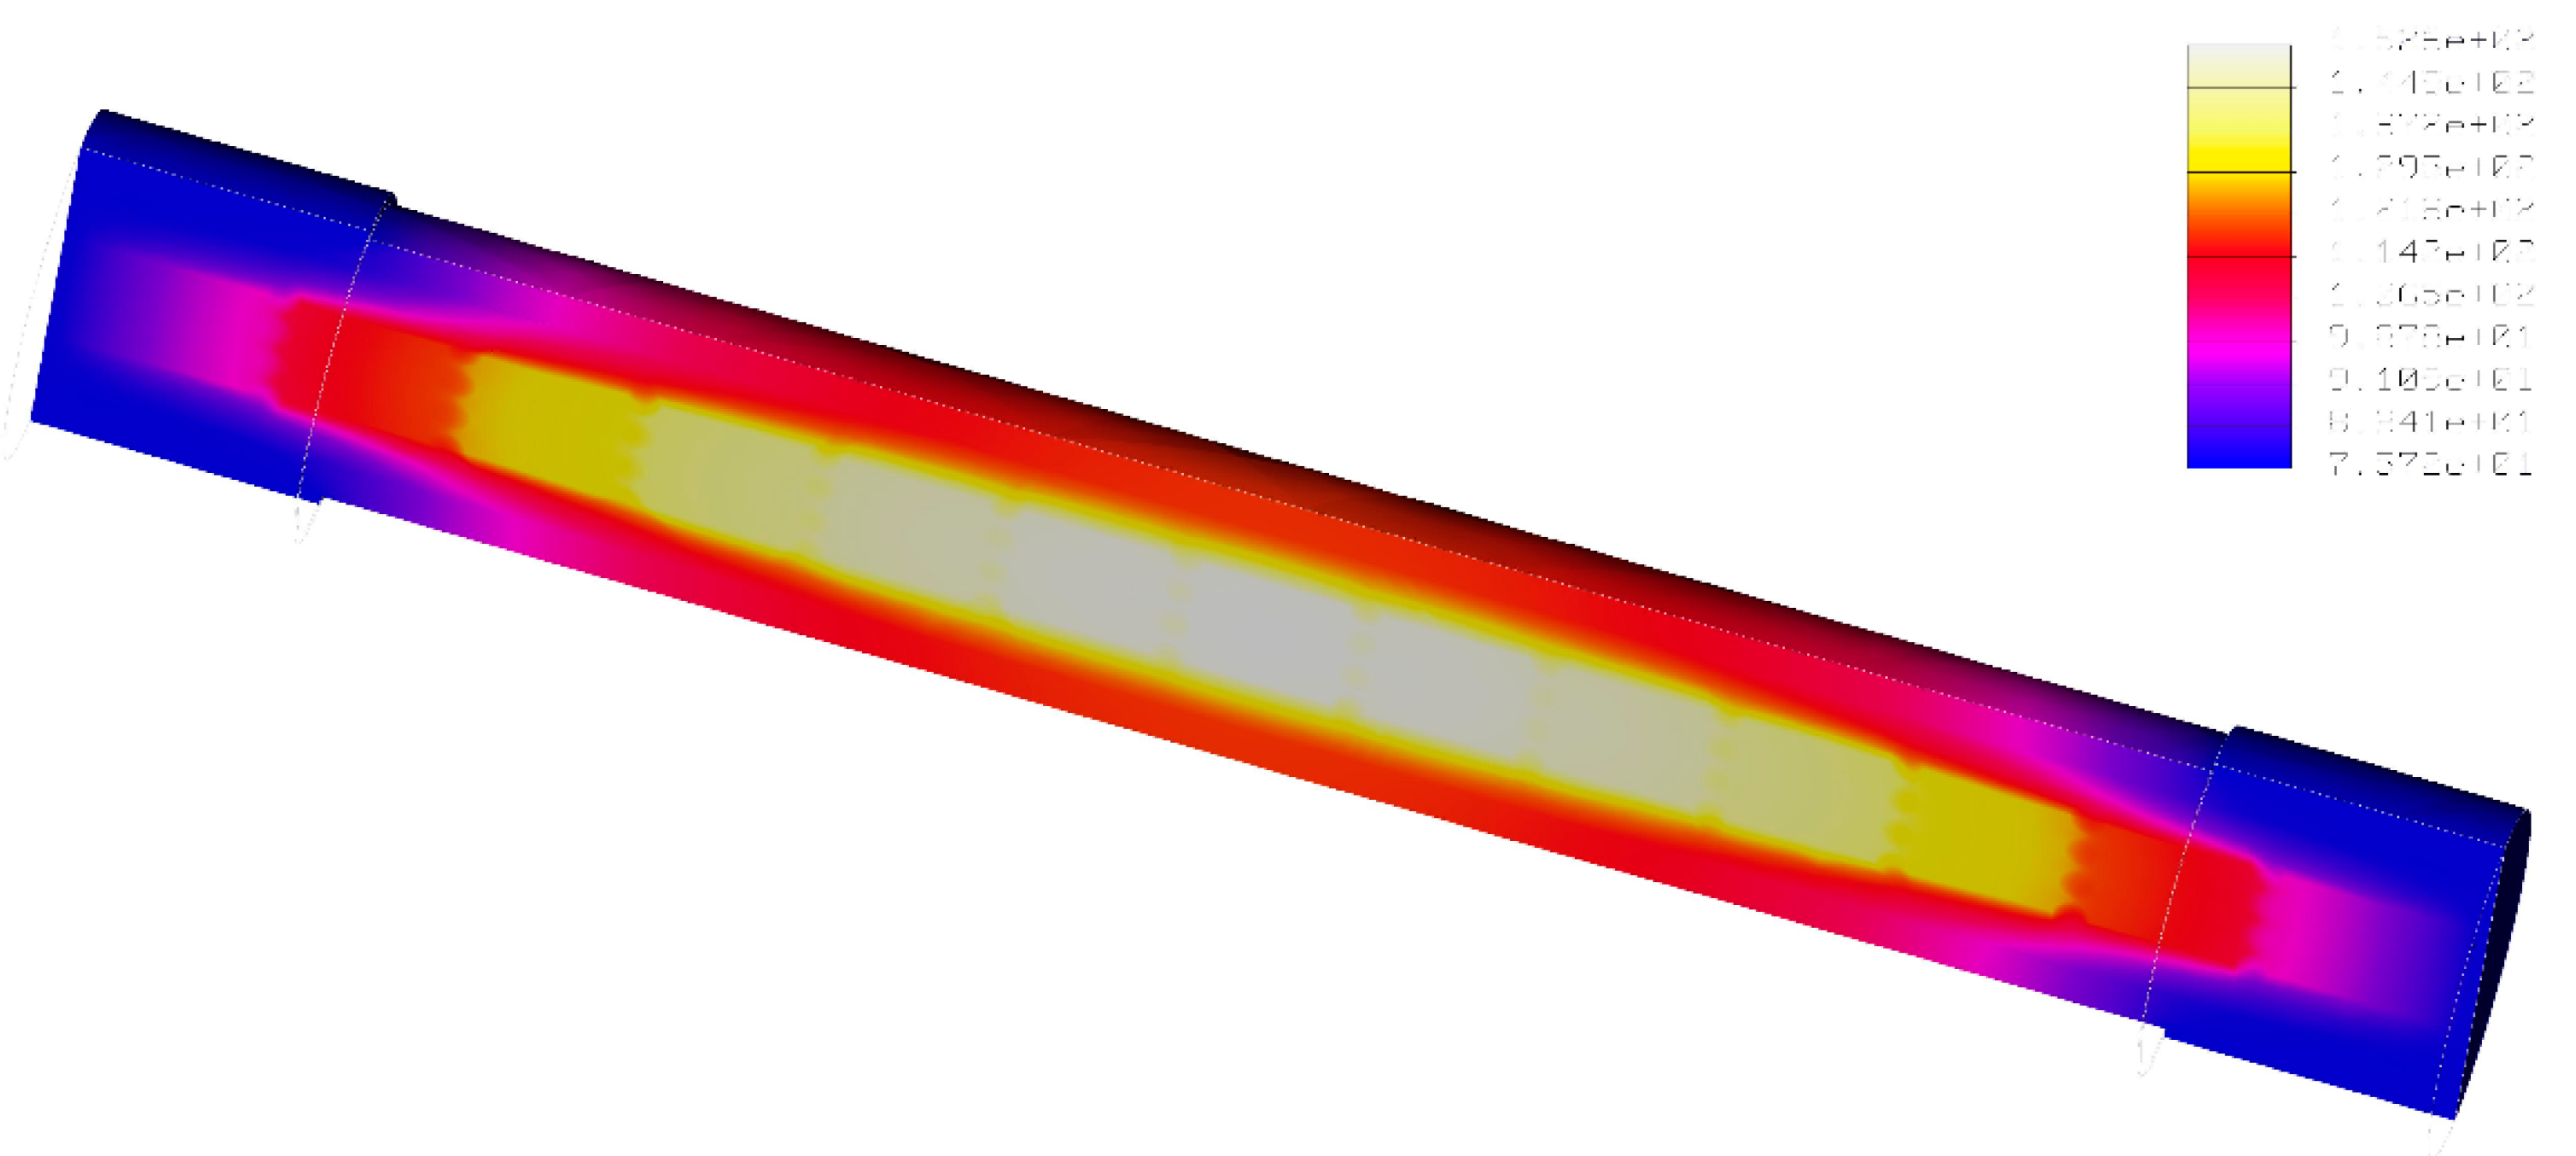
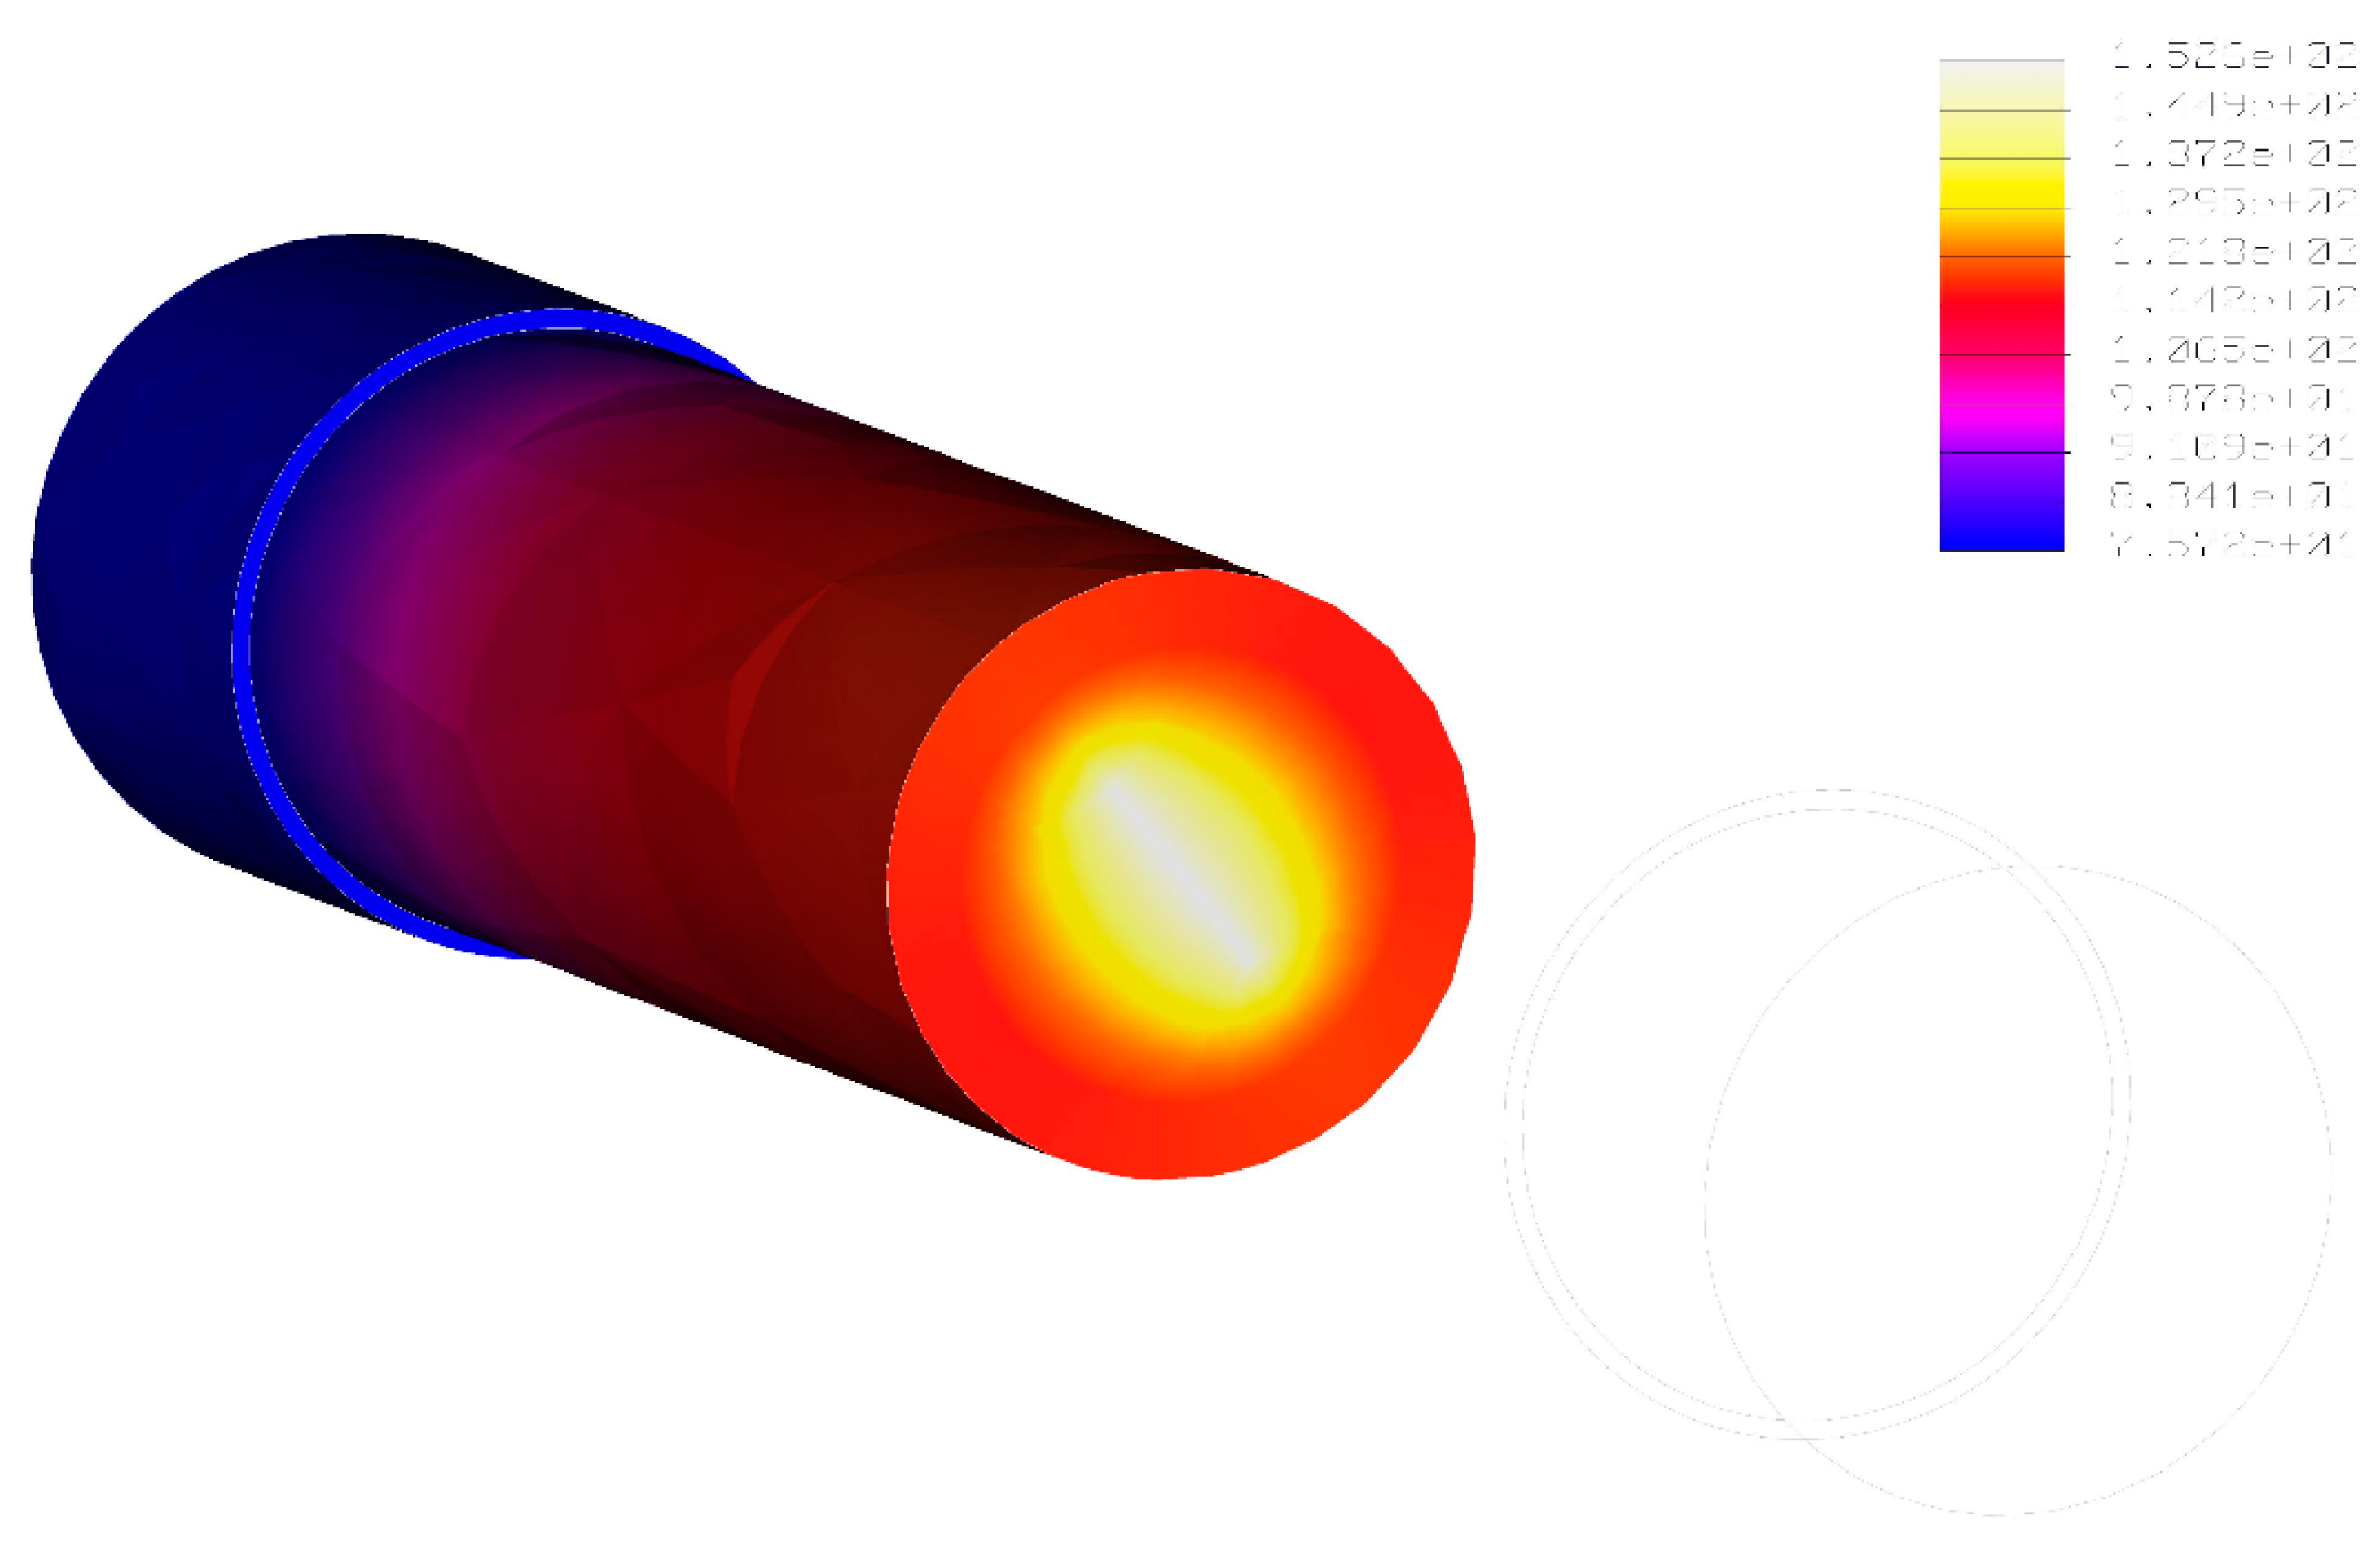
The thermal field distribution during steady-state conditions of the analysed fuse which works at rated current is shown in the next pictures,
Figure 4 and
Figure 5. Presented here is only the case of fuselink with circular notches because the temperature distribution inside the fuse with the fuselink with rhombic notches is qualitatively the same, but the temperature values are different.
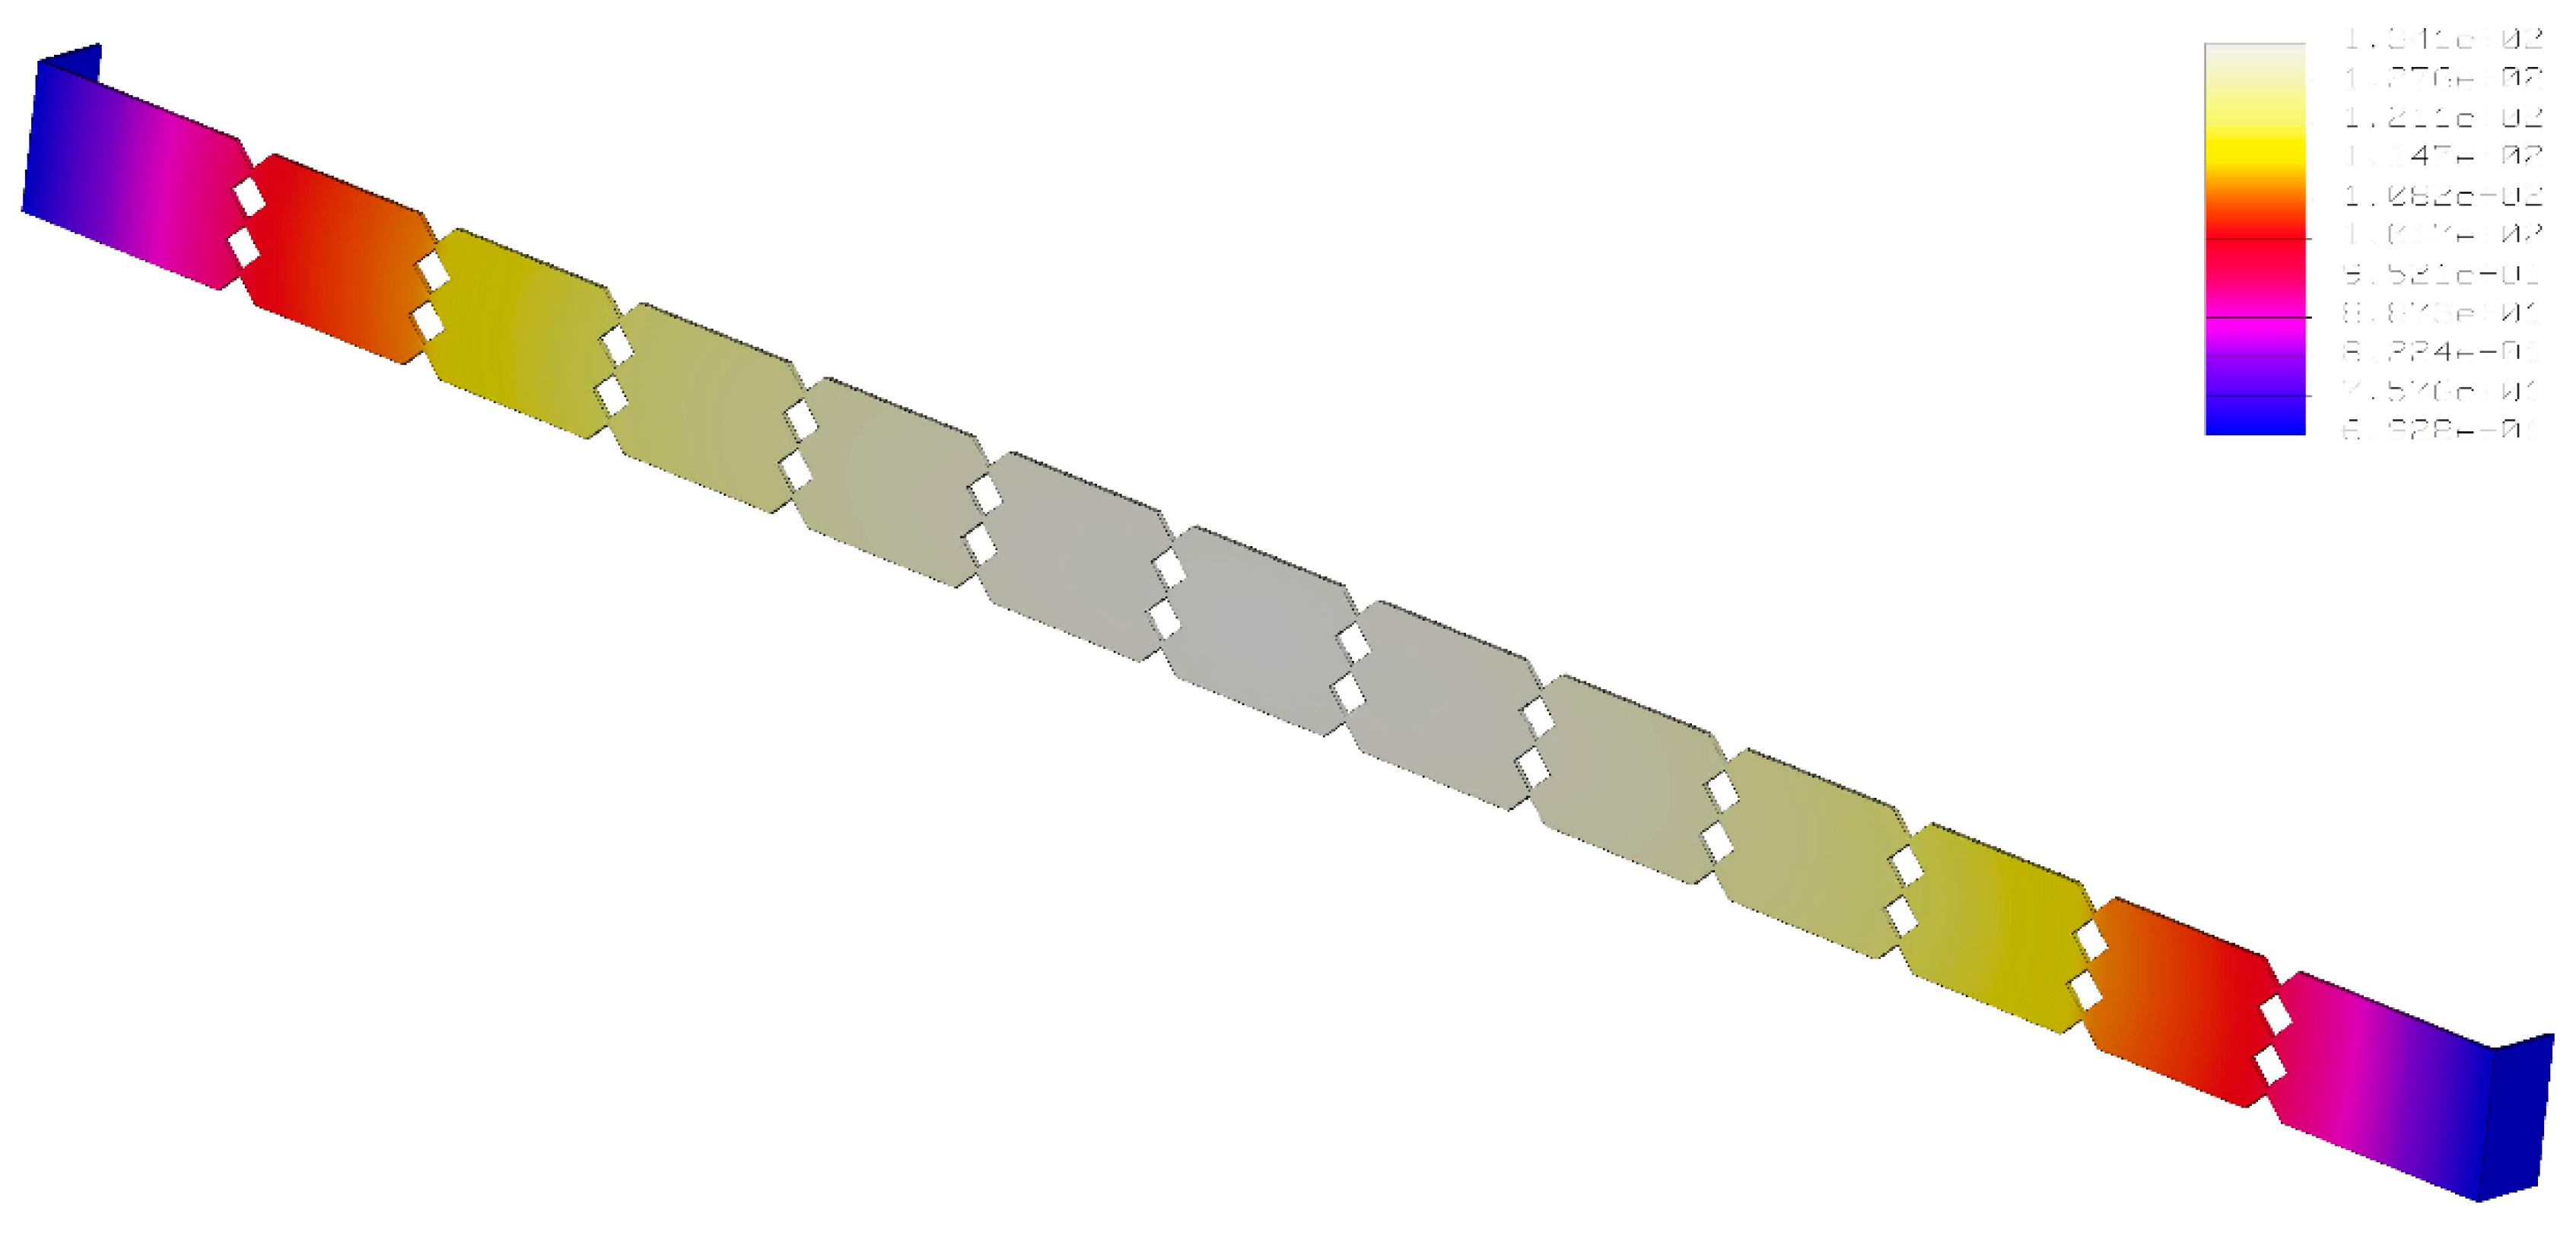
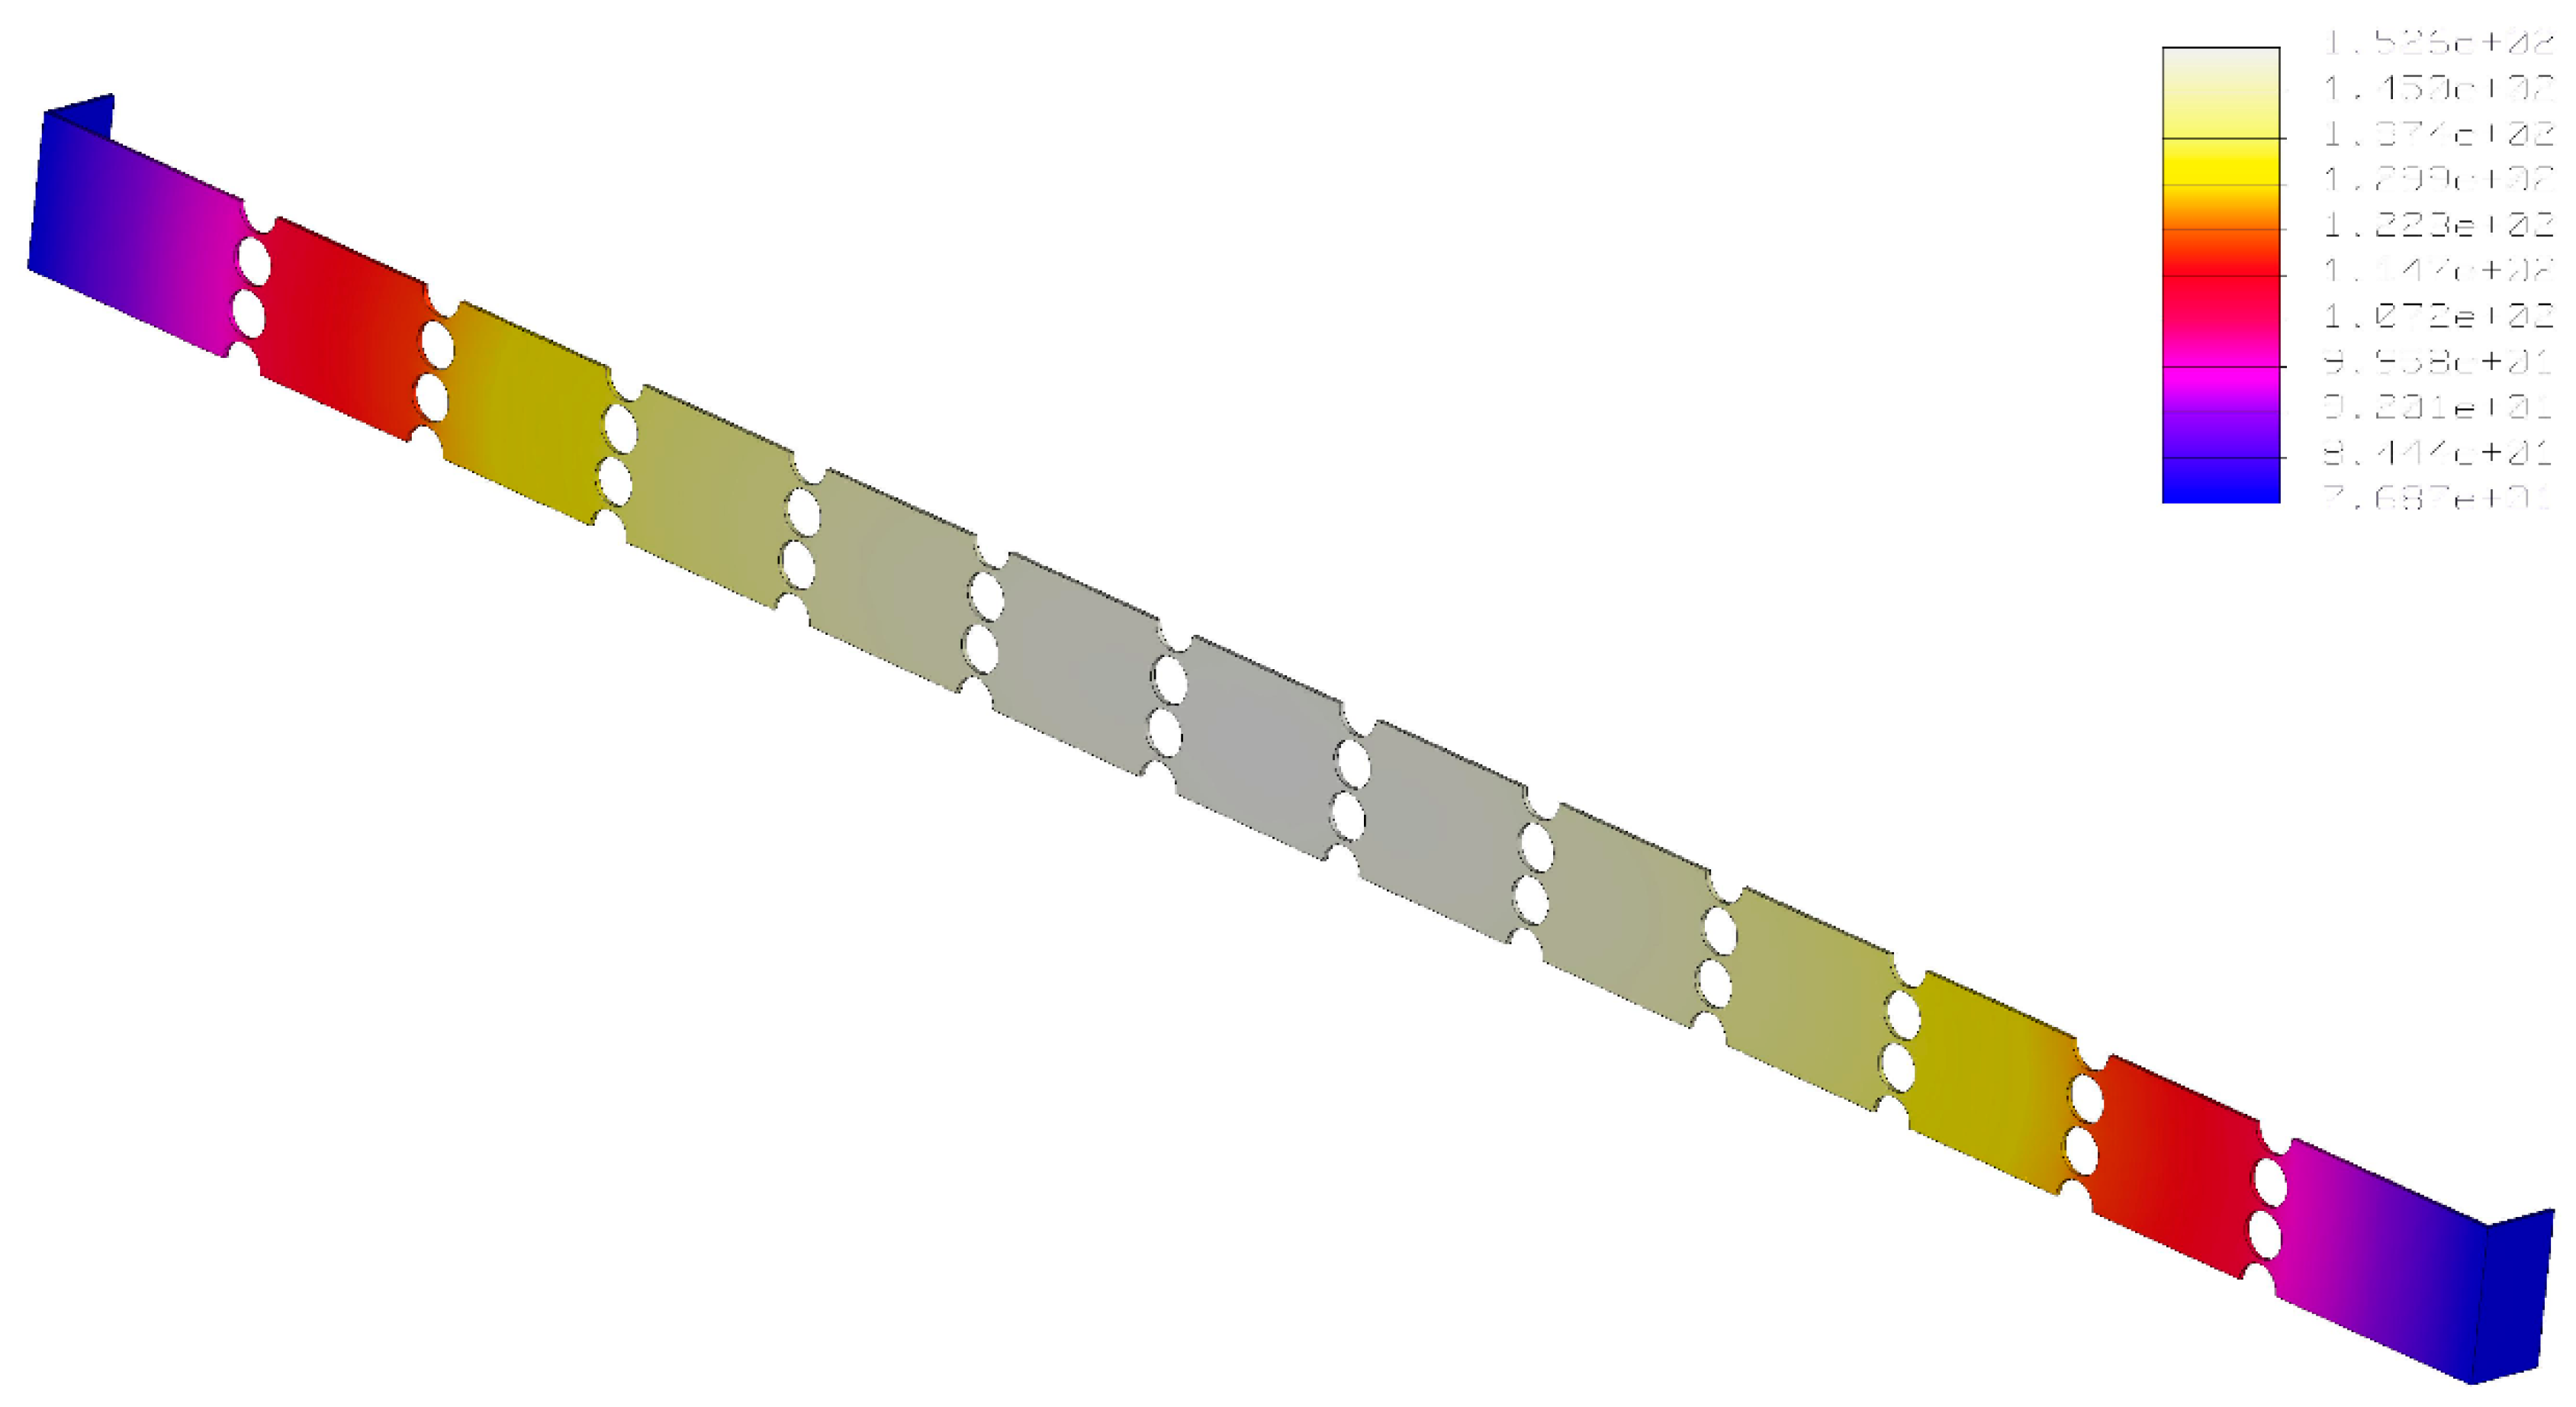
Furthermore, the thermal field distribution only of the fuselink with circular notches and with rhombic notches is shown in
Figure 6 and
Figure 7, respectively. It can be observed that in the case of fuselink with circular notches, the temperature values are higher than the case of fuselink with rhombic notches, for instance, the maximum temperature in the first case is 152.6 °C and the minimum temperature is 75.7 °C, as against the case of fuselink with rhombic notches where the maximum temperature is 134.1 °C and the minimum is about 68.5 °C.
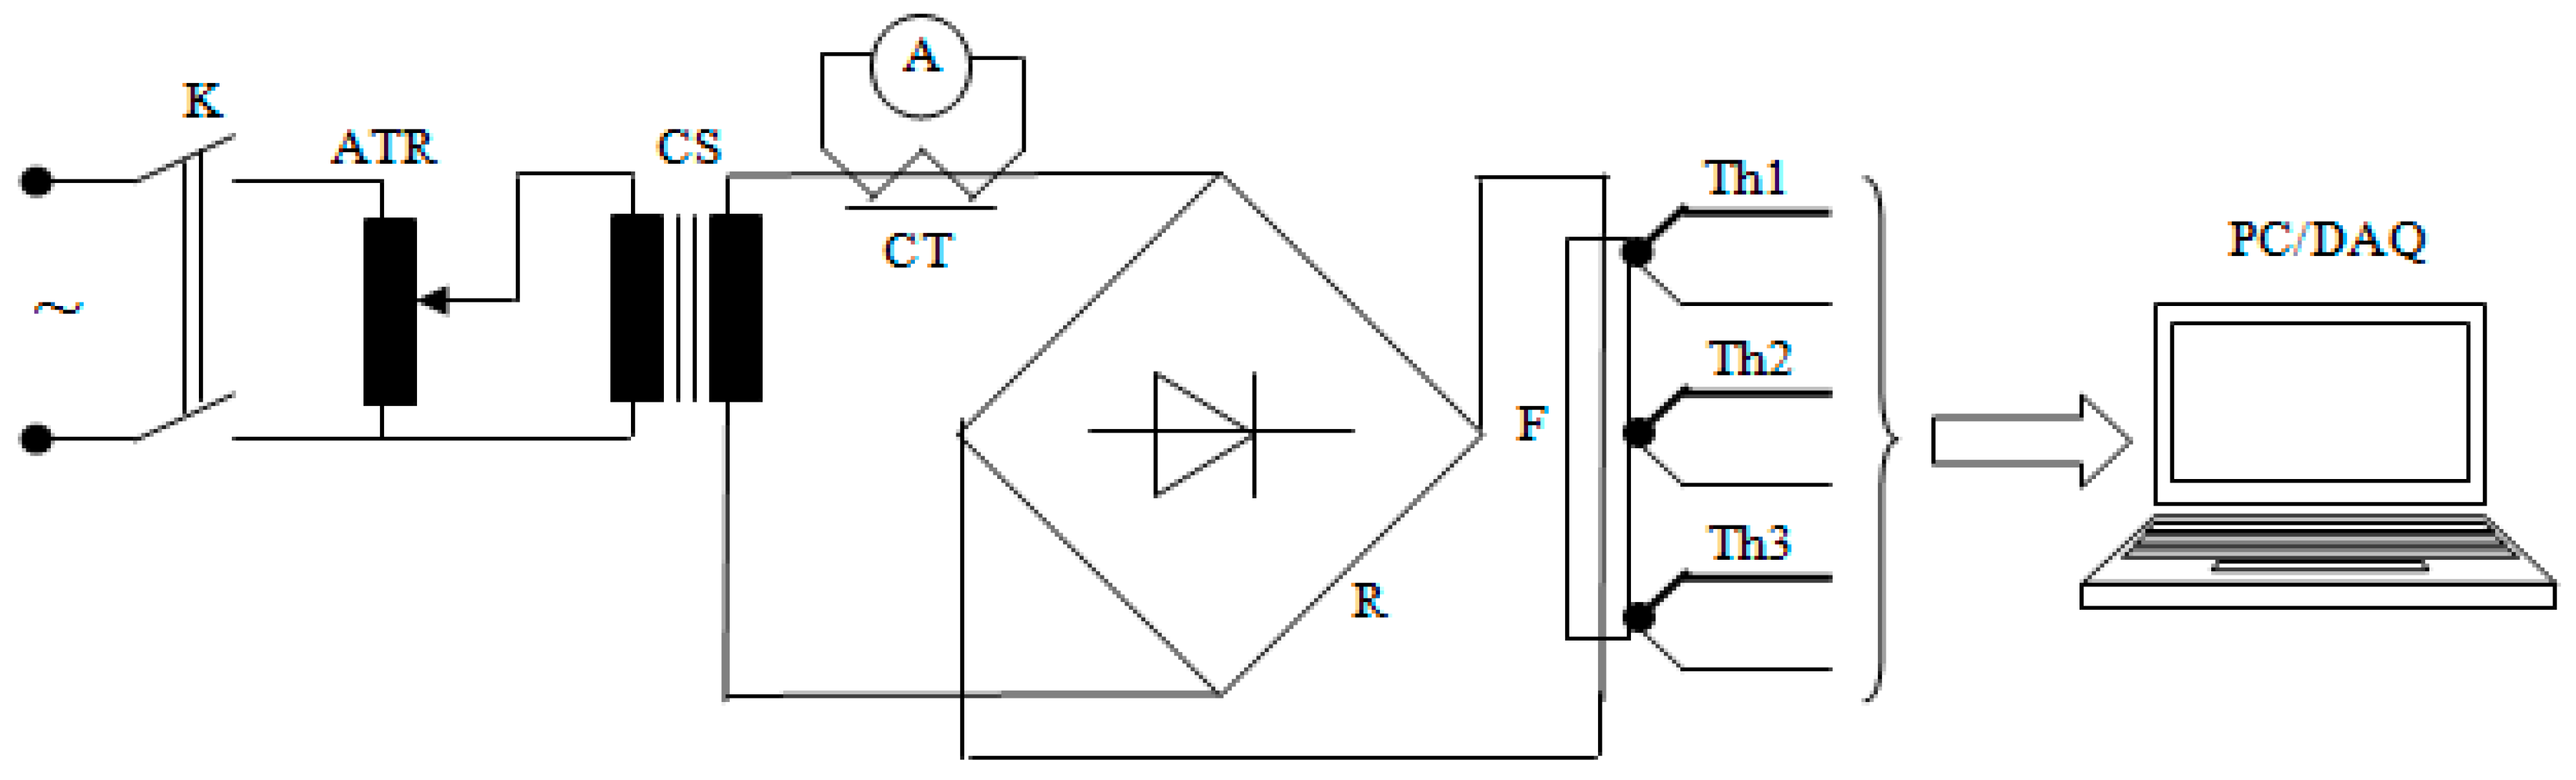
In order to validate the above thermal simulations, a series of experimental tests have been performed. The test bench diagram is shown in
Figure 8. The autotransformer (ATR) is supplied through a single-phase switch-disconnector (K). The autotransformer adjusts the input voltage on the primary side of the current source (CS). This is a power electromagnetic device which has high voltage values on the primary side and high current values on the secondary side. Hence, the current source CS supplies the tested fuse F with different DC current values using the bridge rectifier R. The ammeter A measures the current value through the current transformer CT. The measured temperatures were acquired by using thermocouples Th1…Th3 which were mounted on the fuselink and on the outer surface of the ceramic housing. For reasons of simplifying the picture, only three thermocouples are represented. In reality, five thermocouples were used to acquire the temperature in the prescribed measurement points. The voltage signals from thermocouples were amplified by a signal conditioning board type AT2F-16. Then, the amplified signal was considered as input for the data acquisition board type PC-LPM-16. This can be programmed using the LabVIEW software package. Because of technological reasons (a specialized workshop equipped with moulds is needed to manufacture the specific shapes of the notches on the silver fuselink of the fuse) the experimental tests were recorded only in the case of fuselink with circular notches.
4. Discussion of the Results
Following the 3D thermal simulations during steady-state conditions, it can be observed in both the fuselink with circular and with rhombic notches that the maximum temperature is obtained in the middle of the fuselink element; see
Figure 6 (152.6 °C) and
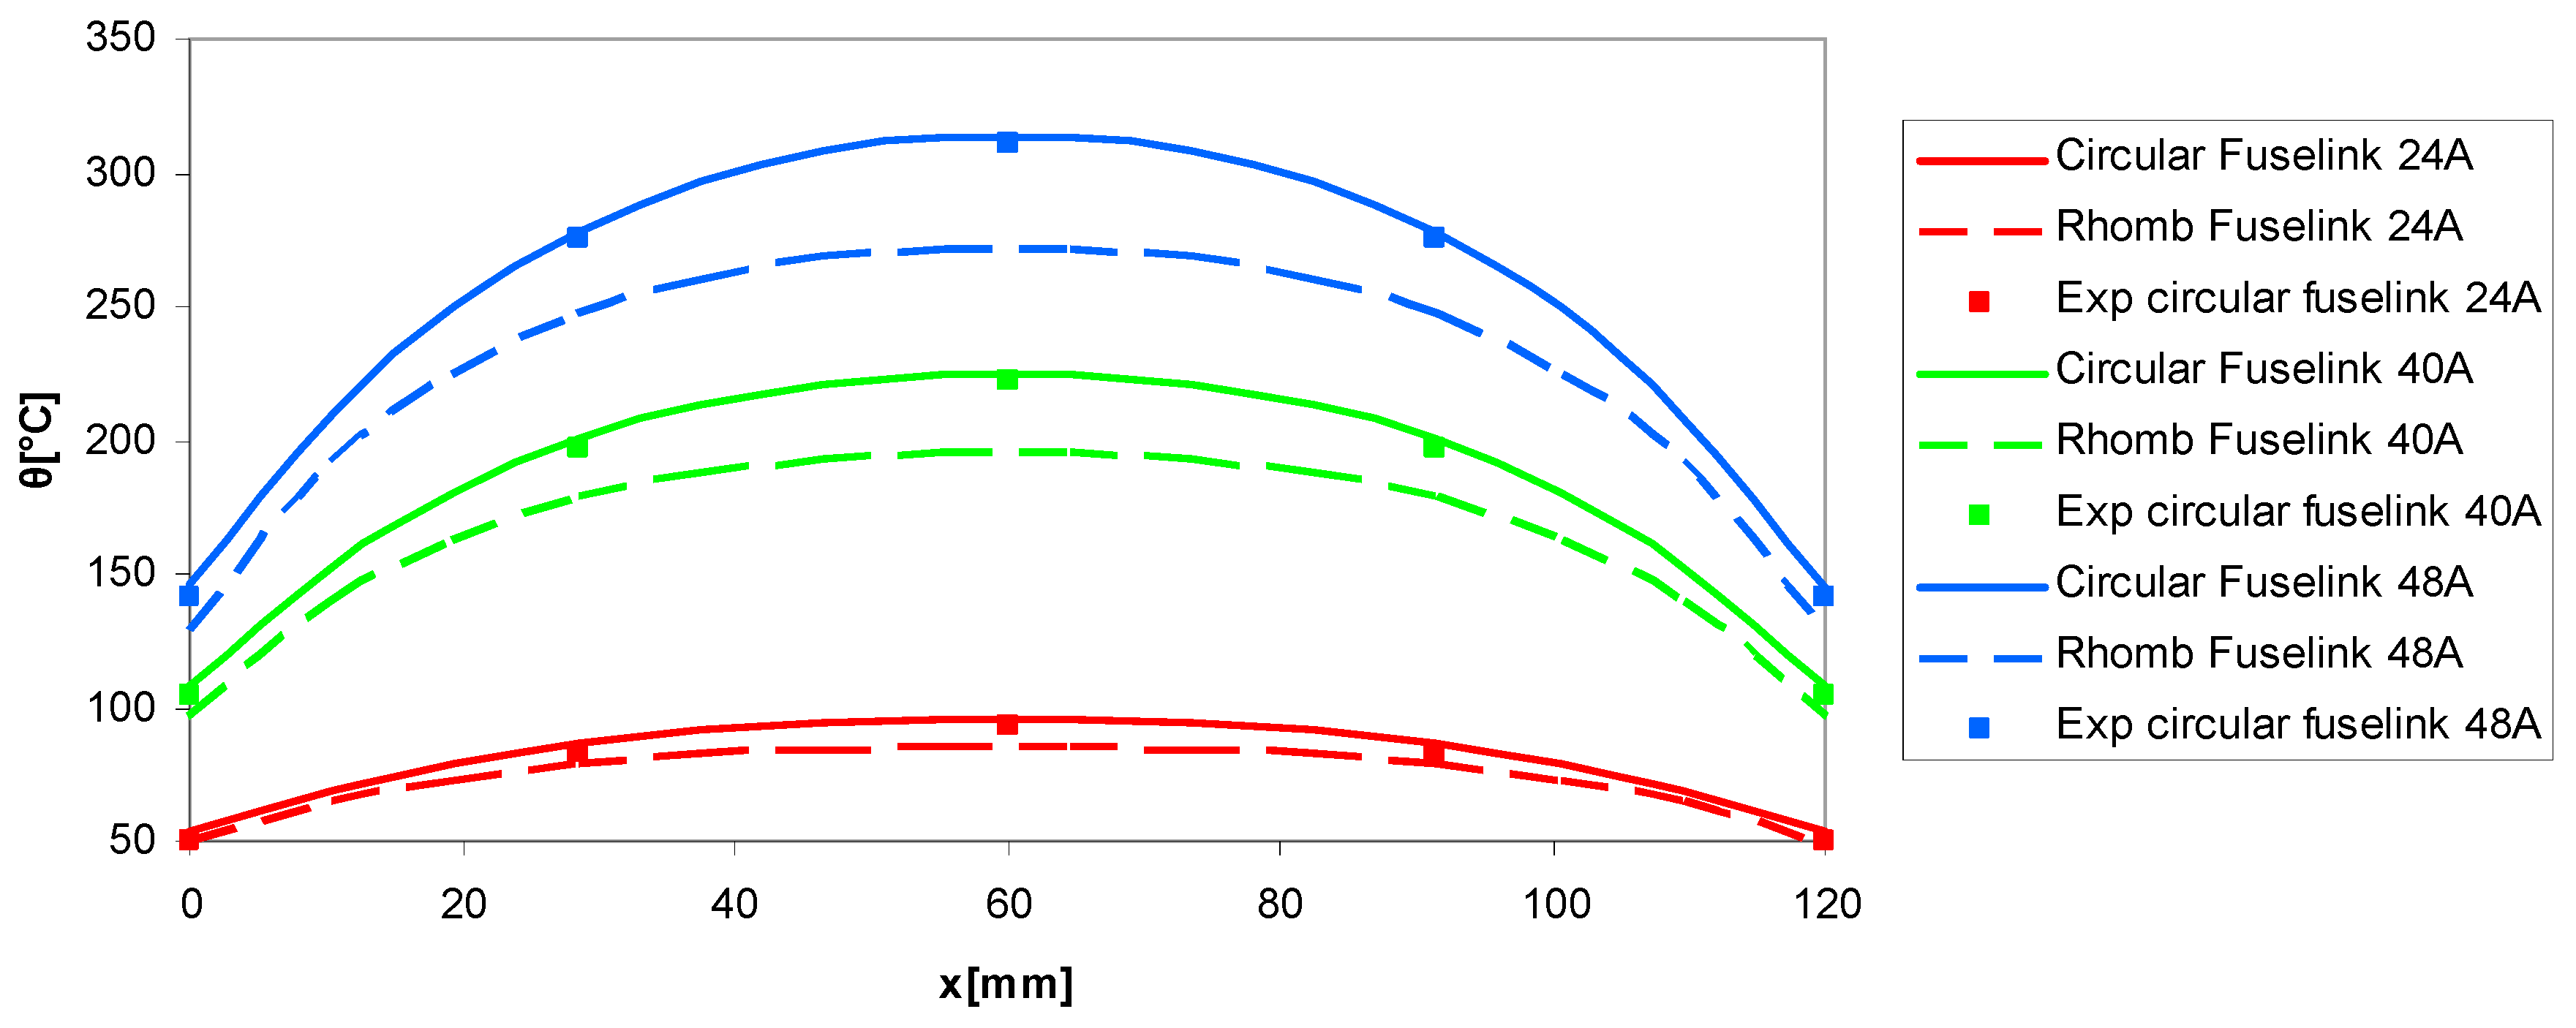
Figure 7 (134.1 °C). This can be explained because of notches placed along the fuselink and their geometric arrangement. Lower temperatures are presented at the terminals of the fuse due to the increased thermal diffusion of the end caps (75.7 °C in the case of circular notches and 68.5 °C for rhombic notches). The thermal model includes a series of 14 measurement points which have been placed along of the silver fuselink at the following distances x: 0; 10.5; 19.5; 28.5; 37.5; 46.5; 55.5; 64.5; 73.5; 82.5; 91.5; 100.5; 109.5, and 120 mm. After each 3D thermal simulation, the temperature values of these measurement points are recorded in a file after which they can be used in the graphs of spatial or temporal variation of temperature on the fuselink or on the surface of the ceramic housing.
In the first graph,
Figure 9, there is the comparison between fuselink with circular and rhombic notches of the temperature distribution along both fuselink and ceramic housing. Regarding the temperature variation along the fuselink, it can be seen that there are higher temperature values in the case of circular notches compared to rhombic notches.
That difference has a maximum in the middle of the fuselink (152.6 °C in the case of circular notches respect to 134.1 °C for rhombic notches) and a minimum at the end terminals of the fuselink (77.5 °C for circular notches compared to 69.9 °C in the case of rhombic notches). Also, the temperature variation along the ceramic housing highlights a difference between temperature values in the case of circular notches respect to the situation when rhombic notches have been used. Hence, when the thermal simulations were performed with circular notches, the maximum temperature was 116.05 °C, higher than the 95 °C in the case of rhombic notches, and the minimum temperature was 76.4 °C compared to 68.8 °C for the rhombic notches,
Figure 9. In addition, it can be seen that there is an approximately constant temperature both for the circular or rhombic notches at the end terminals of the ceramic housing. This is due to the influence of the end caps that are mounted at the terminals of the ceramic tube. They have a length of 14 mm and the constant temperature at the ends in this area can be seen.
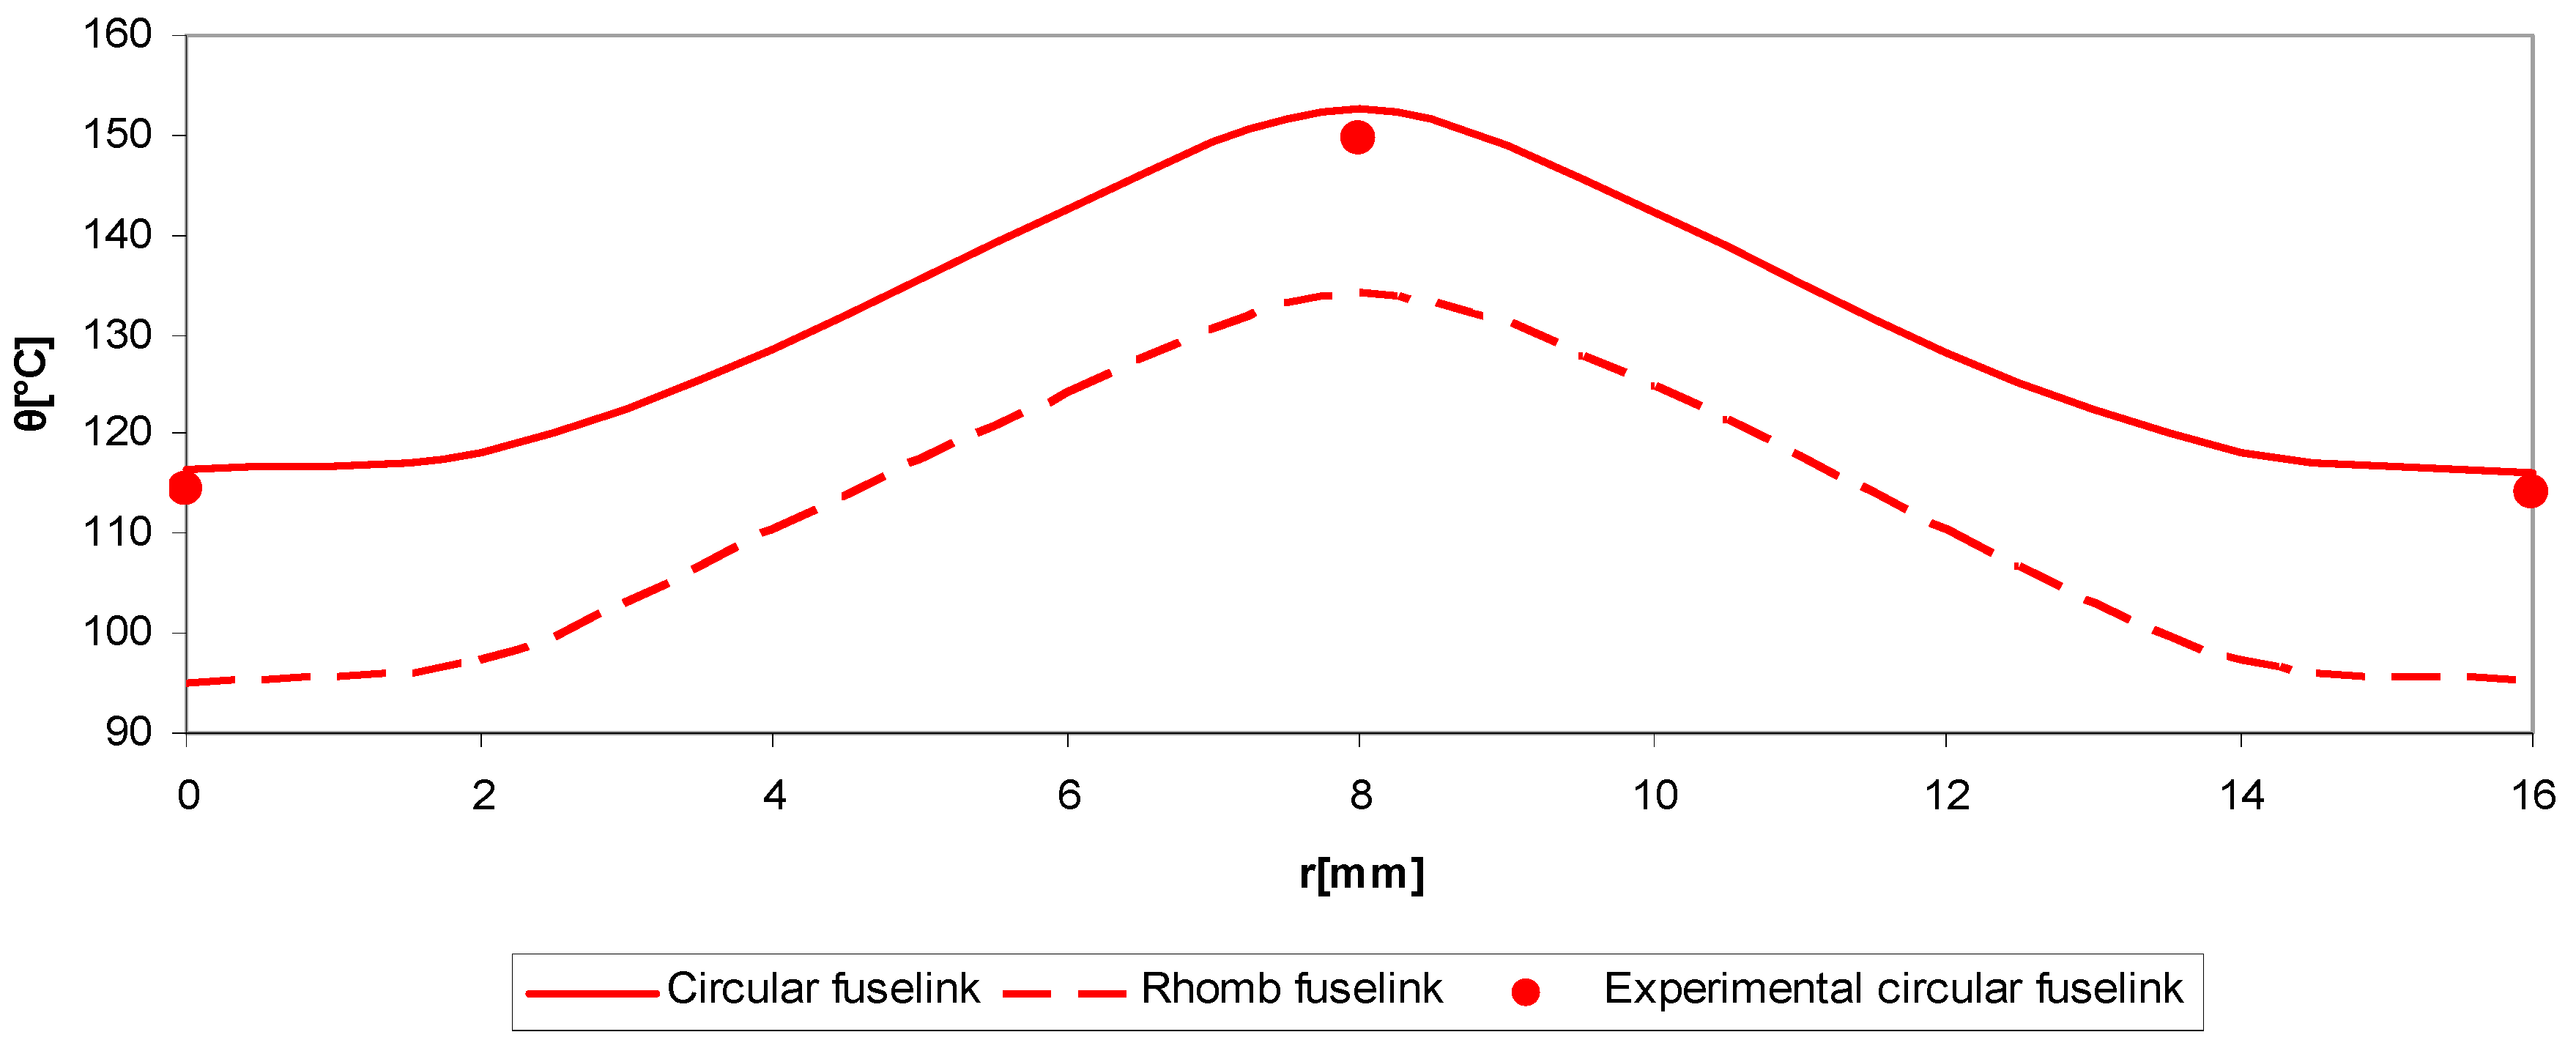
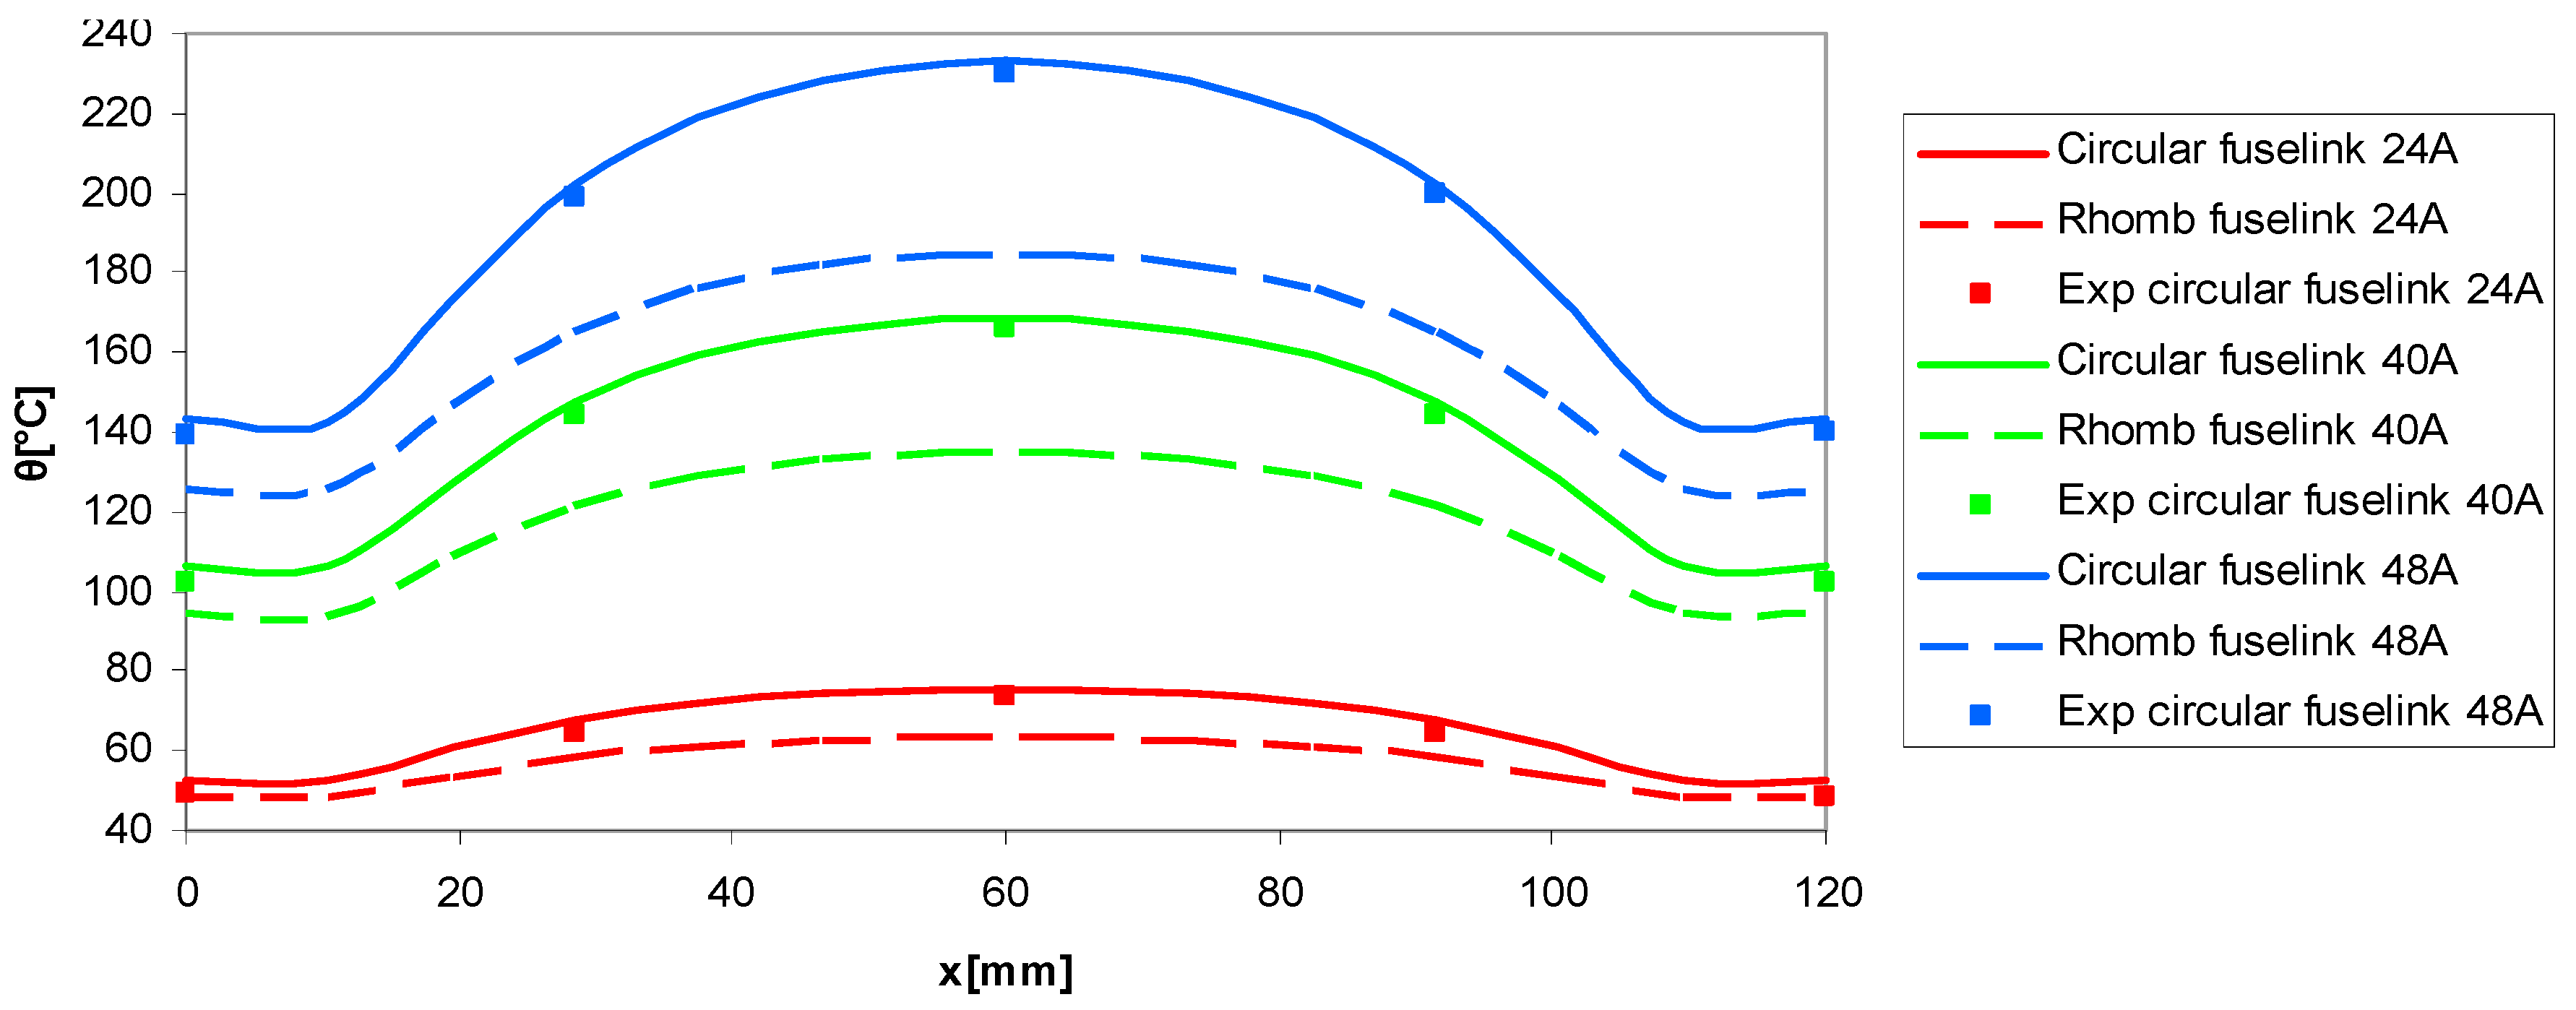
In the second graph,
Figure 10, there is the same comparison of the temperature distribution of the fuselinks with circular and rhombic notches, but this time along the radius r of the fuse.
The ceramic housing has an outer diameter of 16 mm and thickness of about 2 mm. This explains the approximately constant temperature both for the circular or rhombic notches along the thickness of the 2 mm ceramic tube at both diametrically opposed areas. The presented graph is the middle cross-section temperature distribution through the fuse. The temperature difference in the centre of the fuse between the fuselink with circular and rhombic notches is about 18.5 °C (circular notches: 152.6 °C–134.1 °C rhombic notches) and, on the outer surface, it is 21.4 °C (circular notches: 116.4 °C–95 °C rhombic notches).
The next thermal analysis took into consideration the influence of different values of the DC current which flows through the DC fuse, in both cases, circular and rhombic notches on the fuselink. The thermal simulations have been performed for the following DC currents: 24 A (0.75I
n), 40 A (1.25I
n) and 48 A (1.5I
n). The comparisons of the temperature distribution along the fuselink and outer ceramic housing are shown in the
Figure 11 and
Figure 12, respectively.
During the thermal analysis of the temperature variation along the fuselink, it can be observed that the difference between both the maximum and minimum temperatures of the fuselinks with circular and rhombic notches increases as the value of the test current increases. For instance, in
Figure 11, at the tested current value of 24 A, the difference between the maximum temperatures in the two analysed cases is 10.2 °C, and, for the current value of 48 A, the difference is 40.8 °C. The difference between minimum temperatures is 4.2 °C when the simulated current was 24 A and it increases at the value of 17.1 °C for a simulated current of 48 A. The same situation can be noticed during the thermal simulations of the temperature variation along the ceramic housing,
Figure 12. As an example, in the case of current value of 24 A, the difference between the maximum temperatures in the two analysed cases is 11.9 °C, and, for the tested current of 48 A, the difference is 47.7 °C. The difference between the minimum temperatures is 4.2 °C when the current was 24 A and it increases to 17.2 °C for a simulated current of 48 A.
Besides the steady-state thermal simulations, some transient simulations were performed. The measurement points for both transient thermal simulations (fuselink with circular and rhombic notches) were placed in the middle of the fuselink and also on the centre of the outer ceramic housing of the analysed DC fuse. The transient thermal simulations were achieved under the rated current of the DC fuse, 32 A, so for a thermal load of 7.3 W. The temperature variation till the steady-state conditions was recorded. After that, the transient thermal impedance
Zth(
t) was computed using the formula:
It can be noticed that
Zth(
t) is calculated as a ratio between the rising temperature variation of the middle point of the fuselink (maximum temperature) obtained from transient thermal simulations and the power loss
P, actually the thermal load of 7.3 W, a value taken from the datasheet of the DC fuse.
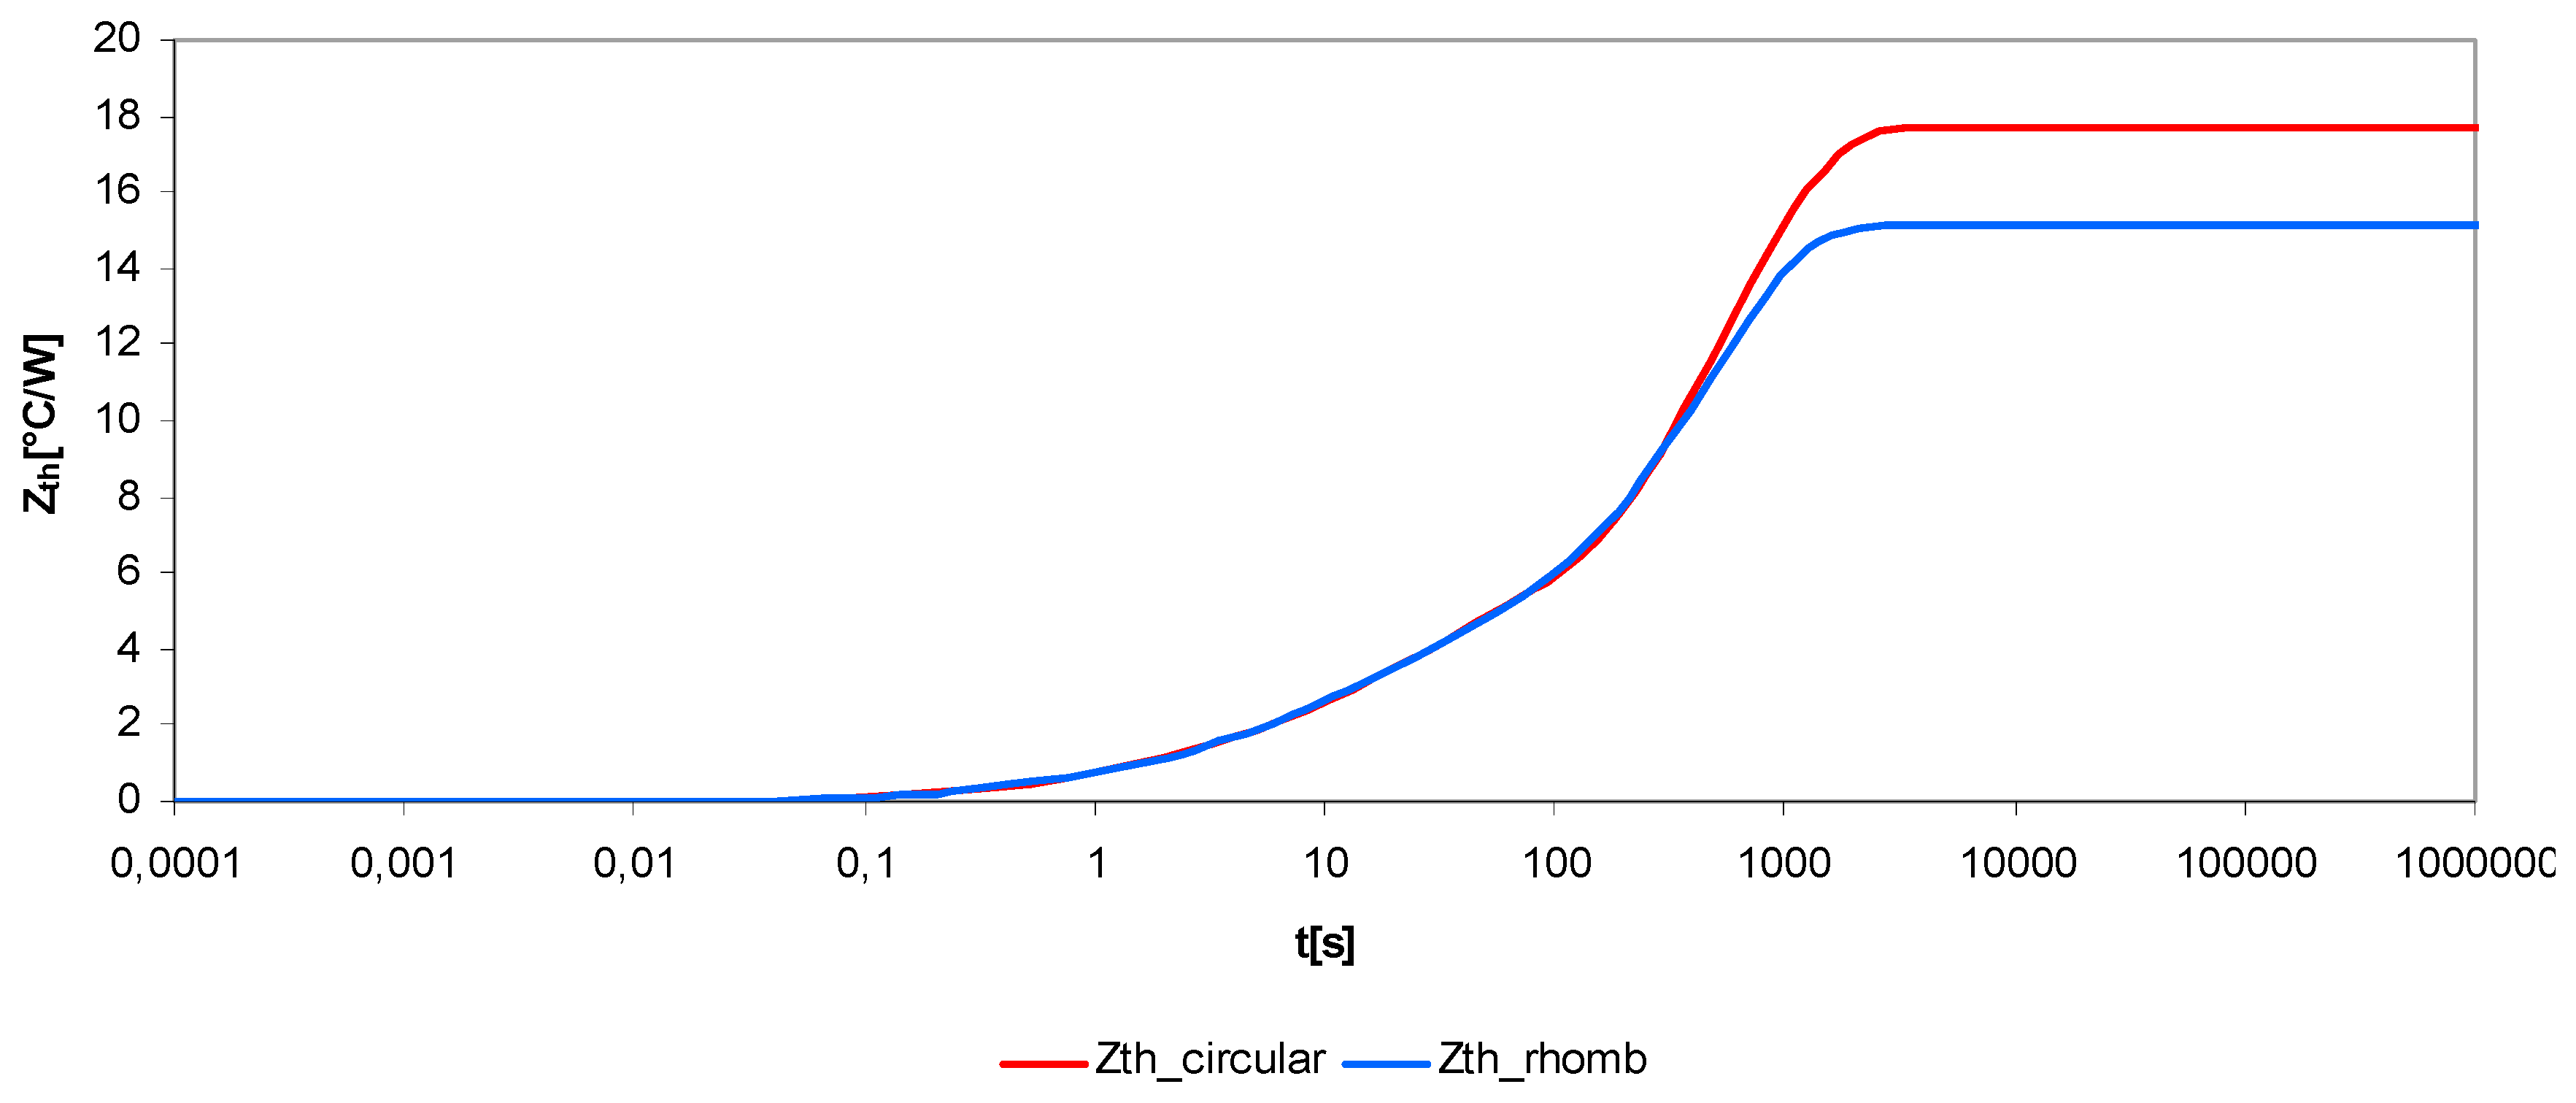
Unlike the simple variation of the temperature in time, the variation of the transient thermal impedance reflects much better the thermal evolution in time of different components of the analysed DC fuse. The next graph from
Figure 13, presents the transient thermal impedance variation of the fuselink in both cases: circular and rhombic notches. For both compared situations, a noticeable increase of the transient thermal impedance value can be observed after about 0.1 s. In steady-state conditions, the thermal impedance reaches the value of the thermal resistance as follows: 17.66 °C/W in the case of circular notches and 15.17 °C/W for rhombic notches.
From the above graphs, the same variation of the transient thermal impedance can be seen for both circular and rhombic notches up to about 700 s, and, after that, before reaching the steady-state conditions, the thermal impedance of fuselink with circular notches becomes higher than the one with rhombic notches. So, the influence of the notches’ shape on the temperature distribution along the fuselink is more relevant during steady-state conditions than the transient variation.
In the
Figure 14, the transient thermal impedance variation of the ceramic housing is shown. Compared to the previous case, a noticeable increase of the transient thermal impedance value can be observed after approximately 12 s, so, the ceramic tube starts to heat up after a certain amount of time. Hence, the ceramic housing is characterized by a certain thermal inertia due to its geometry and the physical properties of the material which it is constructed. After approximatively 3500 s, the steady-state conditions have been reached and the values of the thermal resistances are: 12.76 °C/W in the case of circular notches and 9.85 °C/W for rhombic notches.
As in previous graphs, there is a similar variation of the ceramic housing transient thermal impedance for both circular and rhombic notches up to about 30 s, and, after that, before reaching the steady-state conditions, the thermal impedance in the case of fuselink with circular notches becomes higher than the one with rhombic notches. Hence, even in the case of ceramic housing transient thermal impedance variation, the influence of the notches’ shape is more pronounced during steady-state conditions.
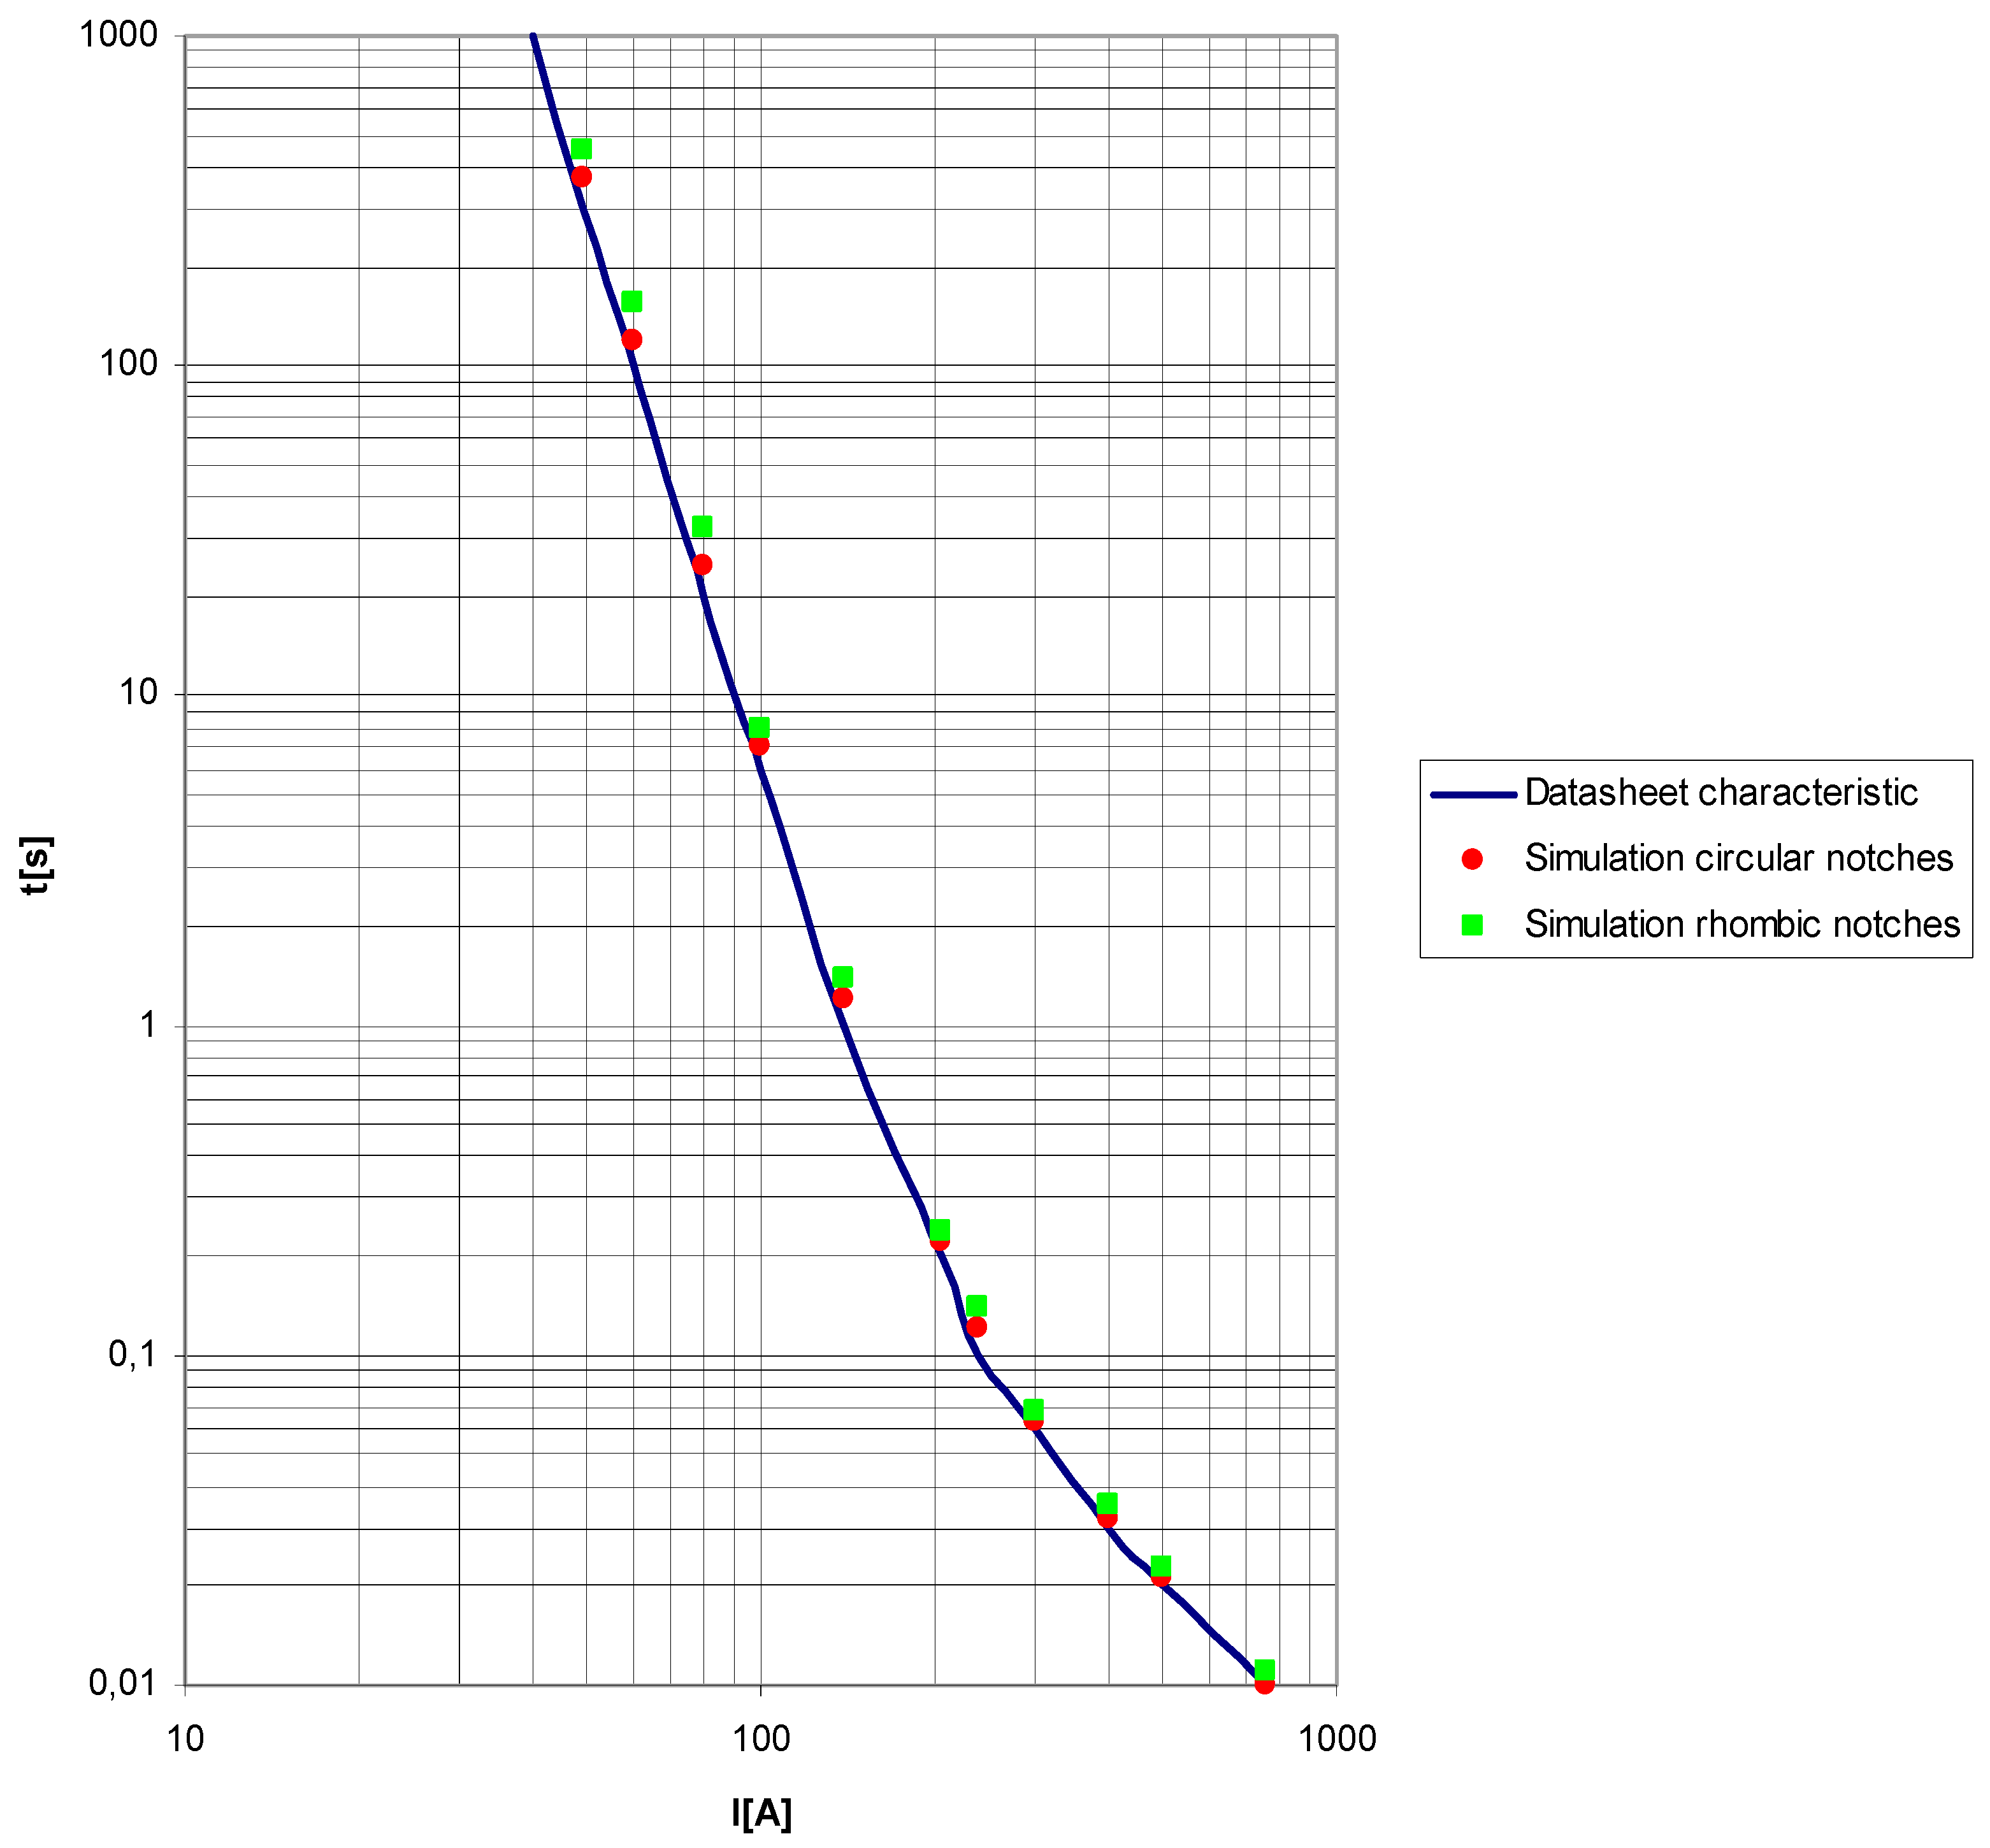
One of the advantages of using thermal simulations in transient conditions is the obtaining of the protection characteristic of the fuse, actually the prearcing time variation against overcurrents; see
Figure 15. This characteristic can be achieved by calculating the maximum temperature of the fuselink notches till melting temperature, i.e., 960 °C for the silver fuselink element. The overcurrent can be an overload with a typical hotspot in the centre of the fuselink or a short circuit with adiabatic heat up of all fuselink notches.
Figure 15 shows a comparison between datasheet and simulation values for both the fuselinks with circular and rhombic notches. It can be noticed that higher values of the prearcing time at the same overcurrent in the case of fuselink with rhombic notches in comparison with the fuselink with circular notches. For instance, when the overload is 80 A, the prearcing time of the fuse with circular notches is 25 s, which is lower than the fuse with rhombic notches which has a prearcing time of 32 s, as shown in
Figure 15.
This can be explained because of maximum temperature difference in the middle of the fuselink, between the fuse with circular notches (higher maximum temperature) and the fuse with rhombic notches (lower maximum temperature), so the fuse with rhombic notches needs more time to reach the melting temperature compared to the fuse with circular notches. In the range of higher overloads and short-circuit currents, a very good consistency with datasheet values has been obtained. Therefore, by changing the shape of the fuselink notches, there is the possibility to change also the shape of the protection characteristic of the fuse, at least in the range of overloads. From the graphics, it can be observed that the experimental data are lower than the simulated values. For instance, when the fuse is crossed by its rated current of 32 A, the maximum temperature value in the middle of the fuselink obtained from thermal simulations is 152.6 °C, higher than 149.5 °C, the experimental test value,
Figure 9.
In addition, the minimum temperature value at the end terminal of the fuselink from simulations (77.5 °C) is higher than the experimental one (73.1 °C). Moreover, in the case of the ceramic housing, the maximum simulated value on the centre is 116.1 °C, a higher value than 114.1 °C, the experimental one. Furthermore, the minimum temperature at the end terminal of the ceramic housing has a simulated value (76.4 °C) higher than the experimental one (72.1 °C). This can be explained by the fact that in reality the fuse is mounted on a fuse-carrier which is connected though the conductors to the rest of the test bench’s electrical installation. Hence, the fuse-carrier and the conductors act as a real heatsink for the fuse by means of the end caps and finally, the heat dissipates much better to the environment. The difference between simulation values and experimental data is due to thermal model simplifications, measurement errors, and experimental test conditions. Overall, this difference is less than 4.5 °C.
A three-dimensional thermal simulation for a high-voltage fuse was performed in [
24]. In that situation, the authors considered a vertical mounted fuse with length of 510 mm, rated voltage of 24 kV, rated current of 25 A, and an ambient temperature of 55 °C. The total thermal power was about 92.9 W. After specific thermal simulations, the maximum obtained temperature in the middle of the fuselink was about 145.1 °C. This value obtained in [
24] was between the maximum values obtained during previous thermal simulations of the DC fuse with circular notches (152.6 °C) and rhombic notches (134.1 °C). Of course, there is a difference between the maximum temperatures obtained from 3D thermal simulations due to different geometry of the fuse (DC compared to high-voltage fuses), different type and material of the fuselink (copper strip with notches vs. silver spiral wires), different rated voltage and current, and different ambient temperatures used during thermal simulations.
5. Conclusions
In this paper, a 3D thermal model of a DC fuse is described. The model can show the temperature variation of all components of the DC fuse in steady-state and transient conditions. The influence of two types of fuselink notches was investigated. In the case of rhombic notches, a lower temperature distribution has been obtained compared to the case of the fuselink with circular notches. Hence, a maximum fuselink temperature of 152.6 °C has been obtained for the fuse with circular notches, compared to 134.1 °C in the case of fuse with rhombic notches at the same rated current of 32 A. Furthermore, it was observed that there was an approximately constant temperature for the circular and rhombic notches at the end terminals of the ceramic housing because of the influence of the end caps that are mounted at the terminals of the ceramic tube. In the case of different test current values, the difference between both the maximum and minimum temperatures of the fuselink with circular and rhombic notches increases as the value of the test current increases. The same situation can be noticed during the thermal simulations of the temperature variation along the ceramic housing. A noticeable increase of the fuselink transient thermal impedance value can be observed after about 0.1 s. In the case of ceramic housing, there is an important increasing of its transient thermal impedance after approximately 12 s, so, the ceramic tube starts to heat up after a certain amount of time due to its thermal inertia. In addition, it has been observed that the influence of the notches’ shape on the temperature distribution along the fuselink and ceramic housing is more relevant during steady-state conditions than the transient variation. Moreover, from transient thermal simulations, higher values of the prearcing time were obtained at the same overcurrent in the case of fuselink with rhombic notches in comparison with the fuselink with circular notches.
Therefore, using the 3D thermal modelling and simulation, there is possibility to improve the DC fuse designing and to get new time–current characteristics depending on the protected load.
The proposed 3D thermal model has been validated by experimental tests. A good correlation between experimental data and simulation temperature values has been achieved (a relative error less than ±6% was obtained between experimental and simulation results). The thermal model can be used as a useful tool to design different types of DC fuses with a suitable temperature distribution depending on different geometrical and physical parameters.


