Abstract
This article summarises the development and experience of the Formula Student race car engine from 2018. According to the technical rules of Formula Student after the change in 2017, this engine adopts a new design concept, employs a 690-mL single-cylinder engine as the base, and applies ‘response enhancement technology’ with supercharging as the core to achieve a high-power output, a wide high-torque range and an excellent response capability. During the development, various studies on the dynamic performance of the vehicle and the engine were conducted, including vehicle dynamics analysis and track simulation, parameter matching of the supercharger and the engine, control strategy design, and the intake and exhaust system design. This research builds a supercharger air flow and efficiency test bench and an engine performance test bench. Test results show that the developed engine can output 122% of the original power and 120% of the original torque with a 20-mm diameter intake restrictor. Compared with previous generation race cars with a turbocharged four-cylinder engine, the new race car‘s 0–100 km/h acceleration time is shortened by 0.2 s, the torque response time under typical condition is shortened by 80%, and the lap time of the integrated circuit is reduced by 7%.
1. Introduction
Formula Student is an educational event for college students. The event was first launched by the International Society of Automotive Engineers in 1978. Formula Student requires each team to design and manufacture a racecar within one year, in accordance with the rules and manufacturing standards of single-seater, open-cockpit, open-tire formula racing [1]. Since 2010, Gspeed Racing Team, the Formula Student team of Jilin University, has participated in Formula Student China and Germany many times in succession. The team has won the first place in the design project five times and the championship of Formula Student China in 2018. The Gspeed-2017 and Gspeed-2018 racecars are shown in Figure 1 and Figure 2, respectively.

Figure 1.
Gspeed-2017 Racecar.
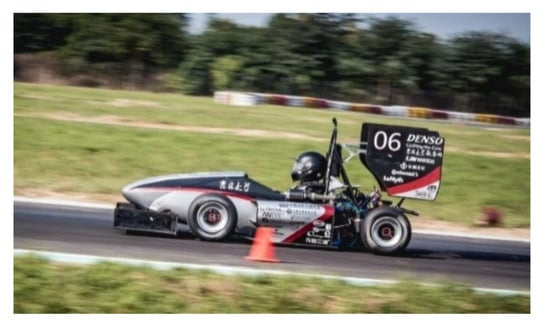
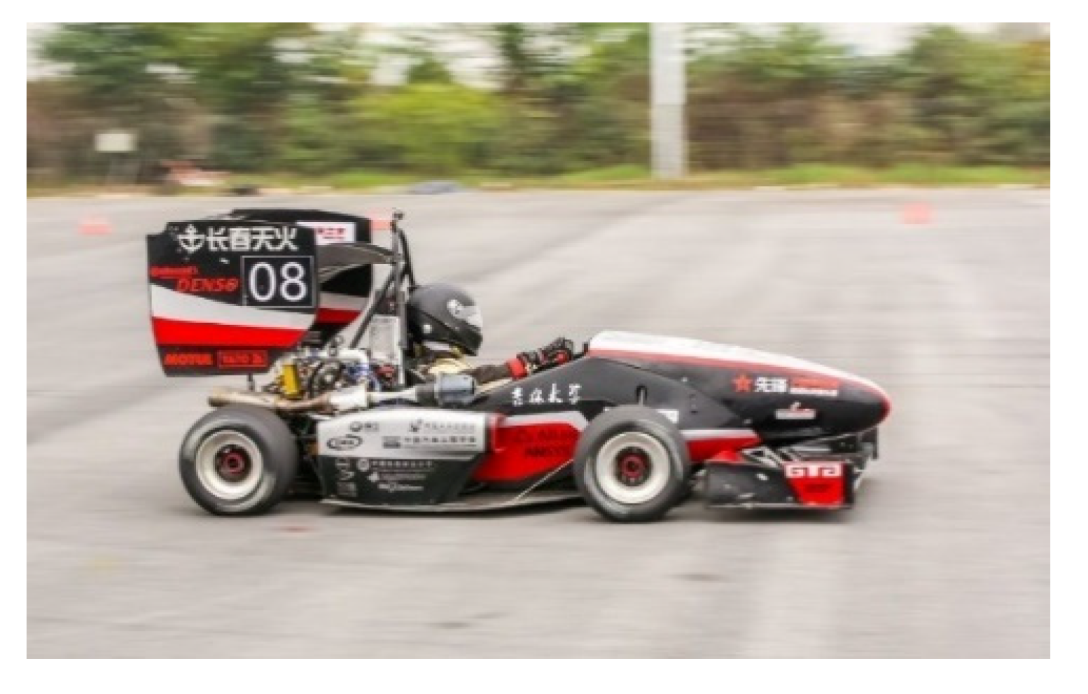
Figure 2.
Gspeed-2018 Racecar.
According to the technical rules of Formula Student [2], a four-stroke piston spark-ignition engine is required when the internal combustion engine is used as the powertrain. Natural aspiration or forced induction is allowed. However, all intake air must flow through an intake restrictor with an inner diameter of 20 mm. When using natural aspiration, the restrictor must be installed after the throttle; when using forced induction, the restrictor must be installed before the compressor for the maximum intake air to flow as long as the maximum power can be limited, balancing the performance of different cars and improving the safety and enjoyment of the event. For a long time, the technical rules of Formula Student have required the engine displacement to be less than 610 mL. Therefore, a 600-mL four-cylinder engine is the mainstream powertrain for Formula Student racecars. Thus, increasing the engine speed is the most important method for improving the power output [3]. The Gspeed Formula Student racing team used a 600-mL four-cylinder engine with turbocharging and dry-sump lubrication until 2017 [4]. The typical performance parameters are shown in Table 1.

Table 1.
Typical performance parameters.
During 2017–2018, the technical rules of Formula Student all over the world changed significantly. The engine displacement limit was successively increased to 710 mL in each substation race, and the selectable types of engine were also greatly enriched. Thus, the Gspeed Racing Team decided to develop a new generation racecar engine for Formula Student. The plan was to adopt the technical route of a large displacement supercharged single-cylinder engine that can achieve the performance of a four-cylinder engine, the volume and weight of which are similar to those of single-cylinder engines to provide favourable conditions for compact and lightweight vehicles.
Since Formula Student was held, in the restriction of engine displacement and intake restrictor, many teams have tried to find some way to maintain relatively high engine output while meeting the current regulations.
Currently, the four-cylinder naturally aspirated engine is the common form of power in the competition. Lawrence Technological University Formula SAE (FSAE) team adopted the Honda CBR600 F3 engine. They redesigned the shape of the throttle plate, improved the restrictor and optimised the intake manifold to make the intake flow of each cylinder as even as possible and ultimately to increase the engine torque by 30% to 50 Nm@8500 rpm. The maximum power is 48 kW@11,000 rpm [5]. Otherwise, in terms of naturally aspirated engines, adopting the variable intake manifold can effectively improve the engine power performance. What is worth mentioning is that the Cooper Union Formula SAE (FSAE) team adopted the Suzuki GSXR-600 engine and adjusted the runner through the control mechanism in different engine conditions, which could change the length of the air intake’s flow pass from 216 mm to 325 mm and eventually improve the peak power by more than 22% and increase the output torque by 5% [6]. Besides, optimising the intake manifold, changing the camshaft to change the timing distribution system and other ways can improve the engine power performance [7,8,9].
In the condition of using the intake restrictor, adopting a four-cylinder charged engine is also the choice of many teams. The team from the University of Malta has long been committed to developing an FSAE turbocharged engine. What they use is a Kawasaki 600 engine, the original compression ratio of which is 11.8. They used a method called Pulse System Turbocharging, installed an intercooler and thickened cylinder liners to reduce the compression ratio to lower the risk of knocking. The boost pressure is set as 1.5. The engine’s maximum torque is 71 Nm@8000 rpm and the maximum power is 64 kW@11,000 rpm [10].
Single-cylinder engines have the advantages of being light weight, small size and so on. However, with the influence of the intake restrictor, the power performance of single-cylinder engines will be greatly reduced. Therefore, as for the teams who want to adopt single-cylinder engines, how to improve the power performance is the problem needing to be solved. In terms of naturally aspirated engines, adopting variable intake manifold or electronic throttle and redesigning an exhaust system with low back pressure can improve the engine’s power performance and response [8,11]. According to Queen’s University Belfast’s ‘Evaluation of the Suitability of a Single-Cylinder Engine for Use in FSAE’ [12], the research report suggests that the YZ450F single-cylinder engine’s output power is 37 kW in the condition of being naturally aspirated but if installed with a variable inlet length system and tapered exhaust system, the engine can realise the output power of 39 kW in the limitation. After being charged, the engine can reach the maximum power of 52 kW but the risk of knocking is very high. Thus, compared with four-cylinder engines used by most teams in the competition, the vehicle with a charged single-cylinder engine seems to be a better concept.
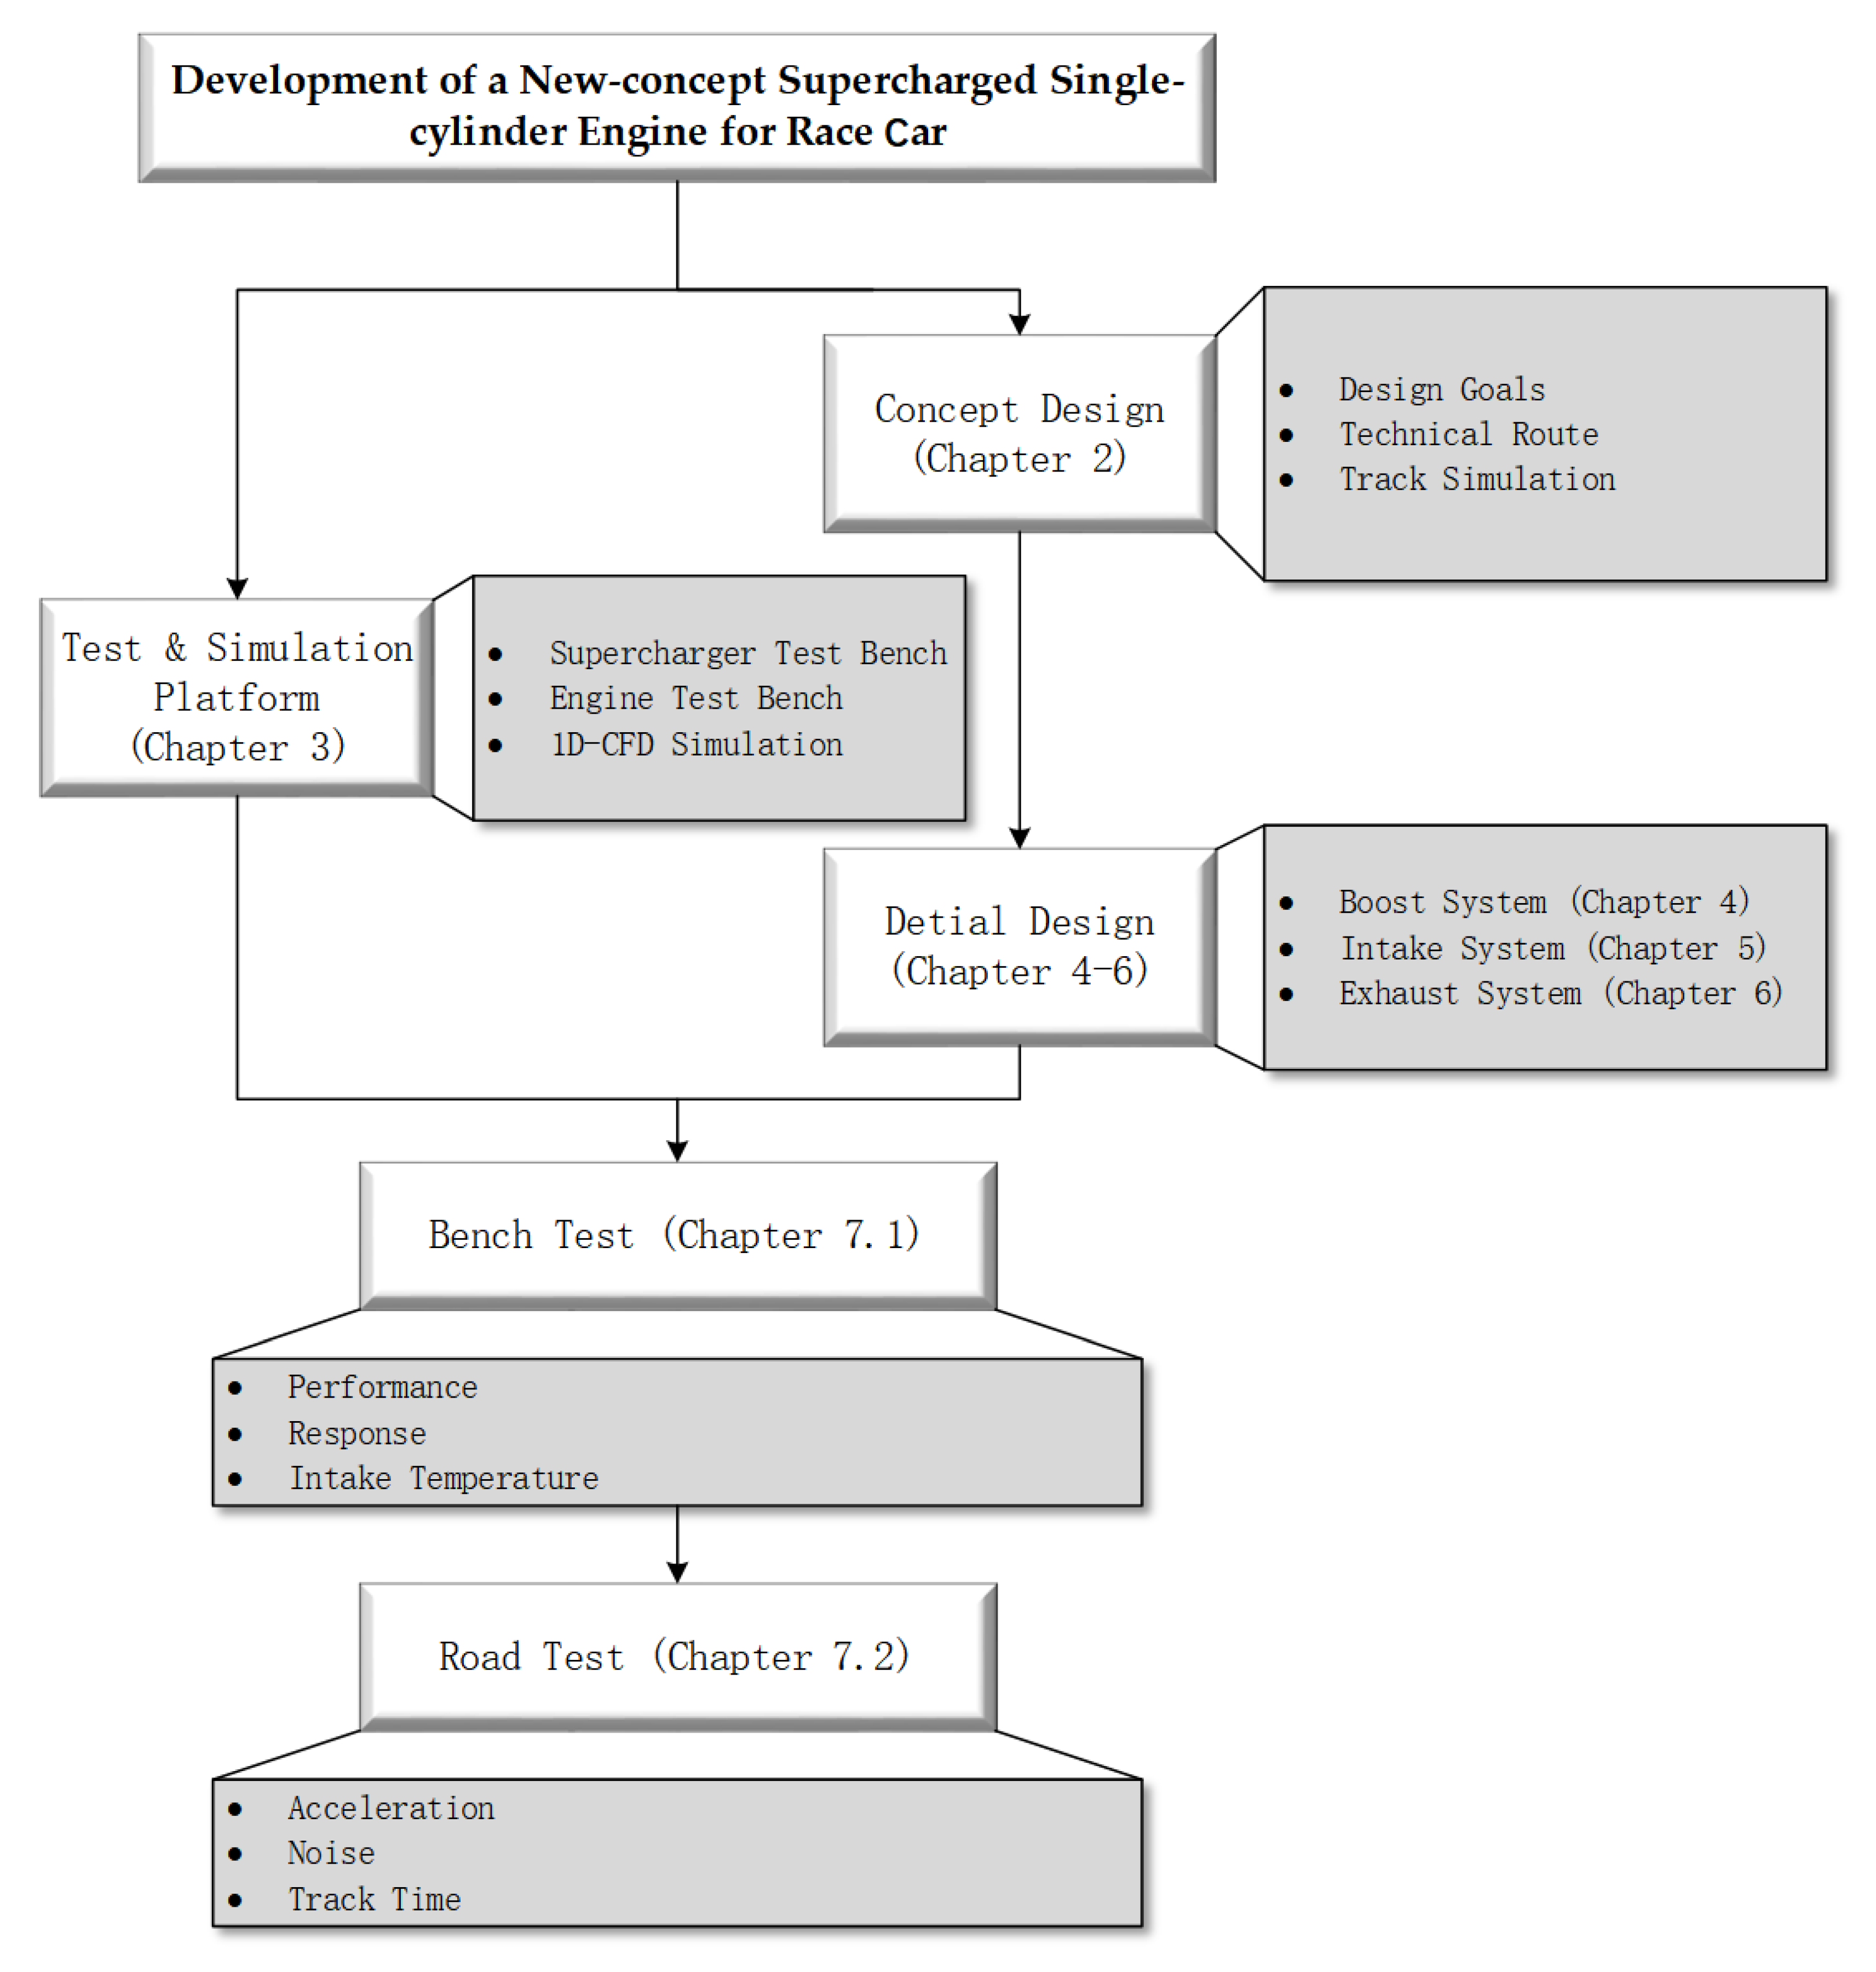
This paper is divided into eight sections. Section 1 is a brief introduction of the background of this research. Section 2 sets the goal of the powertrain system developed in this study and puts forward the technical route of the single-cylinder engine under the response enhancement technology system with supercharging as the core. Section 3 introduces the simulation model and test bench used in this paper. In Section 4, the engine 1-D CFD simulation was carried out in order to select and match the supercharger, and the intake bypass valve was designed separately. In Section 5, StarCCM+ [13] was used to simulate the intake system, and the influence of intake restrictor and the upstream and downstream volume of throttle on the response performance was mainly studied. In Section 6, the “expansion chamber + main muffler” series exhaust system is proposed. In Section 7, the engine performance test, road test and other tests are carried out to verify the design results. Section 8 is the summary of this development and research. The overall structure of this article is shown as Figure 3.
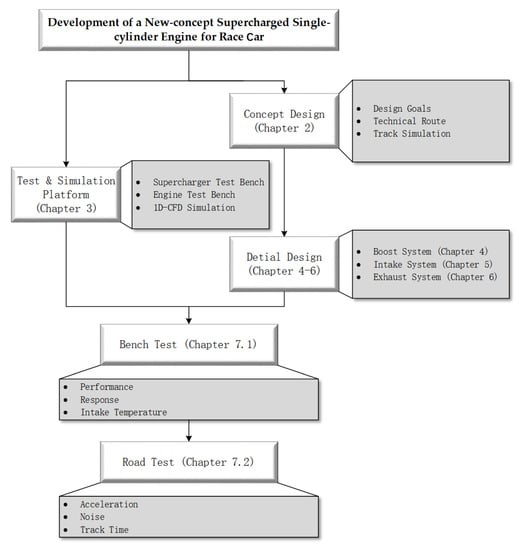
Figure 3.
Overall Structure of the Article.
2. Concept Design
2.1. Design Goals
According to the vehicle’s performance requirements and technical rules, the engine should achieve the following goals:
- maximum power of no less than 60 kW
- maximum torque of no less than 80 Nm
- high torque range (>90% maximum torque) of no less than 50% of the whole RPM range
- torque response time of the typical conditions not exceeding 0.2 s (40% max. engine speed, throttle tip-in to wide-opened, till to output 90% maximum torque).
- brake specific fuel consumption (BSFC) of the full load not exceeding 300 g/kWh.
- total dry weight of the engine not exceeding 55 kg (including cooling, lubrication, intake, exhaust and electronic control system and excluding the transmission or fuel-line).
- idle exhaust noise lower than 103 dBC (rule limit).
- exhaust noise of less than 110 dBC (rule limit) at the average piston speed of 914.4 m/min
- good reliability and durability.
2.2. Response Enhancement Technology
To achieve the design goals mentioned above, a technical route called ‘response enhancement technology’ is designed as shown in Figure 4. The technical route takes a single-cylinder engine as the base and has the following technical characteristics: a supercharging system, a small-volume intake system, a dual-stage fuel injection and an electronic throttle system.
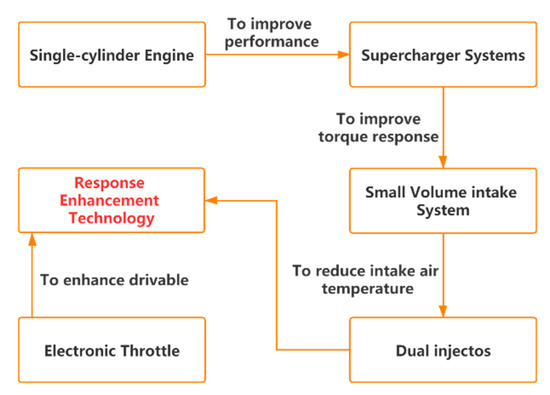
Figure 4.
Technical Route of ‘response enhancement technology’.
2.2.1. Engine Selection
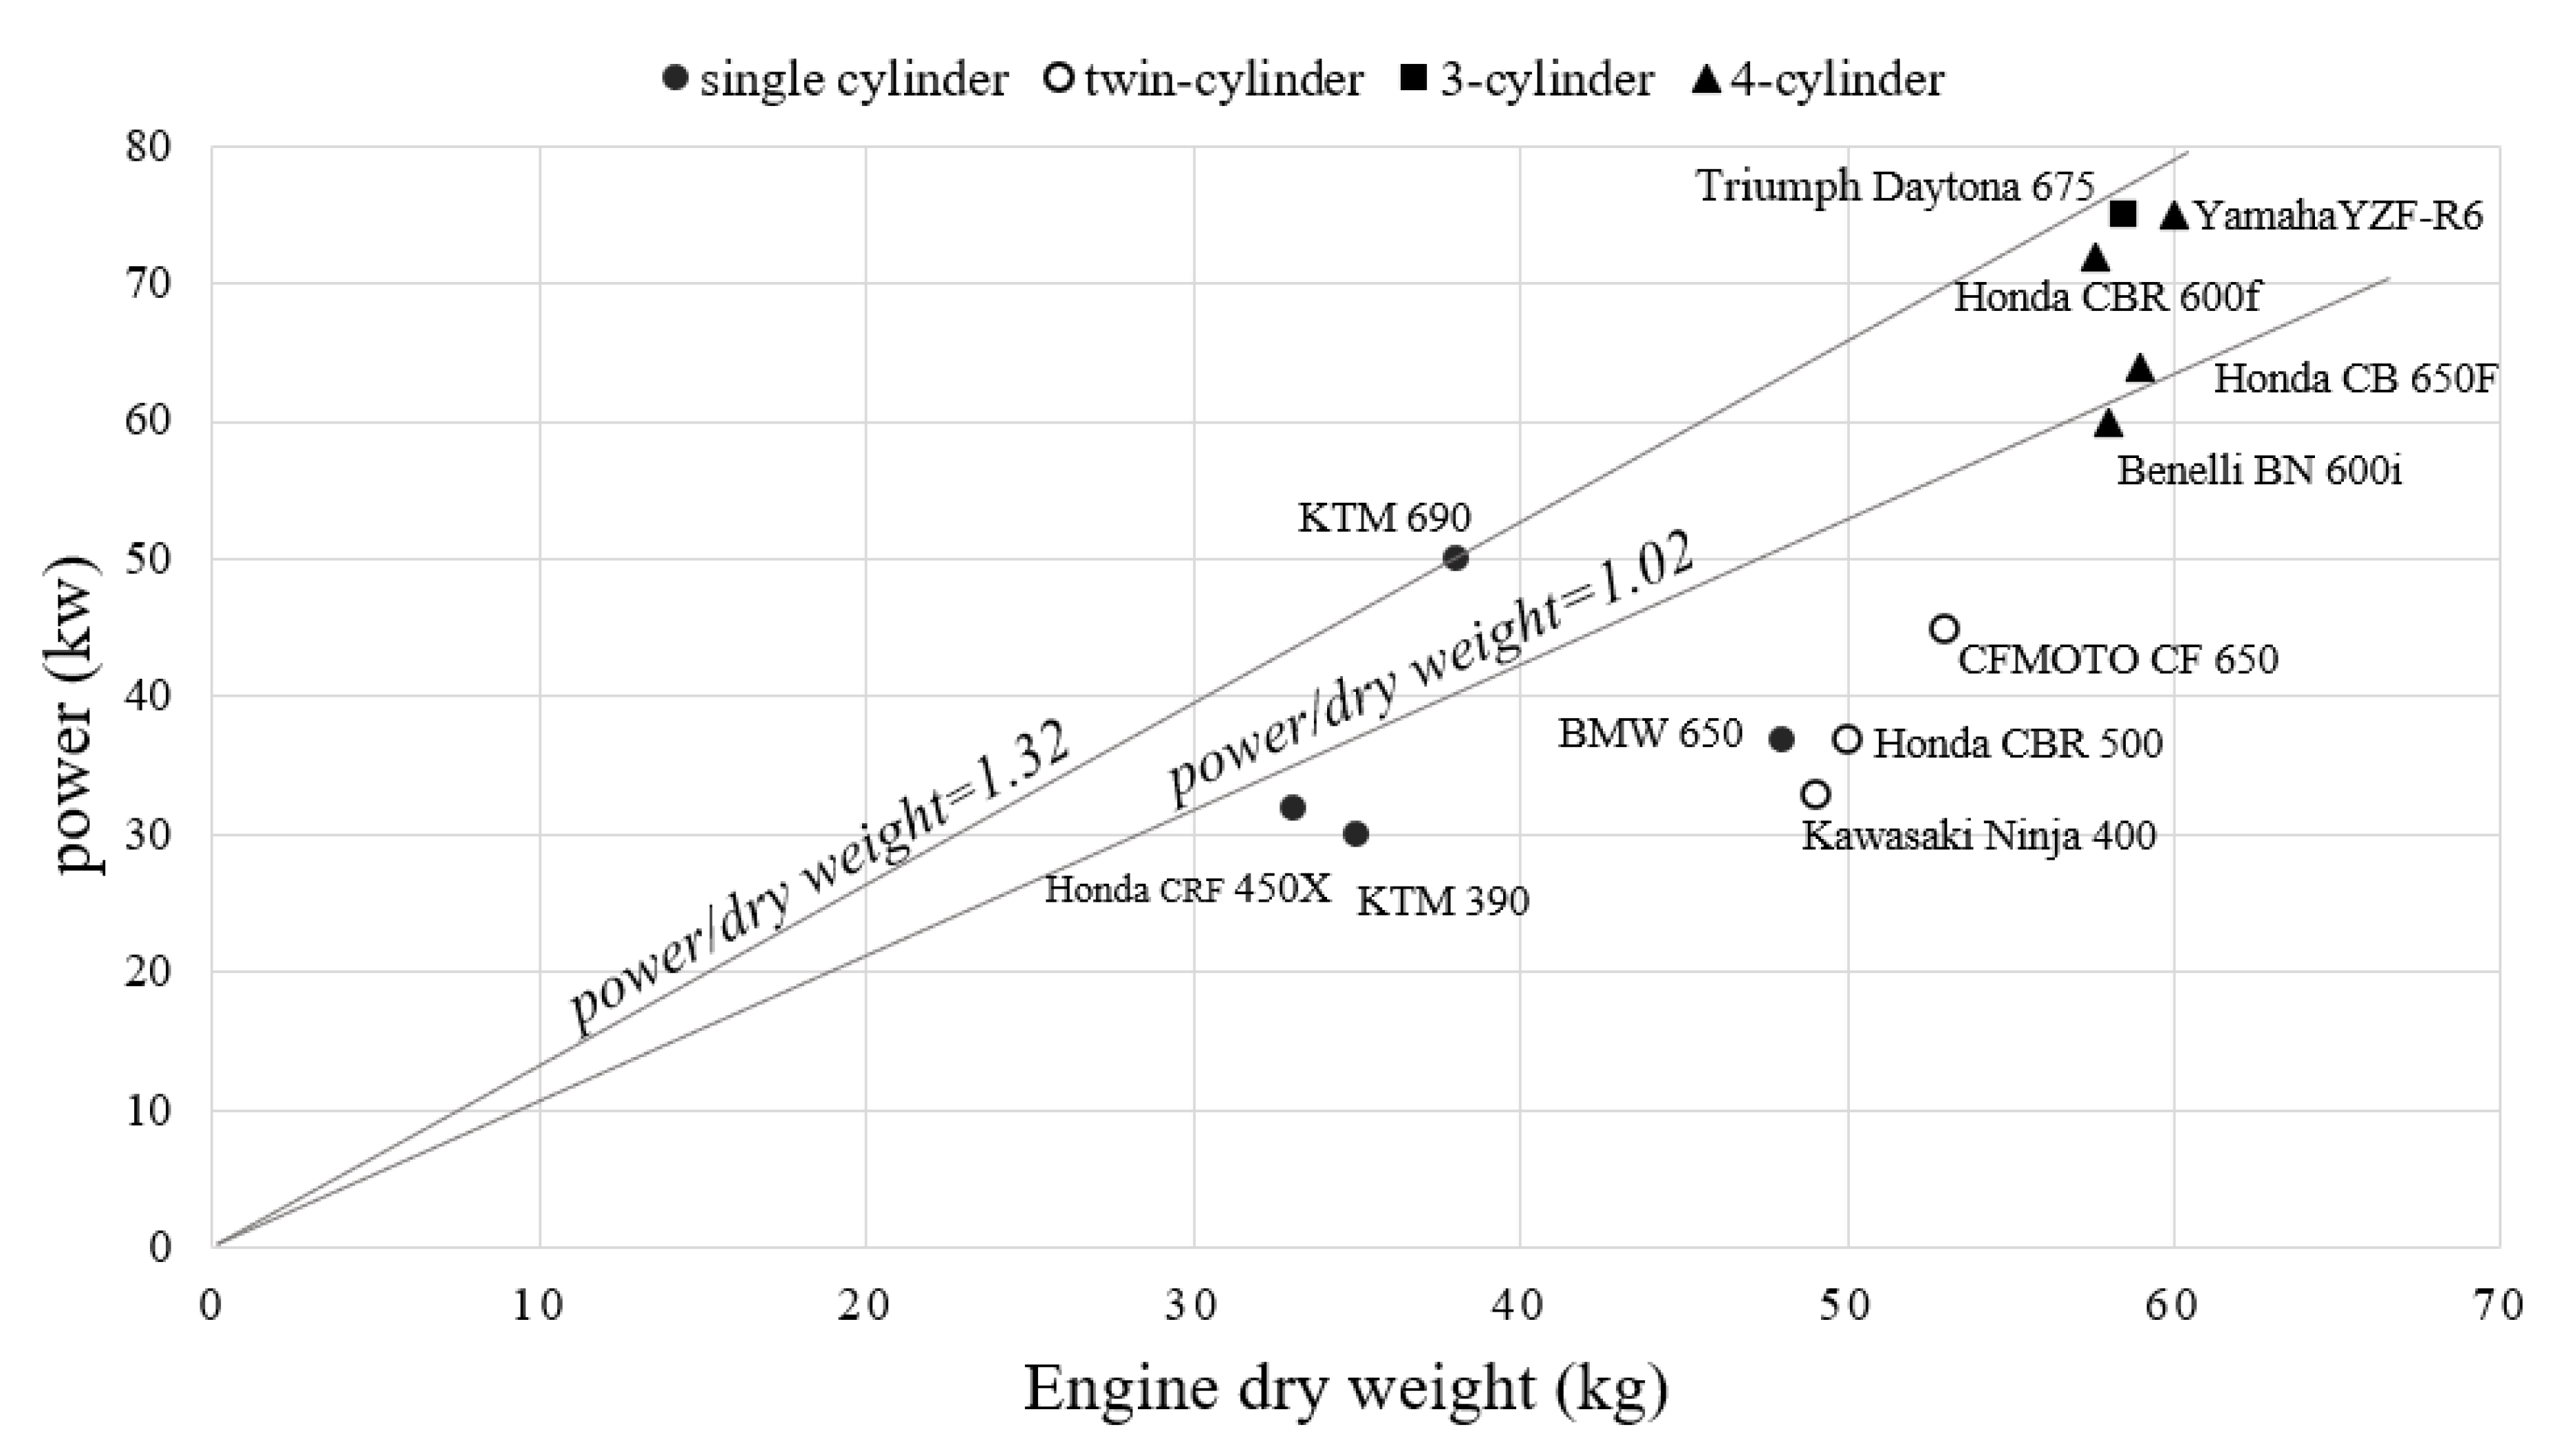
Twelve engines with a displacement of 350–710 mL that follow the Formula Student rules have been selected, including 4 four-cylinder engines, 1 three-cylinder engine, 3 twin-cylinder engines and 4 single-cylinder engines. According to the dimensions of the stock power and the engine dry weight, a scatter diagram is shown in Figure 5.
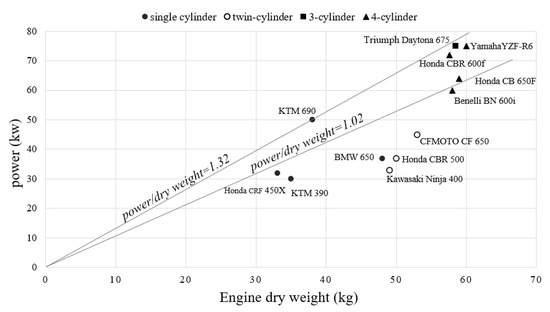
Figure 5.
Power/Weight Comparison of Selectable Engines.
For the powertrain of a race car, higher power and lower weight are important design goals, and it is often difficult to balance both. Therefore, we set the evaluation index of “power/dry weight”. The larger the index, the more power the engine can output per unit weight.
The analysis of the statistical results indicates the following:
- The dry weights of the twin-, three- and four-cylinder engines have no significant differences, and the average is 58 kg. The goal, i.e., ‘the total dry weight of engine is not higher than 55 kg’, is difficult to achieve.
- The average dry weight of the single-cylinder engines is 39 kg, indicating obvious advantages in weight reduction.
- The stock powers of the three- and four-cylinder engines are relatively close, with a median of 68 kW, which can achieve the target power under natural aspiration.
- The stock powers of the single- and twin-cylinder engines are relatively close, with a median of 40 kW, and the target power can only be achieved by using forced induction and other modifications.
In summary, this study selected the KTM 690 Duke, which has the largest ‘power-to-weight ratio’ among the above engines, as the basic engine and used supercharging and other methods to achieve the target performance. The technical parameters of the engine are shown in Table 2.
Table 2.
Technical Parameters of KTM 690 Duke Engine.
2.2.2. Supercharging System
The stroke of the single-cylinder engine is usually long, so the engine peak speed is relatively low. The maximum power is difficult to increase under natural aspiration. Therefore, forced induction should be adopted to achieve the target power and torque. There are two common forced air intake methods in automotive engineering: turbocharging and supercharging. Supercharging refers to the method that directly uses the crankshaft to drive the compressor, while turbocharging refers to the method that uses exhaust gas to drive the compressor.
Turbocharging is the most common forced induction method, but the exhaust pressure pulse of the single-cylinder engine may cause the variable pressure ratio problem [14,15]. Furthermore, achieving the design goals, i.e., ‘torque response time of typical operating conditions is not higher than 0.2 s’ and ‘high torque range is not lower than 50% of the full engine speed range’, is difficult for a turbocharged engine [16].
Therefore, this study used a supercharging system. Although a supercharged engine provides great power, it can provide a stable pressure ratio in the full range of engine conditions, and the boost pressure is established rapidly, which is conducive to achieving the ideal instantaneous torque response.
2.2.3. Small-Volume Intake System
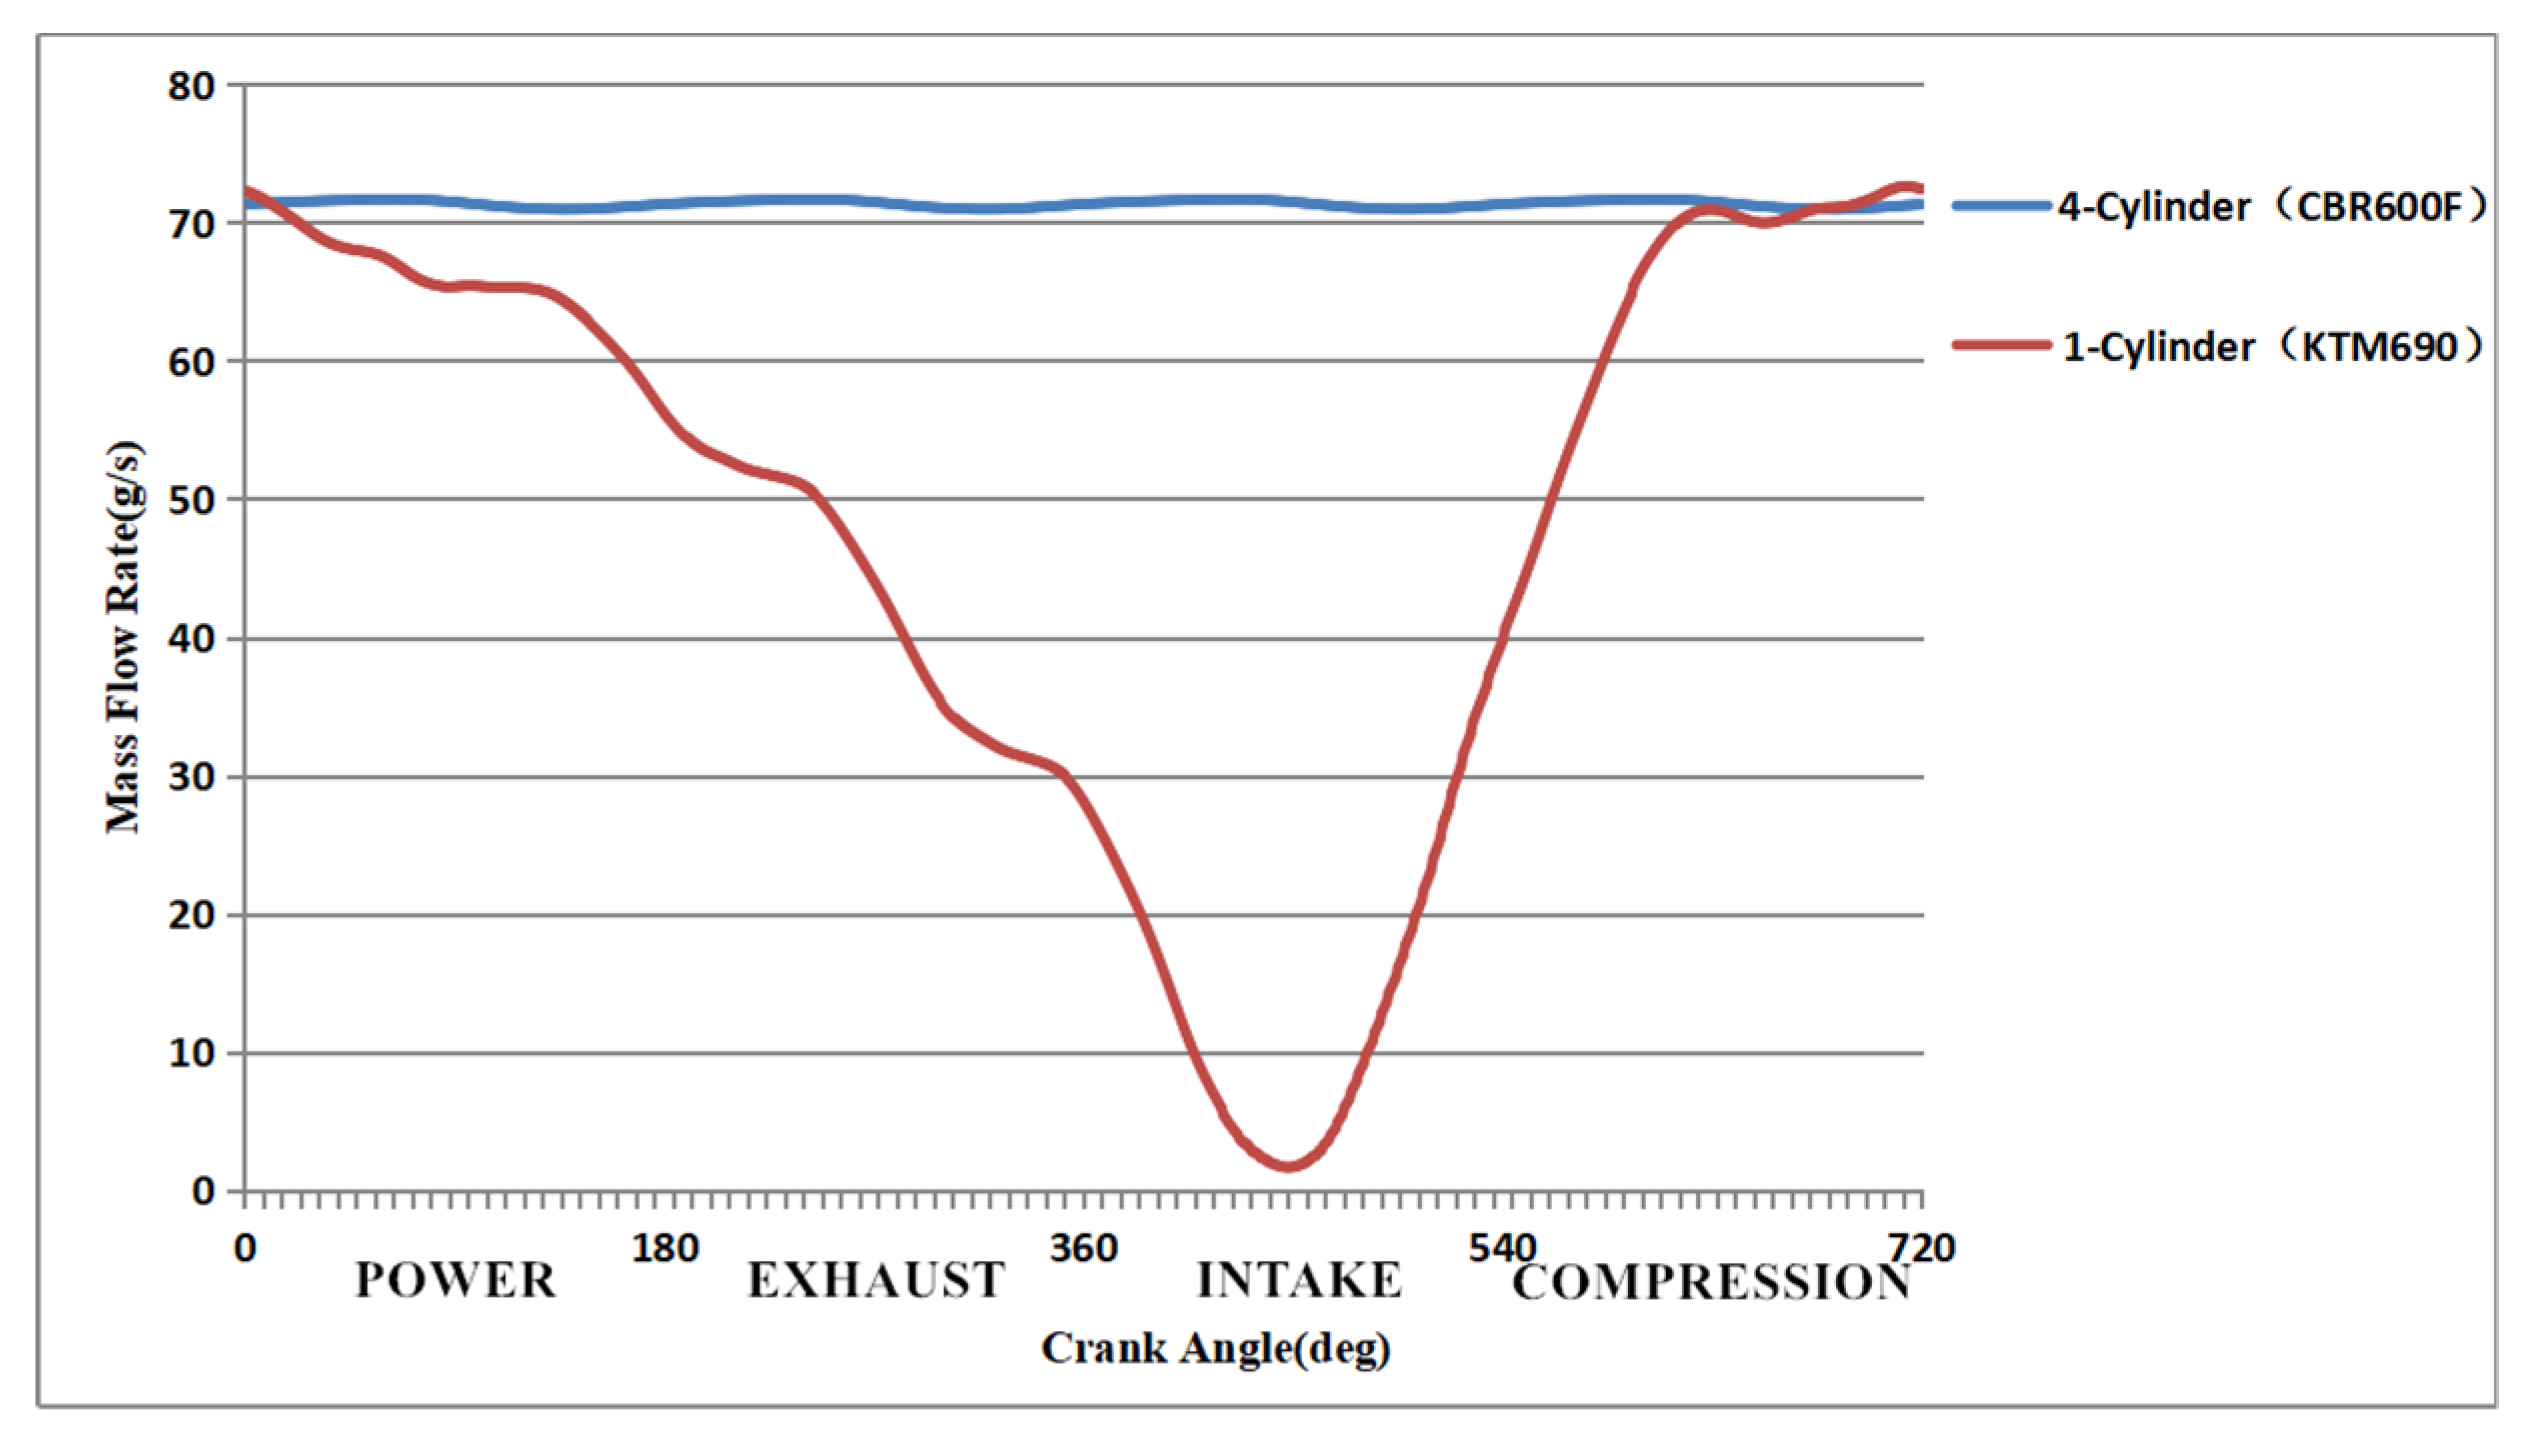
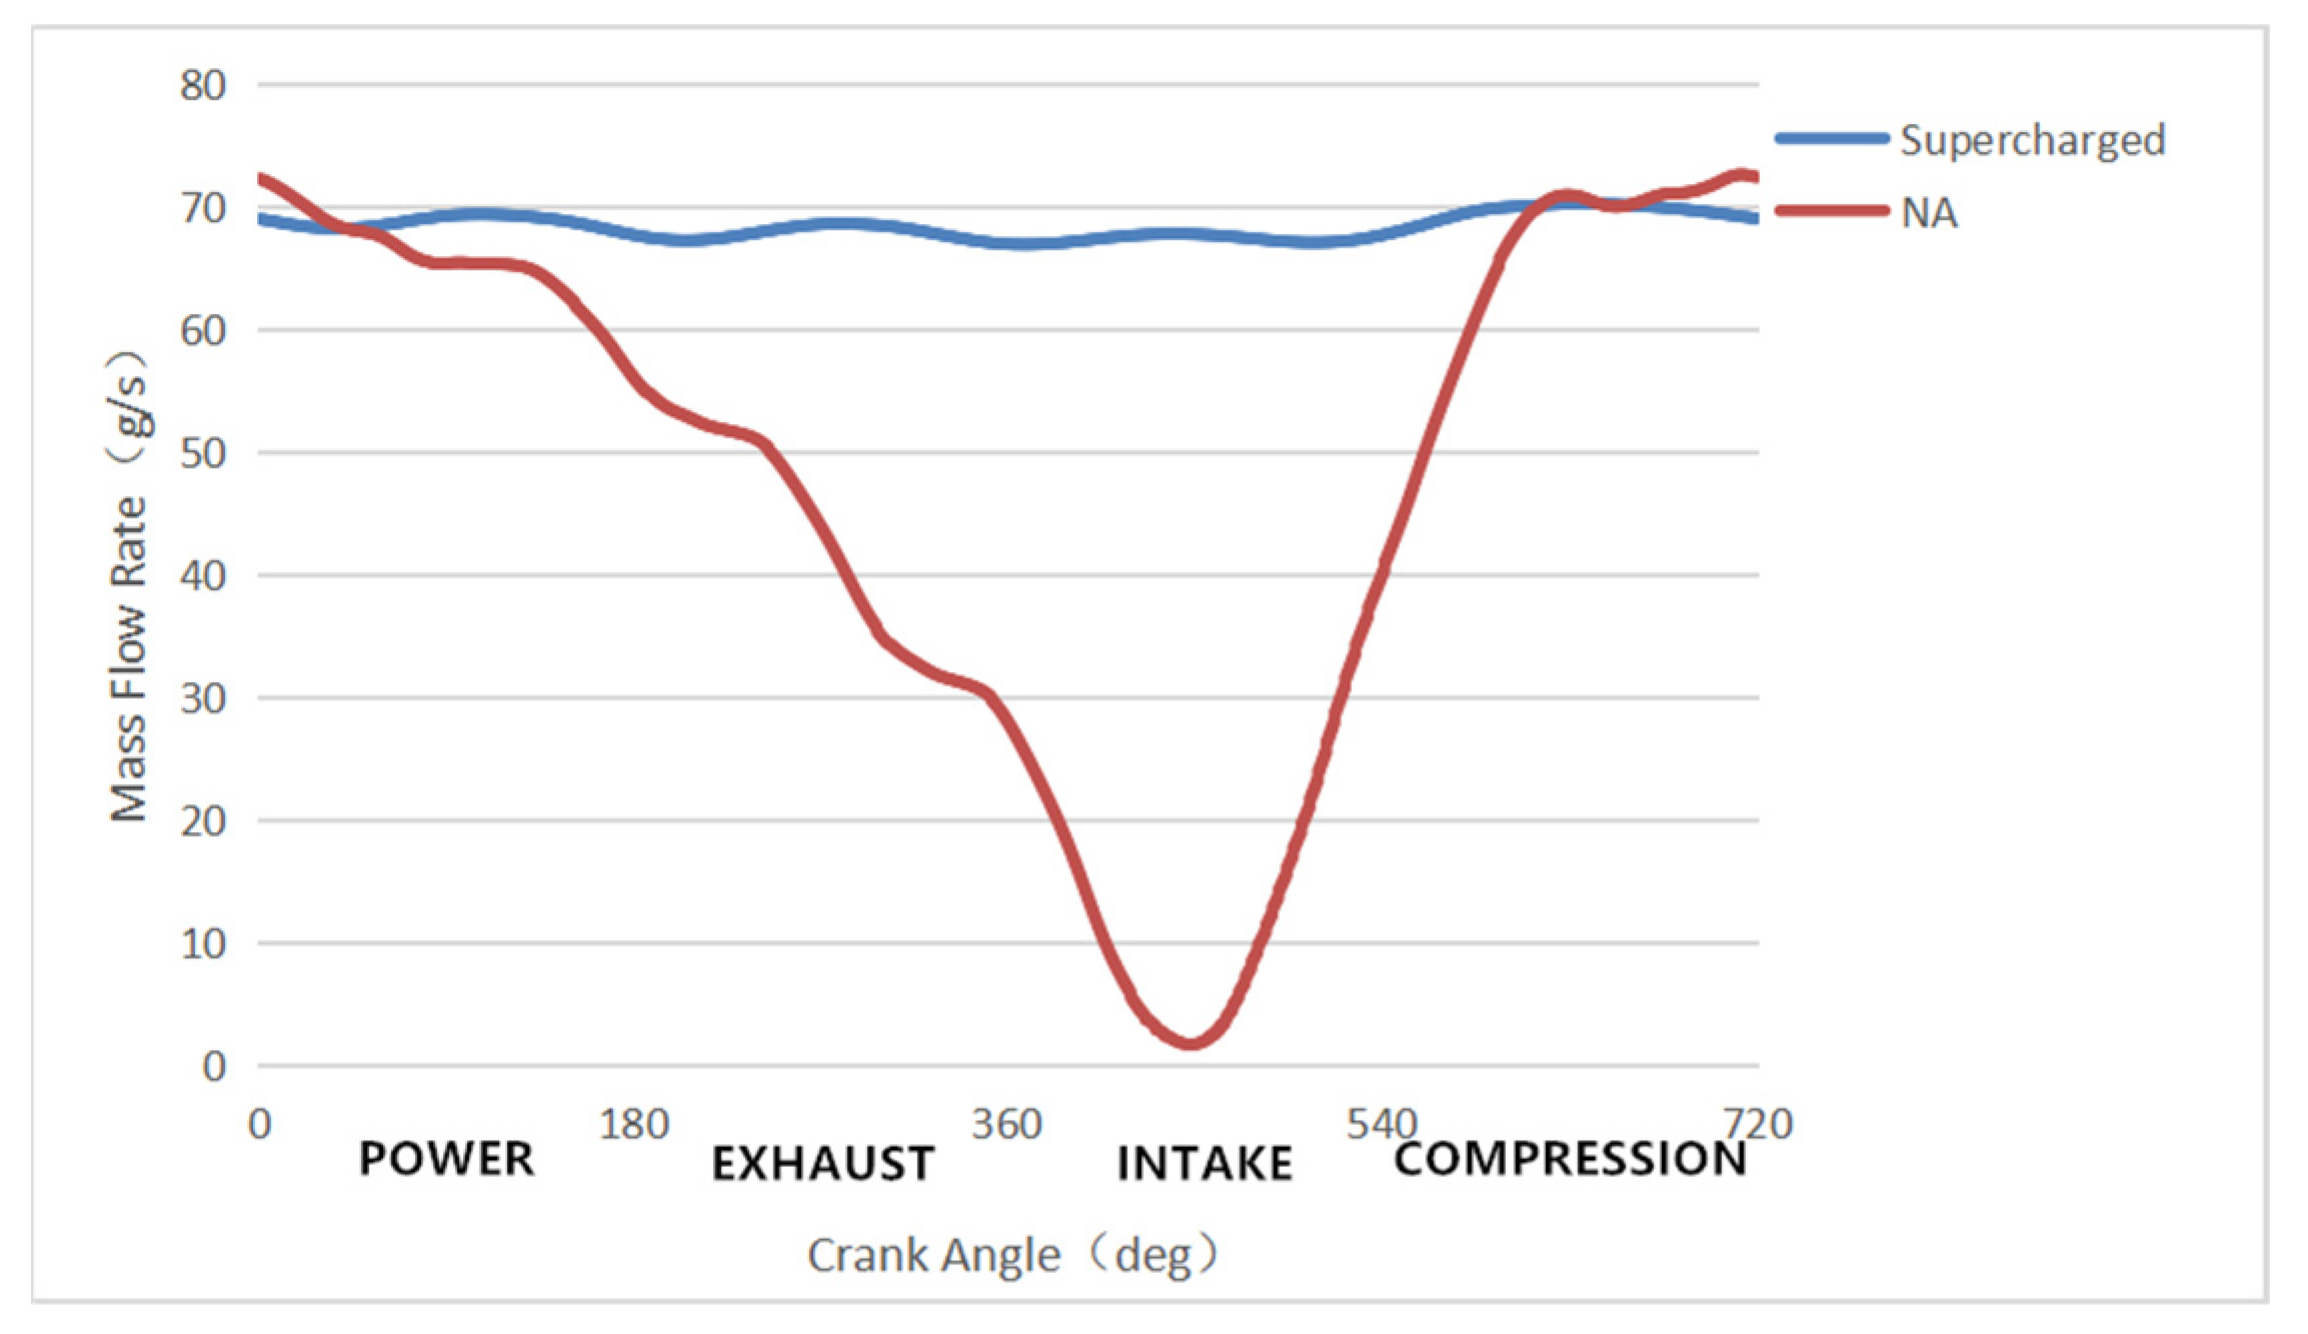
When a natural aspirated engine has an intake restrictor, the mass-flow unevenness of the single-cylinder engine at the restrictor will be much higher than that of a multi-cylinder engine due to the pressure fluctuations in one working cycle, and the air flow rate can only reach the limited extreme value for a small part of the time, as shown in Figure 6. Macroscopically, the flow of the naturally aspirated single-cylinder engine at the restrictor is always underutilised.

Figure 6.
Flow Rate of 1-Cyl. and 4-Cyl. Engine at Restrictor during One Cycle.
Therefore, the natural aspirated single-cylinder engine of Formula Student must usually be equipped with a large-sized plenum, the volume of which can be 6 to 10 times the engine displacement [17]. However, the large-sized plenum would be detrimental to the torque response capability.
As shown in Figure 7, when a supercharged intake system is used, the air flow rate at the restrictor will be far more uniform—just like that of a four-cylinder engine—due to the high rotation speed of the supercharger and the manifold pressure fluctuation during working cycle being isolated by the compressor. Furthermore, a large-size plenum, which is conducive to improving the torque response capability, need not be installed.

Figure 7.
Flow Rate of Naturally Aspirated and Supercharged 1-Cyl. Engine at Restrictor during One Cycle.
2.2.4. Dual-Stage Fuel Injection
After supercharged modification, the stock fuel injector may not have the capacity to provide the larger fuel flow rate. Once a large injector is installed, the injection pulse width at idle or light load will be quite low (even less than 1.5 ms); thus, the injection control accuracy will deteriorate [18,19]. Therefore, this study used dual-stage fuel injection to compromise the fuel flow rate at high load and the control accuracy at low load.
According to the technical rules, if an intercooler is installed, it must be arranged downstream of the throttle. Therefore, this study arranged the primary injector downstream of the throttle and the secondary injector upstream of the throttle to reduce the intake air temperature by fuel vaporisation. Moreover, no intercooler was provided, and the throttle was directly installed near the cylinder head. Consequently, the volume of the intake system behind the throttle can only be approximately 200 mL, further improving the torque response capability.
2.2.5. Electronic Throttle
The large-displacement single-cylinder engine has a great demand for intake flow during the intake stroke, requiring a throttle with a large diameter. For a mechanical throttle, the driver will directly control the position of the butterfly valve. When the throttle is at medium and small opening, the drivability is not conducive to the driver’s precise torque control on track [20]. Therefore, this study used an electronic throttle control system to make a nonlinear mapping relation between the accelerator pedal and the throttle position, thereby improving the drivability. After applying the electronic throttle, realising other driving assistance functions, such as launch control, traction control, and gear shifting torque compensation, is also helpful.
2.3. Vehicle Track Simulation
To verify the superiority of the above technical route over other engine configurations, a parametric dynamic model of an entire vehicle was established in the VI-grade Car Real-Time [21] software environment. Acceleration, ski-pad, autocross and endurance (single lap) events were also simulated.
Gspeed-2018 is a typical Formula Student racecar with a double wishbone independent suspension, a clutch-type limited-slip differential and a complete aerodynamic downforce system. The main parameters of this racecar are shown in Table 3. In the simulation process, four common engine configurations in Formula Student were selected and compared. Their parameters are shown in Table 4.
Table 3.
Specifications of Gspeed-2018 Racecar.
Table 4.
Different Powertrains Configuration of Formula Student
The simulation results and the normalised scores are shown in Table 5. The results show that the configuration proposed in this study is the best in the acceleration, autocross and endurance events (Figure 8 shows the single-lap speed curve of the four configurations in endurance) and ranks the second in the ski-pad, which does not depend on power performance. The normalised scoring according to the Formula Student rules indicates that the 1-cylinder supercharged engine has the highest overall score.
Table 5.
Simulation Results and Normalised Scores of Different Powertrain Configuration.
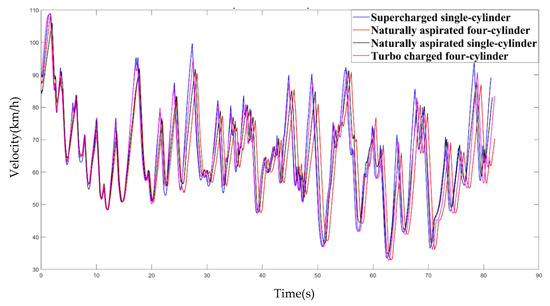
Figure 8.
Vehicle Speed of Racecars with Different Powertrain during Endurance Test.
3. Test and Simulation Platform
3.1. Supercharger Characteristic Test Bench
To determine the volumetric and thermal efficiencies of the supercharger, a test bench for supercharger characteristics was designed and built in the research process, as shown in Figure 9.
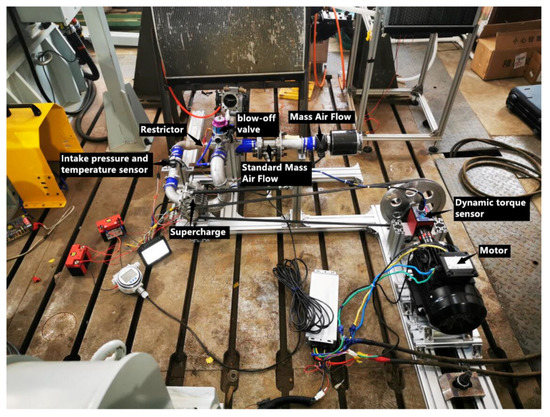
Figure 9.
Supercharger Characteristic Test Bench.
The test bench was driven by a DC motor. The speed and mechanical power of the supercharger were measured by a noncontact speed/torque sensor, and the air mass flow was measured by a hot-film air-flowmeter. Temperature and pressure sensors were arranged upstream and downstream of the supercharger to calculate the pressure ratio and the thermal efficiency. In addition, an adjustable blow-off valve was also installed downstream of the supercharger to adjust the different target pressure ratios. The output signals of each sensor were logged by a MOTEC C125 [22] data acquisition device. Table 6 presents the specification of the test bench.
Table 6.
Specification of Supercharger Characteristic Test Bench.
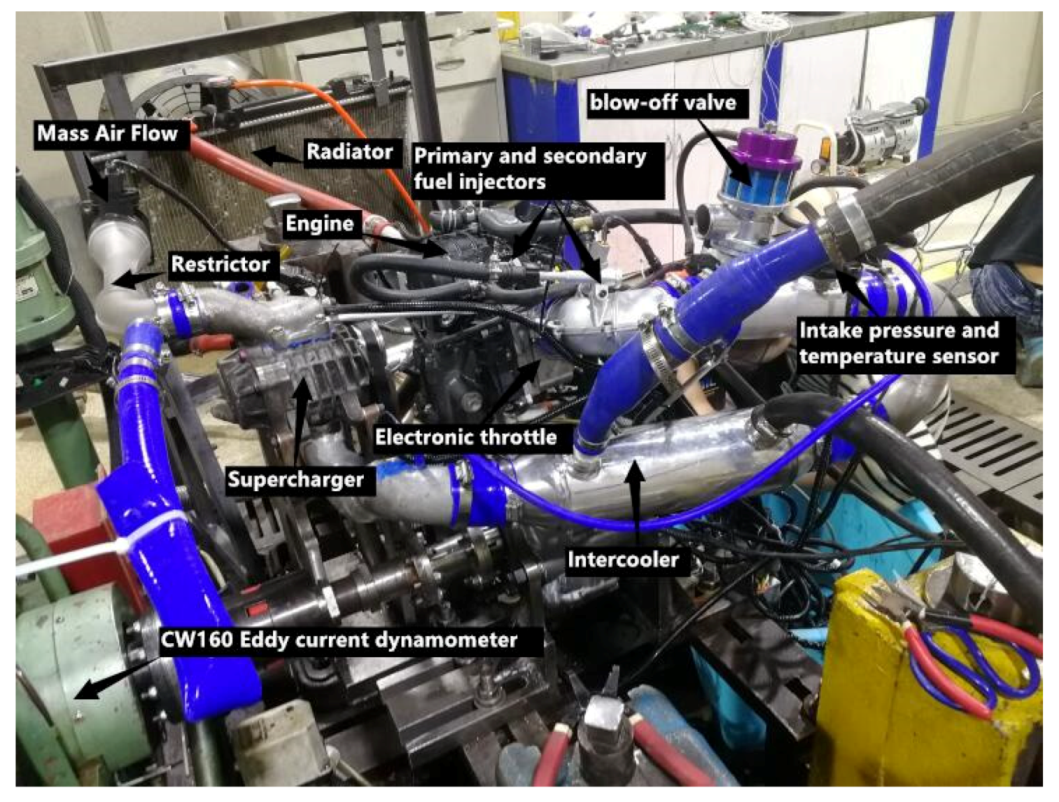
3.2. Engine Performance Test Bench
During the research, an engine performance test bench was built, consisting of the tested engine, universal coupling, an eddy current dynamometer, a coolant heat-transfer system and a fuel consumption meter, as shown in Figure 10. During the engine bench test, the engine was equipped with sensors as shown in Table 7.

Figure 10.
Engine Performance Test Bench.
Table 7.
Engine Performance Test Bench Sensors.
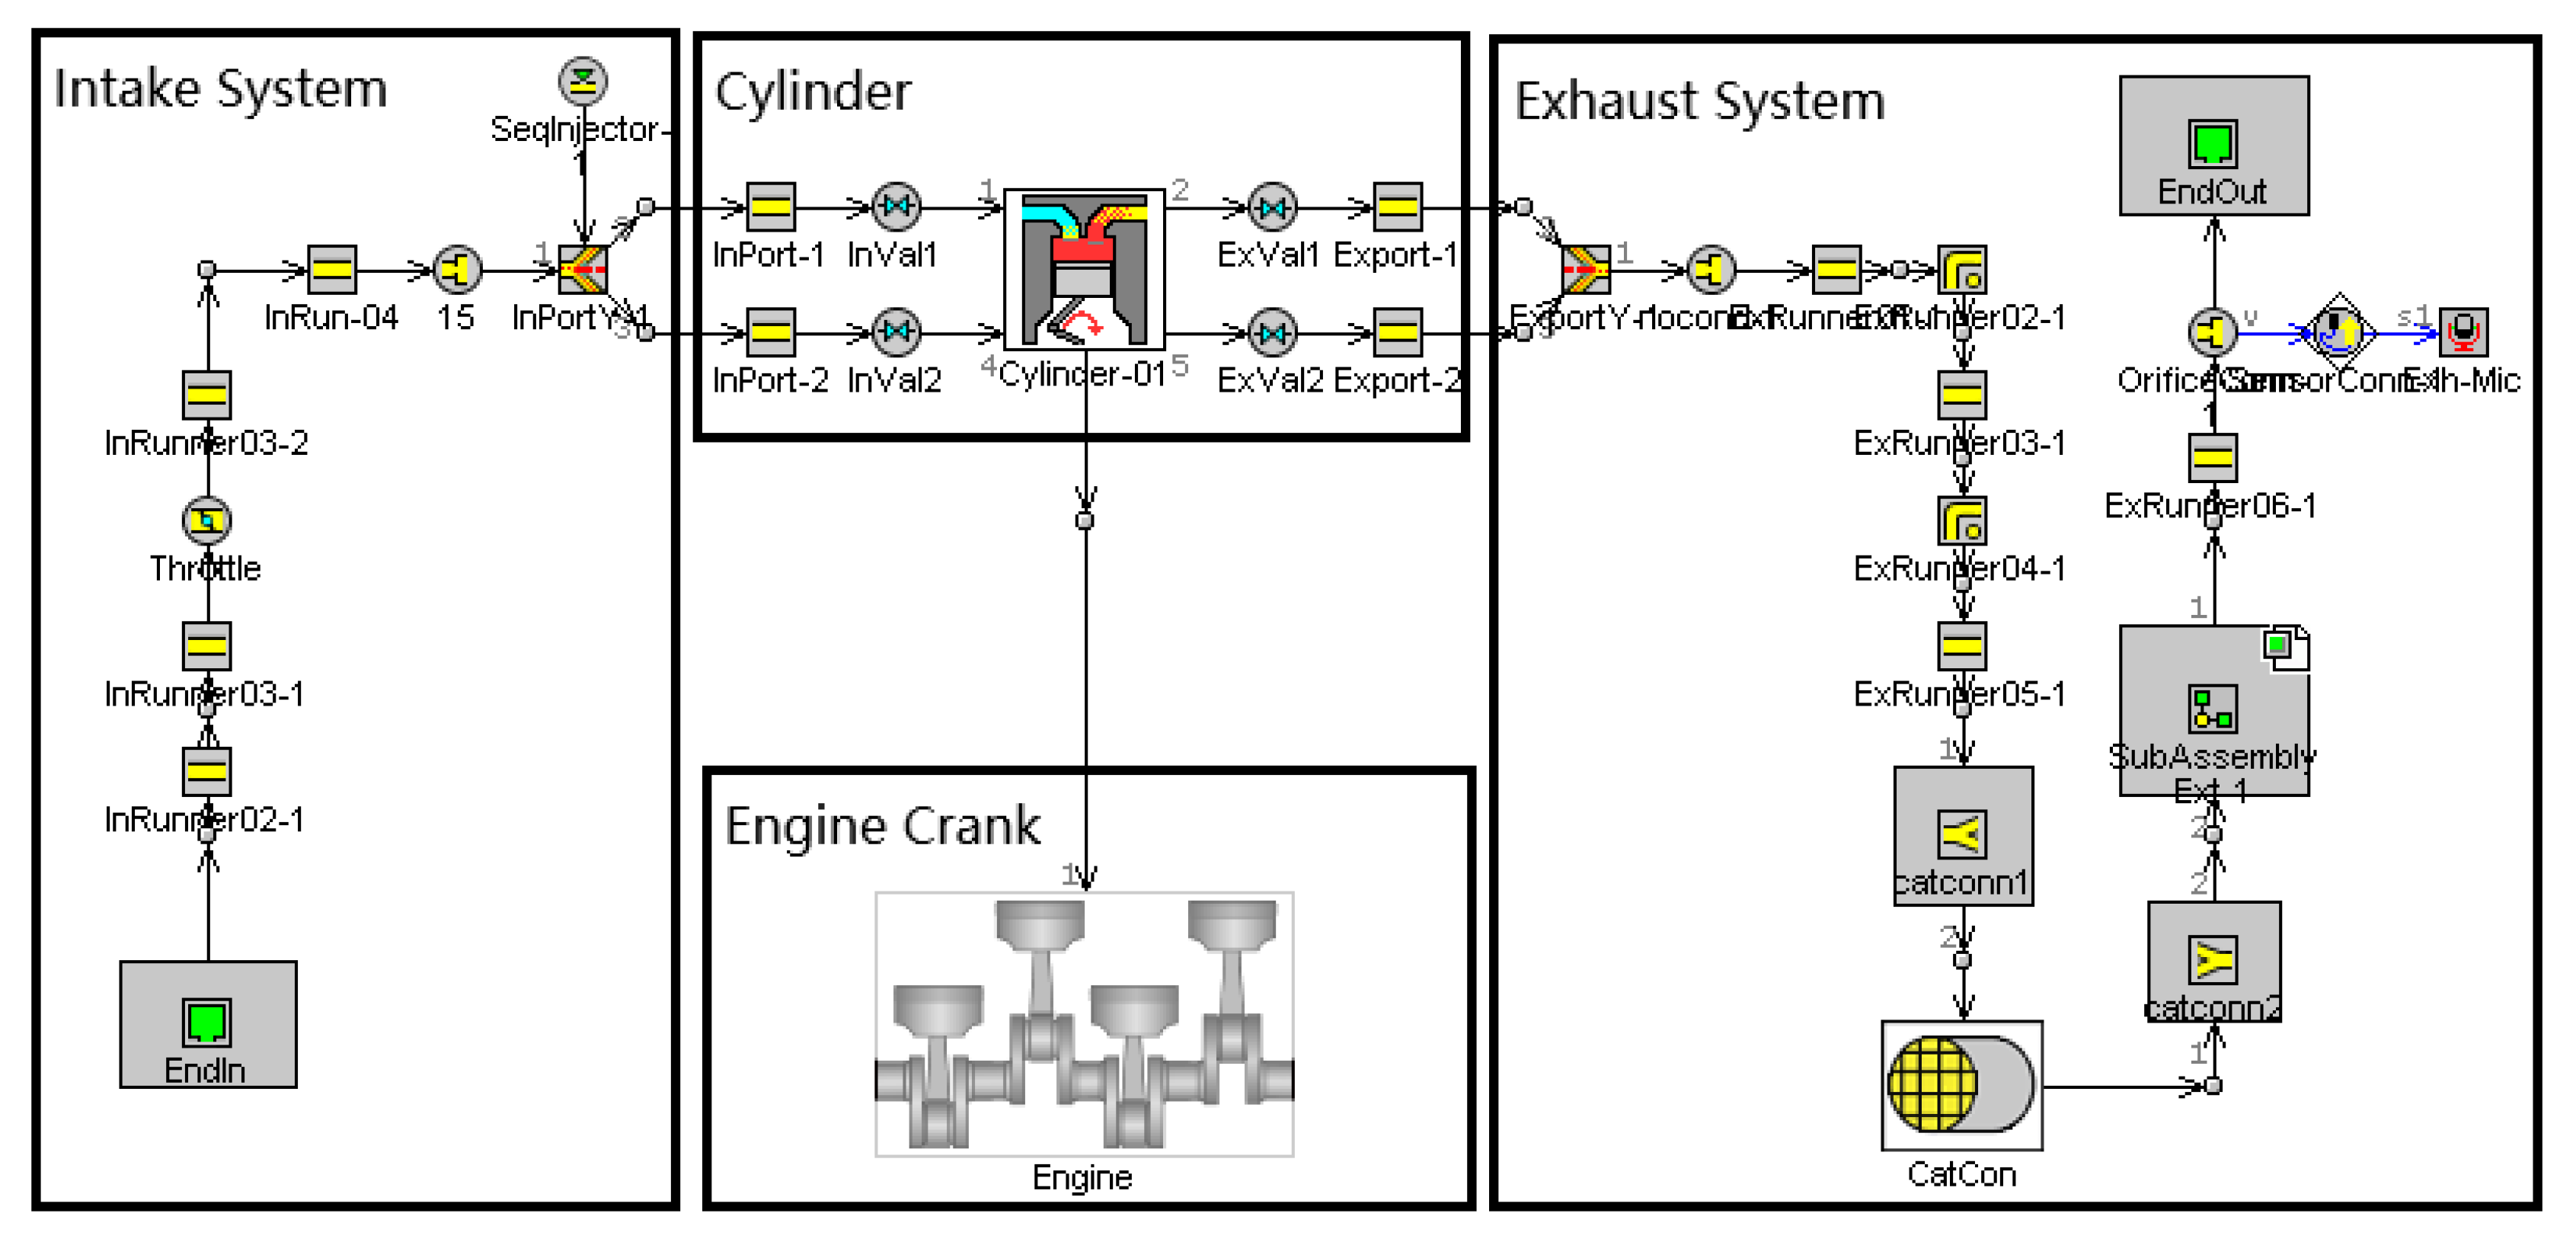
3.3. Engine 1D CFD Simulation Model
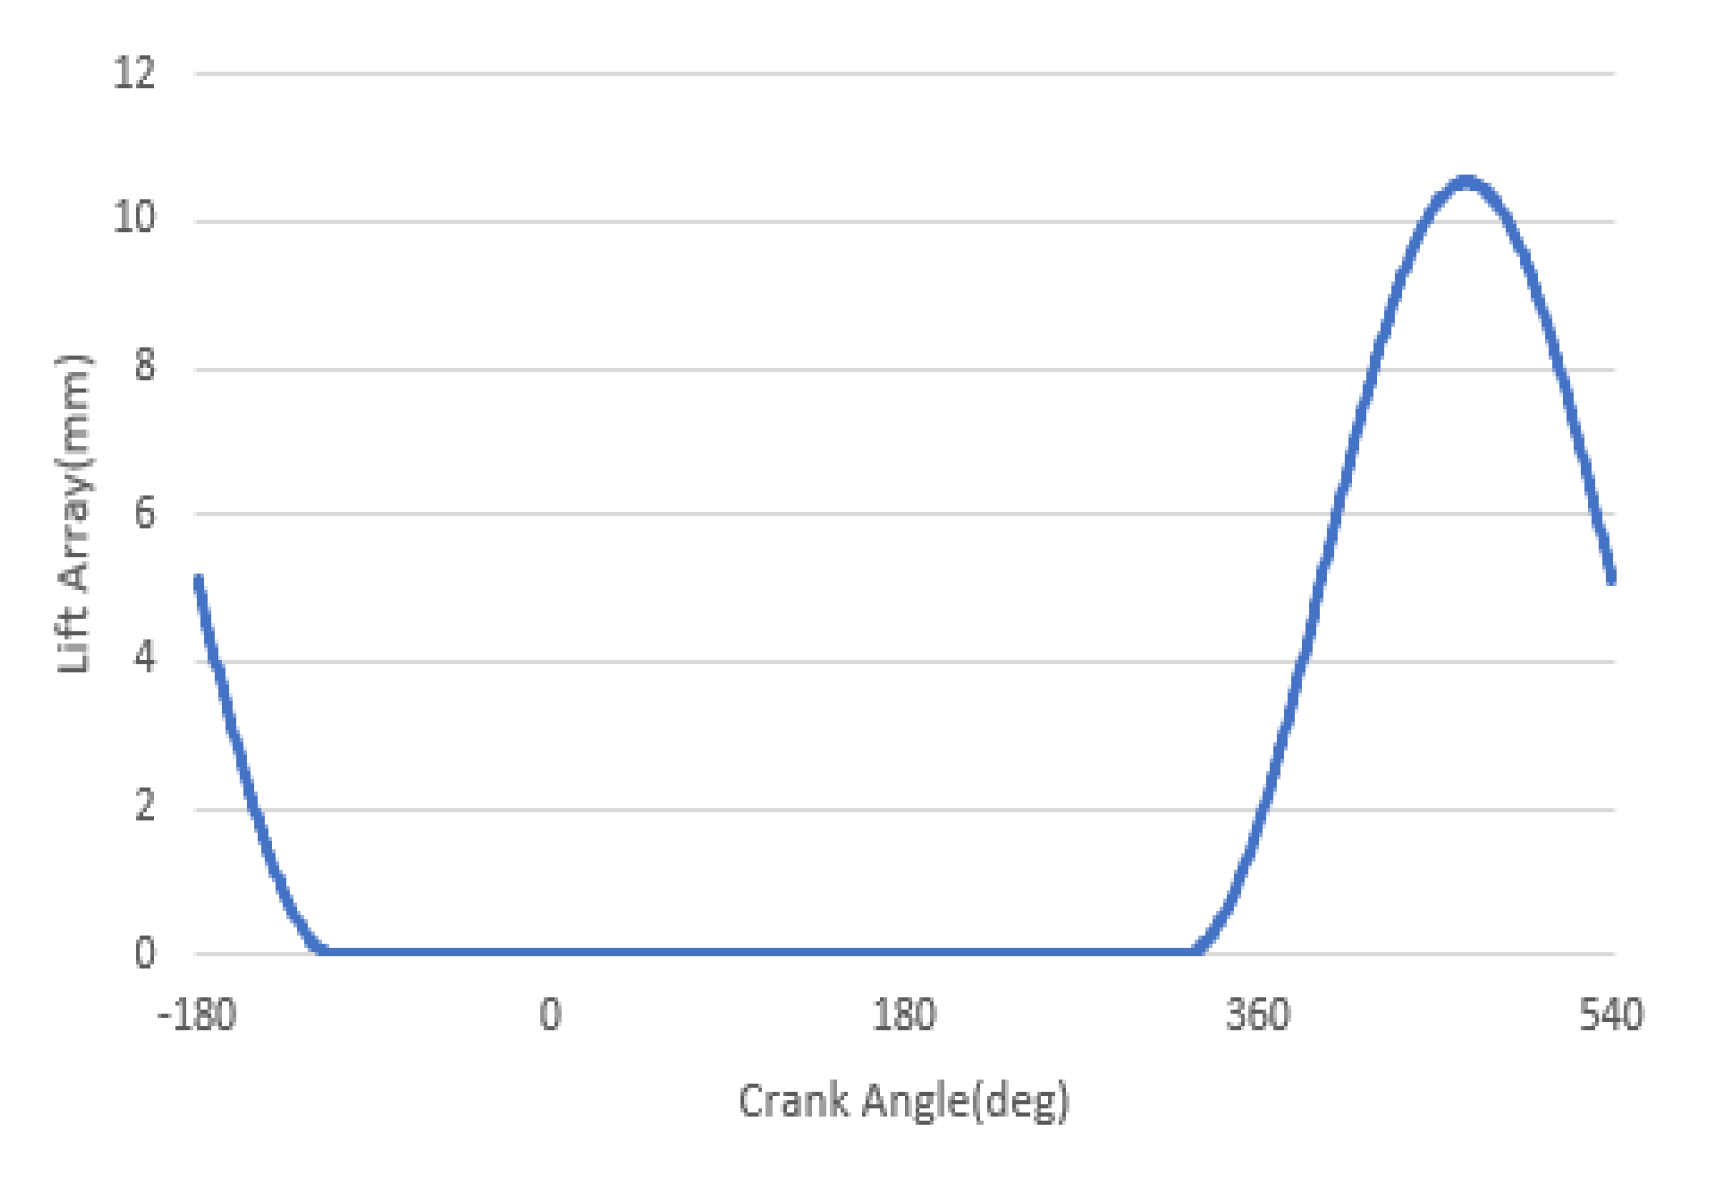
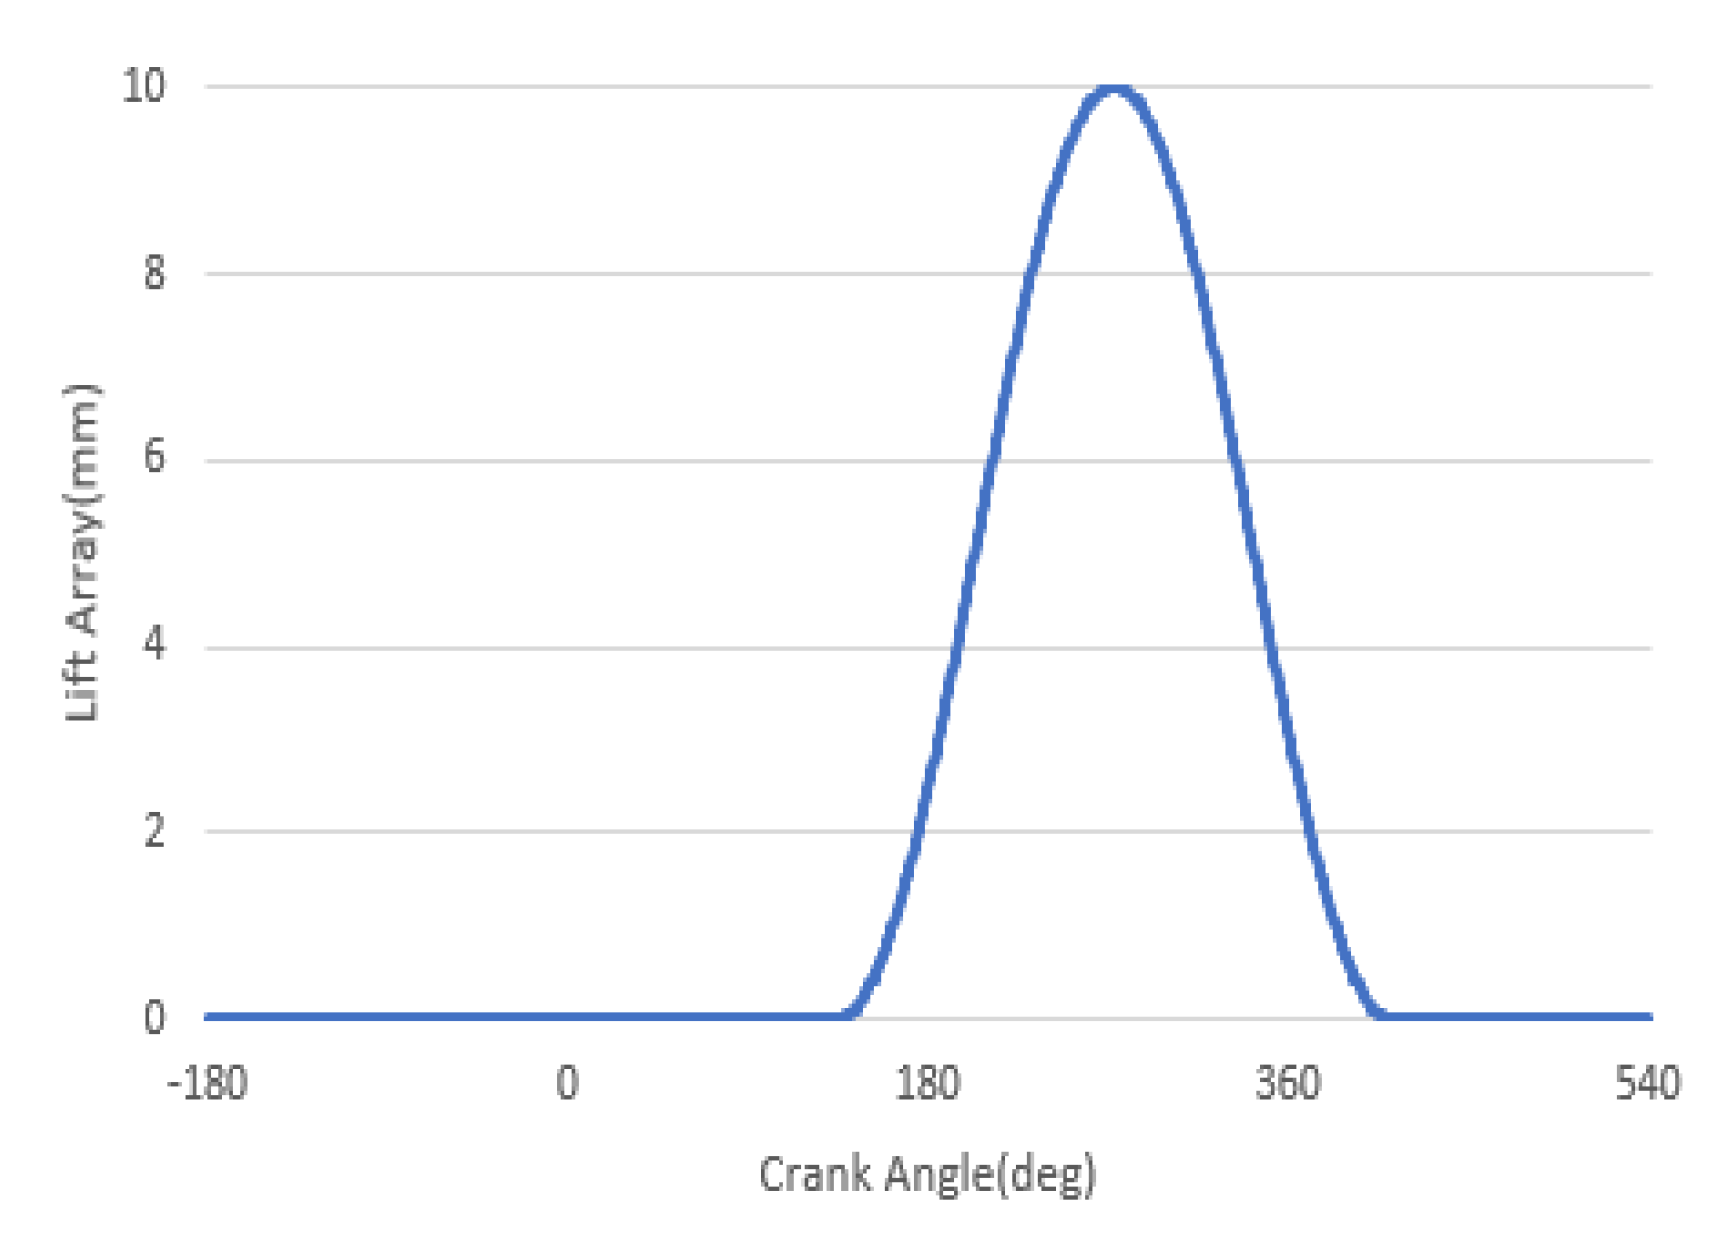
The GT-Power software [23] was used to build a One-Dimensional Computational Fluid Dynamics (1D CFD) simulation model of the stock engine. The model structure is shown in Figure 11. In the model, the intake and exhaust system, the cylinder, the crankshaft, the rotational inertia etc., are set according to the stock engine; the air–fuel ratio of the power mixture was 12.8:1 [24]. The valve lift curve, the diameter and the rod diameter were used as input based on the actual measurement results. The intake and exhaust valve lifts are shown in Figure 12 and Figure 13, respectively. The combustion model uses a dual-zone Wiebe combustion model [25]. Mechanical loss is used in D. E. Winterbone’s empirical formula for calculation [26]. To facilitate the subsequent calibration and verification of the model, the model does not reflect the air intake limiter required by the rules. The 1D CFD model of the stock engine was analysed and calculated, and the simulation results were compared with the dyno-tested result as shown in Figure 14. After the parameter calibration, the simulation and test results exhibited good agreement and a small error range.
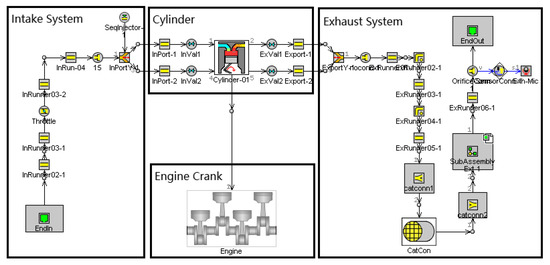
Figure 11.
Simulation Model of Stock Engine.
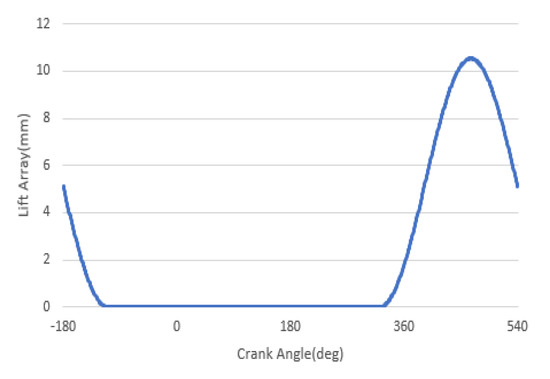
Figure 12.
Intake Valve Lift of KTM 690.
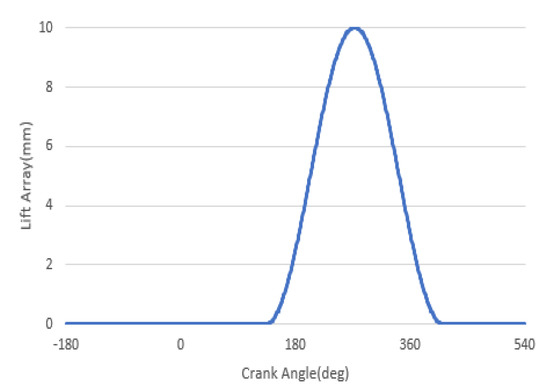
Figure 13.
Exhaust Valve Lift of KTM 690.
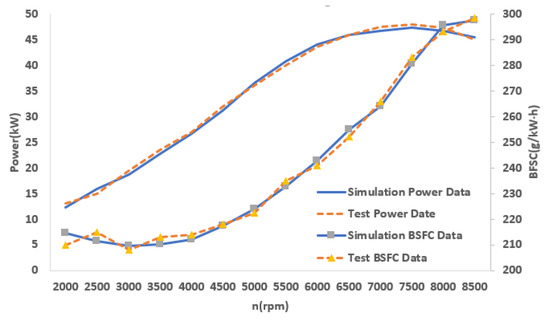
Figure 14.
Result of Simulation and Testing (Stock Engine at WOT).
On the basis of the stock engine simulation model, a supercharger, an intake blow-off valve and an intake restrictor were added, and the shape and size of the intake and exhaust manifolds were adjusted according to the actual situation of the project. The model of the modified engine is shown in Figure 15. The model of the compressor was established by interpolation based on the compressor characteristic map provided by the manufacturer or measured by the test bench. The intake restrictor model was established by using two pipes with different inlet and outlet diameters, and the diameter and length were determined according to the actual size. The opening of the intake blow-off valve was determined through the lookup table based on boost pressure.
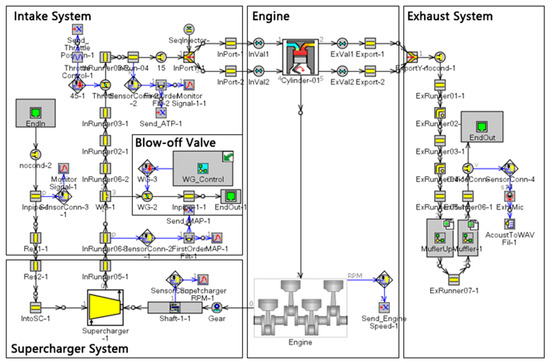
Figure 15.
Simulation Model of the Modified Supercharged Engine.
Given that the compression ratio of the stock engine is as high as 12.6, delaying the ignition advance angle and reducing the air–fuel ratio of the intake mixture are often necessary to suppress the greater knocking trend after boosting; considering the changes in pressure and airflow in the cylinder, the combustion duration will vary. Consequently, according to experience and related literature, the air–fuel ratio of the target engine under full load was set to 12.0:1, and the crankshaft phase corresponding to the 50% heat release rate was correspondingly delayed by 5°–10° [27].
4. Boost System Design
4.1. Supercharger Selection
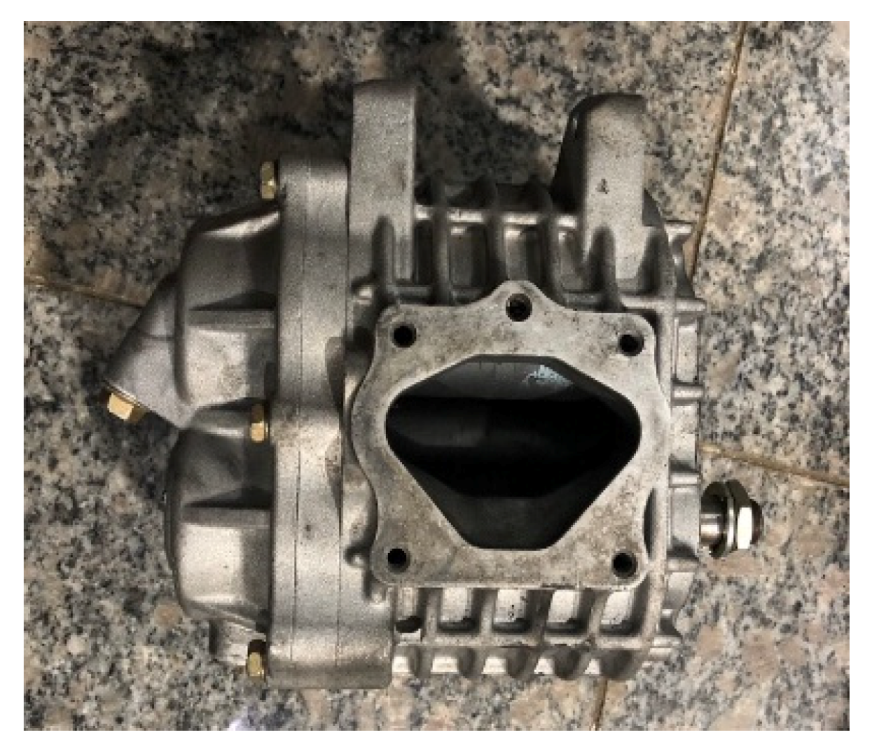
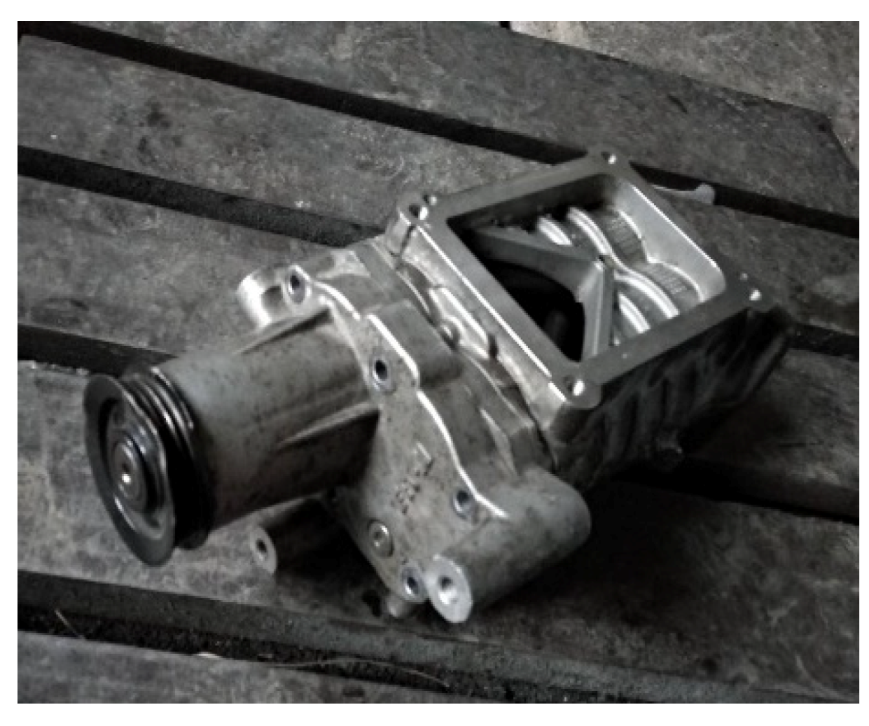
Automotive superchargers can be generally divided into three types: roots, twin screw and centrifugal types. According to the target power, the AISIN AMR300 roots-type, Eaton TVS-R410 twin-screw and Rotrex C8-8 centrifugal superchargers were preliminarily selected, as shown in Figure 16, Figure 17 and Figure 18. The specifications of these three superchargers are shown in Table 8.

Figure 16.
AISIN AMR300.
Figure 17.
Eaton TVS-R410.

Figure 18.
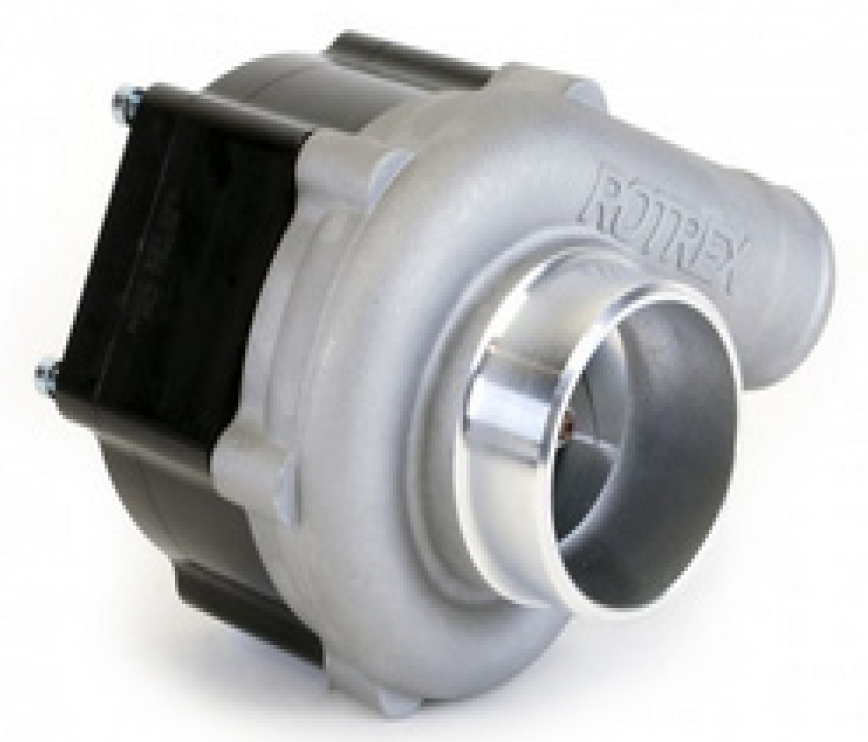
Rotrex C8-8.
Table 8.
Specification of Superchargers.
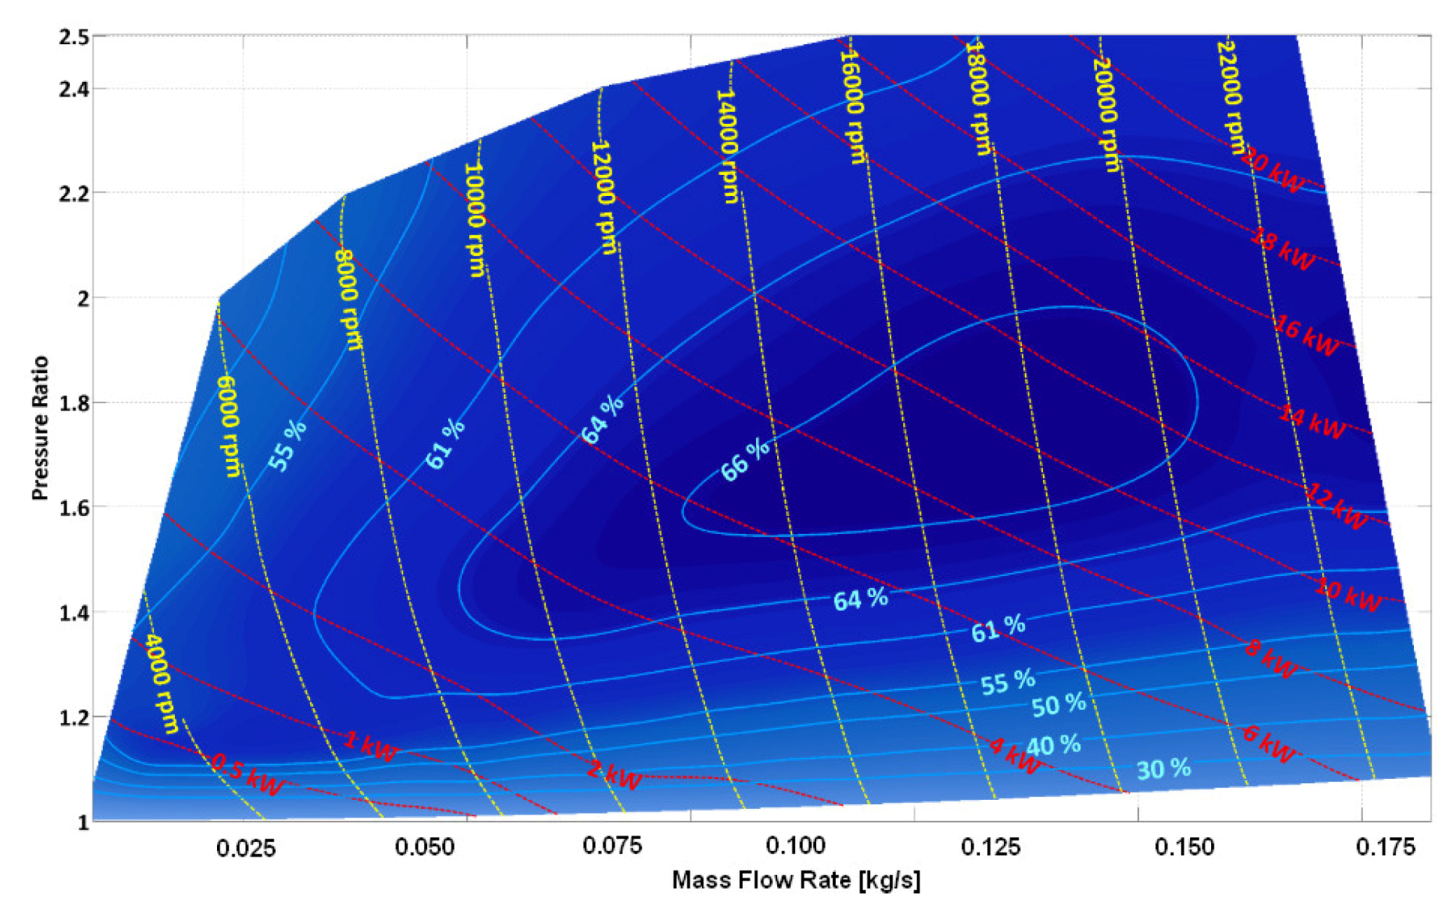
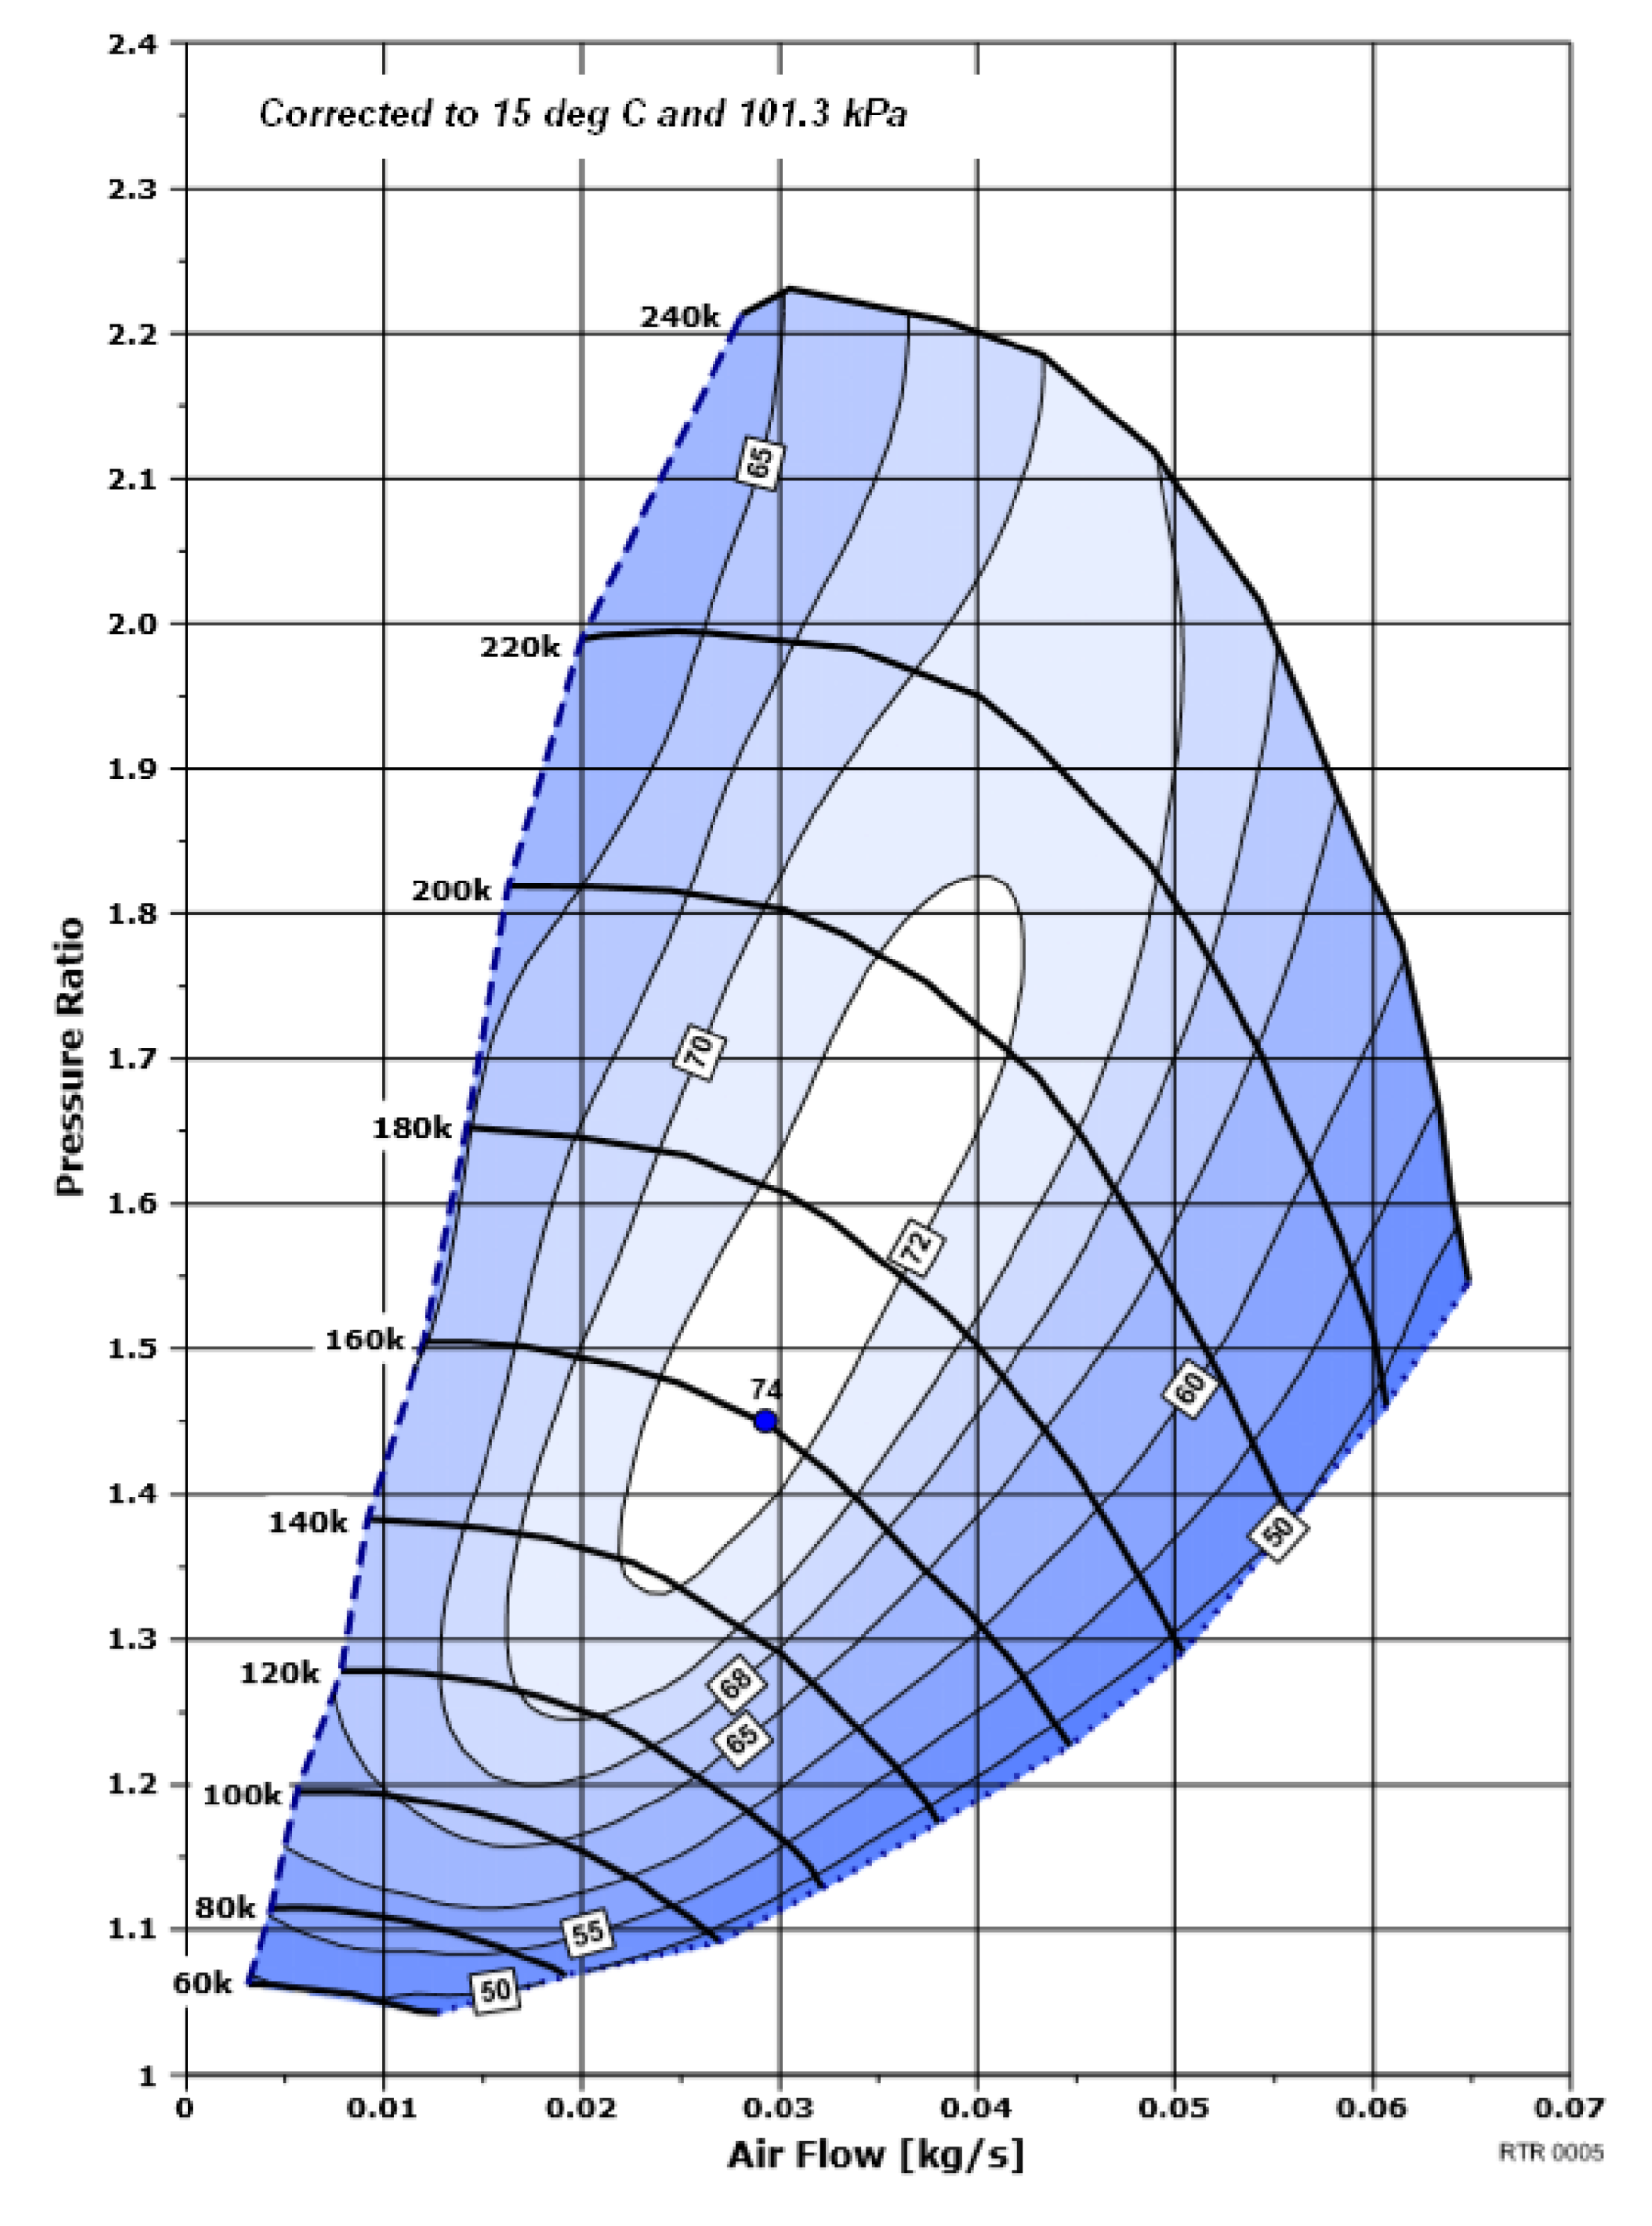
Using the supercharger characteristic test bench introduced in Section 3, the performance and characteristics of AISIN AMR300 were measured, as shown in Figure 19. The performance of Eaton TVS-R410 and Rotrex C8-8 were offered by the manufacturers [28,29], as shown in Figure 20 and Figure 21, respectively. In these figures, some parameters such as 10,000 rpm or 200 k represent the rotation speed of superchargers, some parameters such as 2 kW represent the shaft power of superchargers, and some parameters such as 65% or 70 represent the efficiency of superchargers.
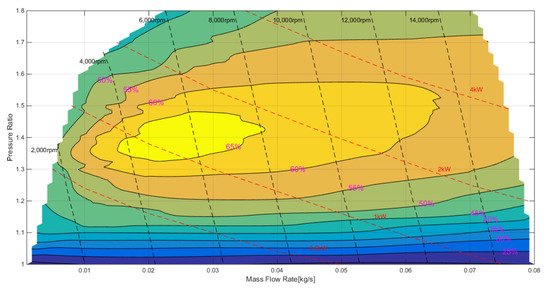
Figure 19.
Performance Map of AISIN AMR300.
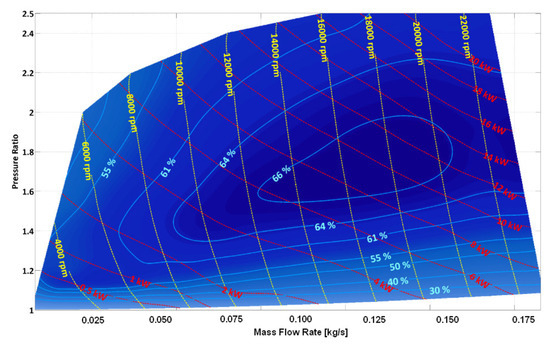
Figure 20.
Performance Map of Eaton TVS-R410.

Figure 21.
Performance Map of Rotrex C8-8.
The three superchargers were evaluated in six aspects, i.e., power, torque, efficiency, lightweight, compactness and cost. The normalised scores are shown in Table 9. The normalised scoring criteria for the supercharger are as follows:
Table 9.
Normalised Scores of Different Superchargers.
- (1)
- Power—the power is evaluated by the maximum air mass flow of supercharger, 25 g/s or lower is 0, 75 g/s or higher is 1;
- (2)
- Torque—set the speed range corresponding to the supercharger capable of achieving a pressure ratio of 1.5 as n0, and set the maximum speed of supercharger as n1; n0/n1 is the normalised score of torque;
- (3)
- Efficiency—the supercharger has a maximum thermal efficiency of 72% or more with a score of 1, 69–72% score of 0.9, 66–69% score of 0.8, 63–66% score of 0.7, and so on, the minimum score is 0;
- (4)
- Compactness—compactness is evaluated by volume, below 2500 cm3 achieves a score of 1, 2500~3000 cm3 a score of 0.9, 3000~3500 cm3 a score of 0.8, 3500~4000 cm3 a score of 0.7, 4000~4500 cm3 a score of 0.6, and so on, the minimum score is 0;
- (5)
- Lightweight—weight of less than 4 kg achieves a score of 1, the 4~4.5 kg a score of 0.9, the 4.5~5 kg a score of 0.8, and so on, the minimum score is 0;
- (6)
- Cost—evaluate the cost of aftermarket auto parts, below $500 is 1, $500~750 is 0.9, $750~1000 is 0.8, $1000~1250 is 0.7, and so on, and the minimum score is 0.
The results indicate the following:
- The centrifugal supercharger (Rotrex C8-8) has advantages in terms of efficiency, compactness and lightweight. However, the supercharger’s torque characteristics cannot meet the design goals due to the obvious nonlinear relationship between the flow rate and speed.
- The twin-screw supercharger (Eaton TVS-R410) has advantages in terms of performance, i.e., its power, torque and efficiency are ideal, but its volume and weight are large. Thus, the supercharger may be difficult to arrange on a Formula Student racecar.
- The roots-type supercharger (AMR300) has ideal power and torque characteristics and a small volume and is lightweight and reasonably priced, garnering the highest comprehensive score.
Therefore, the AISIN AMR300 roots-type supercharger was selected.
4.2. Parameter Matching of Supercharger
For a four-stroke engine with a roots-type or twin-screw supercharger, if the engine speed is , then the effective power is , the BSFC is and the supercharger transmission ratio [30] is tr:
Mass flow rate:
Air density of compressor outlet:
Compressor pressure ratio:
Supercharger transmission ratio:
where:
- is the excess air coefficient Lambda, and the supercharged gasoline engine is taken as 0.82 at full load (WOT);
- is the ideal air–fuel ratio, i.e., 14.7;
- is the number of cylinders, i.e., 1;
- is the displacement of a single cylinder, i.e., 0.69 L;
- is the engine charging efficiency, and the four-valve engine is taken as 0.90;
- is the average intake temperature after supercharging, initially set at 330 K;
- is the normal pressure, i.e., 101 kPa;
- is the normal temperature, i.e., 298 K;
- is the air density at normal temperature and pressure, i.e., 1.18 kg/m3;
- is the volume of the supercharger, i.e., 0.3 L;
- is the volumetric efficiency of the supercharger, the roots-type mechanical supercharger is taken as 0.97.
In stock configuration of the KTM 690, the maximum power outputs are around 7500 r/min, and the target maximum power is 60 kW. Let , then the boost ratio is approximately 1.45. The maximum torque in the stock state is output around 6000 r/min, and the target maximum torque is 80 Nm, while the power can be 50.3 kW, and the boost ratio is approximately 1.50. According to the design requirements, the high torque range is not less than 50% of the full speed range. The maximum engine speed is 8500 r/min, if/when the engine speed is 2500 r/min, the torque is 72 Nm, while power should be 18.8 kW, and boost ratio is approximately 1.35.
In summary, the target pressure ratio range of the preliminary calculation is 1.35–1.50, and the supercharger transmission ratio is 0.61–0.68.
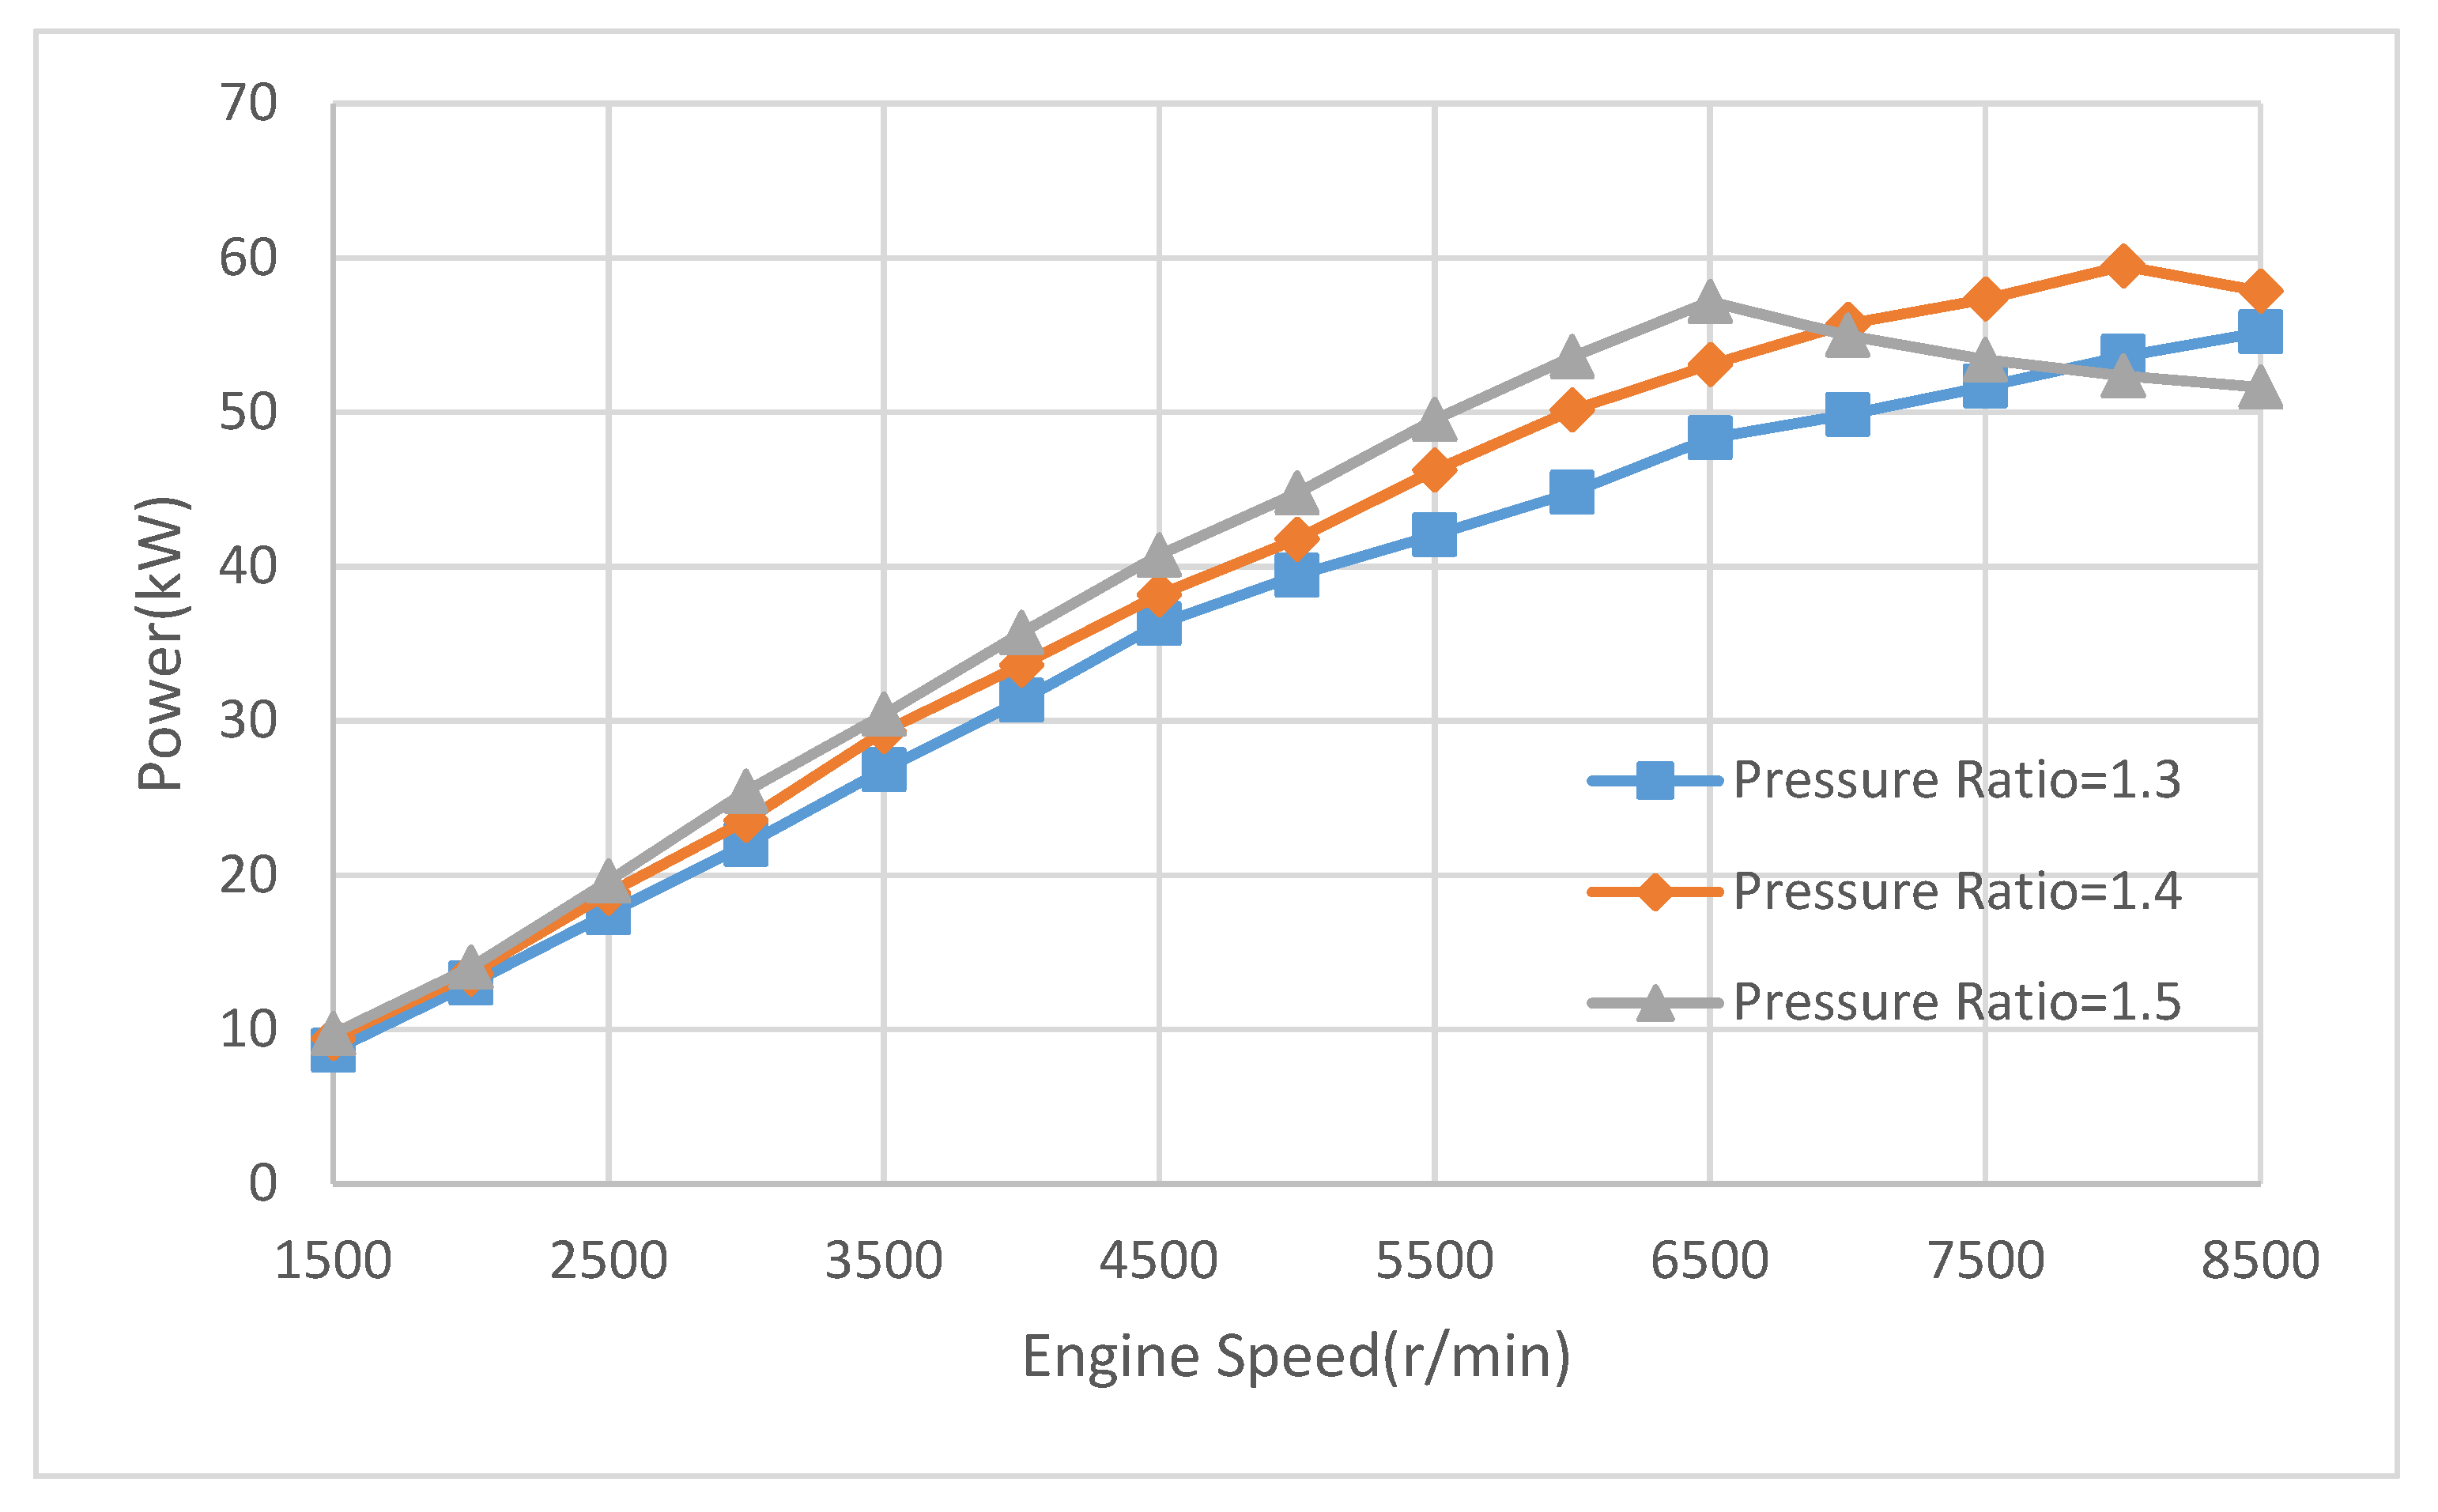
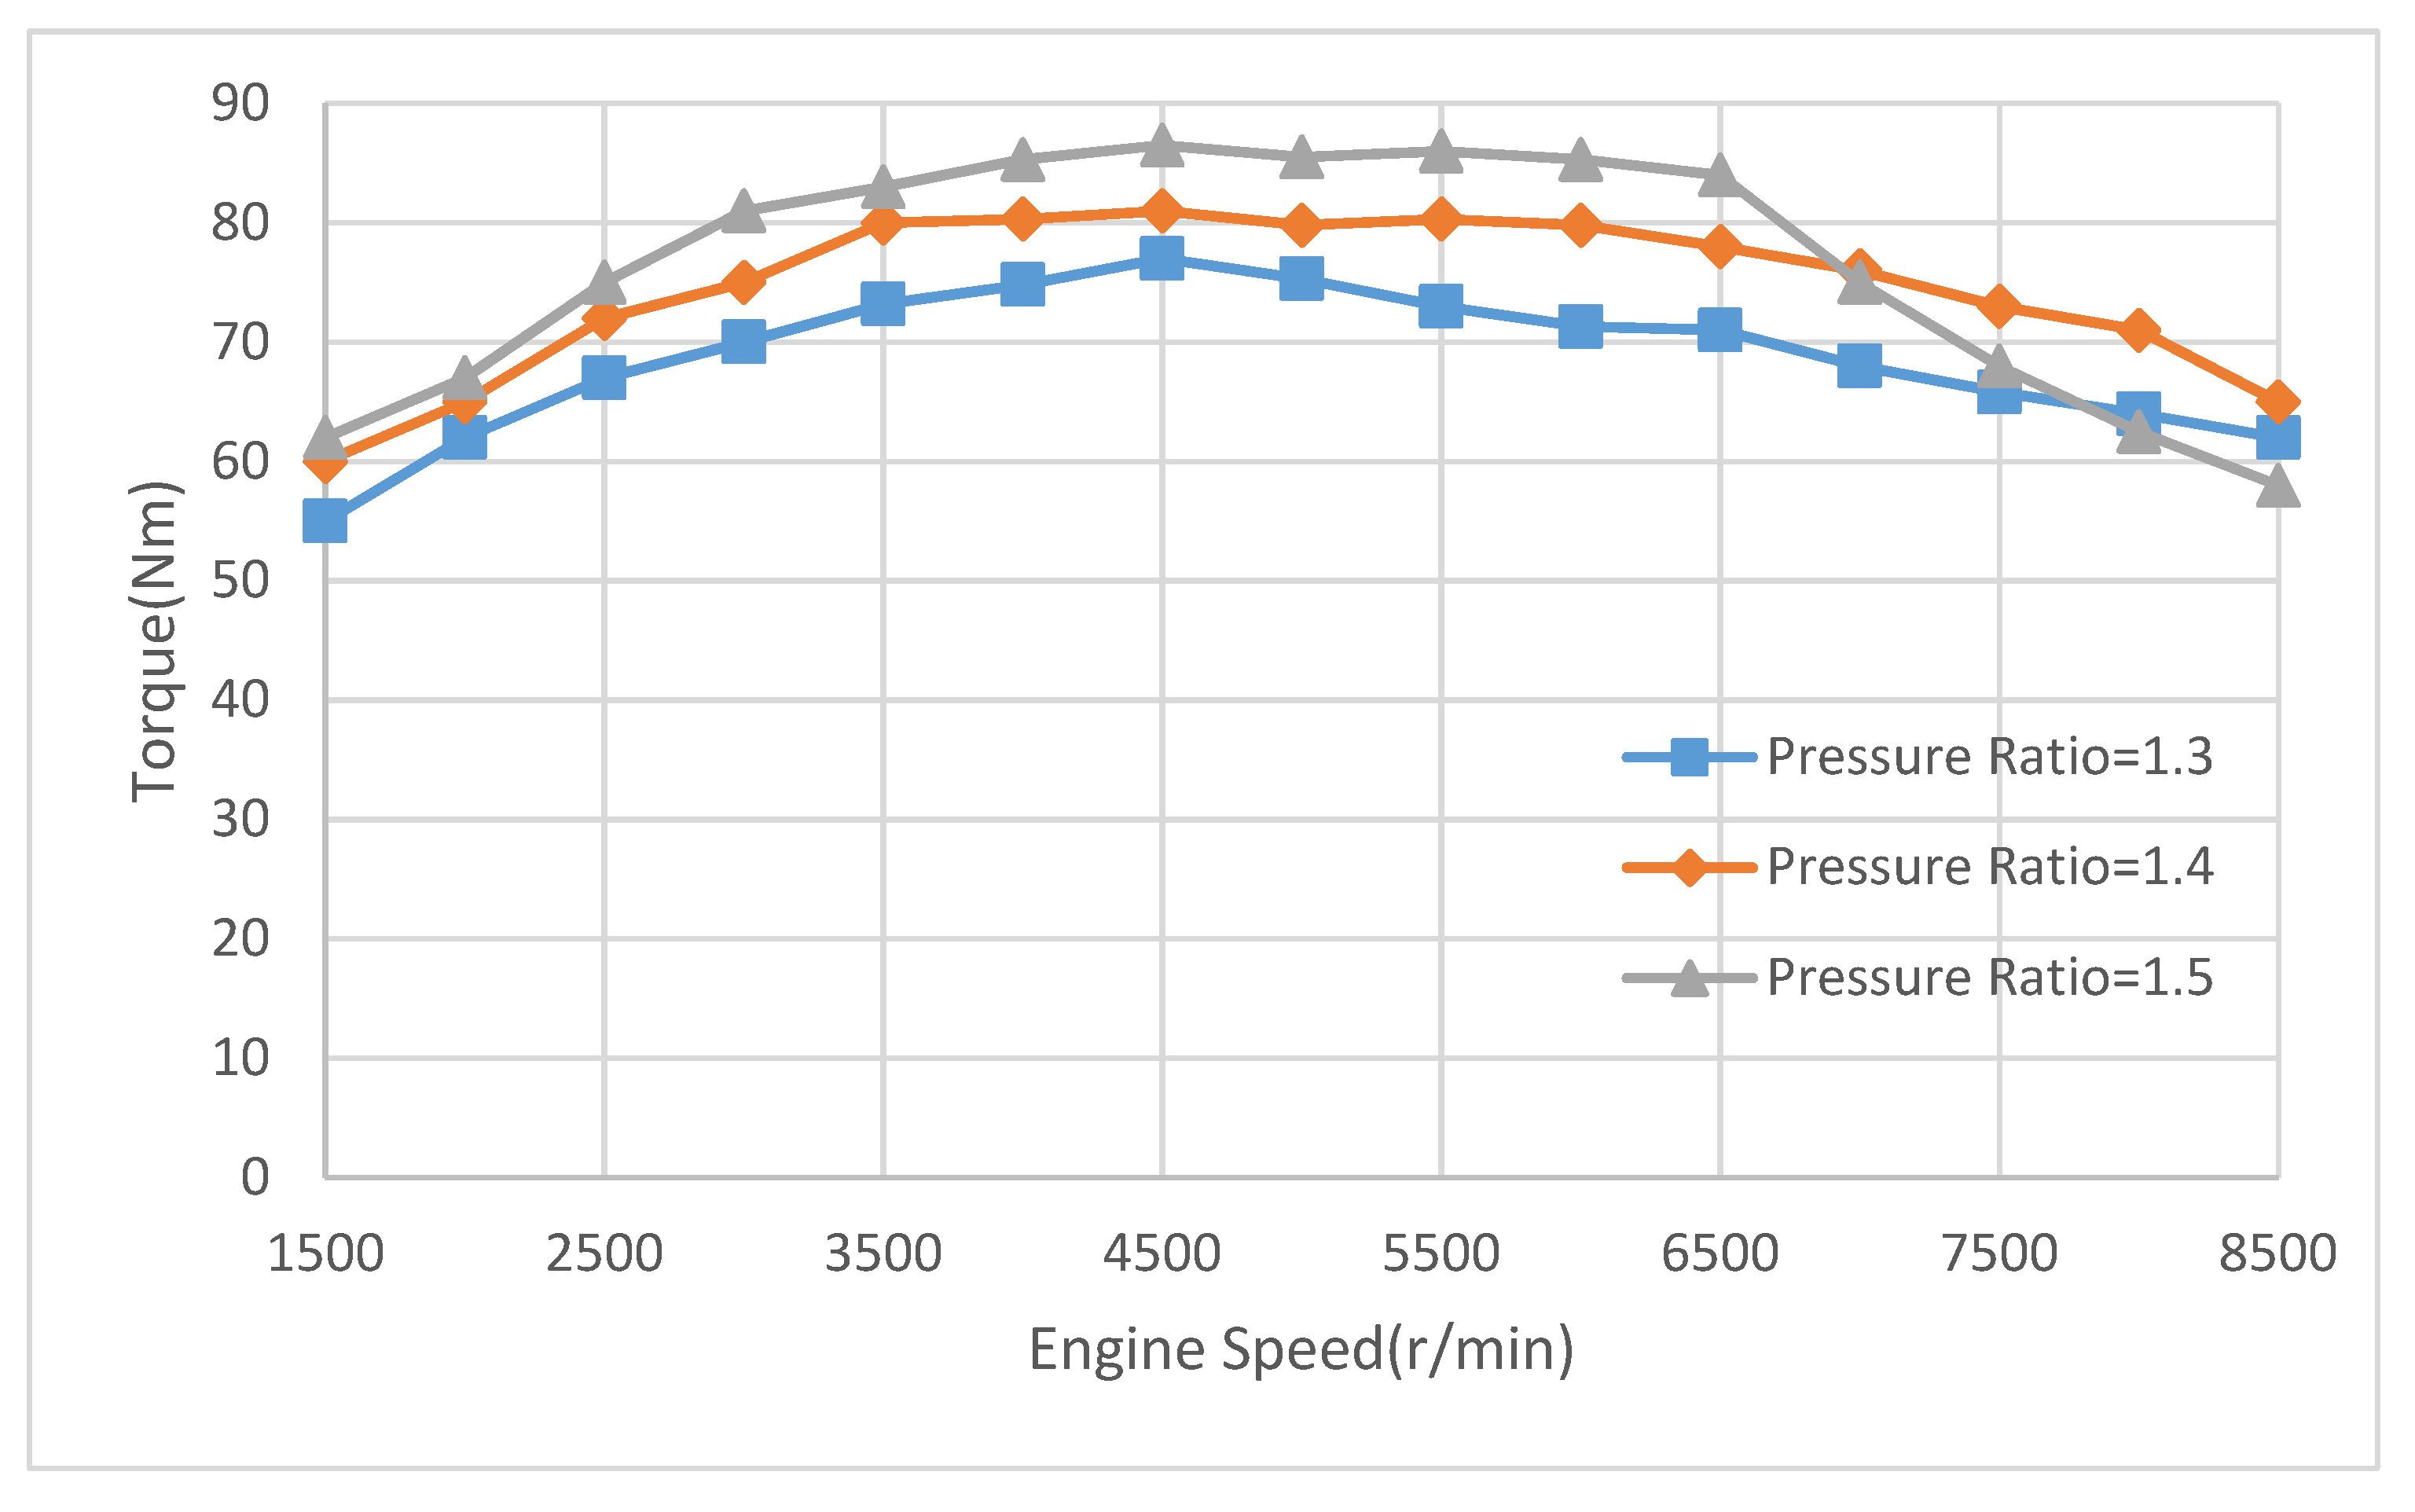
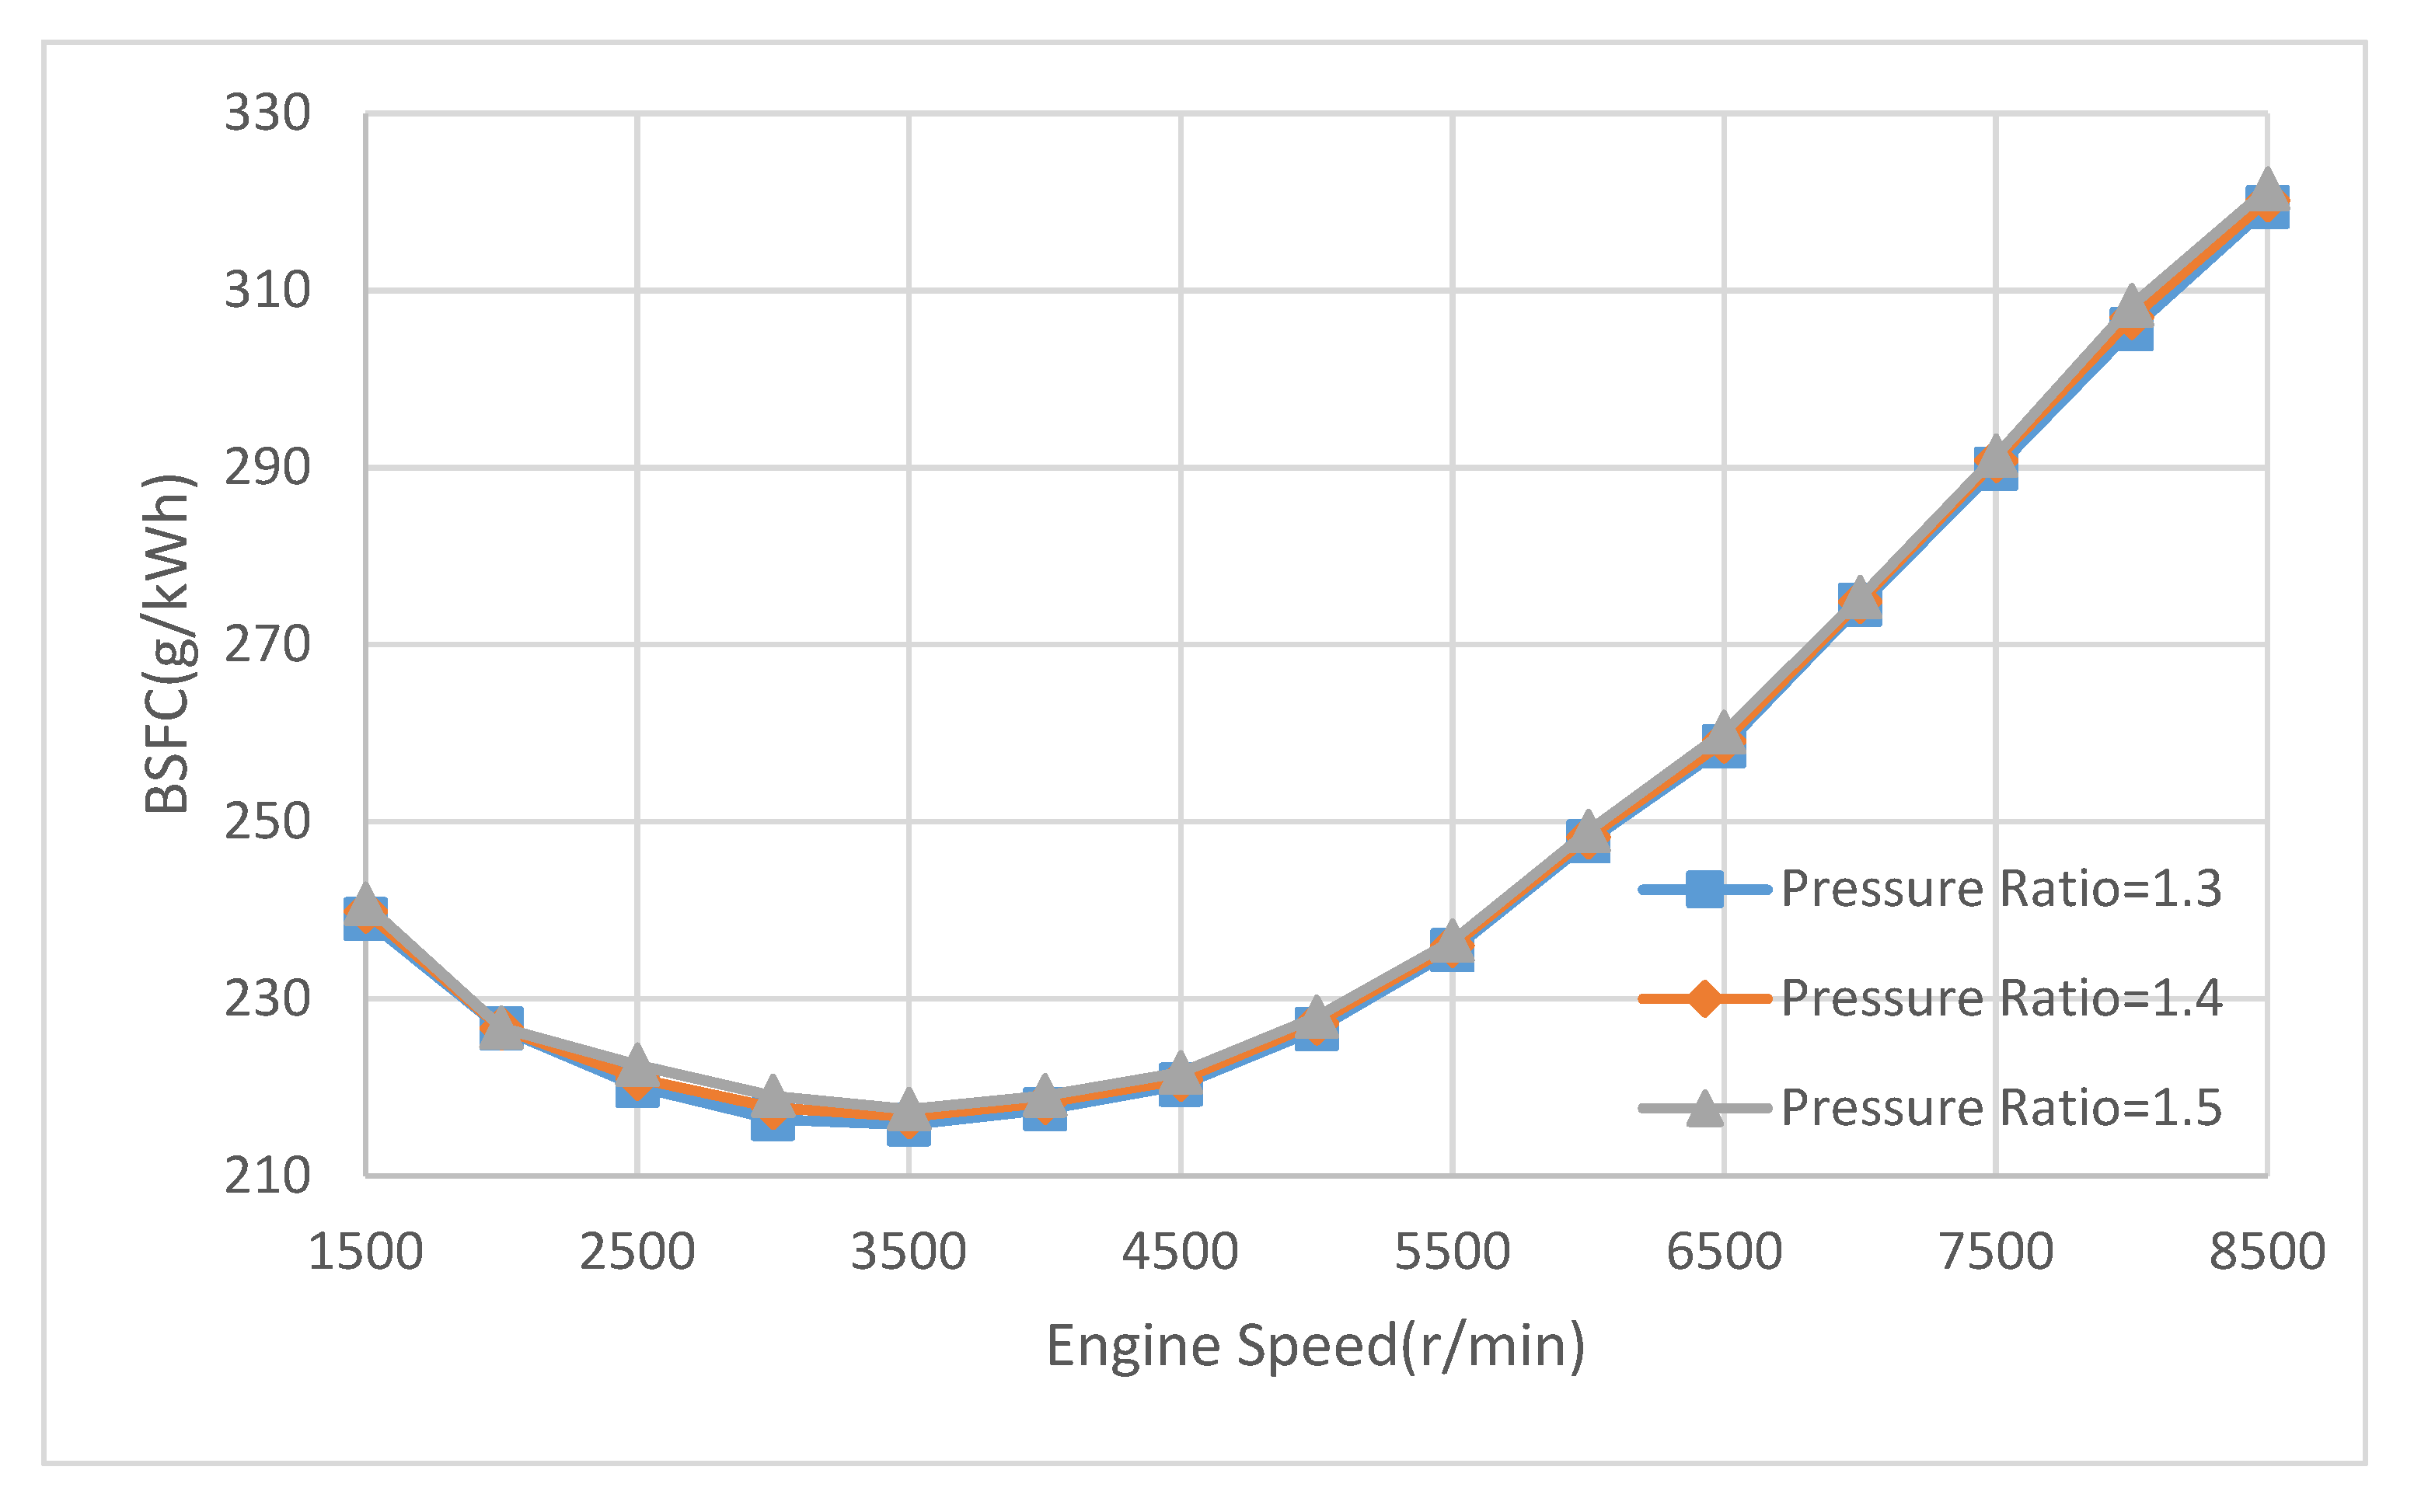
In the 1D CFD simulation model of the engine described in Section 3, the target pressure ratios were set to 1.30, 1.40 and 1.50, and simulation was performed to obtain the full load power, the torque and the BSFC, as shown in Figure 22, Figure 23 and Figure 24, respectively.
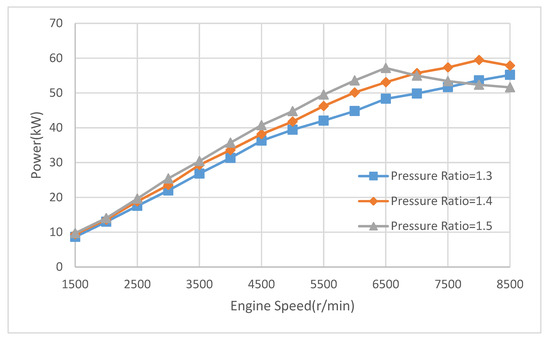
Figure 22.
Full Load Power with Different Pressure Ratio.
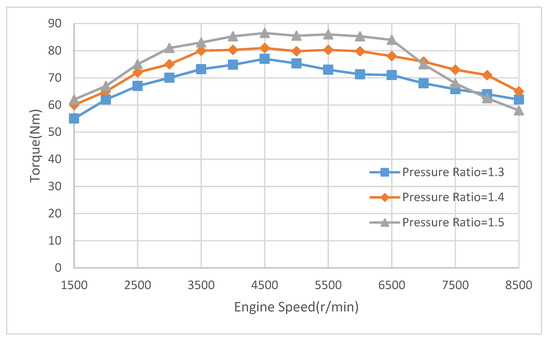
Figure 23.
Full Load Torque with Different Pressure Ratio.
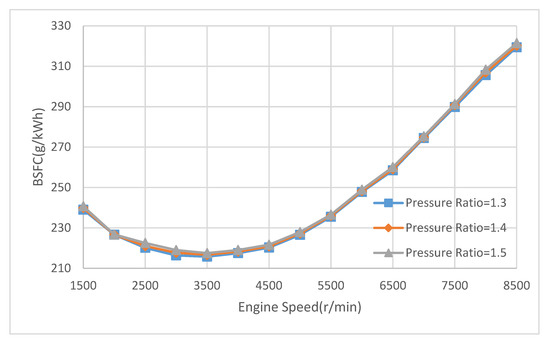
Figure 24.
Full Load Brake Specific Fuel Consumption (BSFC) with Different Pressure Ratio.
The results show that the three pressure ratios can achieve the design goal. When the pressure ratio is 1.30, the maximum power will occur very near to the maximum engine speed, which is not conducive to the dynamic vehicle design. When the boost ratio is 1.50, the torque output will be high and the maximum will occur early, but the efficiency is relatively low. Therefore, the target pressure and supercharger transmission ratios were finally determined to be 1.40 and 0.66, respectively.
4.3. Blow-off Valve Design and Control
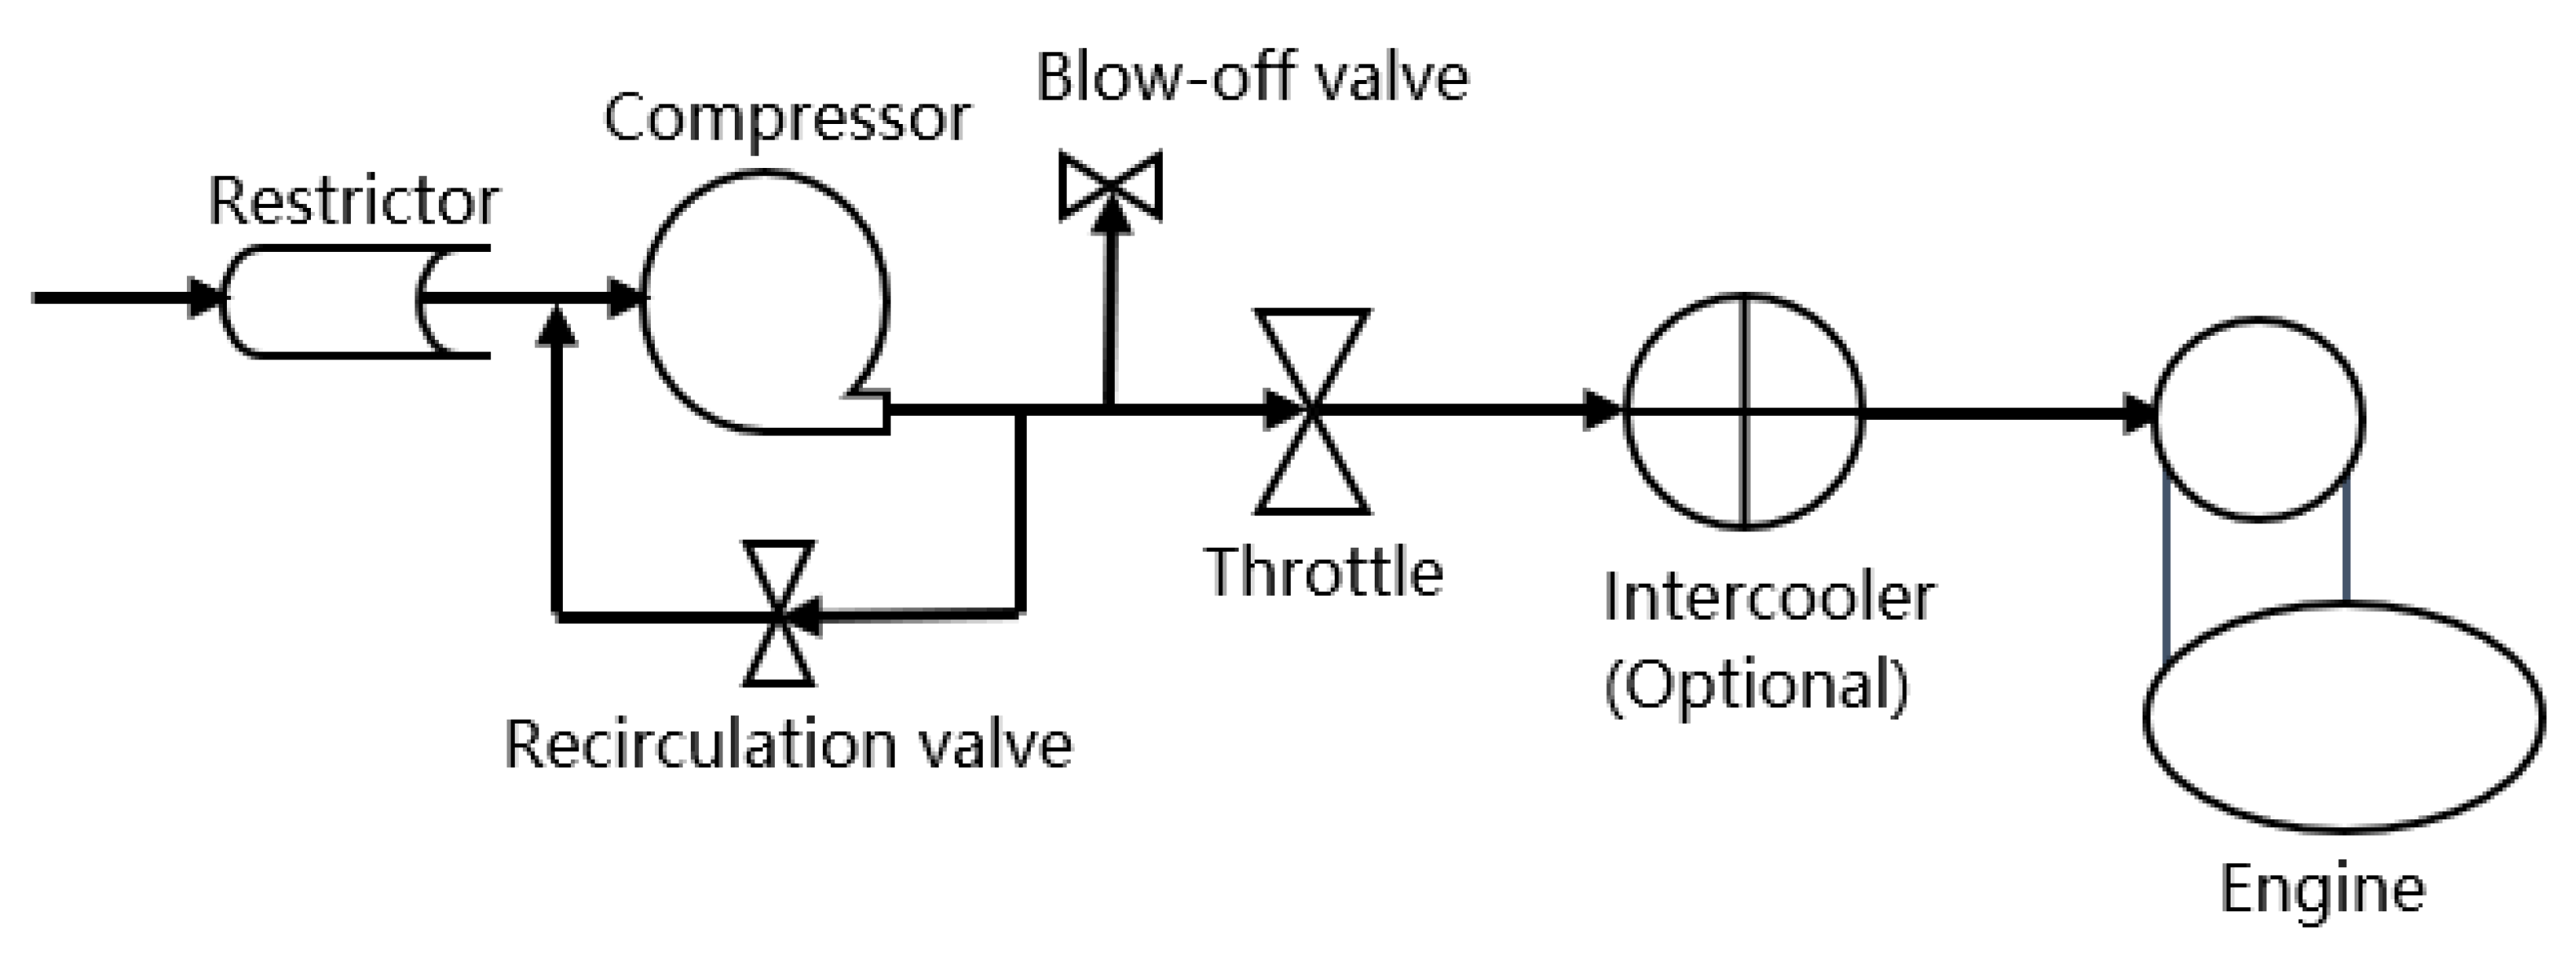
According to the technical rules of Formula Student, the throttle must be arranged downstream of the compressor, shown as Figure 25. Given that the air flow rate of the supercharger is mainly dependent on the compressor speed, the air flow at the compressor outlet at a certain engine speed is approximately equal to the flow demand of the full load condition. If the engine is at a part load, the compressor flow rate will be higher than the engine requirement. Therefore, to avoid over-boosting, a blow-off valve must be provided on the intake system between the compressor and the throttle body to release part of the compressed air.
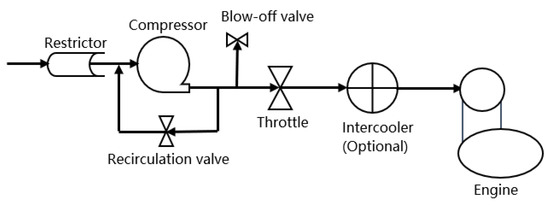
Figure 25.
The Layout of Intake System ruled by Formula Student.
A typical intake blow-off valve is a pneumatic bypass valve with a spring preload that can be driven by compressed air, as shown in Figure 26. When the boost pressure reaches the target, the valve will open under the boost pressure. The opening increases with the boost pressure. With this type of valve, the boost pressure is mainly determined by the spring stiffness and preload, which is independent of the engine load. However, at idle or low load, the intake air requirement by the engine is very low, but the compressor still provides a high-pressure ratio. However, according to the supercharger characteristics shown in Figure 19, at a certain engine speed, the higher the pressure ratio is, the higher the power consumption of the supercharger is. This simple blow-off valve will result in unsatisfactory engine efficiency.
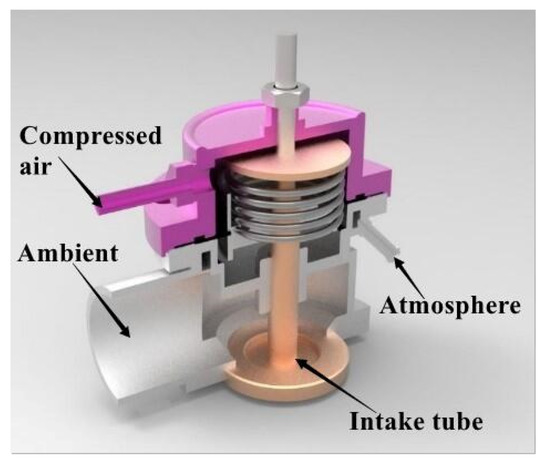
Figure 26.
Typical intake blow-off valve sectional structure diagram.
To further reduce the mechanical power consumption at idle speed and low load, this study improved the structure of the intake blow-off valve and designed a new control method called ‘dual-line and dual-solenoid’. The new blow-off valve has a pressure cylinder and a vacuum cylinder. The vacuum cylinder is downstream of the throttle body through a vacuum line, and the pressure cylinder is connected to the compressor outlet through a pressure line. Both lines have a PWM solenoid that should be controlled by the engine control unit through a duty-cycle signal, as shown in Figure 27.
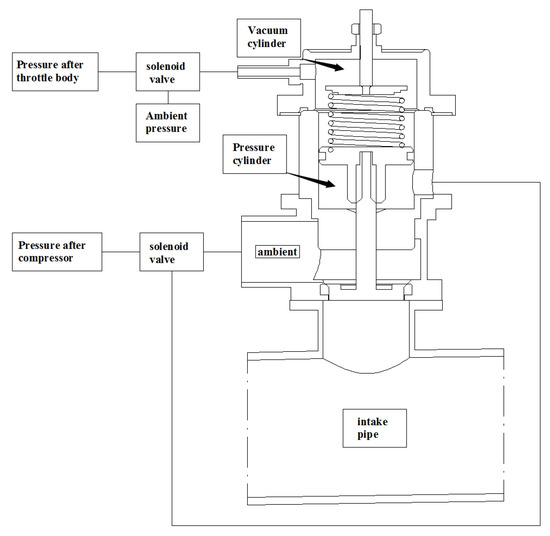
Figure 27.
New Blow-off Valve and ‘Dual-line and dual-solenoid’ Pneumatic Connection.
The control strategy is as follows:
- At idle and low loads, the pressure and vacuum lines are both enabled, and the blow-off valve is driven by the vacuum behind the throttle. The pressure ratio is reduced to approximately 1 to reduce the power consumption of the supercharger.
- At medium part load, the pressure line is enabled but the vacuum line is disabled. The pressure ratio reaches approximately 1.2 as determined by the valve spring stiffness; as the load continues to increase, the pressure line gradually closes, and the pressure ratio gradually increases to 1.35–1.40 to avoid the sudden change of engine torque and improve the drivability.
- At full load, the pressure and vacuum lines are both disabled, and the blow-off valve is completely closed. All pumped air from the supercharger is supplied to the engine, and the supercharging ratio reaches the target of approximately 1.40.
The supercharger working condition path-line under different throttle positions and compressor speeds is shown in Figure 28. Under high load, the supercharger makes full use of the area with a high thermal efficiency. Meanwhile, the mechanical power loss of the supercharger is also significantly reduced under low load.
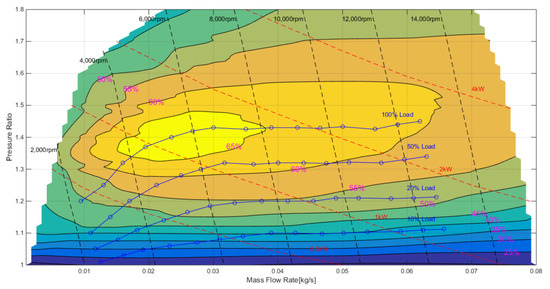
Figure 28.
Supercharger Condition Path-line under Different Load and Compressor Speed.
5. Intake System
5.1. Restrictor
According to the technical rules, the inner diameter of the intake restrictor cannot exceed 20 mm, and the shape can be designed freely. In general, the restrictor is designed as a laval nozzle (i.e., convergent diffusion nozzle), the flow rate of which is greatly affected by the diffuser angle [31]. When the cross-sectional area of the inlet and the outlet is fixed, the resistance will decrease with the diffuser angle. However, when the diffuser angle has already reduced to a certain level, the resistance of the restrictor will increase as the diffuser angle decreases because its length increases excessively. Therefore, the diffuser angle is the vital design parameter of an intake restrictor.
The CFD software (by Simscale [32]) was used to analyse the intake restrictor. The turbulence model adopts κ-ε, and Optimate Plus was chosen as the optimisation algorithm. According to the simulation results of the engine’s 1D CFD model, the restrictor inlet pressure boundary was set to 101 kPa and the outlet pressure boundary to 85 kPa. The diffuser angles were set as 5°, 6° and 7°. The CFD analysis results are shown in Table 10. When the diffuser angle was 6°, the mass flow rate of the restrictor was the highest.
Table 10.
Analysis Results of Different Diffuser Angle of Restrictor.
5.2. Small Volume Intake System
(1) Intake System after Throttle
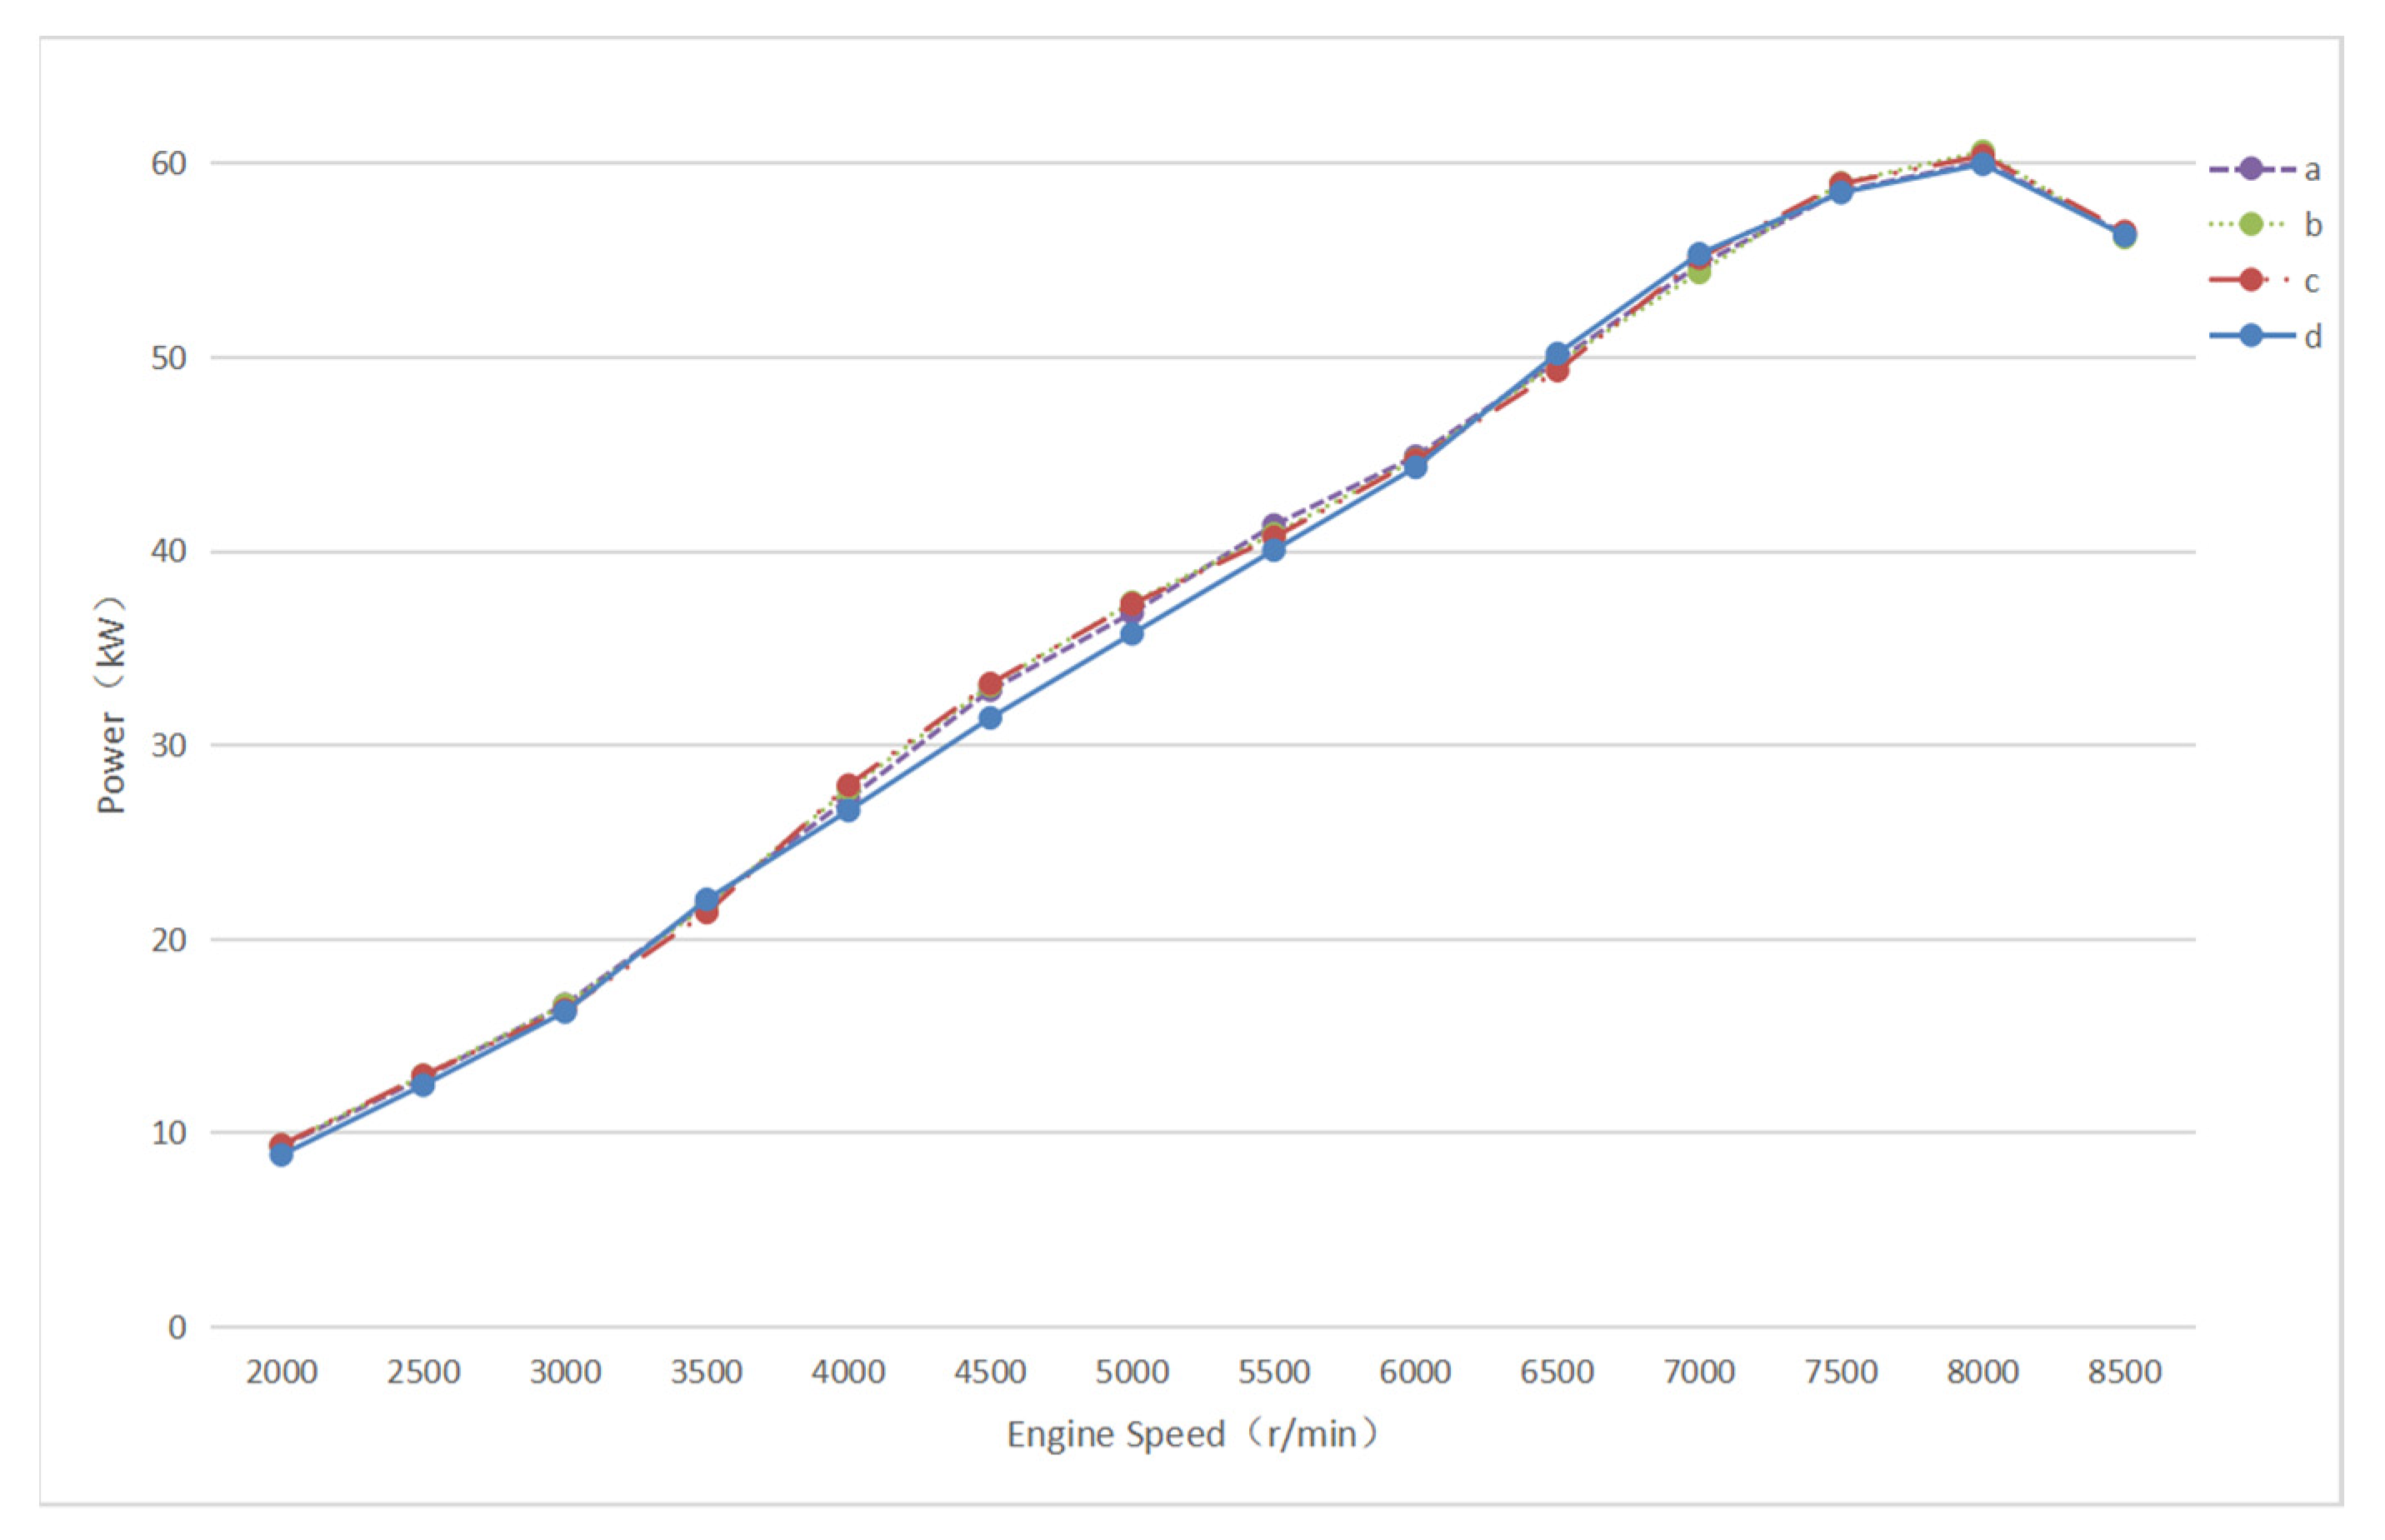
To study the influence of the intake system volume (after throttle) on engine performance, a series of 1D CFD simulations were carried out. The intake volumes after the throttle (plenum volume) were set as follows: (a) 7-L large plenum, (b) 4.5-L medium plenum, (c) 2-L small plenum and (d) non-plenum. The results are shown in Figure 29 and Figure 30 (3000 r/min, throttle tip-in).
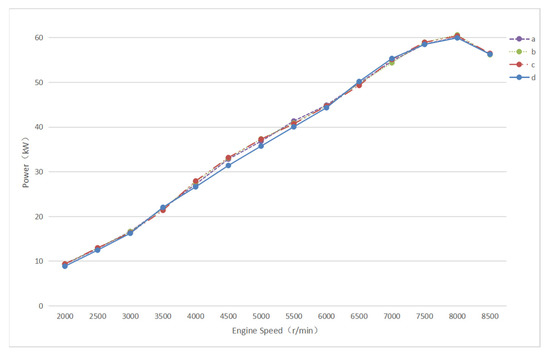
Figure 29.
Power Output of Different Volume after Throttle.
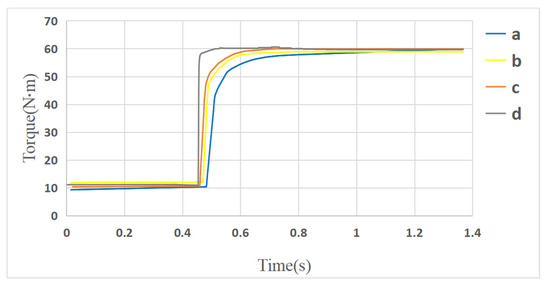
Figure 30.
Torque Response of Different Volume after Throttle (3000 r/min, Throttle Tip-in).
The results show that the power and torque of the four plans can meet the design requirements. The maximum power increased slightly with the plenum volume, but the difference was insignificant. The torque response time decreased with the plenum volume. Therefore, design (d), which would install the throttle on the cylinder head directly, was adopted to improve the response ability as much as possible.
(2) Intake System before Throttle
Then, the influence of the intake system volume (before throttle) on engine performance was studied. According to the technical rules, only an equal cross-section pipe with a diameter of no more than 60 mm can be used from the compressor outlet to the throttle. Therefore, the intake pipe length will affect the volume of the intake system before the throttle. Under the premise of what the vehicle layout allows, the pipe lengths upstream of the throttle were set as follows: (a) 300 mm, (b) 500 mm, (c) 700 mm and (d) 900 mm. The 1D CFD simulation result is shown in Figure 31. The maximum power increased with the intake volume before the throttle, but the power outputs of (c) 700 mm and (d) 900 mm were nearly the same. Finally, the (c) 700-mm design was selected.
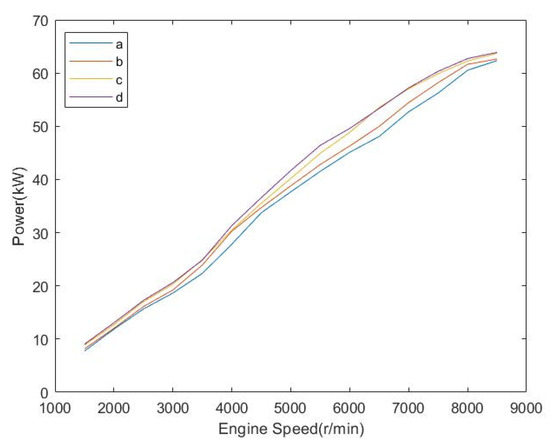
Figure 31.
Power of Different Pipe Lengths before Throttle.
5.3. Nonintercooler Design
Typically, a forced-induction engine will be equipped with an intercooler to reduce the intake air temperature after the compressor. In the technical rules of Formula Student, designers are allowed to decide whether to use the intercooler according to the actual situation. If an intercooler is used, it must be installed downstream of the throttle. To reduce the volume of the intake system after the throttle, which could be beneficial to torque response and being lightweight, a non-intercooler design is proposed.
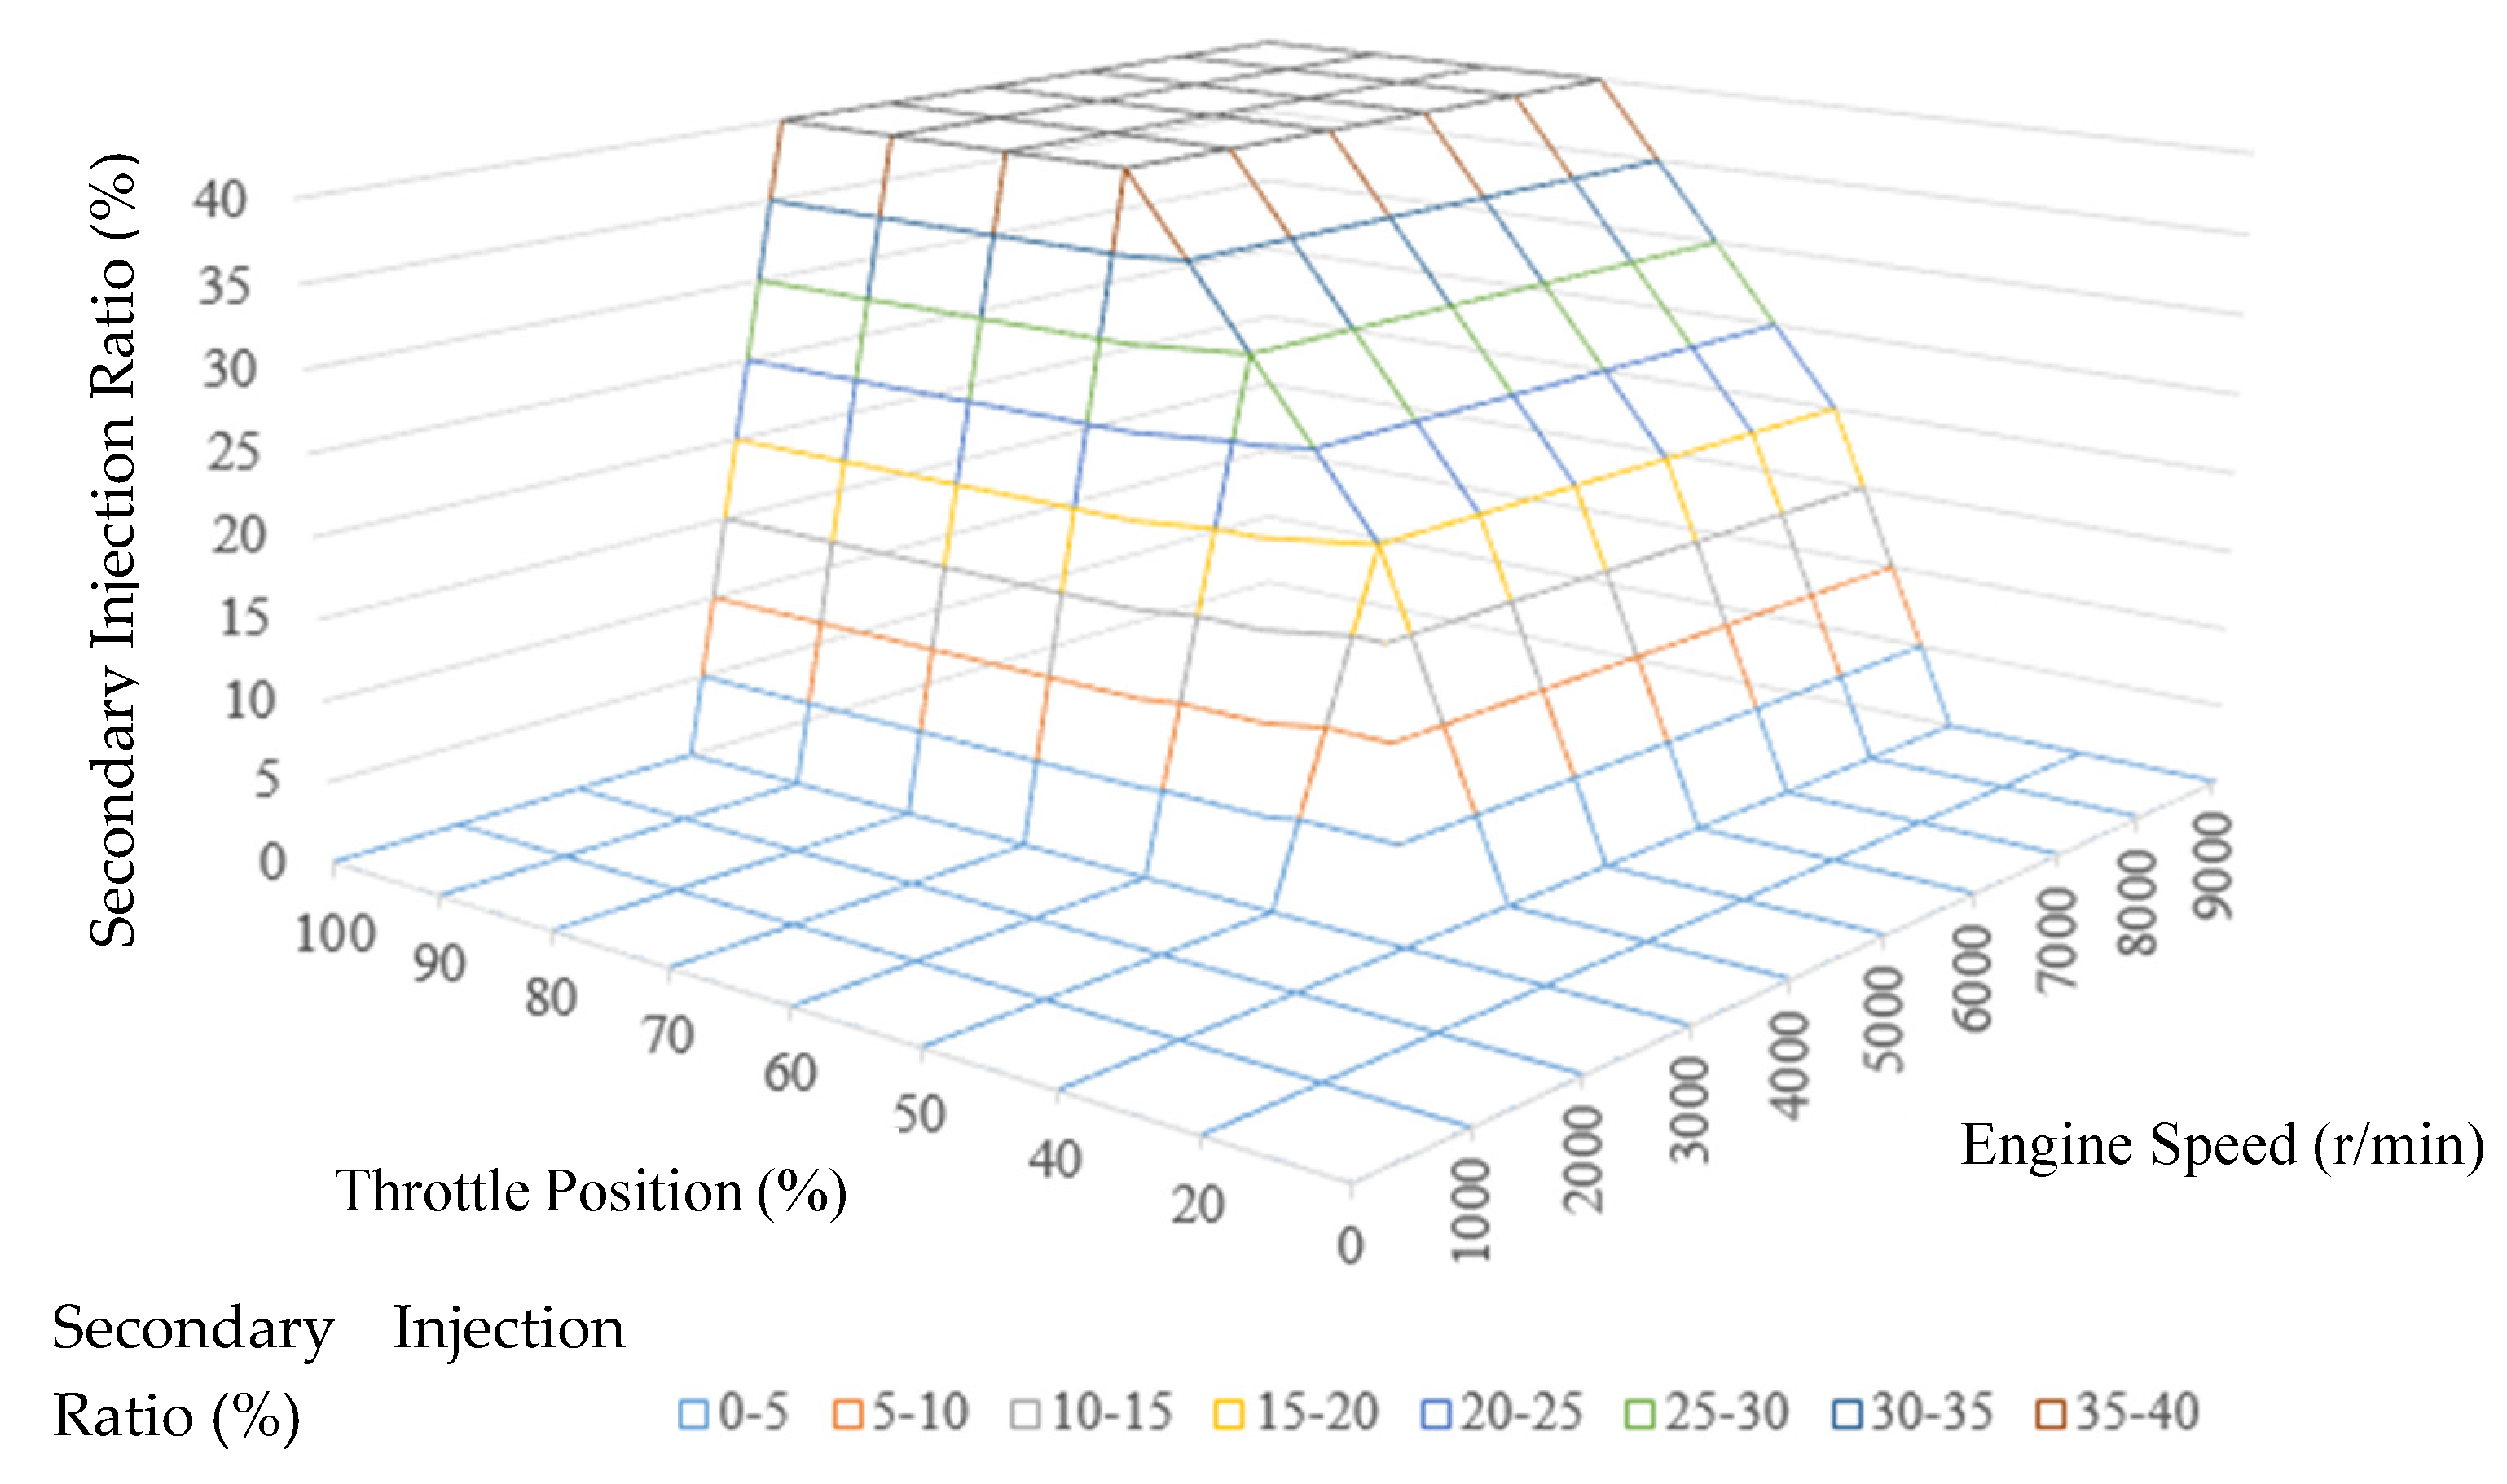
In the absence of intercooling, the following measures must be taken to reduce the intake air temperature. Firstly, the primary and secondary fuel injectors are respectively set up downstream and upstream of the throttle. The fuel flow of the secondary injector (throttle upstream) increases gradually with the engine speed and load, which could reduce the intake air temperature through fuel vaporisation. The fuel proportion of the secondary injector is shown in Figure 32. In addition, the intake pipe is also provided with cooling fins. The final design of the intake system is shown in Figure 33.
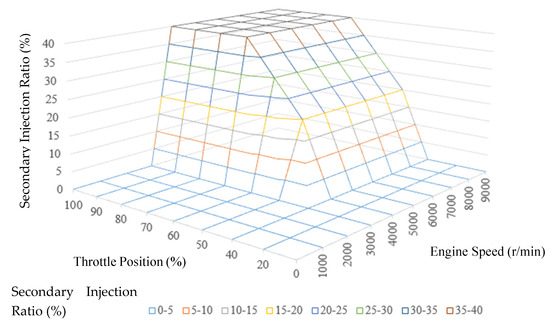
Figure 32.
Injection Ratio of Secondary Fuel Injector.
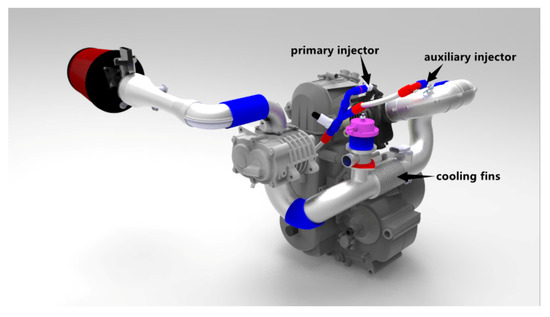
Figure 33.
Final Design of Intake System.
6. Exhaust System
6.1. Exhaust Layout
When measured at 45° and 500 mm from the exhaust outlet, the noise should not exceed either 103 dB (C) at idle or 110 dB (C) at the rated speed (5500 r/min for KTM690). Compared with the commonly used A-weighted sound level, the C-weighted sound level required by the rules weights the low-frequency range higher [33]. The basic frequency of the exhaust noise of single-cylinder engines is rather low [34]. Thus, a motorcycle-used resistance muffler cannot quite meet the silence requirement. Therefore, the exhaust system in this work adopted a resistance–reactance combined design in which an expansion chamber and a main muffler are arranged in series.
The main muffler is mainly used to eliminate mid-high frequency noise. The initial structure is shown in Figure 34. The muffler’s cross-section has a diameter of 130 mm. The first chamber is 200 mm in length, and the second chamber is 150 mm. Its interior is provided with a punching tube and a glass fibre cloth with a thickness of 10 mm.
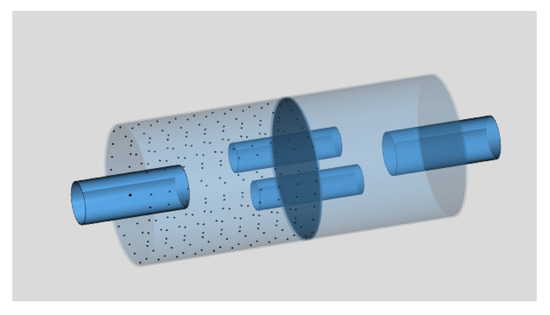
Figure 34.
Initial Structure of Main Muffler.
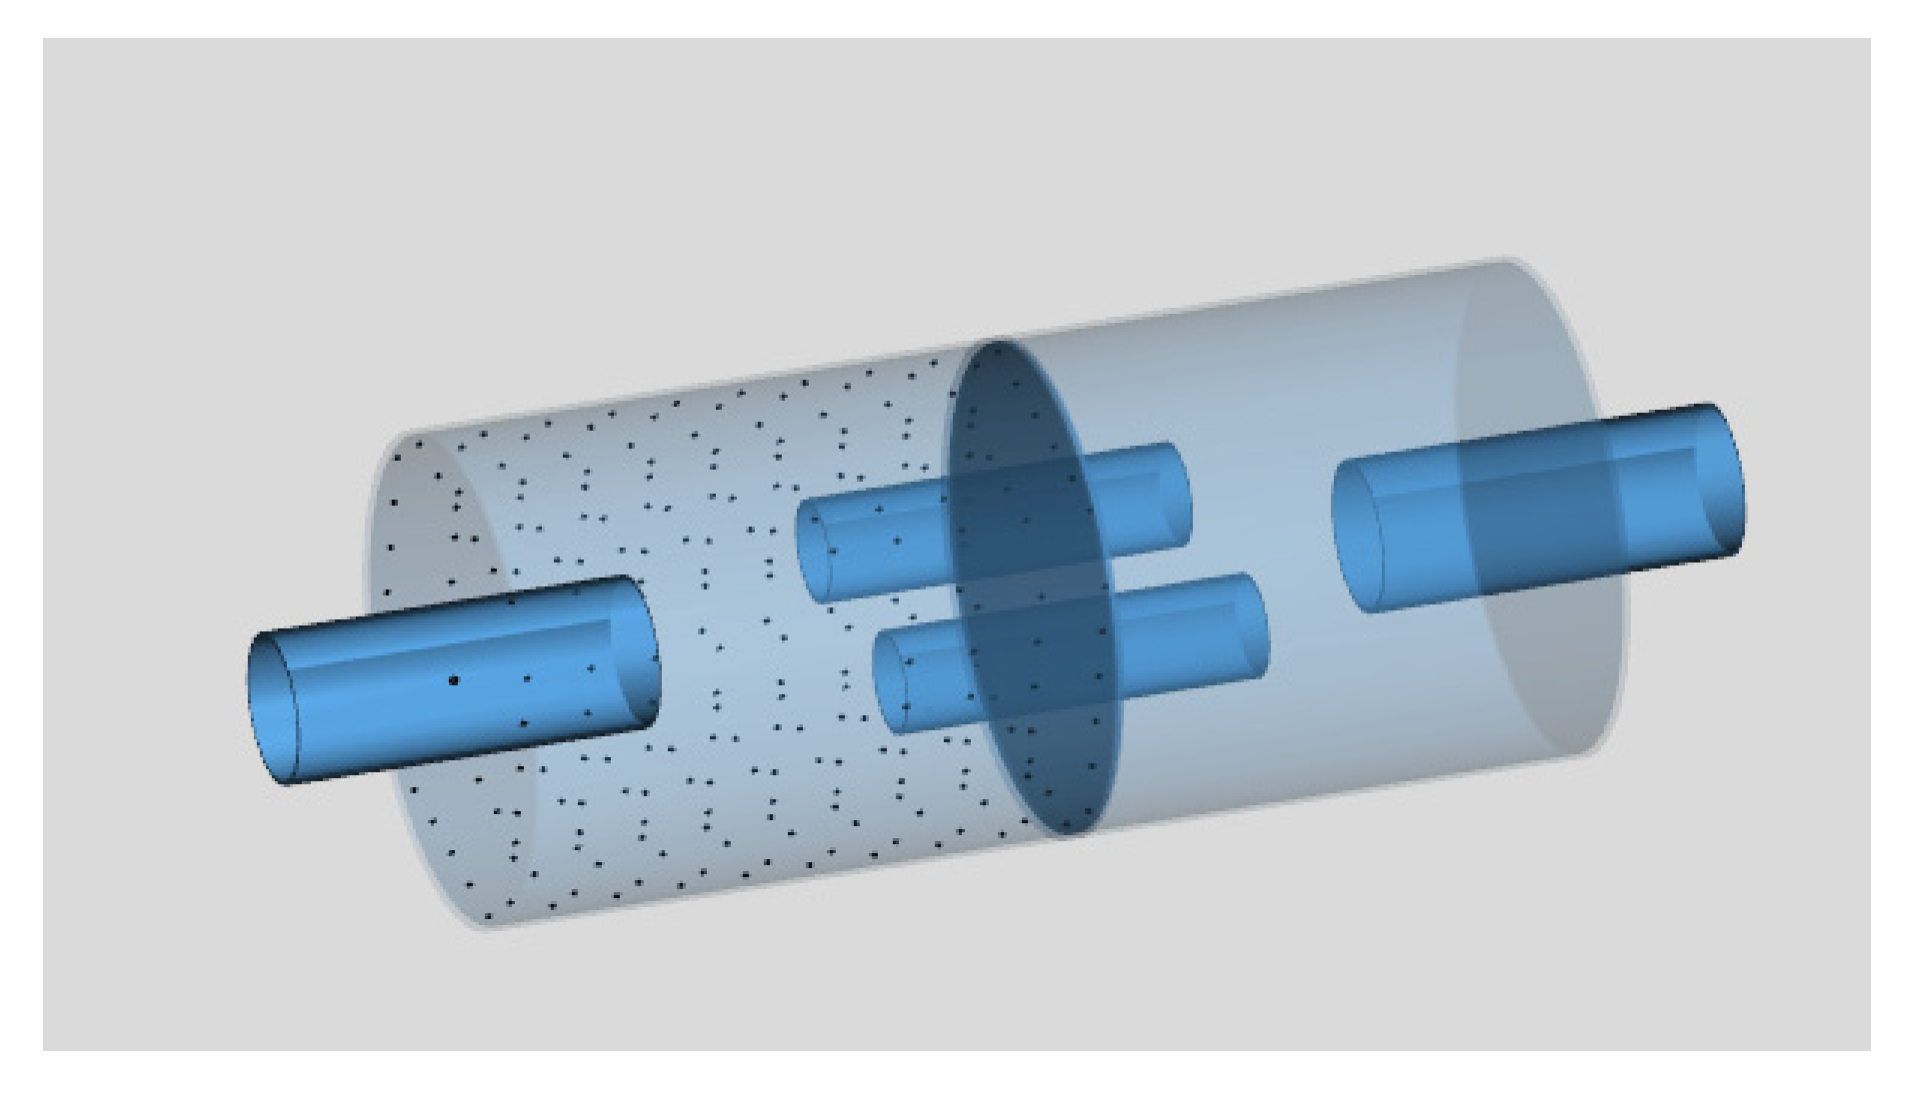
The expansion chamber is mainly used to eliminate mid-low frequency noise. The initial structure is shown in Figure 35. Its cross-section has a diameter of 160 mm and a length of 180 mm. The diameter of the inlet and outlet pipe is 45 mm.
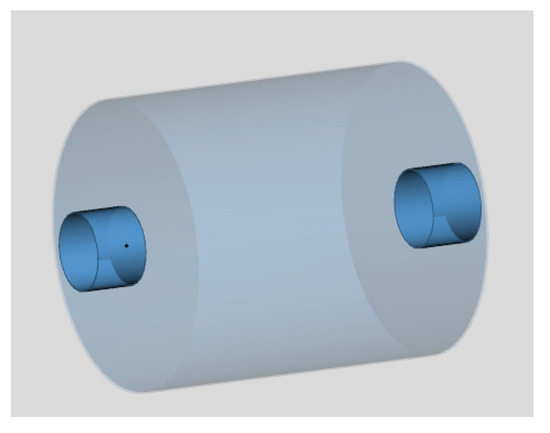
Figure 35.
Initial Structure of Expansion Chamber.
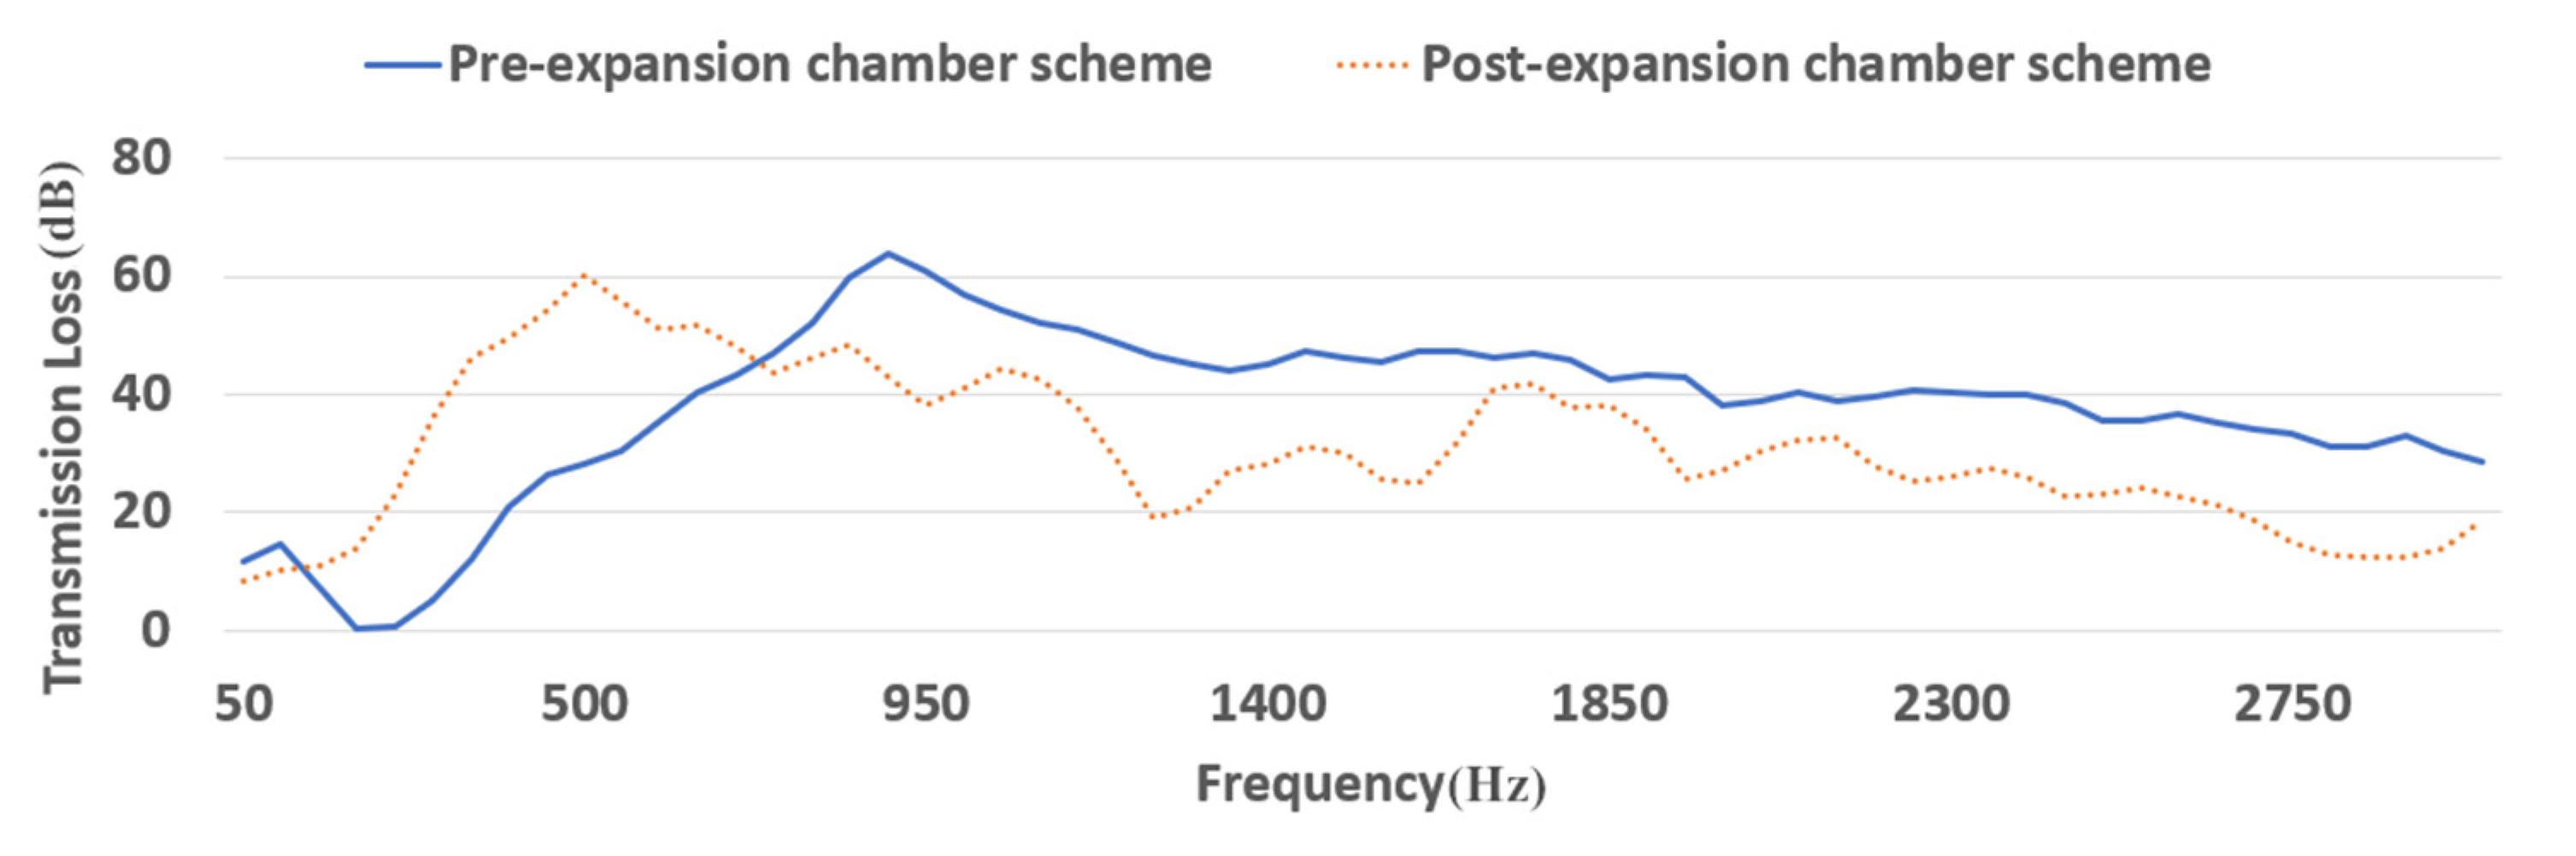
The 1D CFD model was used to simulate the expansion chamber and the main muffler sequence. The noise of the post-expansion chamber scheme was 100.9 dB (idle), 111.3 dB (5500 r/min), which does not meet the design requirements. The noise of the pre-expansion chamber scheme was 98.8 dB (idle speed), 107.0 dB (5500 r/min), which satisfies the requirements.
The noise transmission loss curve was analysed (Figure 36). The transmission loss of the pre-expansion chamber scheme after 700 Hz was higher than that of the post-expansion chamber scheme. Meanwhile, the transmission loss curve presents a peak at 95 Hz when the expansion chamber was pre-phased which corresponds to the frequency. The second-order exhaust frequency at 5500 r/min on a single-cylinder engine exhibited better noise reduction. Therefore, the pre-expansion chamber scheme was selected, and the expansion chamber was arranged upstream of the main muffler.
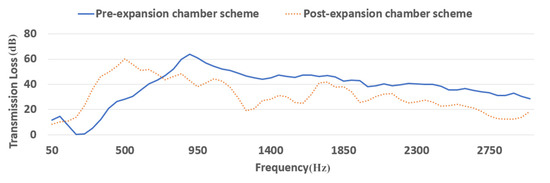
Figure 36.
Transmission Loss of Different Sequence of Expansion Chamber and Main Muffler.
6.2. Expansion Chamber
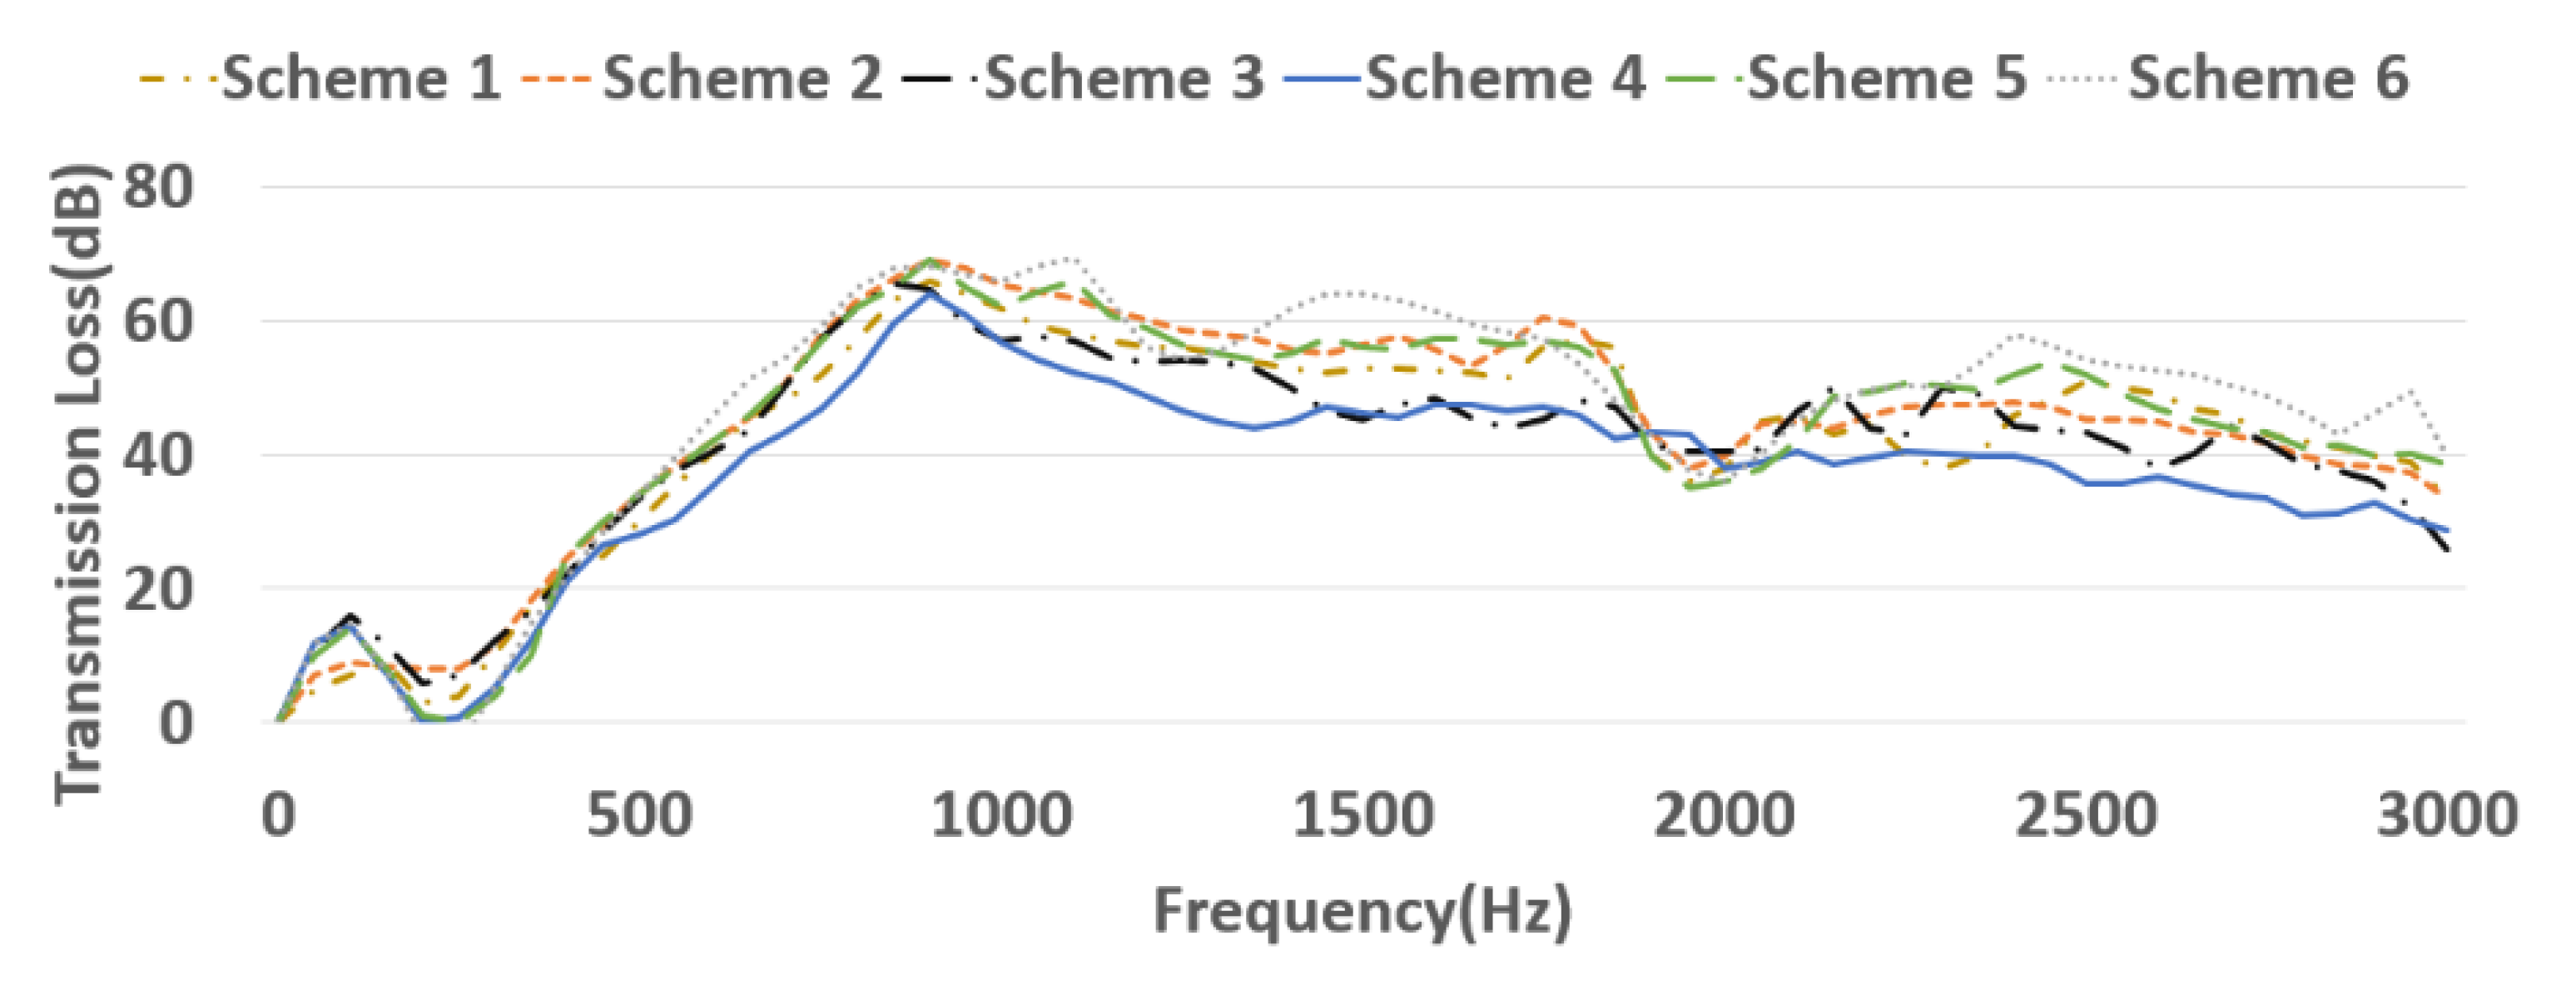
Let the volumes of the expansion chamber be 2.8 L (D = 160 mm, L = 140 mm), 3.6 L (D = 160 mm, L = 180 mm) and 4.4 L (D = 160 mm, 200 mm), with each volume considering the ‘inlet and outlet on the same side’ and ‘inlet and outlet on the opposite side’ design. After the 1D CFD simulation, the noise level and the maximum power are shown in Table 11, and the noise transmission losses of the various schemes are shown in Figure 37. (Scheme 1~6 are different structural design schemes. Each corresponds to a combination of volume and layout.)
Table 11.
Noise level and Maximum Power of Different Expansion Chamber Scheme.
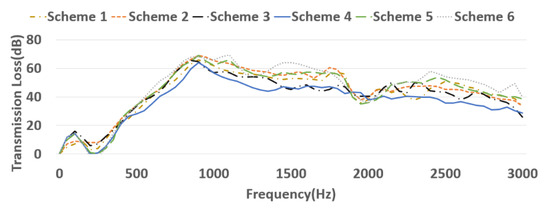
Figure 37.
Noise Transmission Loss of Different Schemes.
The results show the following:
- As the volume of the expansion chamber increases, the noise decreases.
- A 3.6-L expansion chamber is superior to a 2.8-L expansion chamber in the range of 50–150 Hz which covers the second-order frequency of the exhaust noise.
- At a frequency higher than 400 Hz, the mute effect of the 4.4-L scheme is better than that of the 3-L scheme.
- The inlet and the outlet are located on the same or opposite side and thus have little influence on the noise and can even be ignored.
In summary, considering the noise level, performance and vehicle layout, a 3.6-L expansion chamber design was selected with the inlet and the outlet on the same side.
6.3. Main Muffler
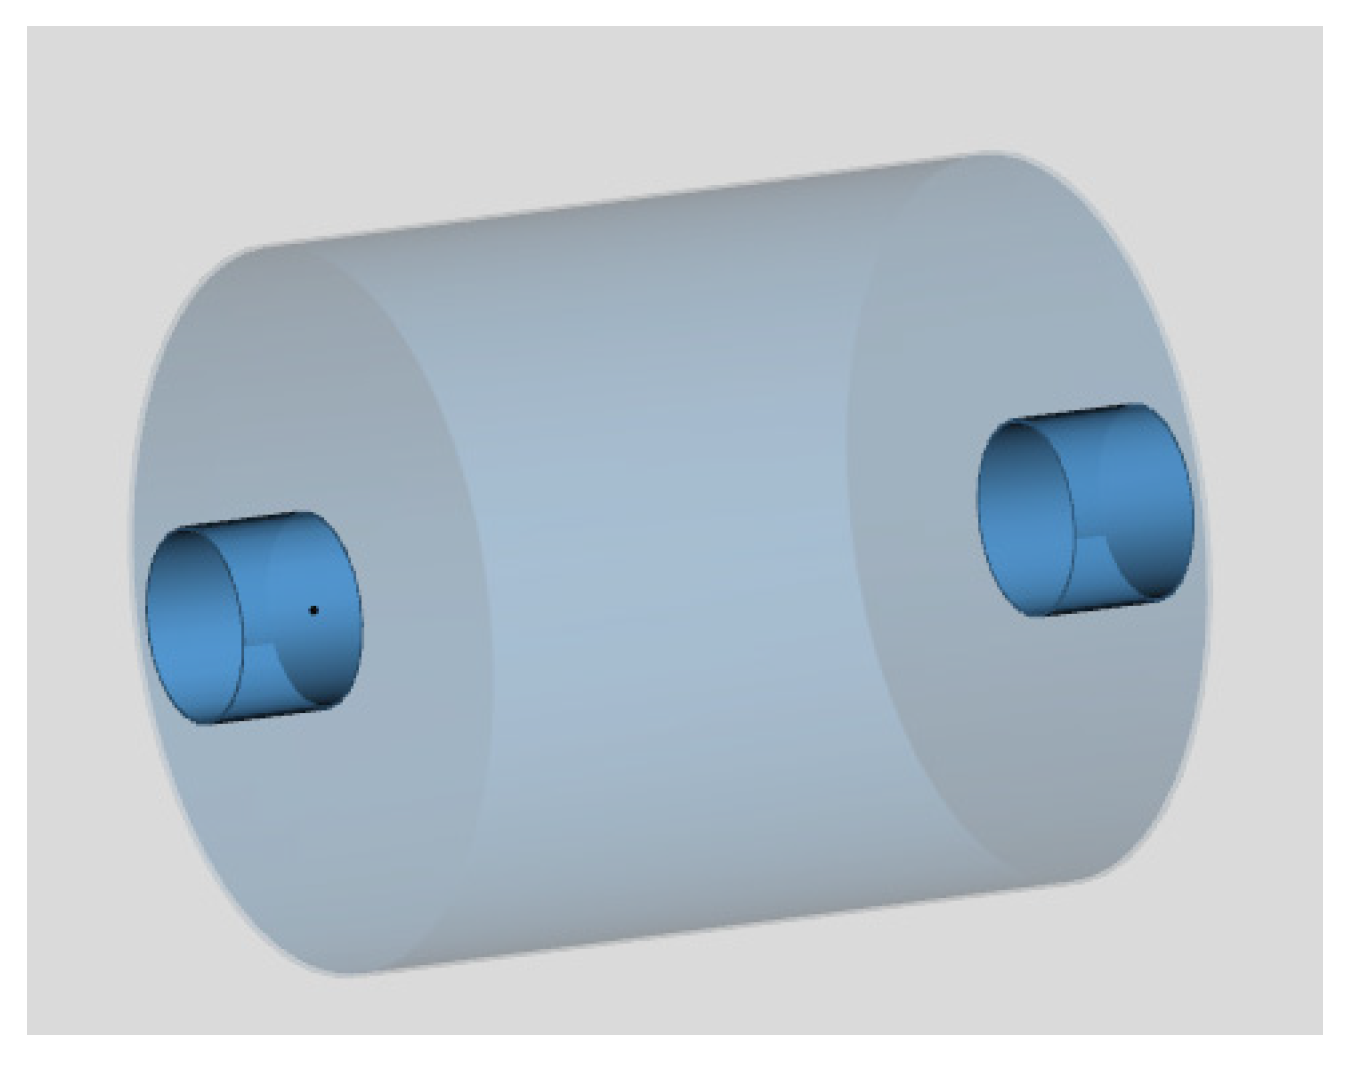
The main muffler is a ‘resistance–reactance’ combined muffler system that includes both expansion and contraction reactance structures and a resistance muffler material, such as glass-fibre. To further improve the mute effect of the mid-low frequency, the outlet pipe was extended to the first chamber based on the original dual-chamber design, and the outlet pipe was perforated on the wall surface in the second chamber. In this way, we try to use the interference principle of sound waves to denoise while increasing the total flow area and reducing the exhaust pressure. The structure of the main muffler is shown in Figure 38.
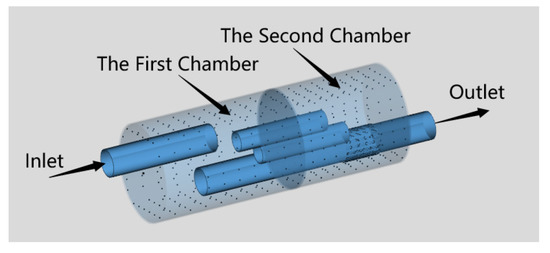
Figure 38.
Schematic Diagram of Main Muffler Structure Optimisation.
The length of the outlet tube inserted into first chamber was set to 50–120 mm. The 1D CFD simulation results are shown in Table 12. The results show that the noise level gradually decreased as the length of the insertion tube increased, but the power also decreased. When the insertion length exceeded 100 mm, the outlet pipe overlapped the inlet pipe, and the power loss was particularly obvious.
Table 12.
Noise Level and Maximum Power of Different Outlet Insertion Length.
The structural scheme, noise level and power of each design step are summarised in Figure 39. The final design of the exhaust system is shown in Figure 40:
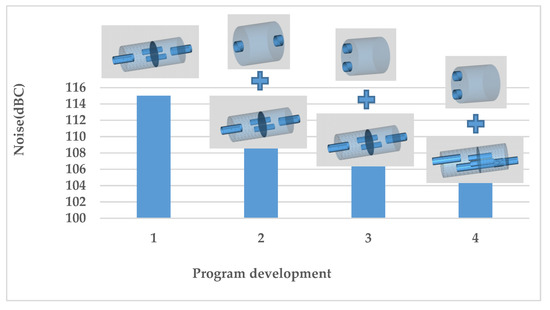
Figure 39.
Evolution of the Exhaust System Design.
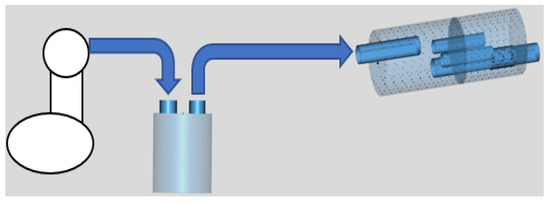
Figure 40.
Final Structure Diagram of the Exhaust System.
- A 3.6-L expansion chamber is installed upstream in the exhaust system, and the inlet and outlet tubes are arranged on the same side.
- A dual-chamber main muffler is installed downstream in the exhaust system, and the outlet pipe is inserted into the first chamber by 70 mm.
- The outlet tube in the second chamber is perforated.
- The inner wall of the main muffler is attached with glass-fibre.
7. Testing Verification
7.1. Engine Bench Test
7.1.1. Performance Test
The engine performance test bench described above was used to test the performance of the developed engine. The power, torque and BSFC at full load are shown in Figure 41.

Figure 41.
Performance of the Developed Engine (Full Load).
The test results show that the maximum power was 60 kW (7500–8000 r/min), and the maximum torque was 82 Nm (2500–6500 r/min). The BSFC at full load was less than 300 g/kWh, and the minimum BSFC could be 265 g/kWh. The high torque range (>90% max torque) was from 2000 r/min to 7500 r/min, which corresponds to 65% of the maximum engine speed. The dry weight of the engine assembly was 54.5 kg. The above indicators achieved the design goals.
7.1.2. Response Test
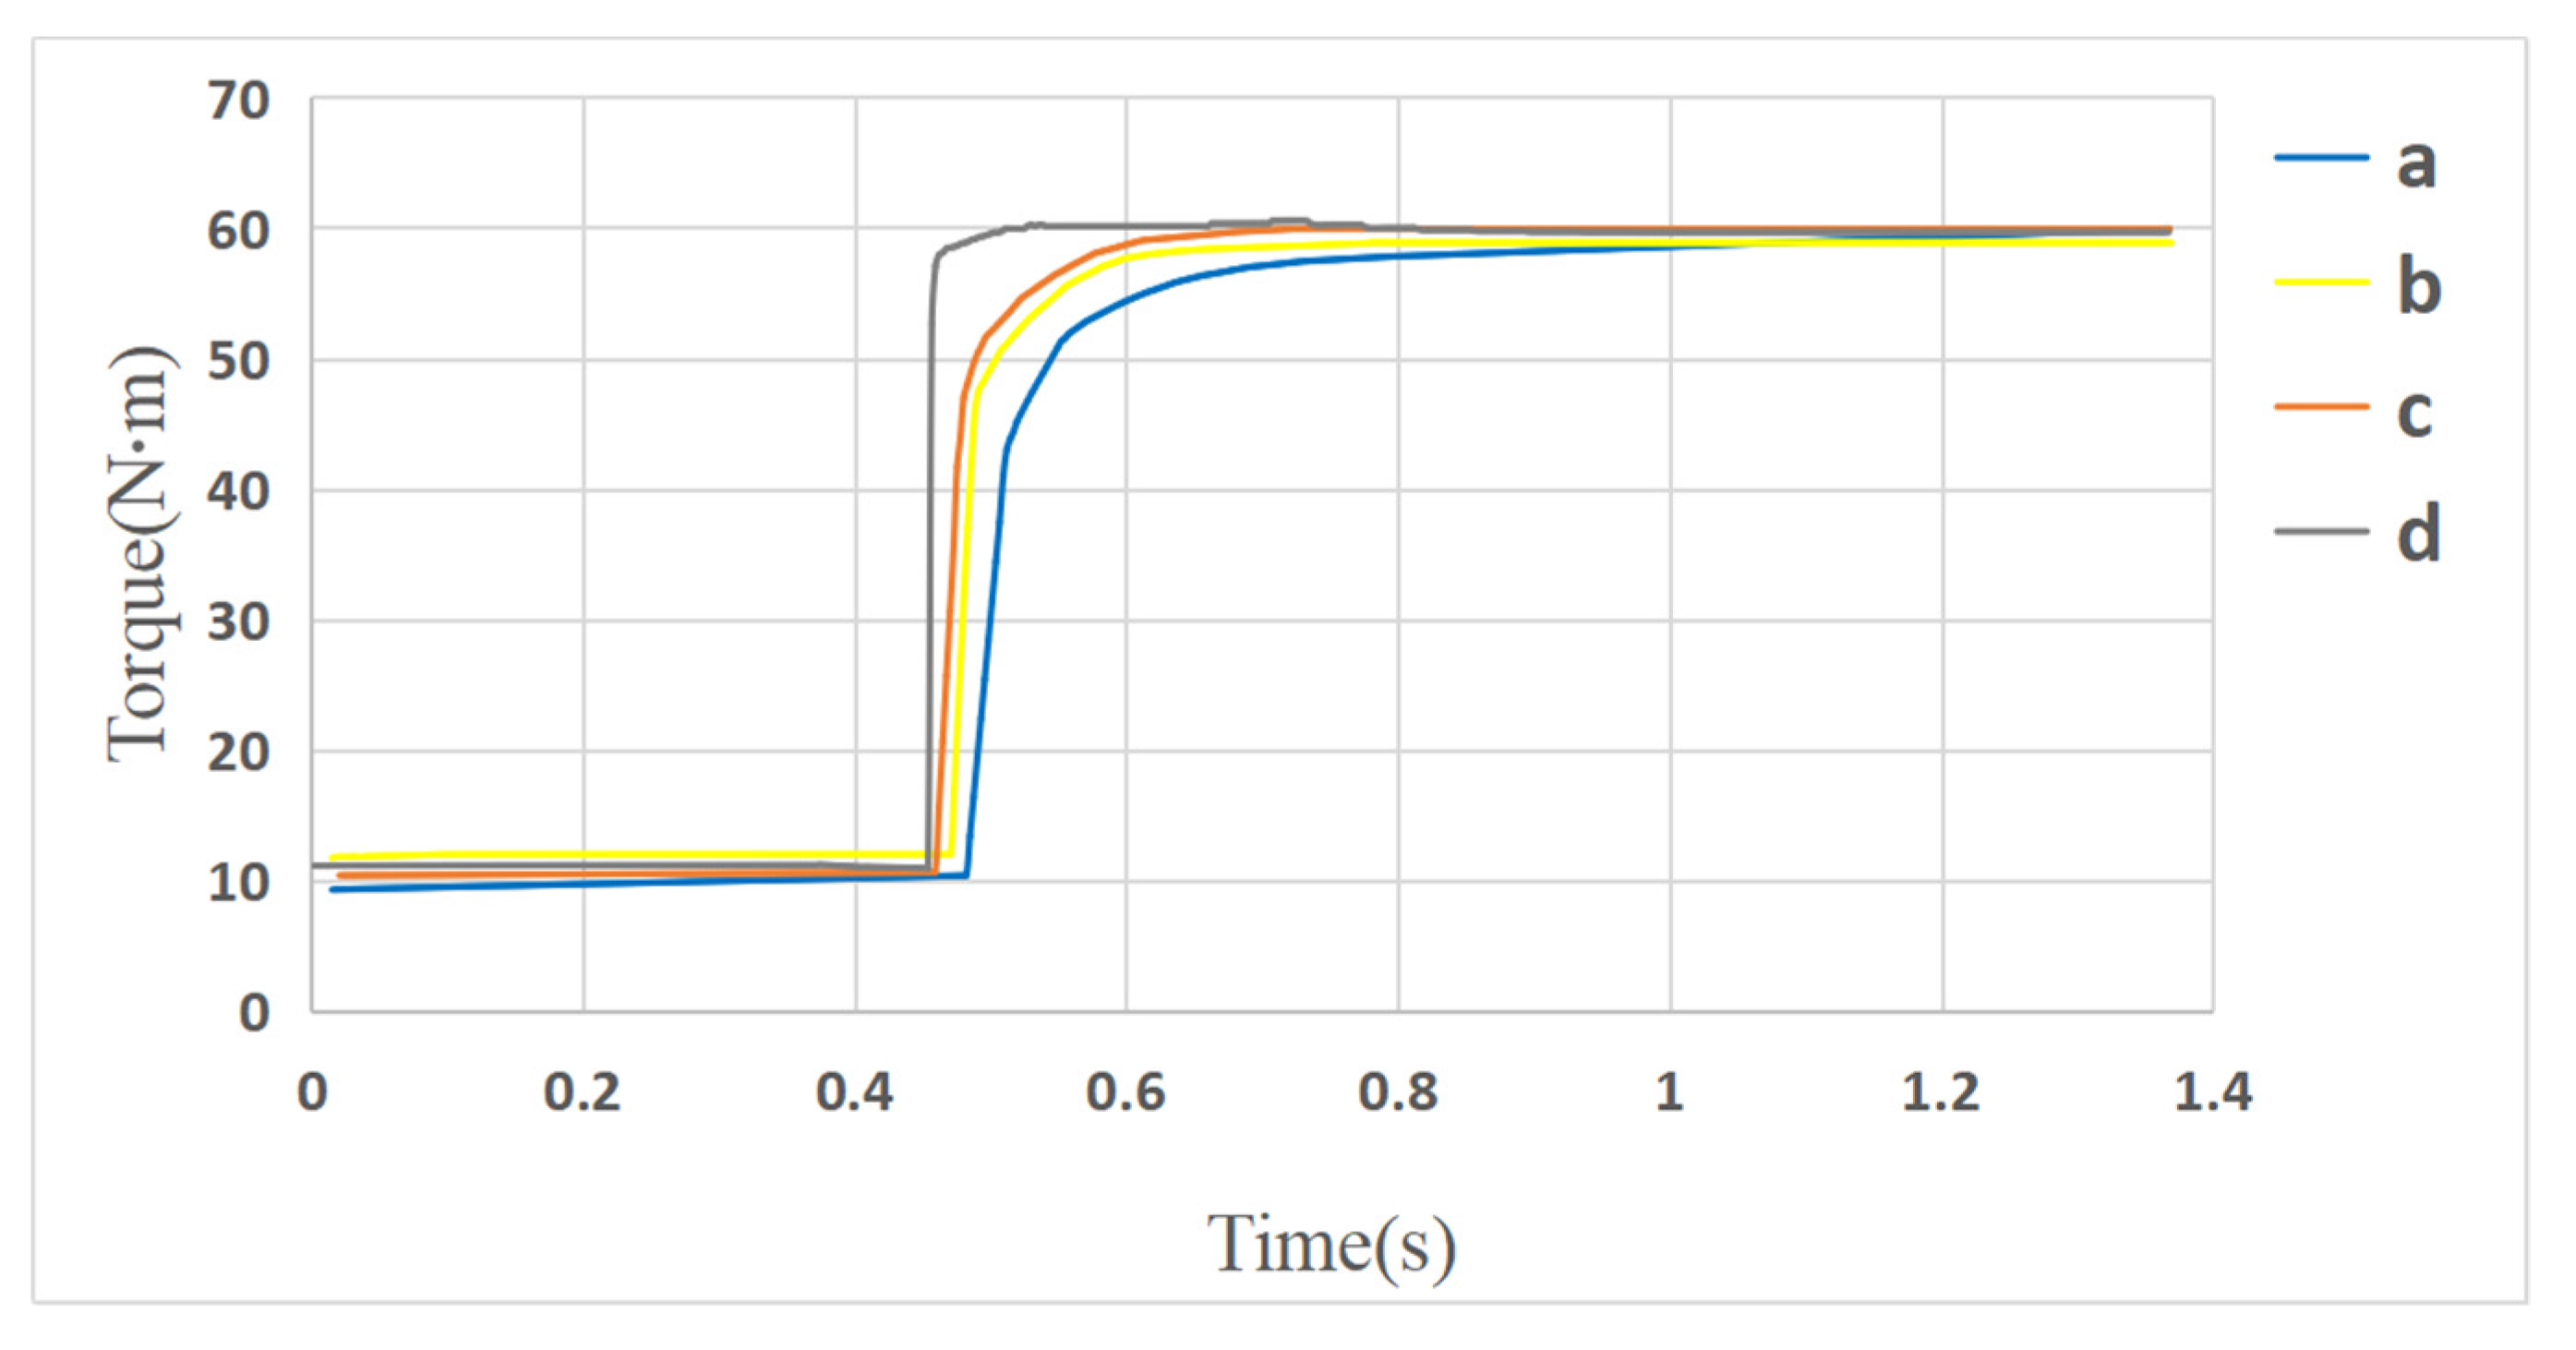
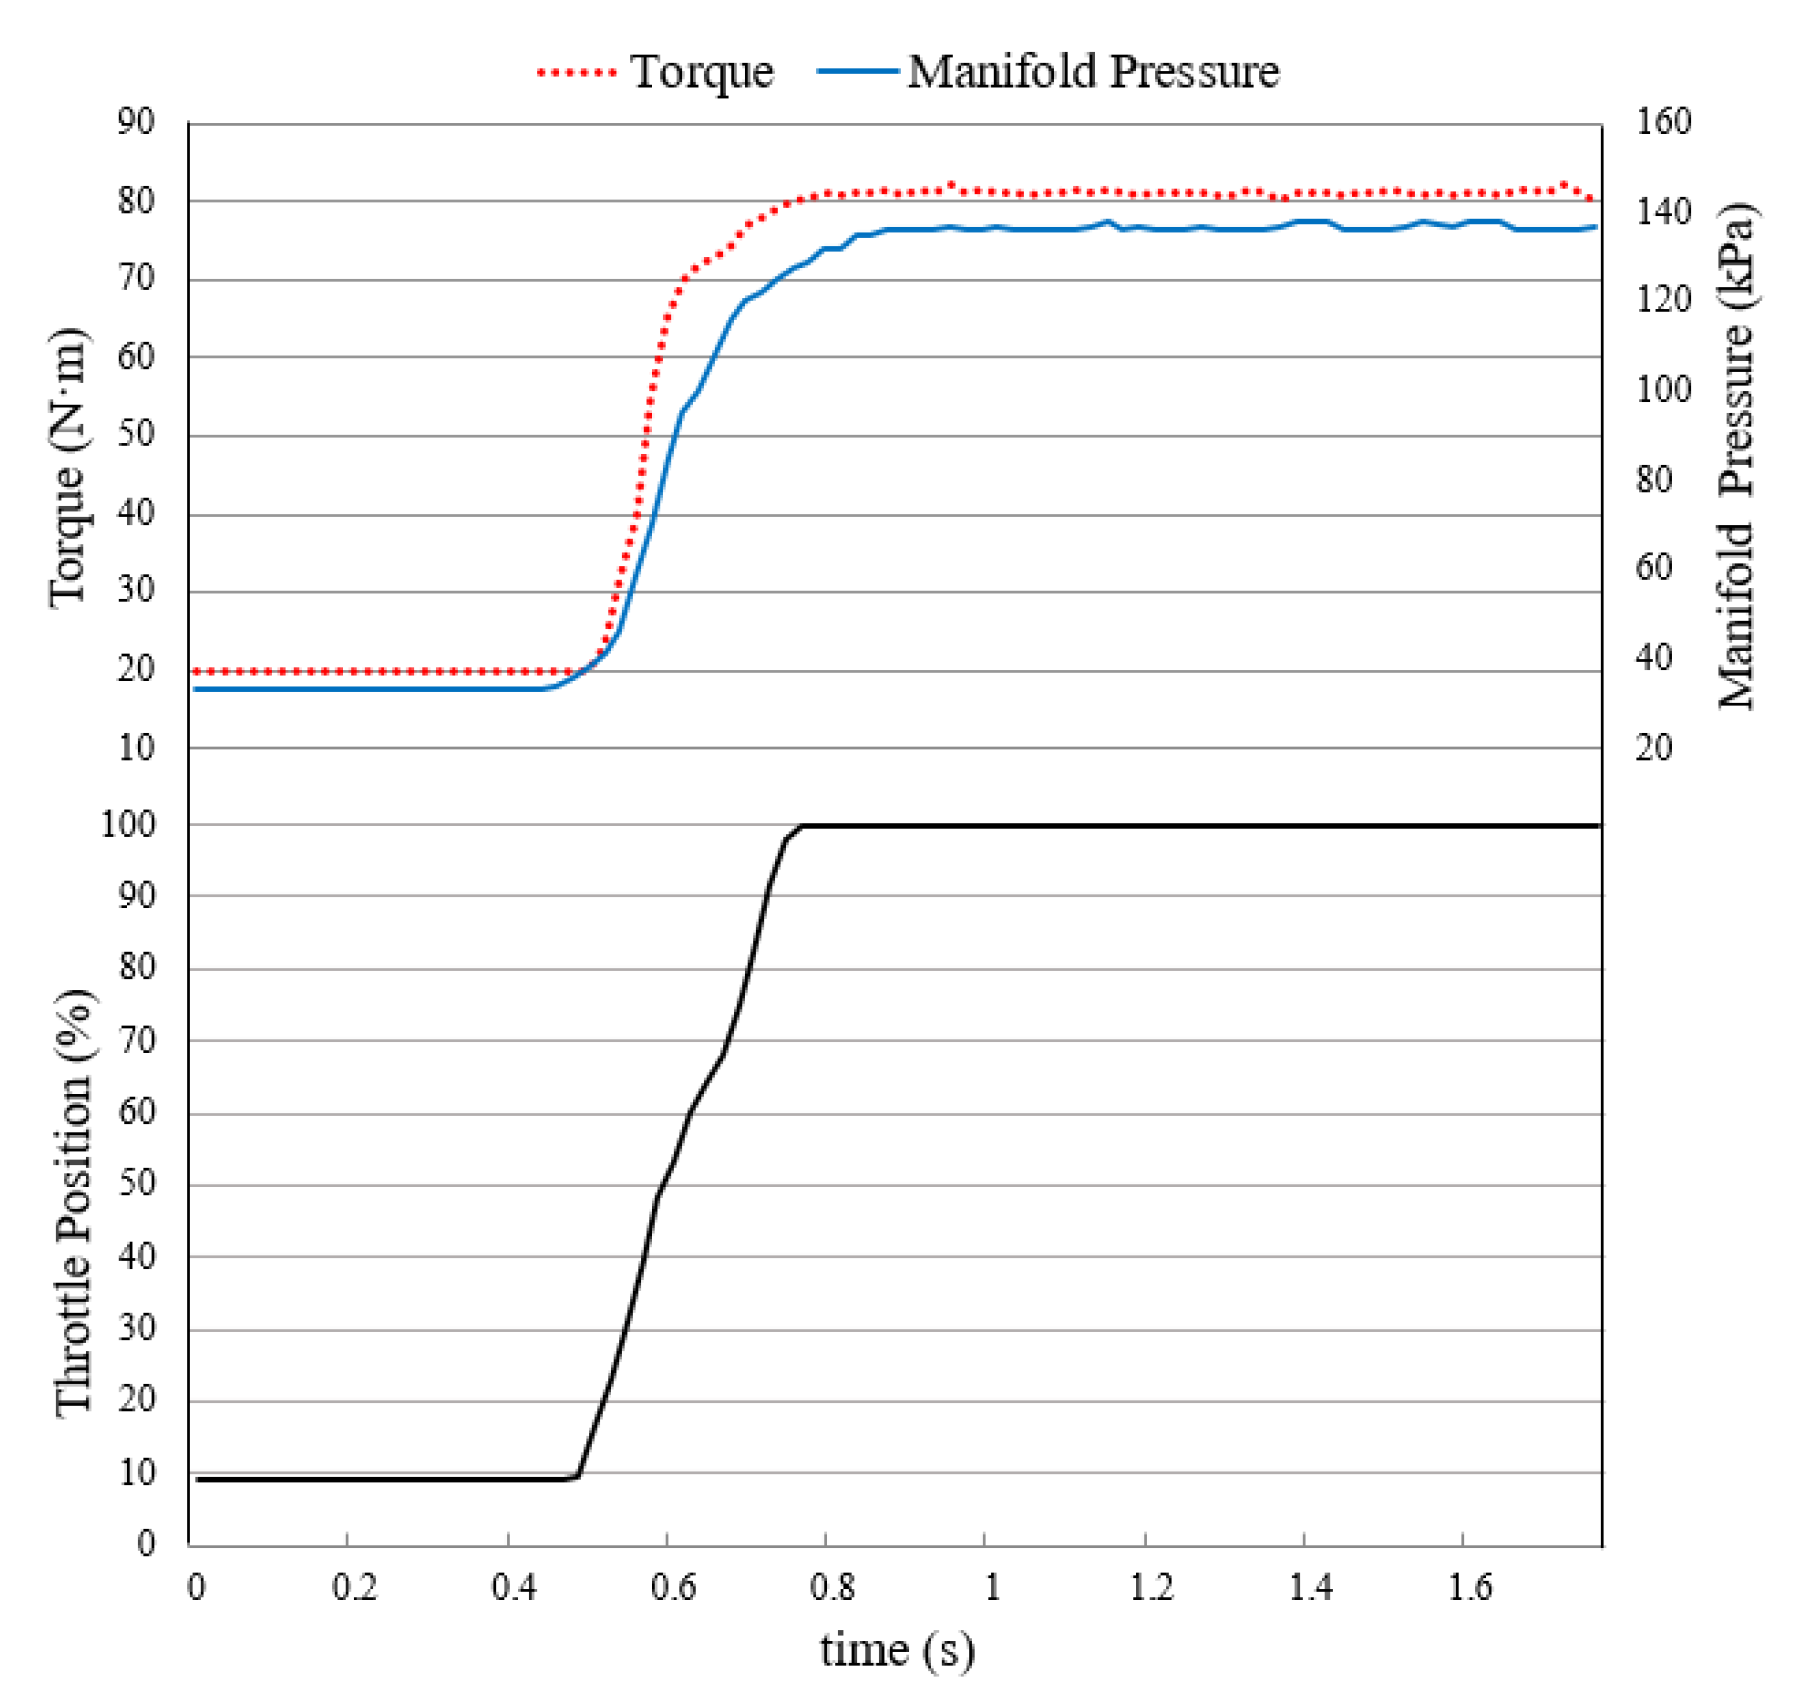
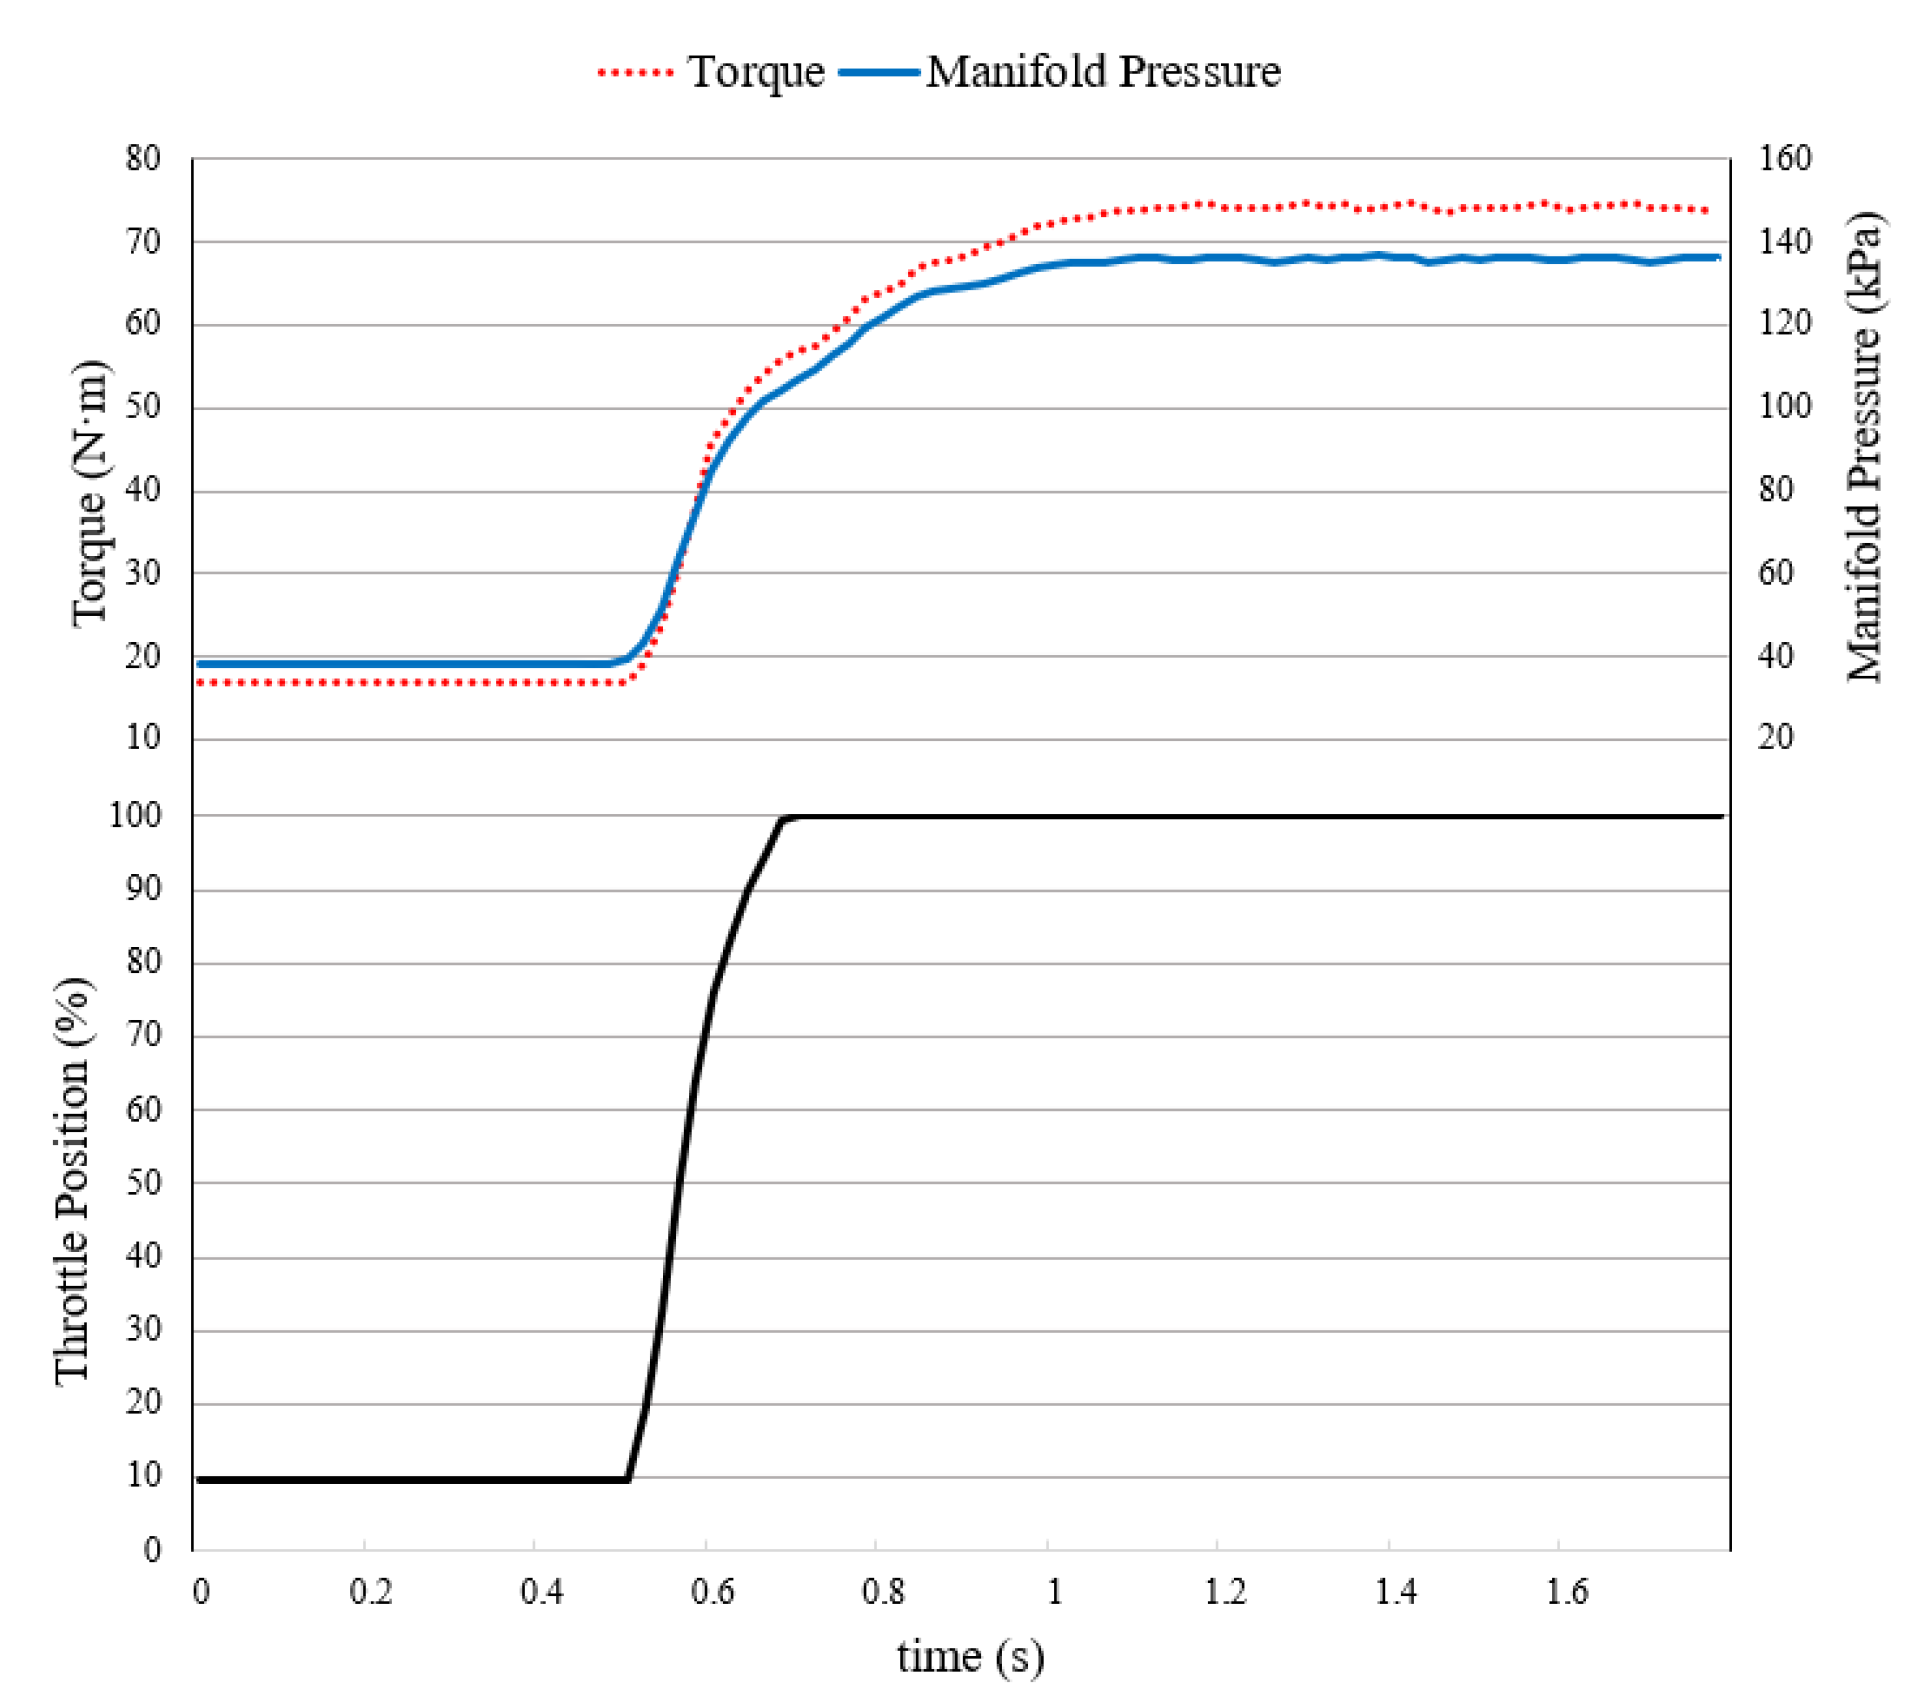
To evaluate the torque response capability of the engine under typical cases, a torque response test was performed and the results were compared with those of the previous generation engine (600-mL turbocharged four-cylinder engine).
The output torque and the intake manifold pressure at 40% of the maximum engine speed (the 690-mL single-cylinder engine corresponds to 3500 r/min, and the 600-mL four-cylinder engine corresponds to 5000 r/min) and throttle from 10% to 100% throttle tip-in are shown in Figure 42 and Figure 43. The results show that the torque response time of the new-generation engine was less than 0.2 s when it reached 90% of the maximum torque, i.e., nearly 80% shorter than that of the previous-generation engine, achieving the design goal.
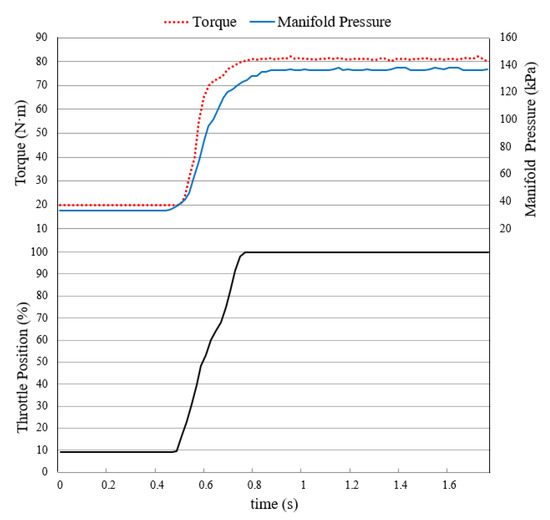
Figure 42.
Torque Response Curve under Tip-in Throttle Input (690mL Supercharged Engine).
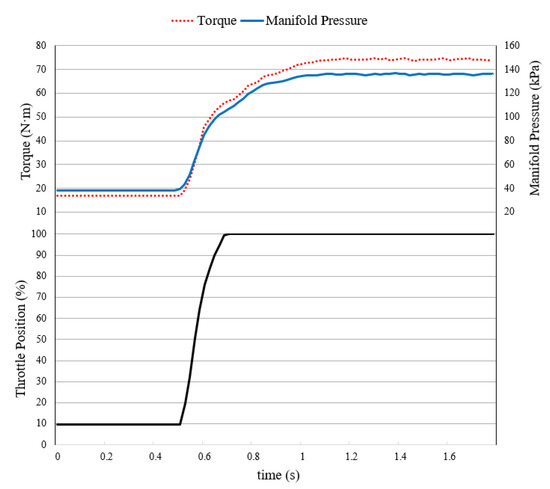
Figure 43.
Torque Response Curve under Tip-in Throttle Input (600mL Turbocharged Engine).
7.1.3. Intake Temperature Test
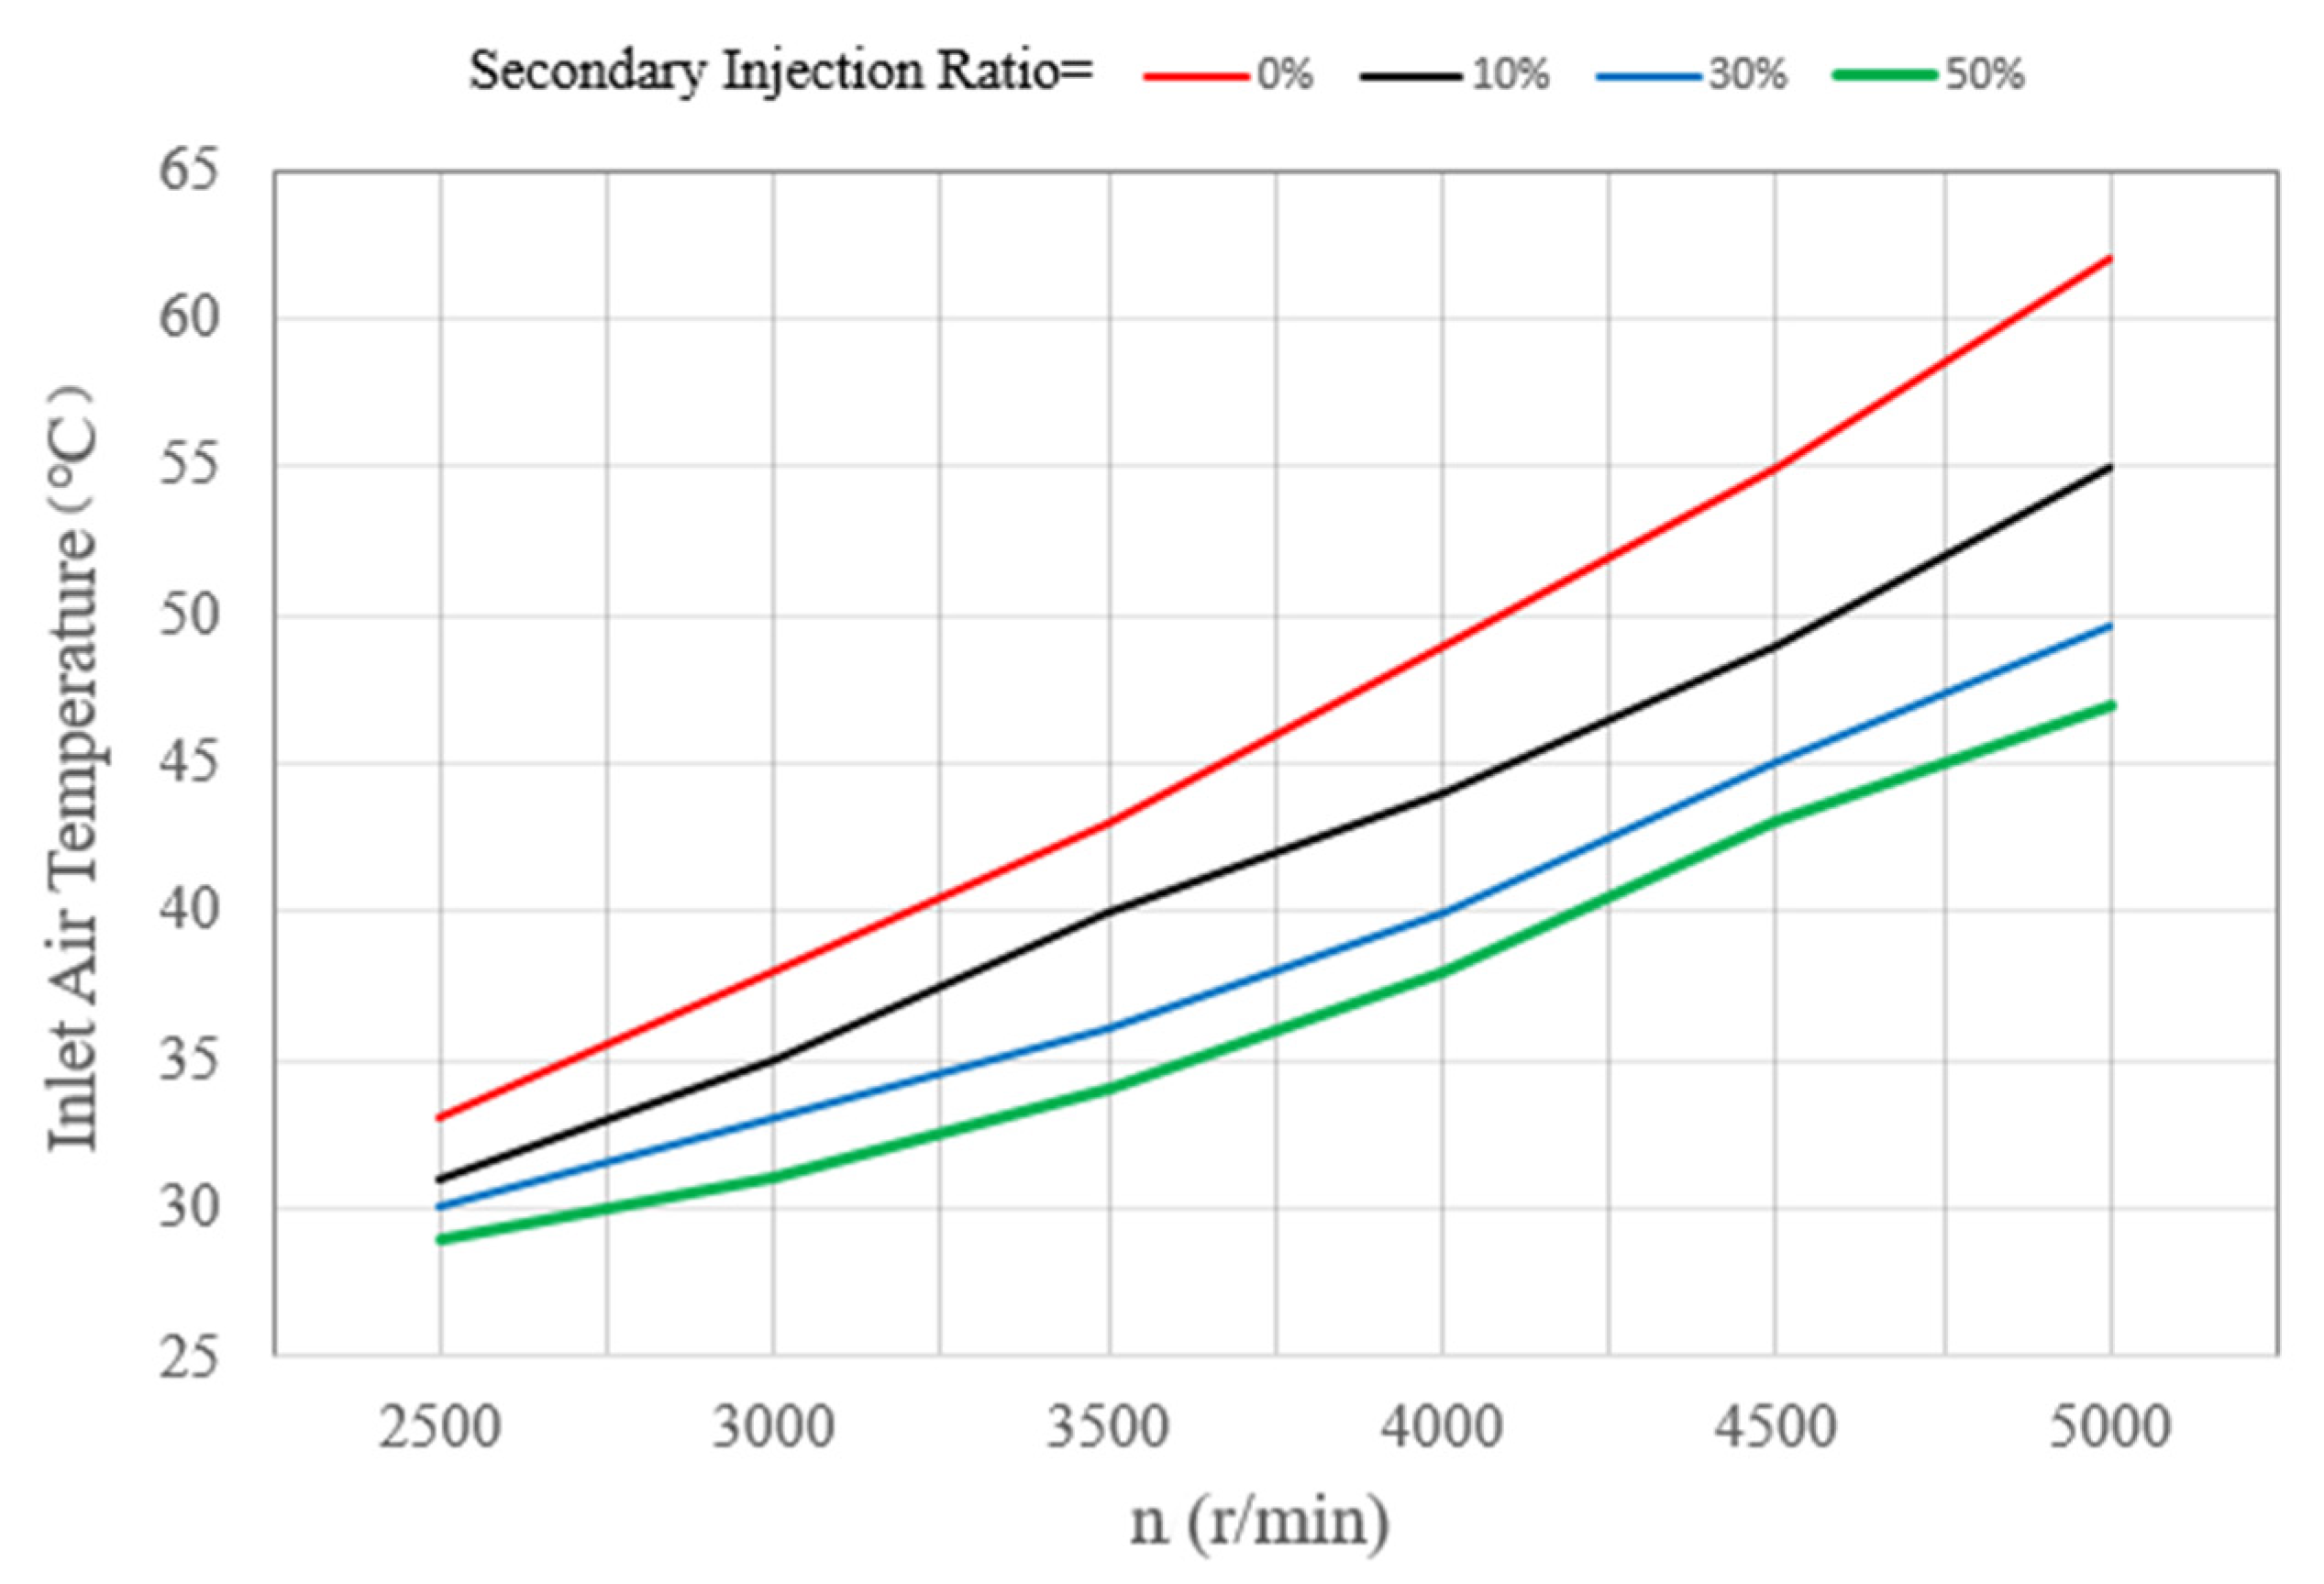
To verify the influence of dual fuel injection on the intake air temperature, 2500–5000 r/min at full load was selected for a comparative test as shown in Figure 44. The results show that, as the secondary injection ratio increased, the intake air temperature decreased; when the secondary injection ratio exceeded 30%, the intake air temperature under full load could be reduced to approximately 50 °C. The cooling effect is more ideal.
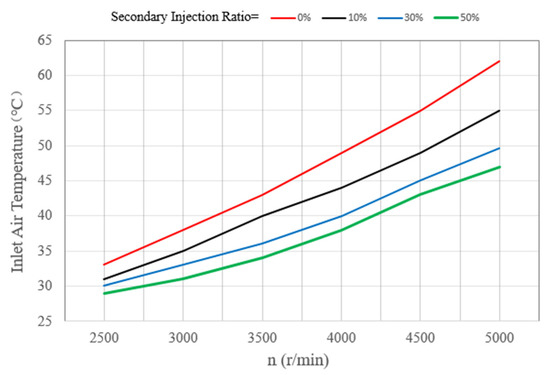
Figure 44.
Intake Air Temperature of Different Secondary Injection Ratio at Full Load.
7.2. Vehicle Road Test
7.2.1. Acceleration
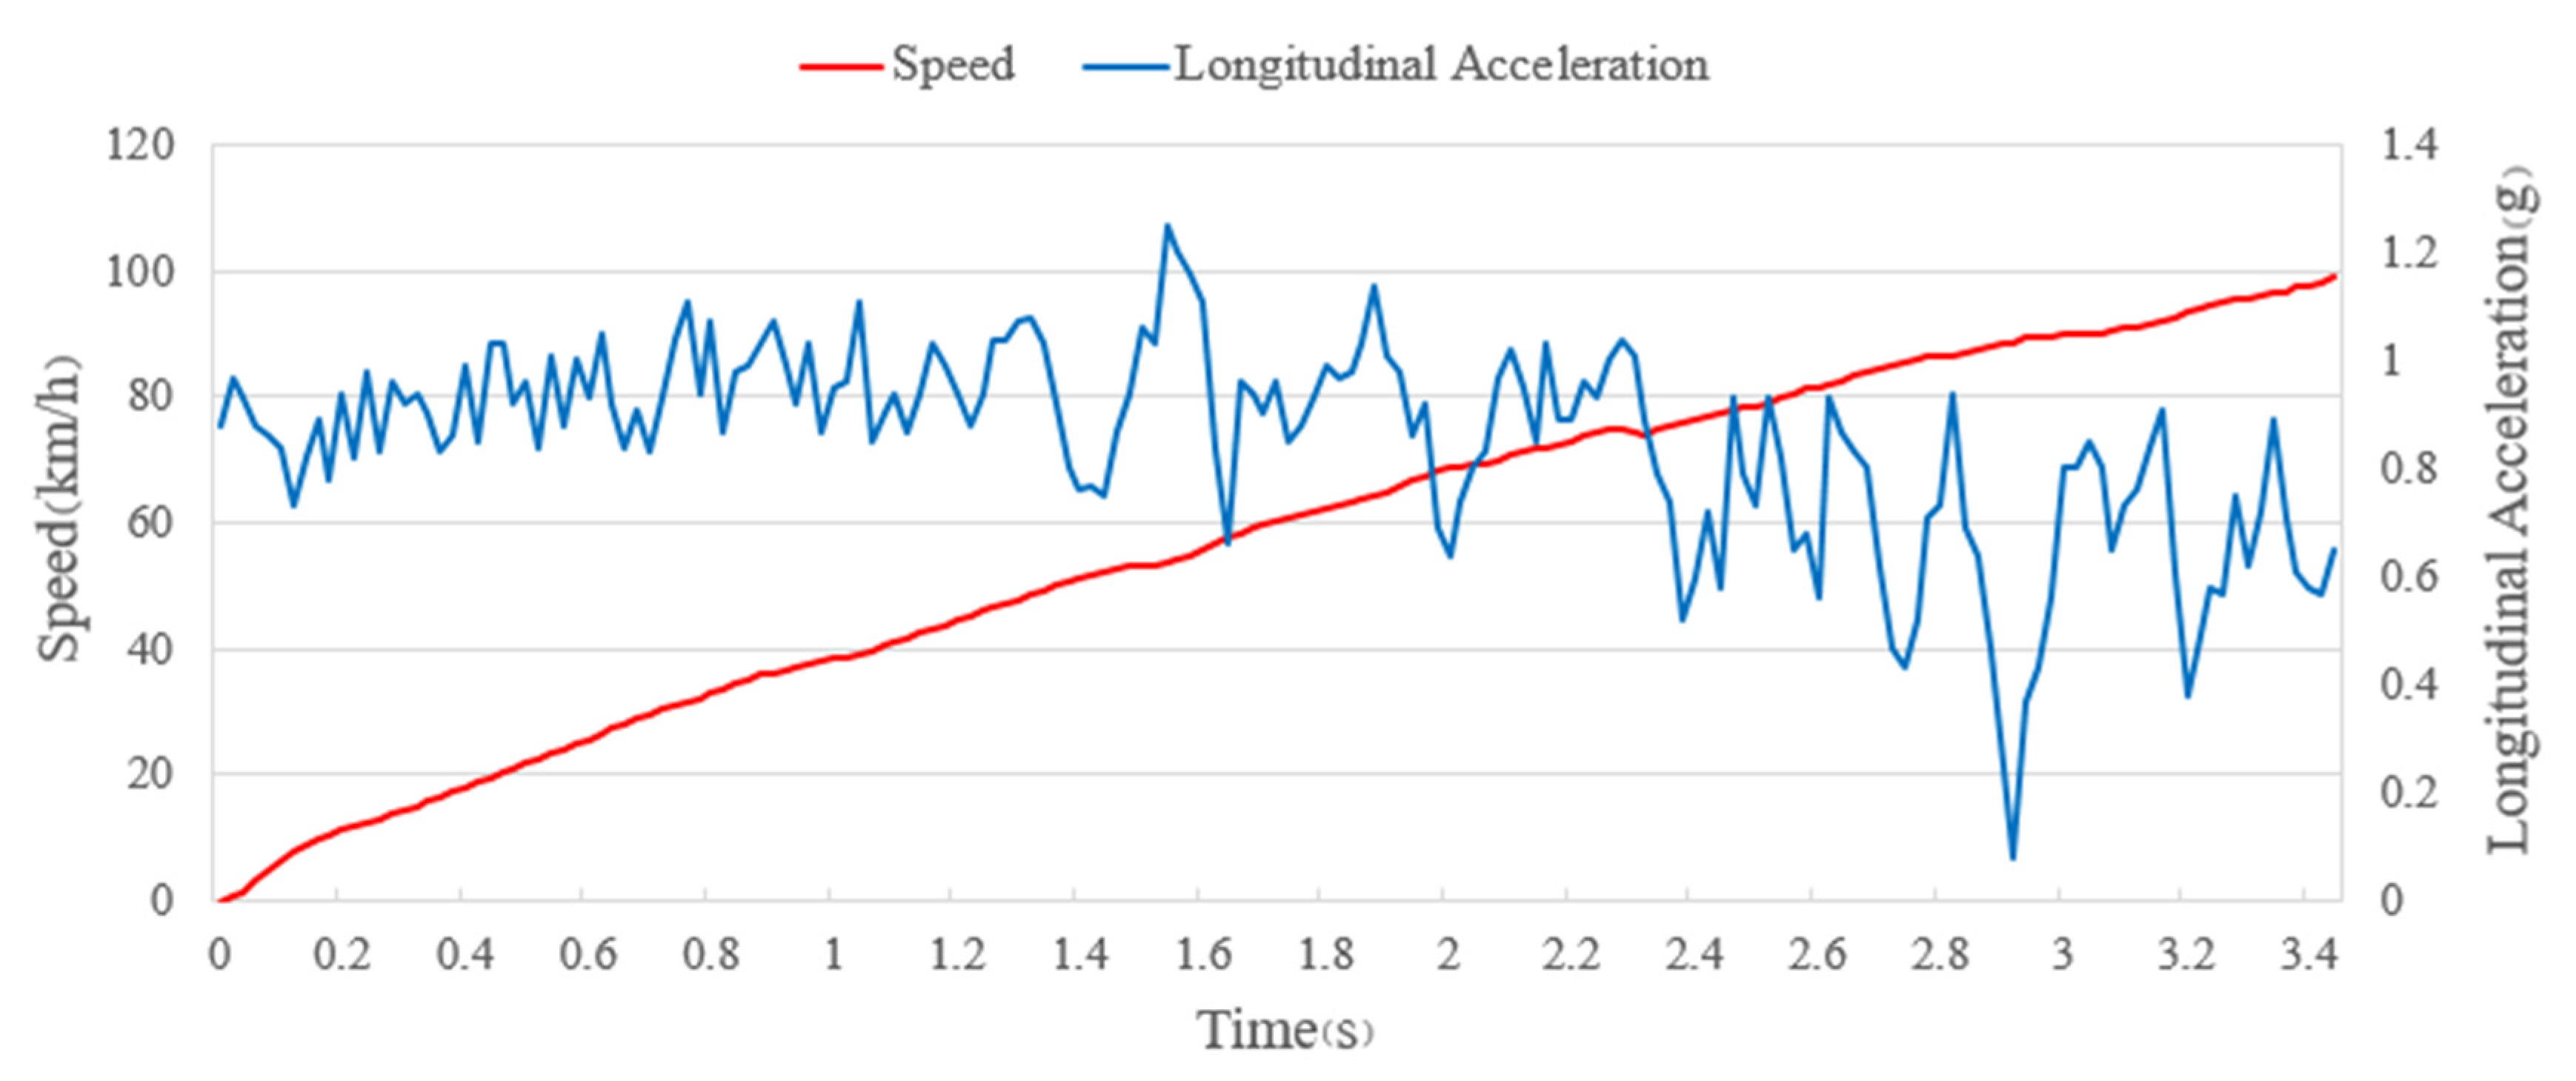
A racecar with the developed engine was tested on a dry, horizontal and well-adhered asphalt surface. The speed and acceleration curves are shown in Figure 45. The racing car equipped with a new generation engine has a maximum longitudinal acceleration of approximately 1.1 G and an acceleration time of 0–100 km/h for 3.5 s, which is 0.2 s shorter than the previous generation.
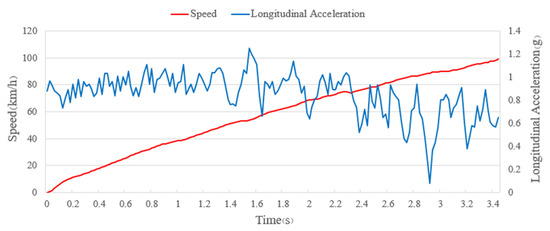
Figure 45.
Speed and Longitudinal Acceleration in an Acceleration Test.
In Formula Student China 2018, the racecar equipped with the new engine won the third place with an acceleration time of 4.19 s for 75 m in the acceleration event. In Formula Student Germany 2019, the same racecar won the second place with a time of 4.02 s (Figure 46). This is the first single-cylinder engine racecar to win TOP3 in the acceleration event in the history of the two competetions.
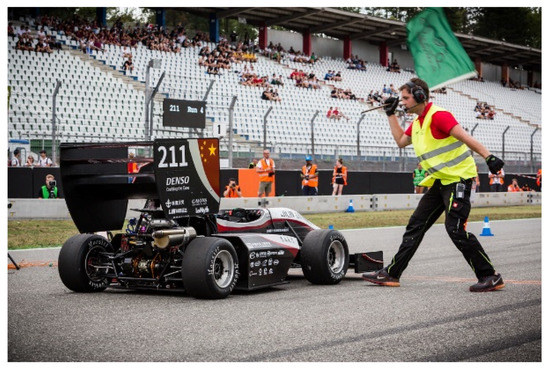
Figure 46.
Gspeed Racecar in Acceleration Event of FSG 2019.
7.2.2. Noise
The exhaust noise test was performed according to the technical rules, as shown in Figure 47. The noise of the engine during cold start was 97.5 dB (C) at idle and 108.6 dB (C) at 5500 r/min. The idle noise after warm-up was 98.1 dB (C) and 108.0 dB (C) at 5500 r/min. All satisfies the requirements of the technical rules.
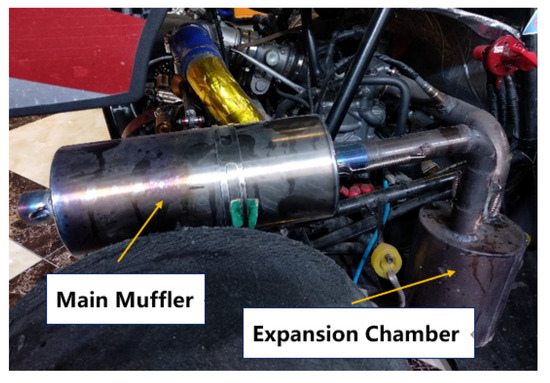
Figure 47.
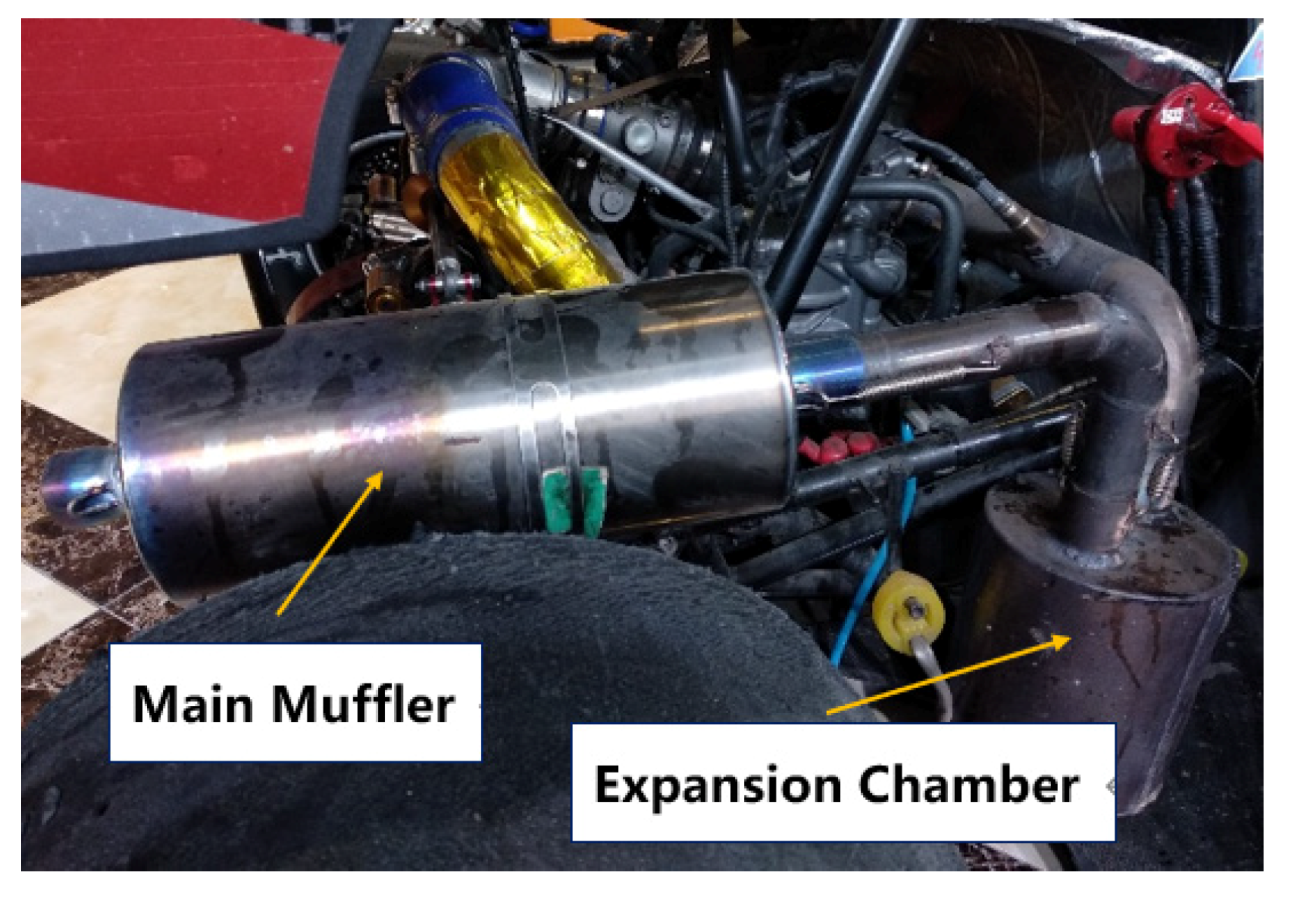
Layout of Expansion Chamber and Main Muffler.
The soundwave at 5500 r/min was collected after warm-up, and spectrum analysis was performed, as shown in Figure 48. In general, the characteristic frequencies of the testing and simulation noise are in good agreement. Below 450 Hz, the measured amplitude was very near the simulated amplitude. However, because intake noise, mechanical noise and chassis vibration cannot be achieved by the 1D CFD simulation at frequencies above 450 Hz, the simulated amplitude was lower than the measured amplitude.
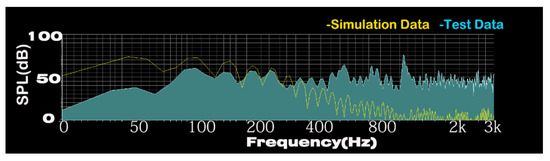
Figure 48.
Comparison of the Spectrum of Simulation and Testing.
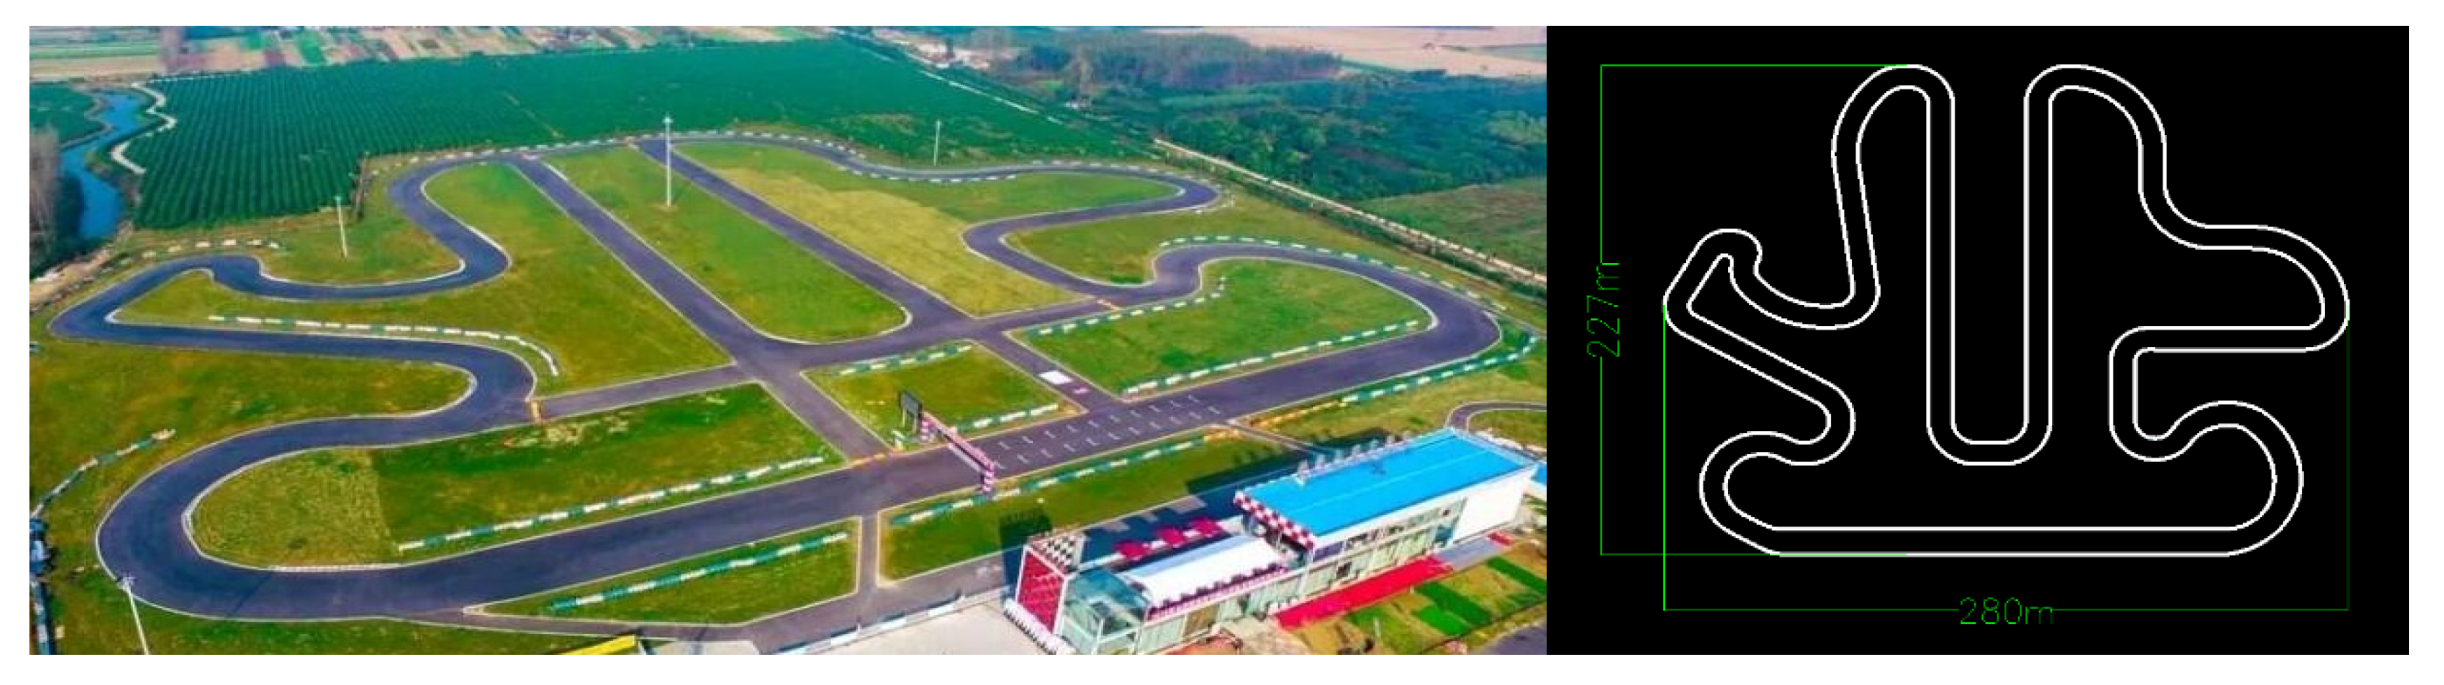
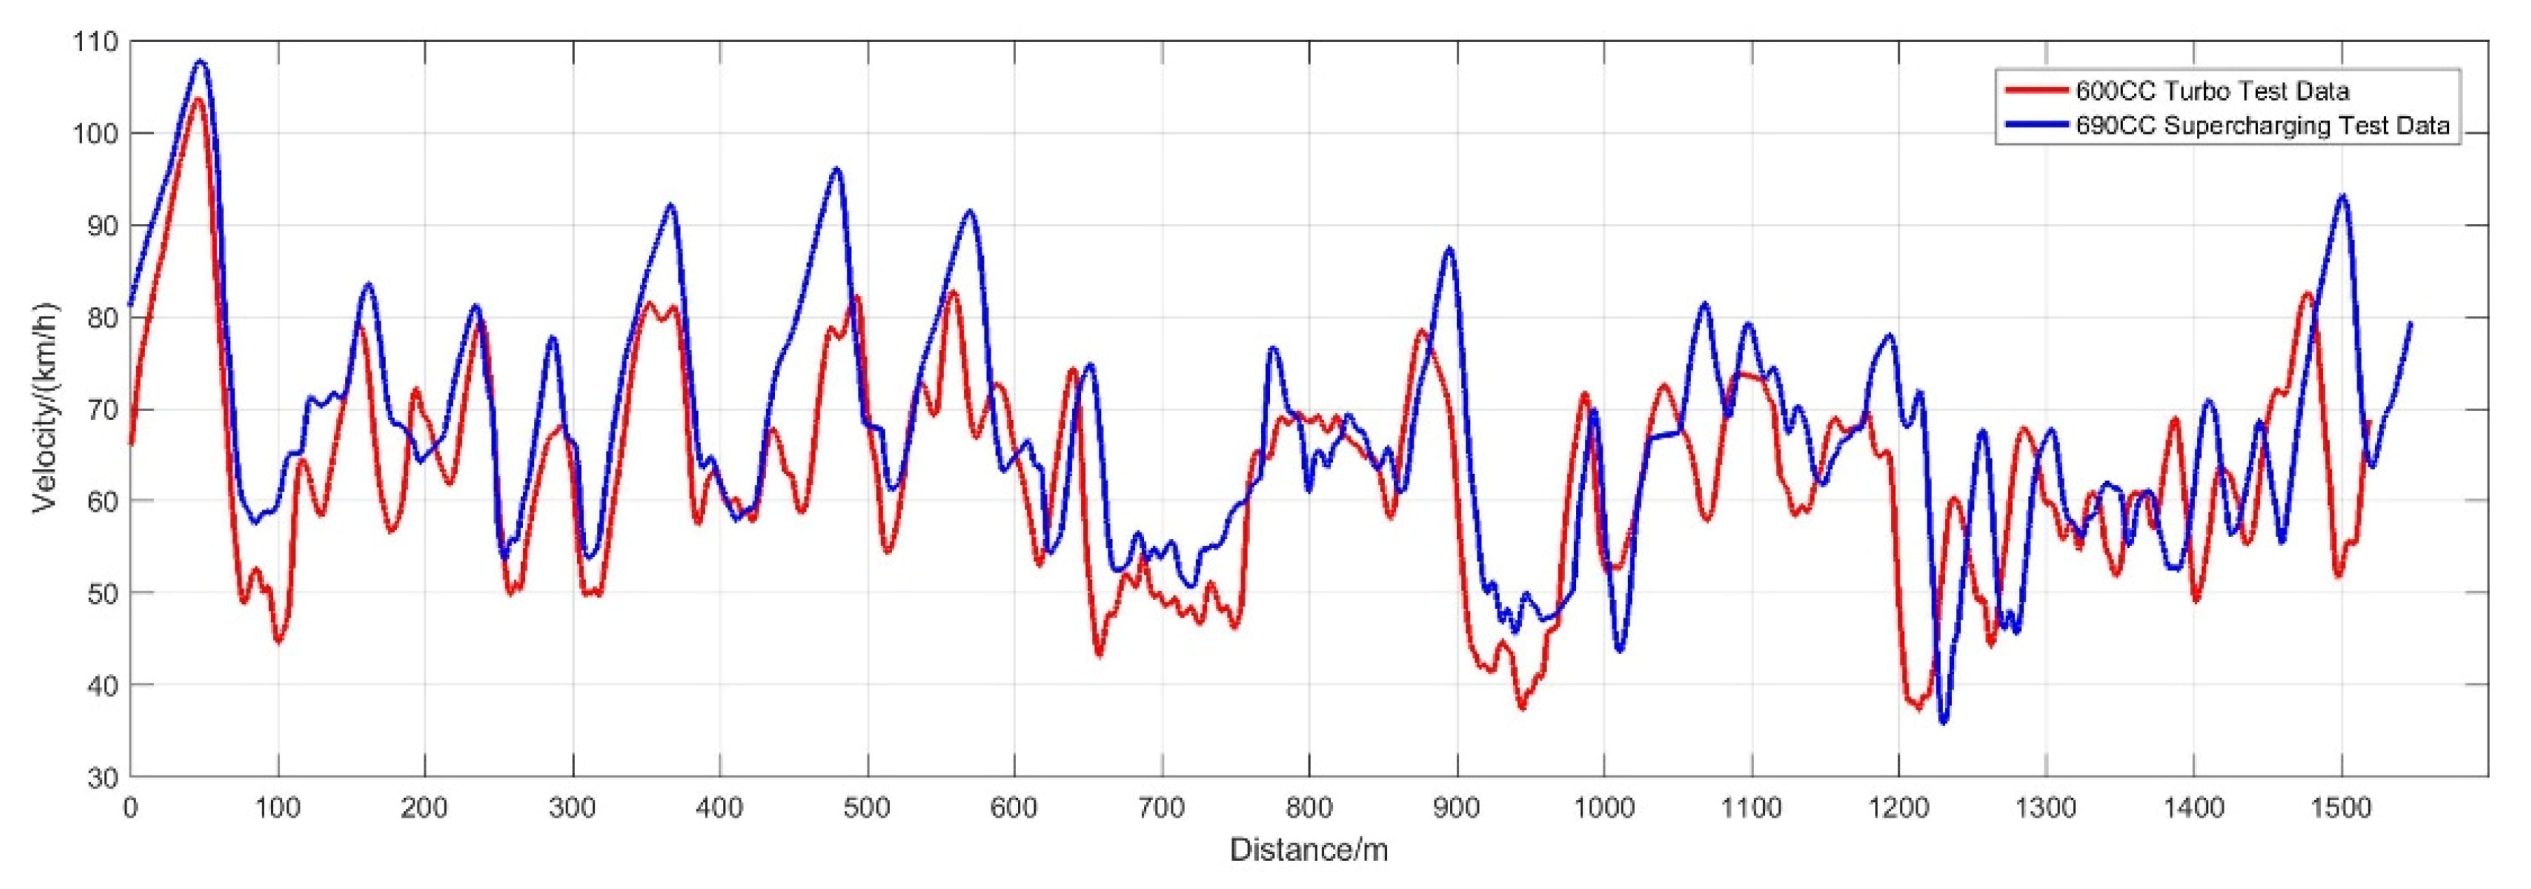
7.2.3. Track Test
On a dry and well-adhered track (shown in Figure 49), the Gspeed-2018 racecar with the new-generation engine and the Gspeed-2017 racecar with the previous turbocharged 4-cylinder engine were tested and compared. The two racecars used similar chassis and aerodynamic settings and were driven by the same experienced driver. The test results are shown in Table 13, and the speed curve of the fastest lap is shown in Figure 50.

Figure 49.
Schematic Diagram of the Testing Track.
Table 13.
Lap times of Gspeed-2017 and Gspeed-2018 Racecars.

Figure 50.
Fastest Lap Comparison of Gspeed-2017 and Gspeed-2018 Racecars.
The results show that the cornering and top speeds of the new car are generally higher than those of the previous car. The fastest lap time can be shortened by nearly 7%, and the total time can be shortened by approximately 5%. The competitiveness of the racecar has been significantly improved.
In Formula Student China 2018, the car equipped with the new-generation engine won the first place in the endurance and design events and the second place in the acceleration and autocross events, helping the team to win the championship.
8. Conclusions
This article summarises the development methods and technical experience of the Formula Student racecar engine of Jilin University since 2018. After a series of modifications, adjustments and optimisations, the final developed engine has a total dry weight of less than 55 kg. With a 20-mm diameter intake restrictor, the maximum power is 60 kW, and the maximum torque is 82 Nm. With the volume and weight of a single-cylinder engine, the performance of traditional four-cylinder engines is realised. Meanwhile, the torque response time of the new engine under typical conditions is shortened by 80% compared with the previous generation turbocharged engine.
A parametric model of the entire vehicle is used for track simulation on different powertrain configurations. Driven by the simulation results, a technical route of ‘response enhancement technology’ was proposed, i.e., a single-cylinder engine was selected to achieve being lightweight; a supercharger was added to improve power; a small volume intake system, double fuel injection, no intercooling design, electronic throttle and other technologies were used to achieve the ideal torque response capability.
A supercharger characteristic test bench, an engine performance test bench and an engine’s 1D CFD simulation model were established. Comprehensive considering power, torque, lightweight, layout, cost, efficiency and other factors, the three types of superchargers were normalised to determine the most suitable roots-type supercharger.
The flow and efficiency characteristics of the supercharger are measured by experiments. Consequently, a suitable target boost pressure ratio is selected. Meanwhile, the innovative use of a dual-line driven intake blow-off valve and the pressure ratio control strategy effectively reduce the compressor power loss under idle and low loads.
The intake system of the engine is designed with the goal of power and torque response enhancement. During the design process, the influence of the intake system volume upstream and downstream of the throttle on the engine’s responsiveness and power was emphasised. Simulation and experiment prove that a large throttle upstream volume and a small throttle downstream volume are ideal designs that consider both power and torque responses. Instead of an intercooler, dual-stage fuel injection is used to control the intake air temperature at an acceptable level, further improving the torque response.
The exhaust system of the engine is designed with the goal of noise level reduction and power output increase. In the study, an exhaust system configuration with a pre-expansion chamber and a rear main muffler is proposed to reduce the low-frequency noise in the expansion chamber and the high-frequency noise using the main muffler. Through parameter optimisation and design iteration, the volume of the expansion chamber and the structure of the main muffler are gradually adjusted. The target power is achieved at a noise level under the rule limits.
Finally, the new racecar with the developed new-generation engine has a maximum longitudinal acceleration of approximately 1.1 G. The acceleration time of 0–100 km/h is shortened by 0.2 s, and the lap time of the testing circuit is shortened by nearly 7% compared with those of the previous generation of turbocharged four-cylinder engines. This racecar and powertrain have achieved satisfactory results in Formula Student China, Formula Student Germany and other competitions.
Author Contributions
Conceptualization, D.W. and G.Y.; methodology, D.W. and S.Y.; software, G.Y. and Y.S.; validation, R.Y., Y.S. and G.Y.; formal analysis, G.Y. and Y.S.; investigation, C.S.; resources, C.S.; data curation, R.Y.; writing—original draft preparation, D.W.; writing—review and editing, G.Y. and S.Y.; visualization, S.Y. and R.Y.; supervision, D.W.; project administration, C.S.; funding acquisition, C.S. All authors have read and agreed to the published version of the manuscript.
Funding
This research received no external funding.
Conflicts of Interest
The authors declare no conflict of interest.
References
- Formula SAE. Available online: http://www.formulastudent.com.cn/ (accessed on 12 April 2020).
- SAE International. 2020 Formula SAE Rules. 2020. Available online: http://students.sae.org/cds/formulaseries/rules/ (accessed on 12 April 2020).
- Kimbara, Y.; Konishi, M.; Mayumi, K.; Yoshida, M.; Yasunaga, K. Development of 2-Liter 6-Cylinder Gasoline Engines, Toyota 1G Engine Series; SAE Technical Papers; SAE International: Warrendale, PA, USA, 1987. [Google Scholar]
- Wang, D.; Qian, D.; Wang, B. The Development of a Small Restricted Turbocharged Racecar Engine; SAE Technical Paper 2016-32-0061; SAE International: Warrendale, PA, USA, 2016. [Google Scholar] [CrossRef]
- Jawad, B.A.; Degain, M.D.; Young, A.P. Design of a Restricted Induction System for a High Speed Four Cylinder Engine; SAE International Technical Paper 2000-01-3090; SAE International: Warrendale, PA, USA, 2000. [Google Scholar]
- Baldisserotto, M.; Delagrammatikas, G.J. Advanced Development and Dynamometer Tuning of a Suzuki GSXR 600cc Engine for an FSAE® Vehicle; SAE International Technical Paper 2010-01-0310; SAE International: Warrendale, PA, USA, 2010. [Google Scholar]
- Chantharasenawong, C.; Chanta, A.; Siripongarpone, P.; Kaoudom, S. Improvement of Formula Student Racecar Performance with Rotary Variable Runner Length for the Intake System; SAE International Technical Paper 2018-01-0977; SAE International: Warrendale, PA, USA, 2018. [Google Scholar]
- Cauchi, J.; Farrugia, M.; Balzan, N. Engine Simulation of a Restricted FSAE Engine, Focusing on Restrictor Modelling; SAE International Technical Paper 2006-01-3651; SAE International: Warrendale, PA, USA, 2006. [Google Scholar]
- McKee, R.H.; McCullough, G.; Cunningham, G.; Taylor, J.O.; McDowell, N.; Taylor, J.T.; McCullough, R. Experimental Optimisation of Manifold and Camshaft Geometries for a Restricted 600cc Four-Cylinder Four-Stroke Engine; SAE International Technical Paper 2006-32-0070; SAE International: Warrendale, PA, USA, 2006. [Google Scholar]
- Azzopardi, J.P.; Farrugia, J.P.; Caruana, C.; Grech, N.; Farrugia, N.; Chircop, M.; Farrugia, M. Testing and Implementation of a Turbocharged Formula SAE Vehicle; SAE International Technical Paper 2018-01-0967; SAE International: Warrendale, PA, USA, 2018. [Google Scholar]
- Praveen, V.V.; Sethupathi, P.B. Active Muffler for Single Cylinder Engine, Using Electronic Throttle Control for Formula Student Cars; SAE International Technical Paper 2017-28-1935; SAE International: Warrendale, PA, USA, 2017. [Google Scholar]
- Corrigan, D.; McCullough, G.; Cunningham, G. Evaluation of the Suitability of a Single-Cylinder Engine for Use in FSAE.; SAE International Technical Paper 2006-32-0053; SAE International: Warrendale, PA, USA, 2006. [Google Scholar]
- CFD Software by STAR-CCM+. Available online: https://www.plm.automation.siemens.com/global/zh/products/simcenter/STAR-CCM.html (accessed on 12 April 2020).
- Buchman, M.R.; Winter, A.G.V. Validating a method for turbocharging single cylinder four stroke engines. In Proceedings of the ASME Design Engineering Technical Conferences, Charlotte, NC, USA, 21–24 August 2016. [Google Scholar]
- Zhenyi, Y.; Shouvik, D. Preliminary Investigation of Exhaust Pressure Waves in a Single Cylinder Diesel Engine and the Impacts on Aftertreatment Sprays. SAE Int. J. Engines 2017, 10, 636–645. [Google Scholar]
- Buchman, M.R.; Winter, A. Investigating the Effect of Intake Manifold Size on the Transient Response of Single Cylinder Turbocharged Engines; SAE Technical Papers 2017-September 2017; SAE International: Warrendale, PA, USA, 2017. [Google Scholar]
- Venugopal, T.; Anubhav, R. A New Approach for Development of a High-Performance Intake Manifold for a Single-Cylinder Engine Used in Formula SAE Application. SAE Int. J. Engines 2019, 12, 401–416. [Google Scholar] [CrossRef]
- Yao, D.; Wu, F.; Xie, H.; Zhang, Y. Crank event based fuel injection and spark ignition timing control strategy for SI engines. Adv. Mater. Res. 2012, 516–517, 585–592. [Google Scholar] [CrossRef]
- Fu-Quan, Z.; Ming-Chia, L. A Review of Mixture Preparation and Combustion Control Strategies for Spark-Ignited Direct-Injection Gasoline Engines; SAE Technical Papers, No.970627; SAE International: Warrendale, PA, USA, 1997. [Google Scholar]
- Cherian, F.; Ranjan, A.; Bhowmick, P.; Rammohan, A. Model based design of electronic throttle control. IOP Conf. Ser. Mater. Sci. Eng. 2017, 263, 062063. [Google Scholar] [CrossRef]
- Vehicle Dynamics Simulation Software by VI-CarRealTime. Available online: https://www.vi-grade.com (accessed on 12 April 2020).
- Data Acquisition Software by MoTeC I2 Pro. Available online: https://www.motec.com.au (accessed on 12 April 2020).
- Engine Process Simulation Software by GT-Power. Available online: https://gtpower.ca/ (accessed on 12 April 2020).
- Banish, G. Engine Management Advanced Tuning; CarTech Inc.: North Branch, MN, USA, 2007. [Google Scholar]
- Salih, S.; DelVescovo, D. Design and Validation of a GT Power Model of the CFR Engine towards the Development of a Boosted Octane Number; SAE Technical Paper 2018-01-0214; SAE International: Warrendale, PA, USA, 2018. [Google Scholar] [CrossRef]
- Robertson, D.; Conway, G.; Chadwell, C.; McDonald, J. Predictive GT-Power Simulation for VNT Matching on a 1.6 L Turbocharged GDI Engine; SAE Technical Paper 2018-01-0161; SAE International: Warrendale, PA, USA, 2018. [Google Scholar] [CrossRef]
- Panayides, C.; Pesyridis, A.; Saravi, S.S. Design of a Sequential Axial Turbocharger for Automotive Application. Energies 2019, 12, 4433. [Google Scholar] [CrossRef] [Green Version]
- Eaton TVS-R410 Supercharger Specification. Available online: https://www.eaton.com/us/en-us/catalog/engine-solutions/tvs-r410.specifications.html (accessed on 12 April 2020).
- Rotrex C8-8 Supercharger Specification. Available online: https://rotrex.com/wp-content/uploads/2018/12/Rotrex-Technical-Datasheet-C8-Range.pdf/ (accessed on 12 April 2020).
- Rose, A.T.; Akehurst, S.; Brace, C.J. Modelling the performance of a continuously variable supercharger drive system. Proc. Inst. Mech. Eng. Part D J. Automob. Eng. 2011, 225, 1399–1414. [Google Scholar] [CrossRef] [Green Version]
- Dinesh Kumar, M.; Yogesh, C.; Nayab Hussain, S.T.; Krishna, R.; Sreenivasan, M. Design optimization and CFD analysis of an air inlet system for SAE-student formula racing car. Int. J. Sci. Technol. Res. 2020, 9, 51–55. [Google Scholar]
- CFD Software by Simscale. Available online: https://www.simscale.com/product/cfd/#:~:text=Computational%20Fluid%20Dynamics%20(CFD)%20is,fluids%2C%20multiphase%20flows%20and%20more (accessed on 12 April 2020).
- Li, Z. Automotive Exhaust System Noise and the Design of Muffler; China Environmental Science Press: Beijing, China, 1991. [Google Scholar]
- Gangpu, Y.; Da, W.; Junyong, Y. A Study on Structure Optimization of Expansion Chamber in Exhaust System of Single-cylinder Engine. Small Intern. Combust. Engine Motorcycle 2018, 47, 22–28. [Google Scholar]


© 2020 by the authors. Licensee MDPI, Basel, Switzerland. This article is an open access article distributed under the terms and conditions of the Creative Commons Attribution (CC BY) license (http://creativecommons.org/licenses/by/4.0/).