Vulnerability Assessment for Power Transmission Lines under Typhoon Weather Based on a Cascading Failure State Transition Diagram
Abstract
1. Introduction
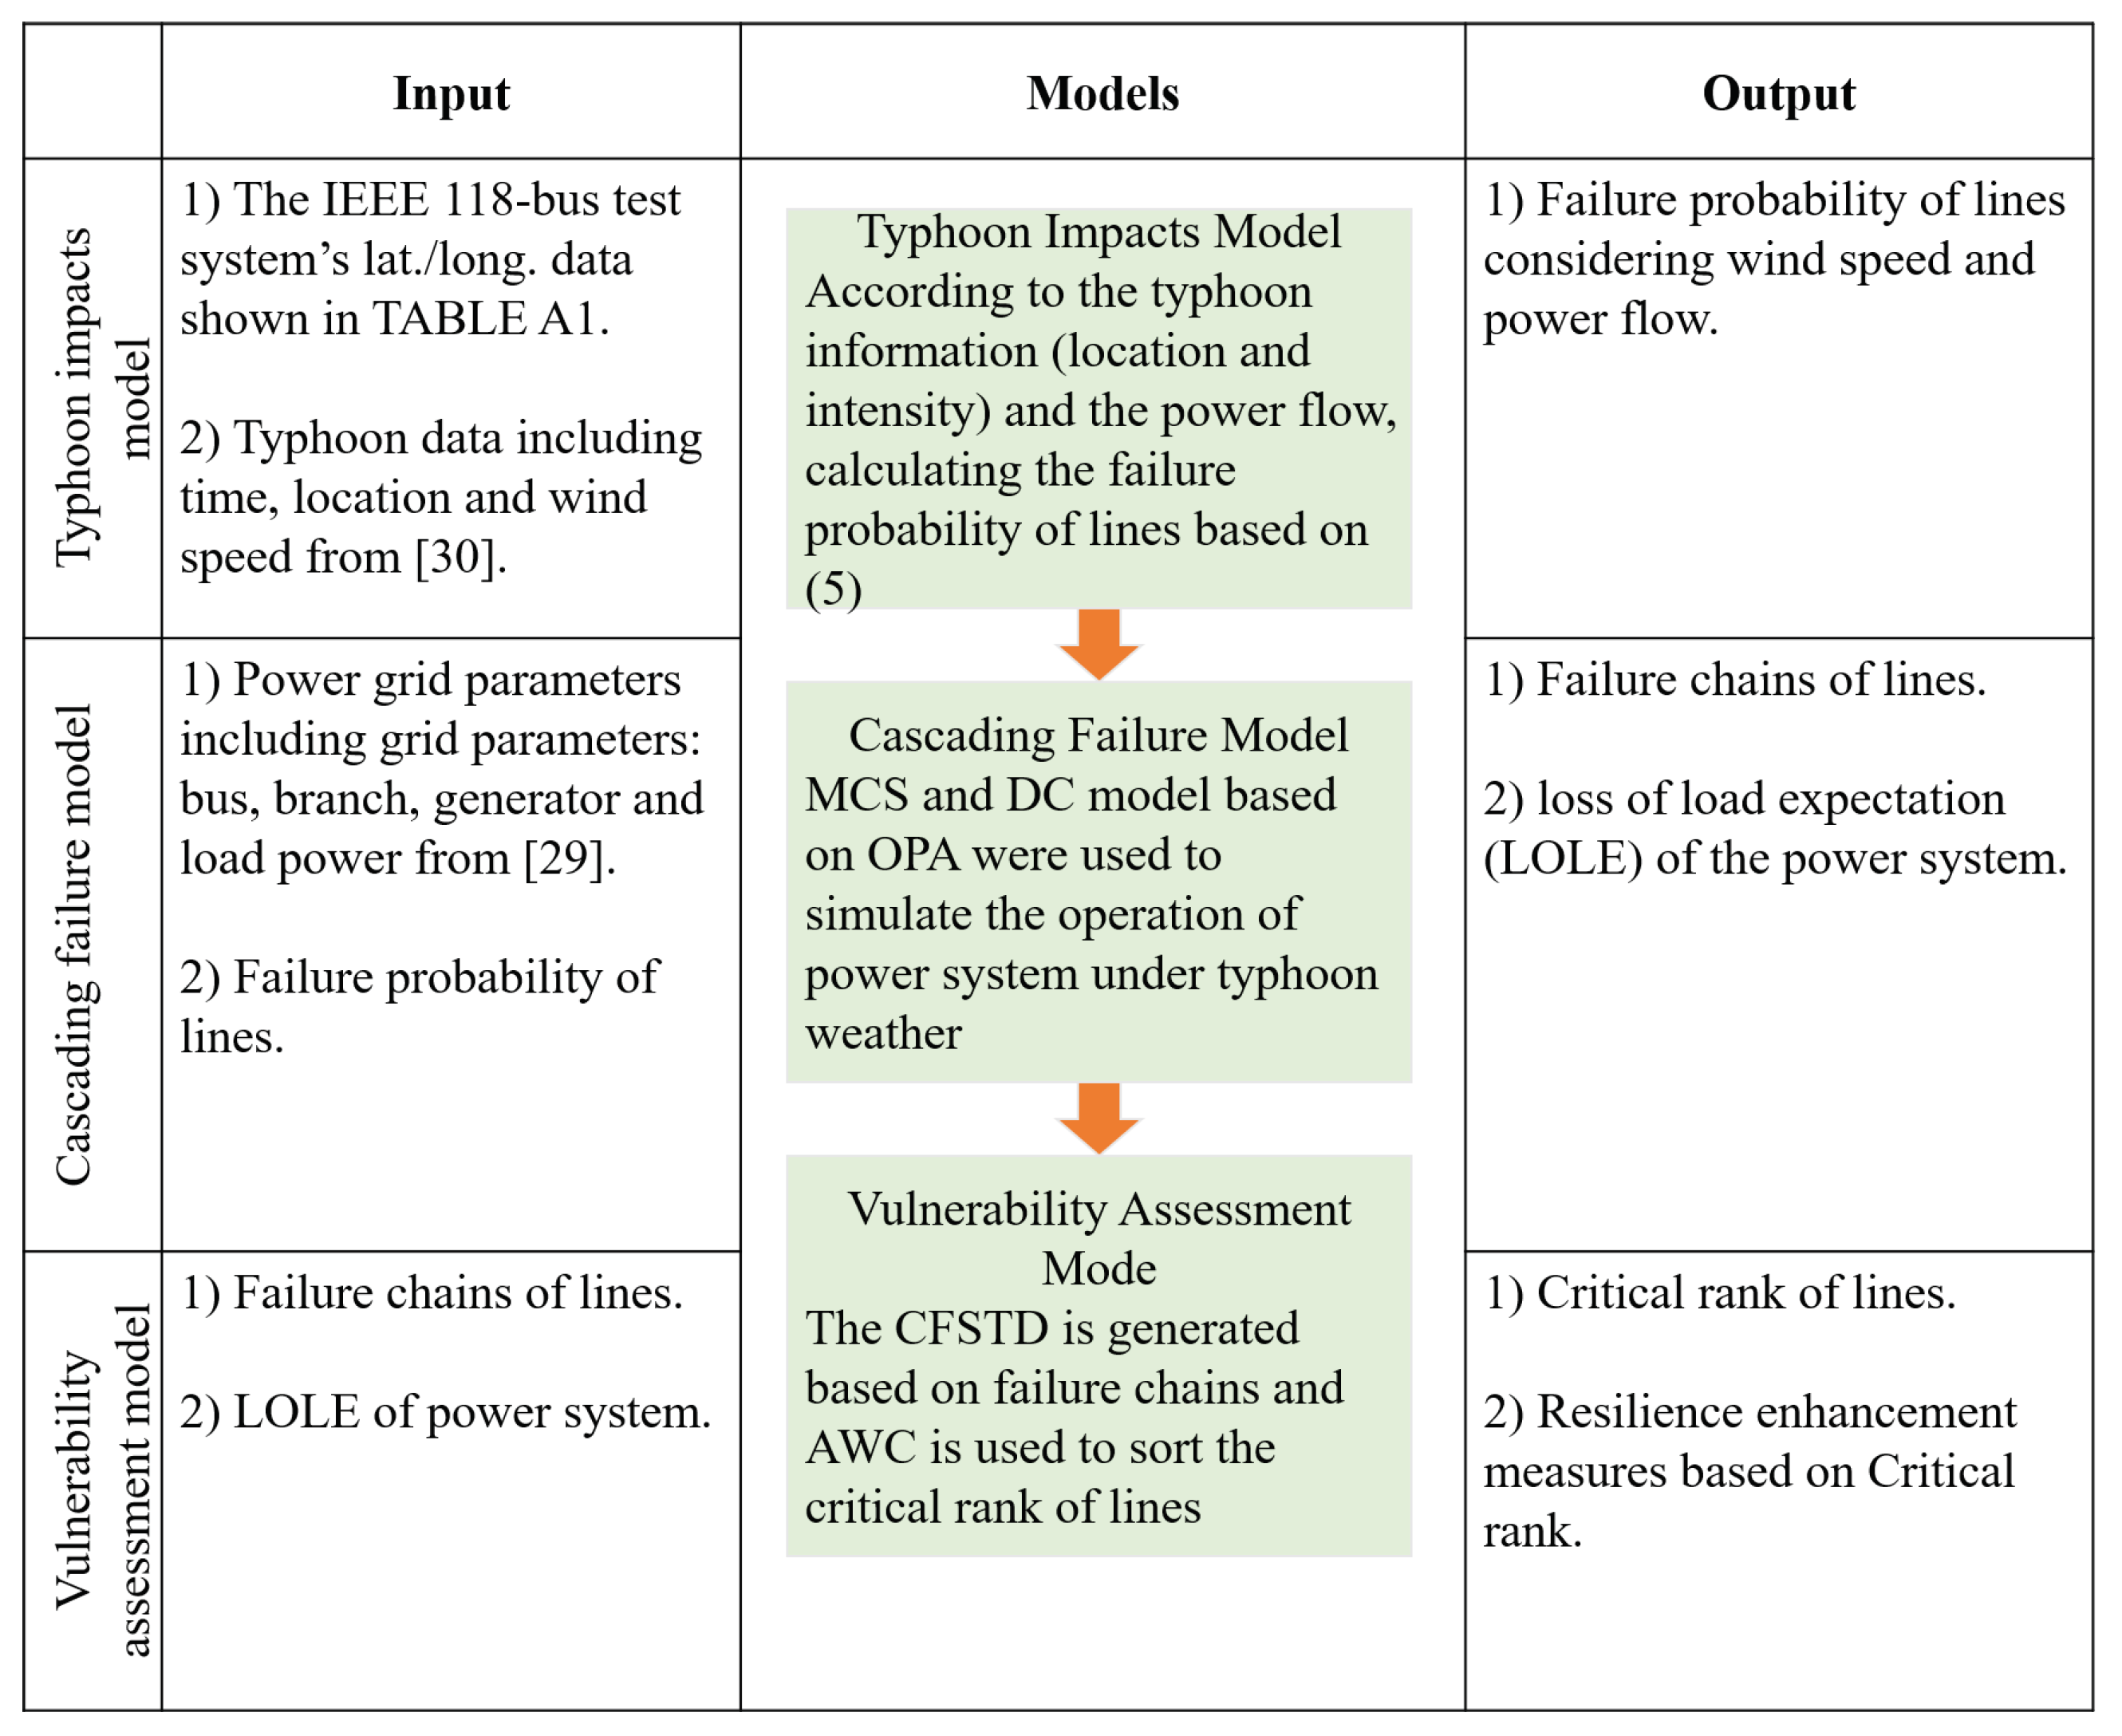
2. Framework Design Resilience Assessment
3. Evaluation of Typhoon Impacts on Transmission Lines
3.1. Wind Speed Model of Typhoons
3.2. Outage Model for Transmission Lines
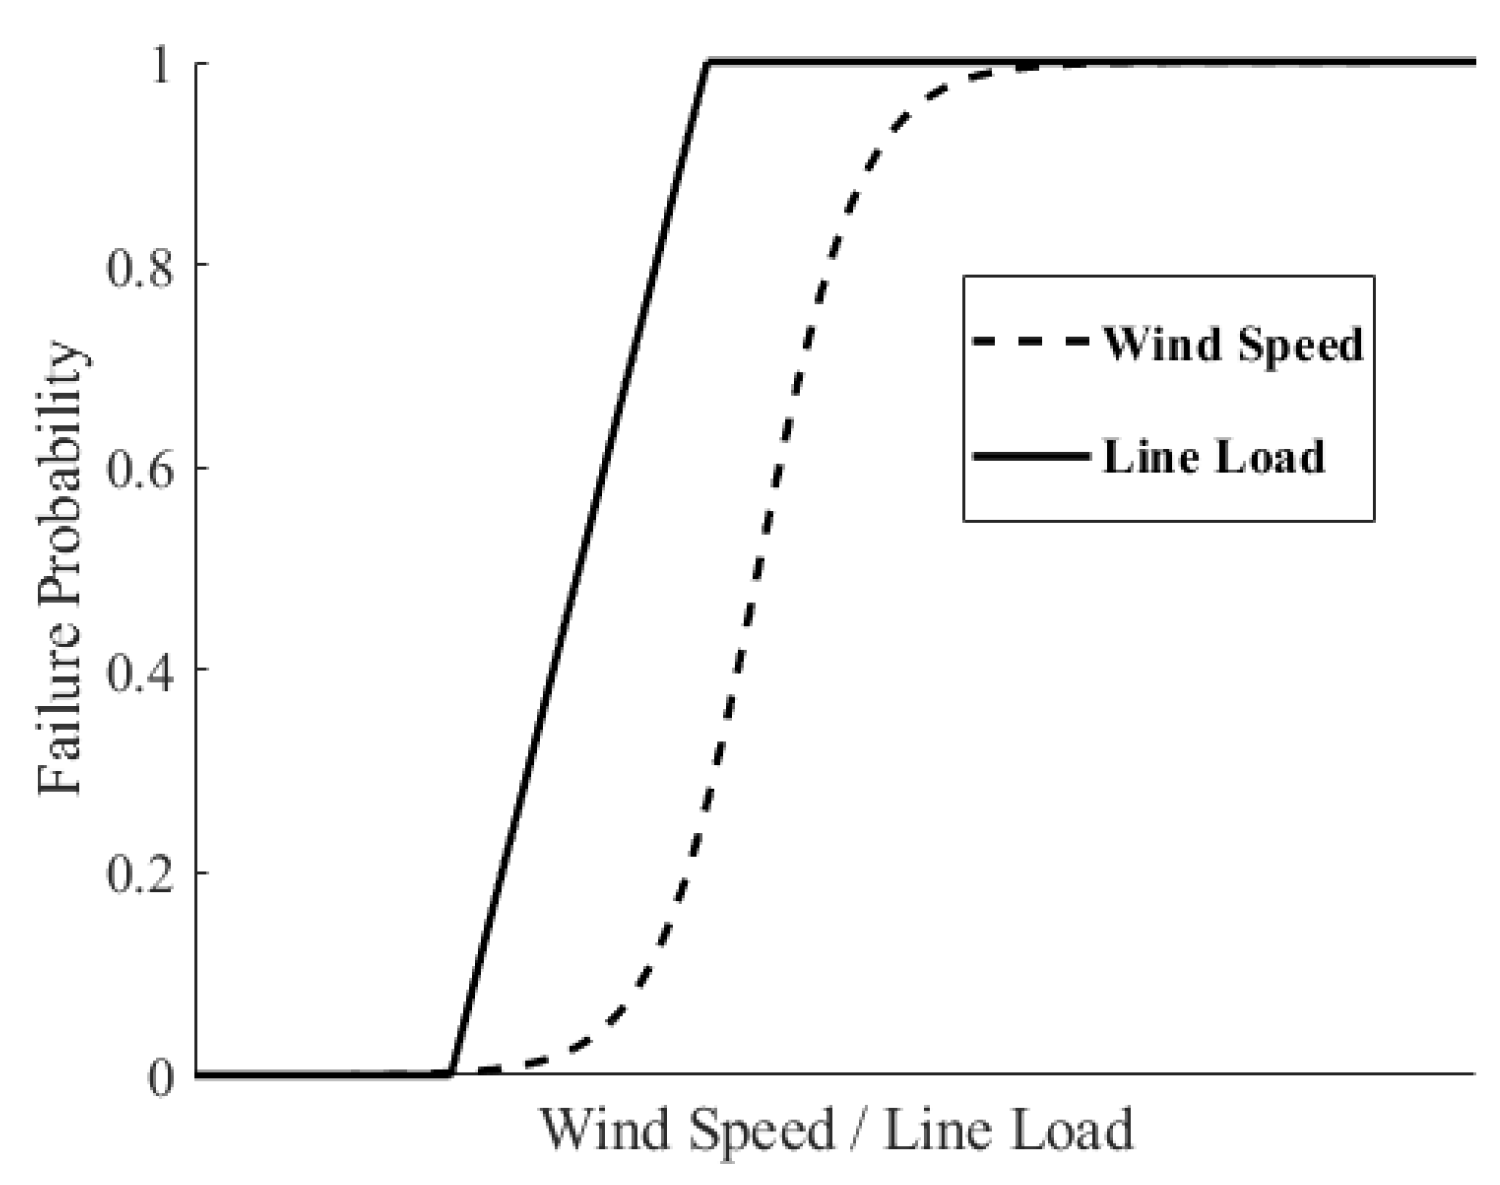
3.2.1. Impacts of Weather Condition on Transmission Lines
3.2.2. Impacts of Power Flow on Transmission Lines
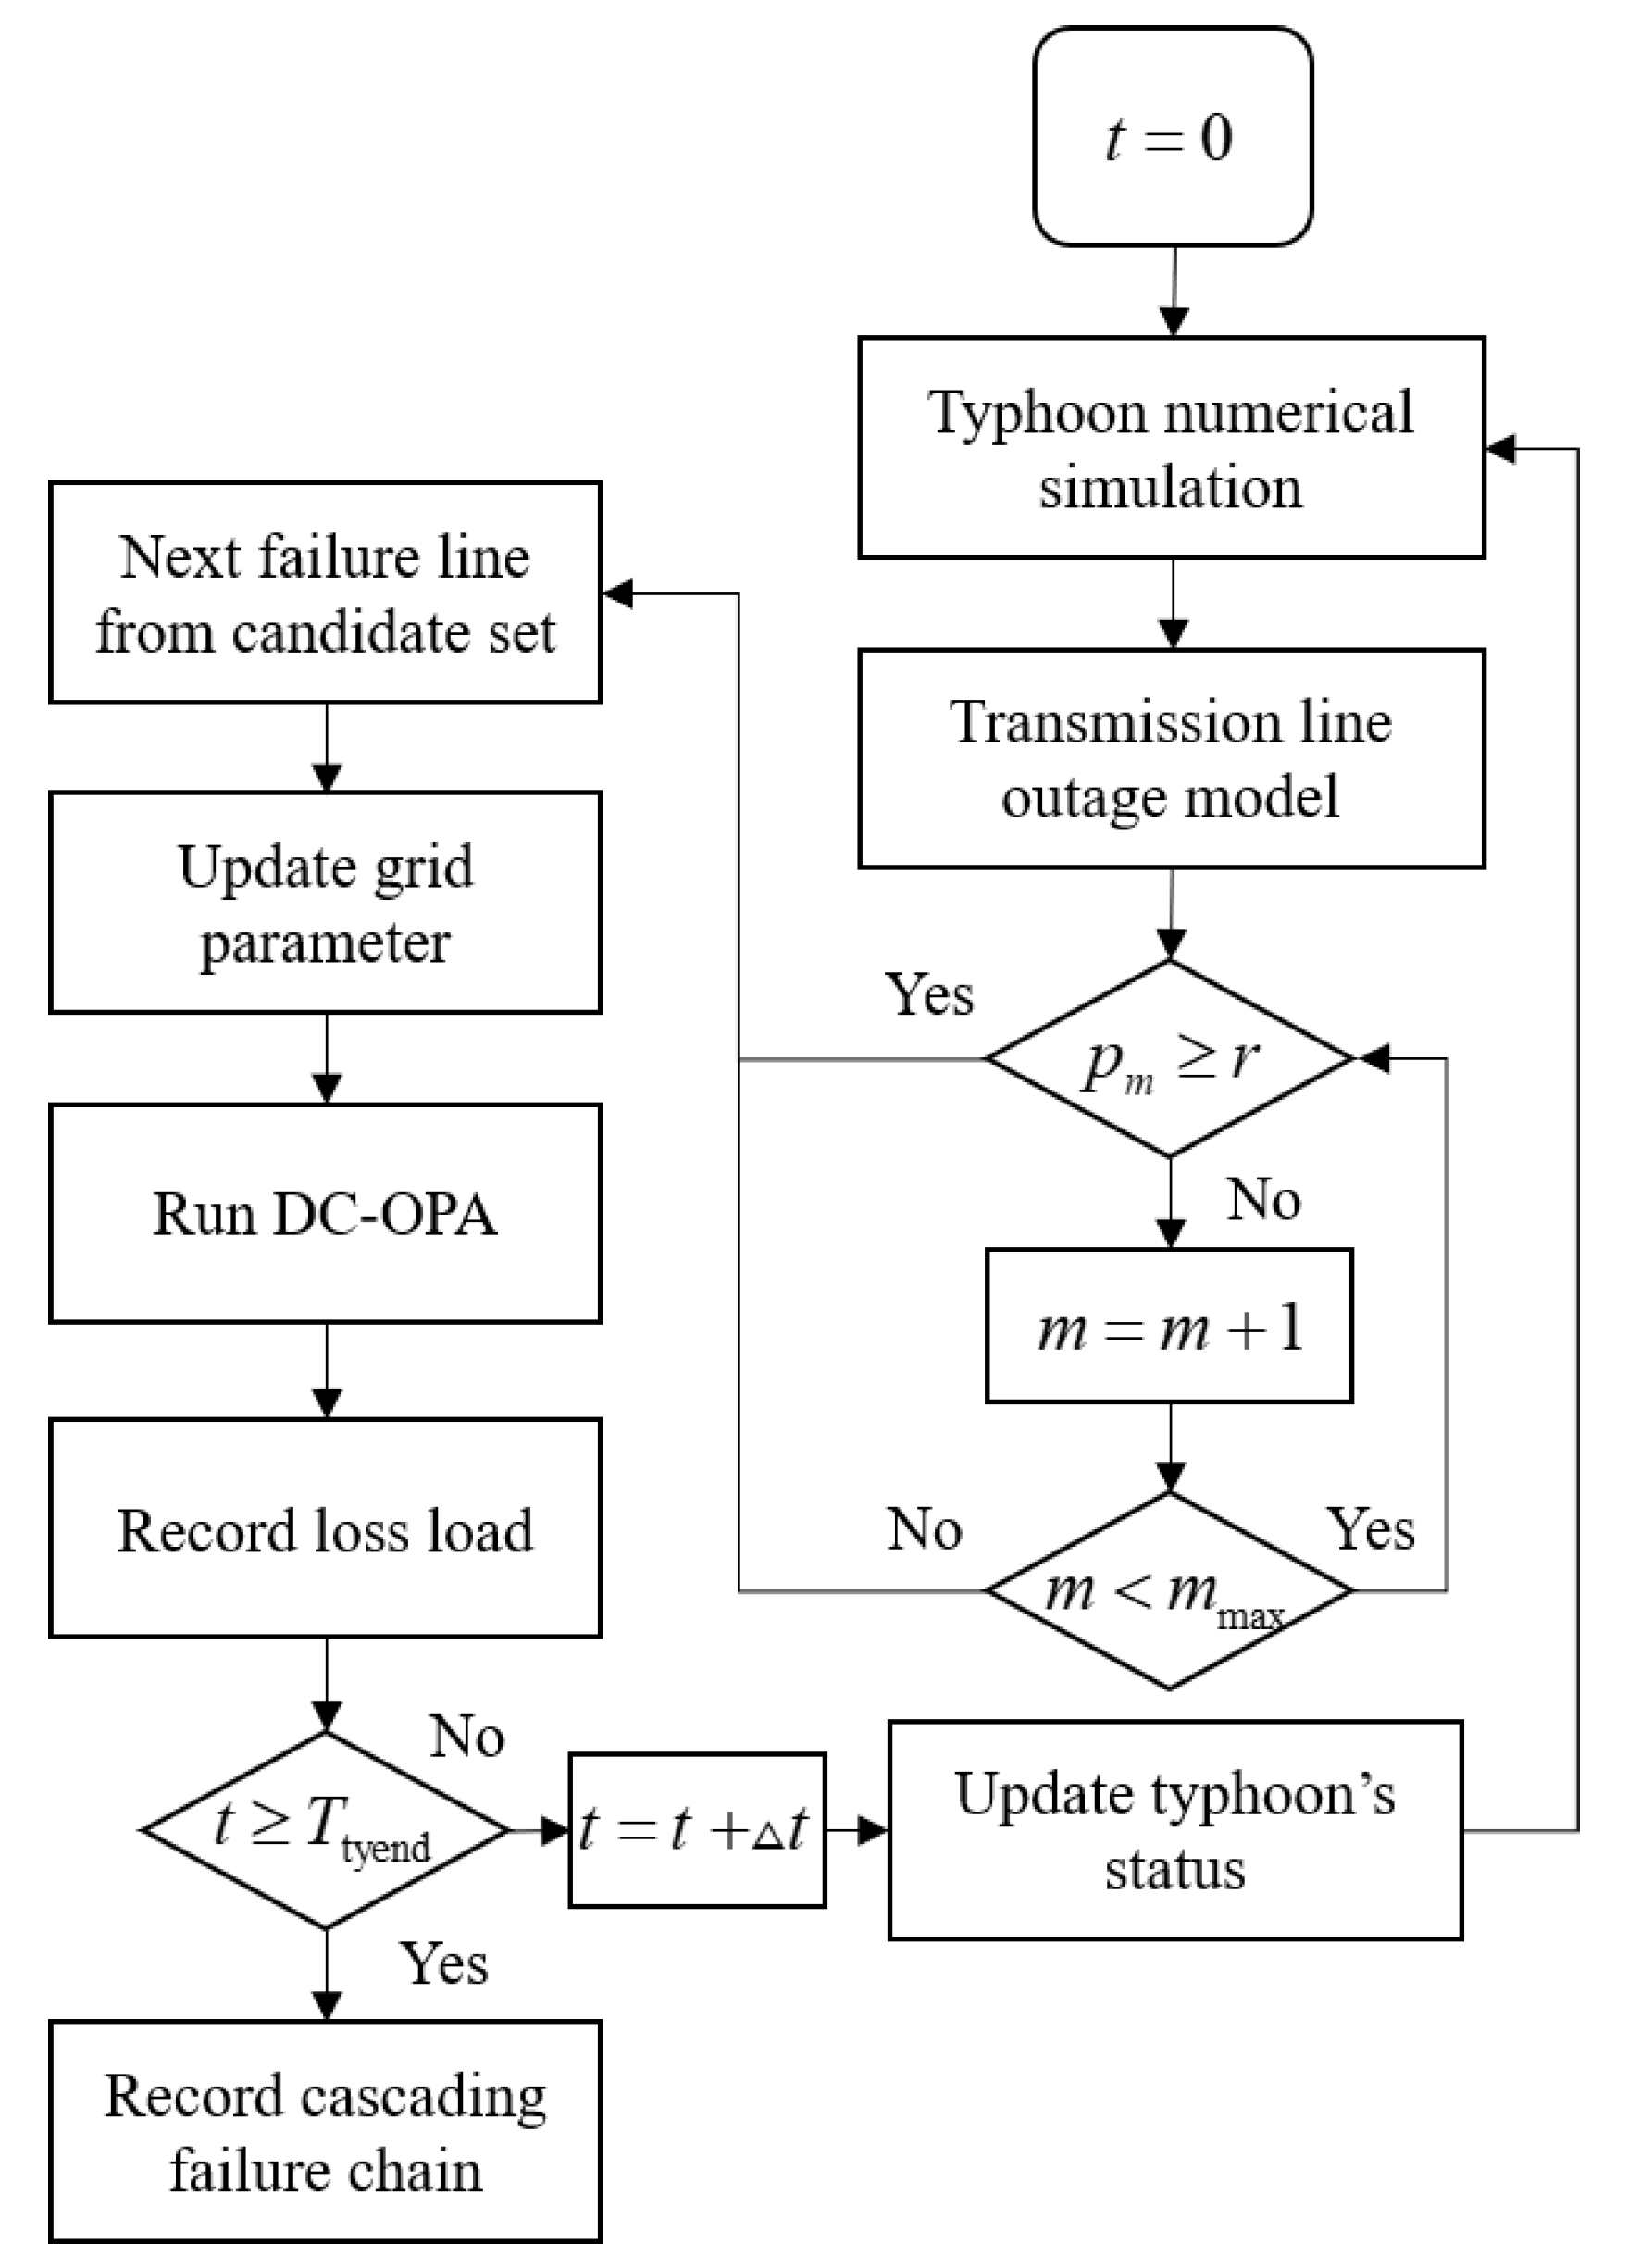
4. Cascading Failure Model of Transmission Lines
5. Vulnerability Assessment Model
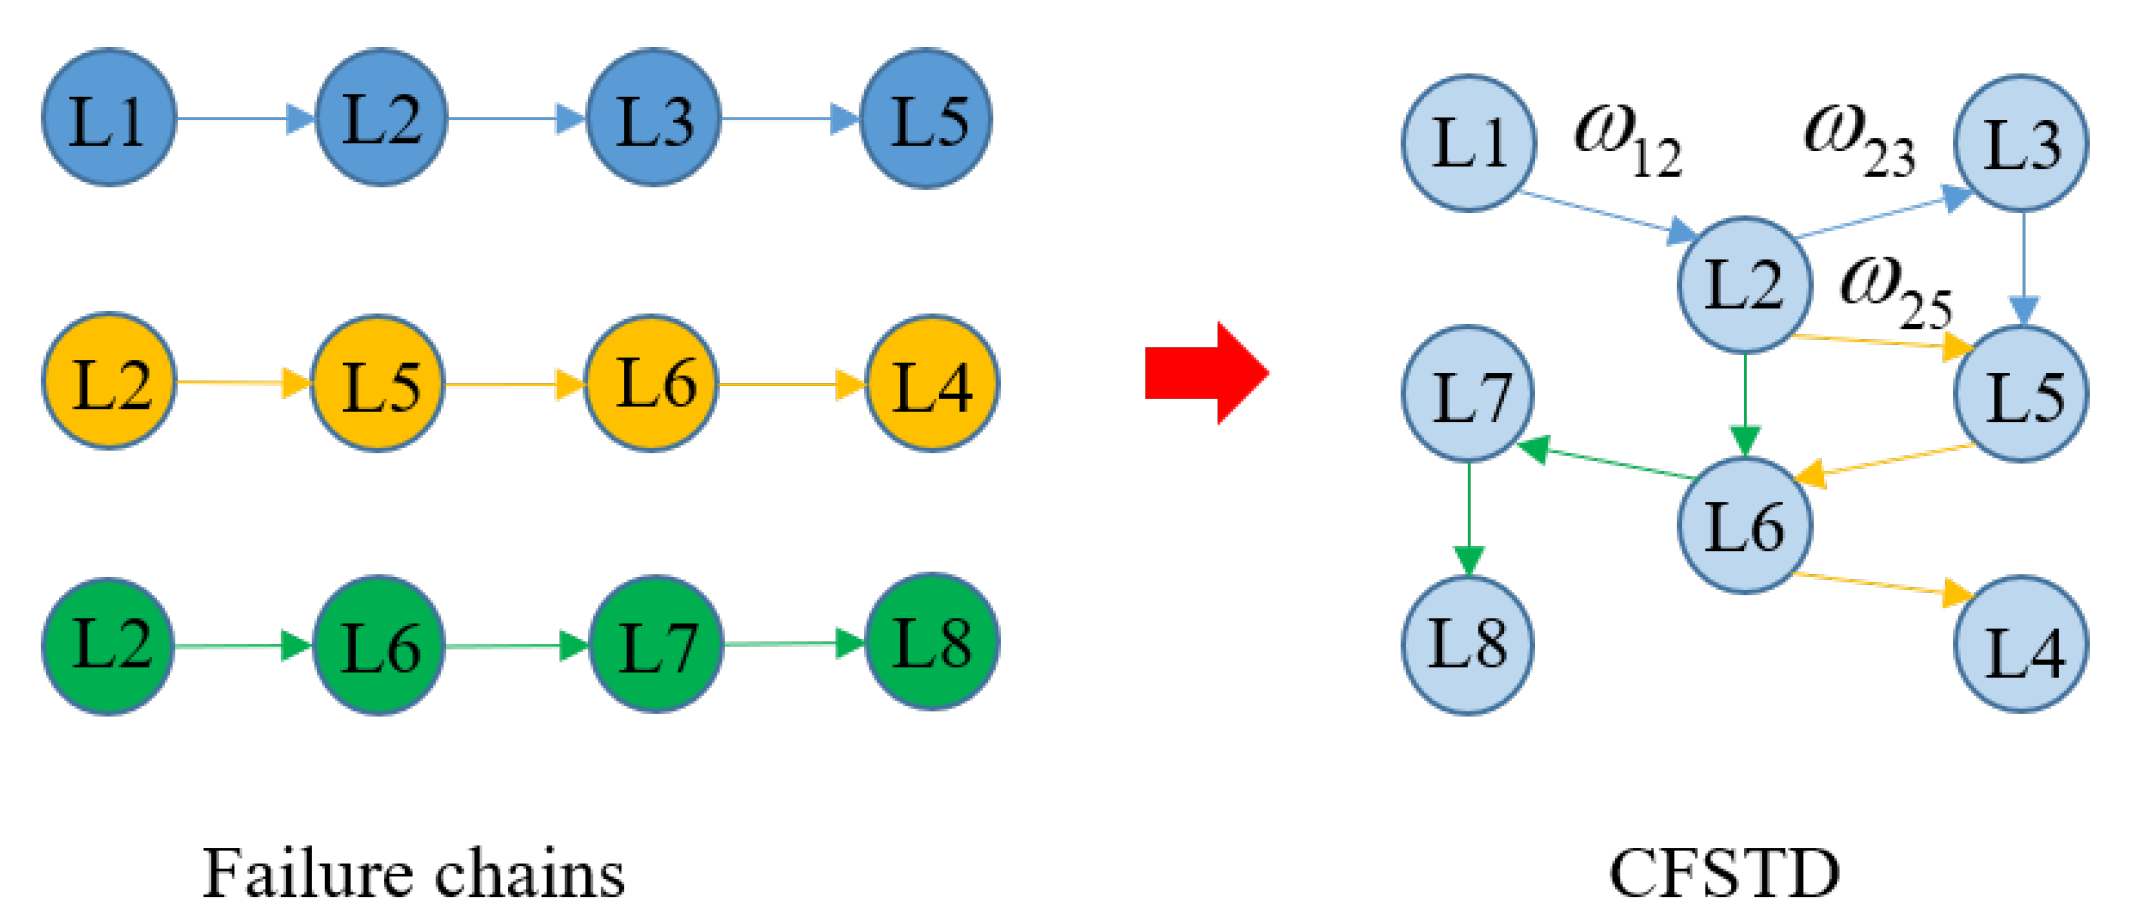
5.1. Cascading Failure State Transition Diagram
5.2. The Criticality Ranking of Nodes in CFSTD
5.3. Average Load Loss of Failure Chains
6. Case Studies
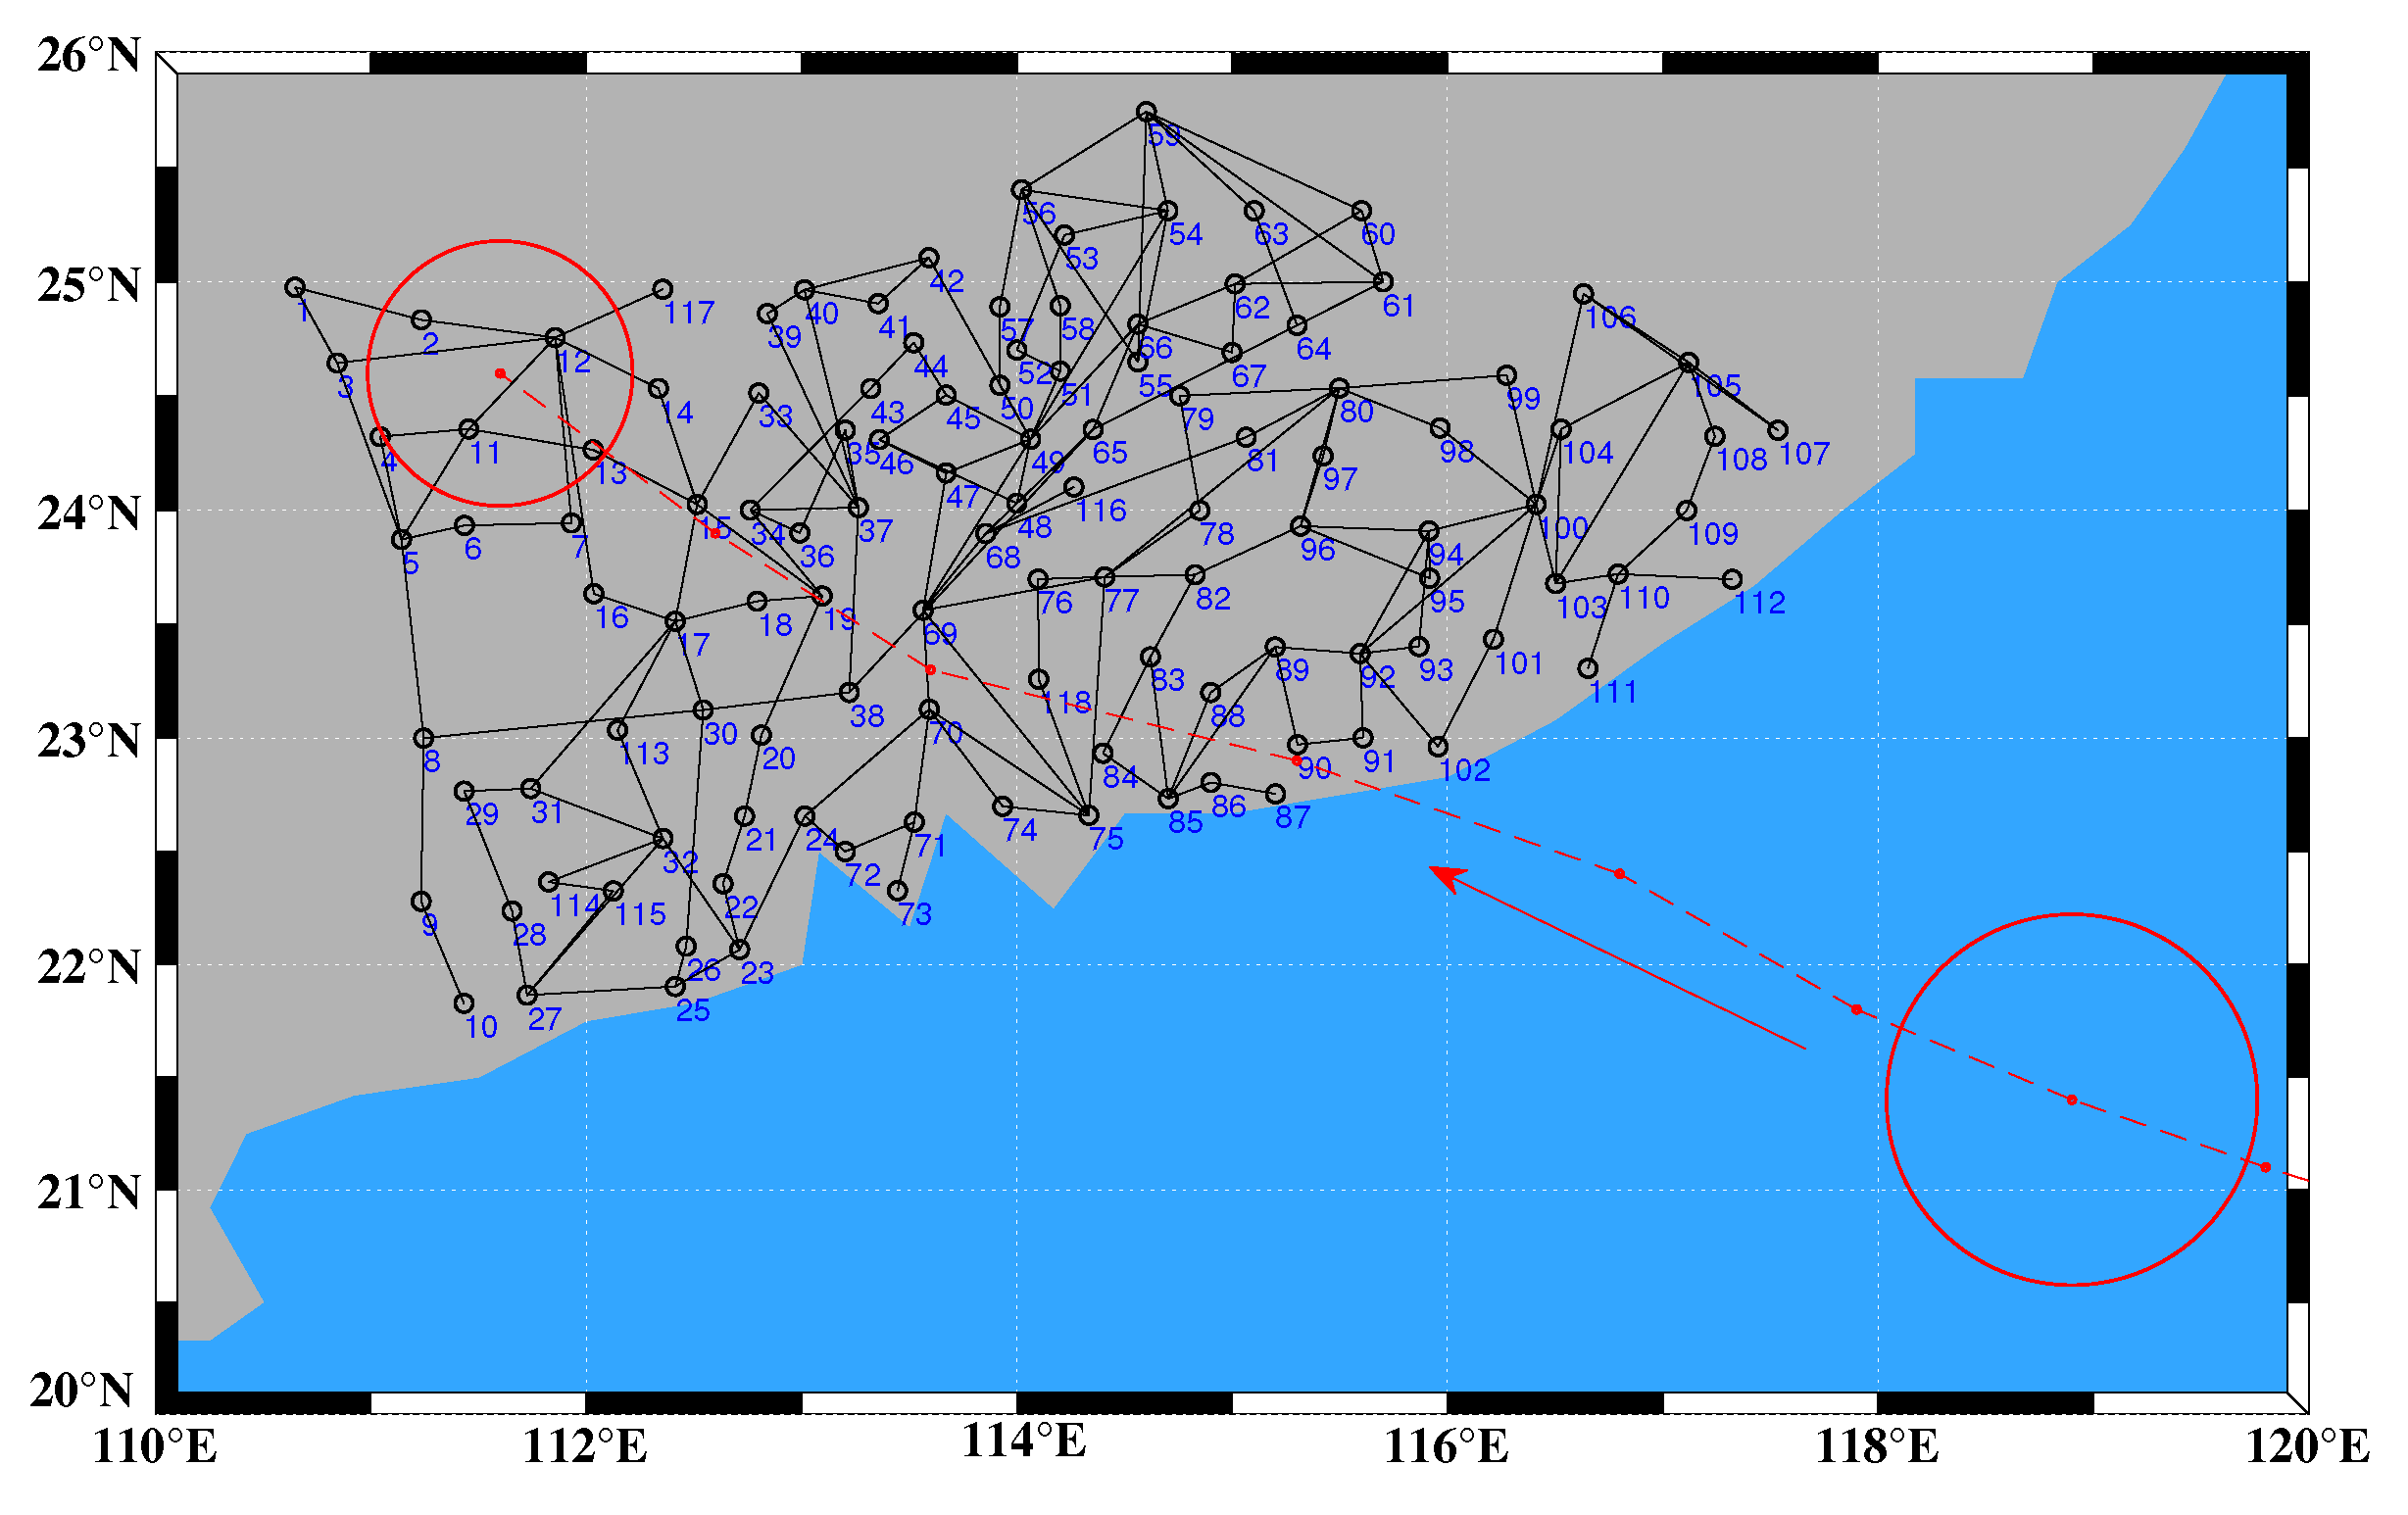
6.1. Test System and Data
6.2. Simulation Results
6.3. Resilience Enhancement to a Typhoon
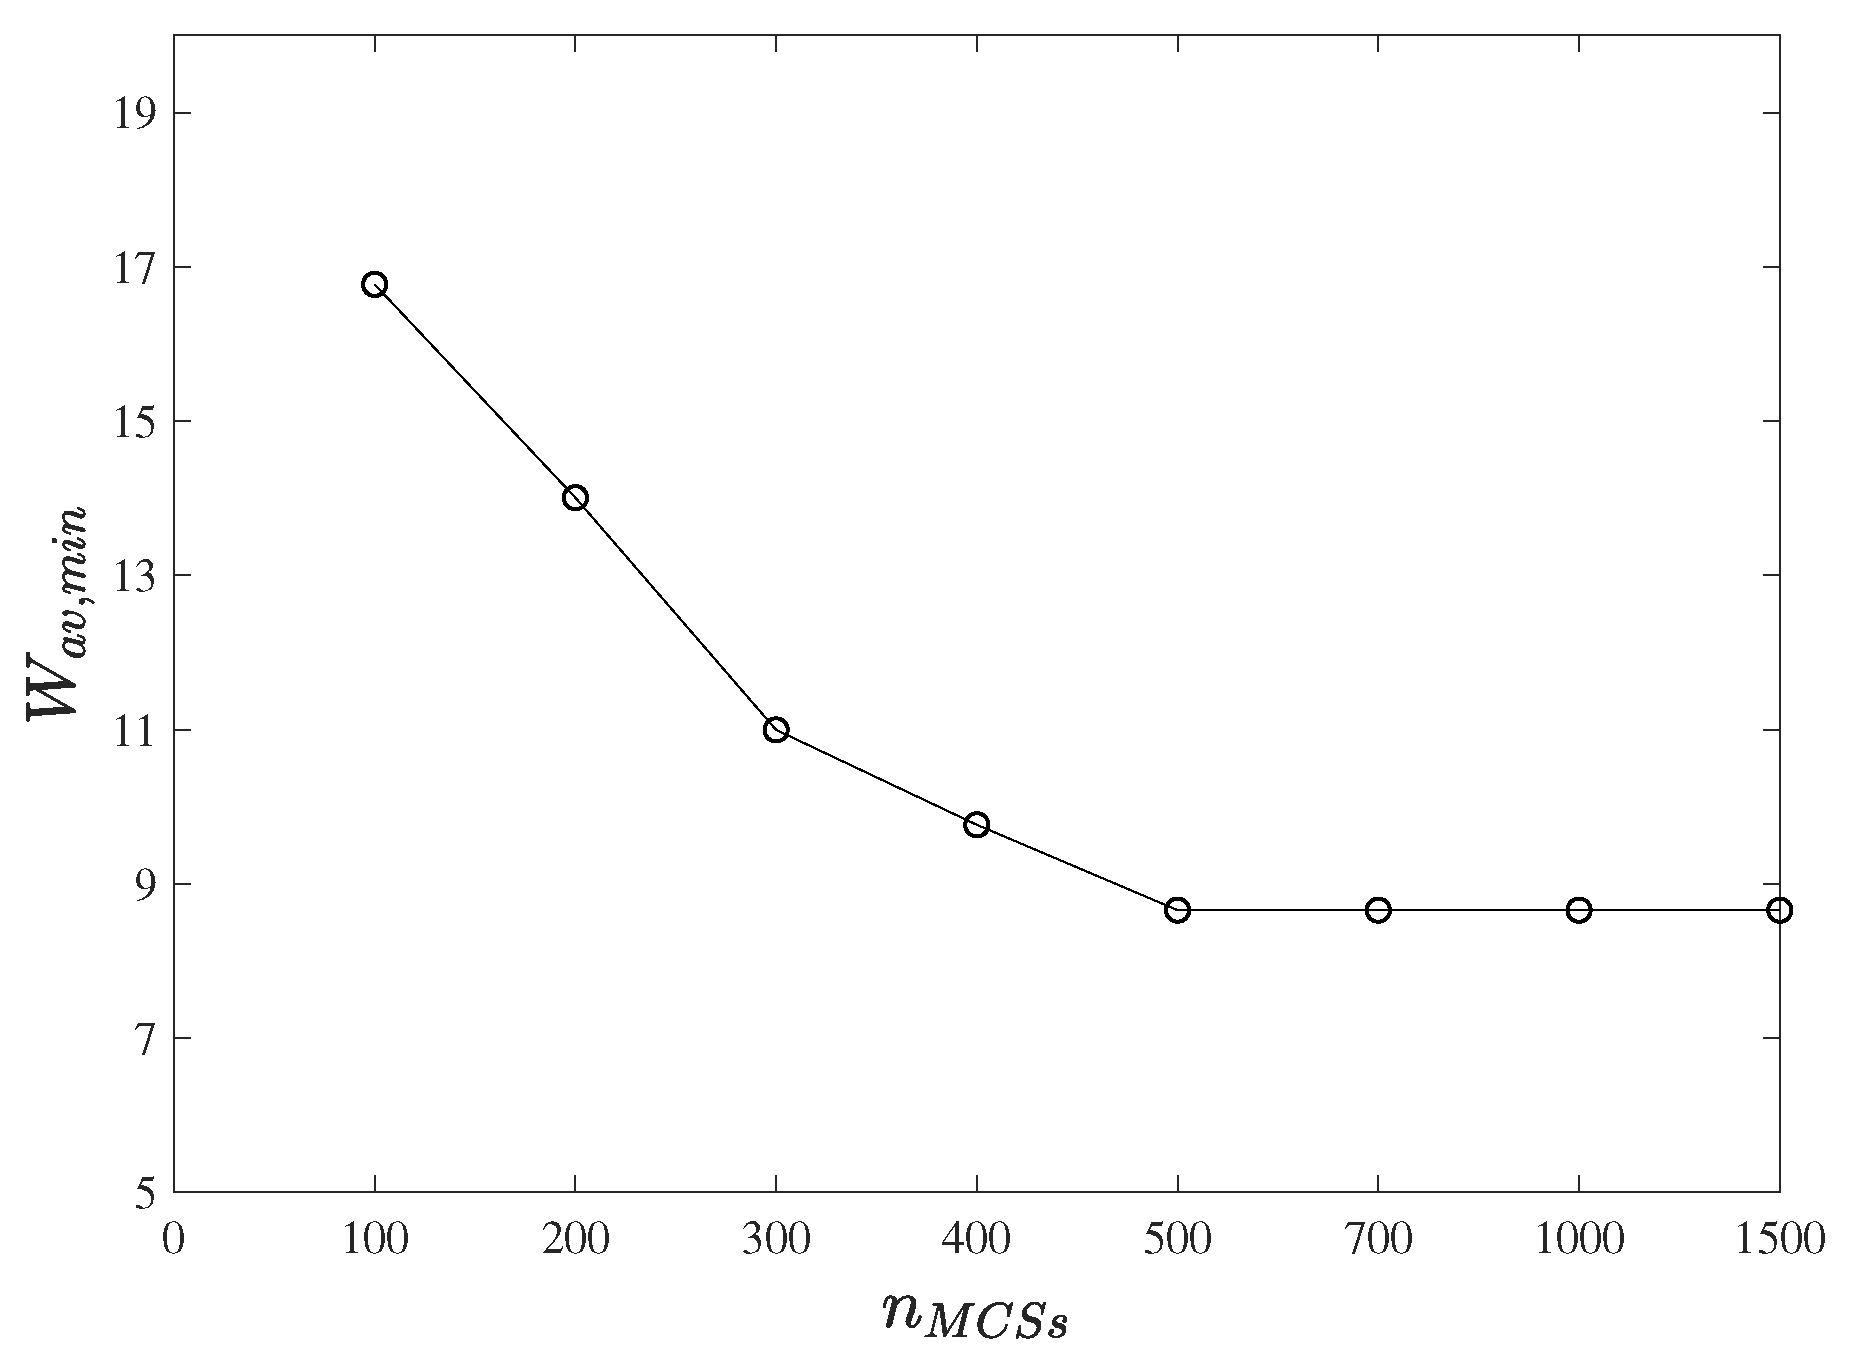
6.4. Sensitivity Analysis
7. Conclusions
Author Contributions
Funding
Conflicts of Interest
Appendix A
| Bus | Longitude (°) | Latitude (°) | Bus | Longitude (°) | Latitude (°) | Bus | Longitude (°) | Latitude (°) |
|---|---|---|---|---|---|---|---|---|
| 1 | 110.6478 | 24.9763 | 41 | 113.3561 | 24.9051 | 81 | 115.0647 | 24.3207 |
| 2 | 111.2342 | 24.8342 | 42 | 113.5914 | 25.1054 | 82 | 114.8282 | 23.7180 |
| 3 | 110.8434 | 24.6454 | 43 | 113.3210 | 24.5342 | 83 | 114.6202 | 23.3568 |
| 4 | 111.0434 | 24.3234 | 44 | 113.5210 | 24.7342 | 84 | 114.4001 | 22.9322 |
| 5 | 111.1423 | 23.8723 | 45 | 113.6717 | 24.5051 | 85 | 114.7031 | 22.7322 |
| 6 | 111.4345 | 23.9342 | 46 | 113.3612 | 24.3104 | 86 | 114.9012 | 22.8035 |
| 7 | 111.9312 | 23.9452 | 47 | 113.6717 | 24.1641 | 87 | 115.2012 | 22.7531 |
| 8 | 111.2452 | 22.9992 | 48 | 114.0000 | 24.0314 | 88 | 114.9000 | 23.2000 |
| 9 | 111.2332 | 22.2786 | 49 | 114.0637 | 24.3120 | 89 | 115.2001 | 23.4003 |
| 10 | 111.4324 | 21.8274 | 50 | 113.9214 | 24.5481 | 90 | 115.3034 | 22.9703 |
| 11 | 111.4546 | 24.3567 | 51 | 114.2016 | 24.6102 | 91 | 115.6074 | 23.0003 |
| 12 | 111.8562 | 24.7567 | 52 | 114.0000 | 24.7021 | 92 | 115.5944 | 23.3713 |
| 13 | 112.0324 | 24.2654 | 53 | 114.2214 | 25.2041 | 93 | 115.8674 | 23.4023 |
| 14 | 112.3354 | 24.5344 | 54 | 114.7012 | 25.3102 | 94 | 115.9141 | 23.9098 |
| 15 | 112.5154 | 24.0265 | 55 | 114.5621 | 24.6501 | 95 | 115.9172 | 23.7023 |
| 16 | 112.0354 | 23.6345 | 56 | 114.0214 | 25.4015 | 96 | 115.3175 | 23.9314 |
| 17 | 112.4135 | 23.5134 | 57 | 113.9213 | 24.8914 | 97 | 115.4223 | 24.2387 |
| 18 | 112.7935 | 23.6014 | 58 | 114.2015 | 24.8954 | 98 | 115.9654 | 24.3611 |
| 19 | 113.0956 | 23.6244 | 59 | 114.6012 | 25.7411 | 99 | 116.2749 | 24.5917 |
| 20 | 112.8134 | 23.0124 | 60 | 115.6012 | 25.3102 | 100 | 116.4121 | 24.0265 |
| 21 | 112.7354 | 22.6554 | 61 | 115.7012 | 25.0000 | 101 | 116.2134 | 23.4342 |
| 22 | 112.6354 | 22.3565 | 62 | 115.0137 | 24.9910 | 102 | 115.9564 | 22.9613 |
| 23 | 112.7124 | 22.0651 | 63 | 115.1021 | 25.3100 | 103 | 116.5021 | 23.6791 |
| 24 | 113.0154 | 22.6554 | 64 | 115.3012 | 24.8102 | 104 | 116.5276 | 24.3564 |
| 25 | 112.4139 | 21.9021 | 65 | 114.3541 | 24.3549 | 105 | 117.1201 | 24.6478 |
| 26 | 112.4643 | 22.0801 | 66 | 114.5617 | 24.8154 | 106 | 116.6317 | 24.9474 |
| 27 | 111.7257 | 21.8635 | 67 | 114.9999 | 24.6914 | 107 | 117.5347 | 24.3514 |
| 28 | 111.6554 | 22.2358 | 68 | 113.8556 | 23.8989 | 108 | 117.2418 | 24.3248 |
| 29 | 111.4334 | 22.7653 | 69 | 113.5647 | 23.5617 | 109 | 117.1111 | 23.9999 |
| 30 | 112.5434 | 23.1235 | 70 | 113.5934 | 23.1261 | 110 | 116.7923 | 23.7212 |
| 31 | 111.7422 | 22.7765 | 71 | 113.5238 | 22.6287 | 111 | 116.6523 | 23.3061 |
| 32 | 112.3565 | 22.5562 | 72 | 113.2031 | 22.4987 | 112 | 117.3225 | 23.6978 |
| 33 | 112.8014 | 24.5142 | 73 | 113.4458 | 22.3257 | 113 | 112.1455 | 23.0342 |
| 34 | 112.7617 | 24.0012 | 74 | 113.9342 | 22.6981 | 114 | 111.8255 | 22.3645 |
| 35 | 113.2032 | 24.3514 | 75 | 114.3341 | 22.6586 | 115 | 112.1255 | 22.3245 |
| 36 | 112.9917 | 23.9012 | 76 | 114.0987 | 23.6987 | 116 | 114.2649 | 24.1026 |
| 37 | 113.2641 | 24.0124 | 77 | 114.4081 | 23.7081 | 117 | 112.3556 | 24.9677 |
| 38 | 113.2214 | 23.2000 | 78 | 114.8500 | 24.0000 | 118 | 114.1013 | 23.2584 |
| 39 | 112.8411 | 24.8614 | 79 | 114.7564 | 24.5017 | |||
| 40 | 113.0134 | 24.9654 | 80 | 115.4974 | 24.5356 |
References
- Panteli, M.; Mancarella, P. Influence of extreme weather and climate change on the resilience of power systems: Impacts and possible mitigation strategies. Electr. Power Syst. Res. 2015, 127, 259–270. [Google Scholar] [CrossRef]
- Watson, E.B.; Etemadi, A.H. Modeling electrical grid resilience under hurricane wind conditions with increased solar and wind power generation. IEEE Trans. Power Syst. 2019, 35, 929–937. [Google Scholar] [CrossRef]
- Holling, C.S. Resilience and stability of ecological systems. Annu. Rev. Ecol. Syst. 1973, 4, 1–23. [Google Scholar] [CrossRef]
- Great Britain, Cabinet Office. Keeping the country running: Natural hazards and infrastructure: A guide to improving the resilience of critical infrastructure and essential services. Appl. Environ. Microbiol. 2011, 79, 7735–7744. [Google Scholar]
- Panteli, M.; Trakas, D.N.; Mancarella, P.; Hatziargyriou, N.D. Power systems resilience assessment: Hardening and smart operational enhancement strategies. Proc. IEEE 2017, 105, 1202–1213. [Google Scholar] [CrossRef]
- Yang, Y.; Tang, W.; Liu, Y.; Xin, Y.; Wu, Q. Quantitative resilience assessment for power transmission systems under typhoon weather. IEEE Access 2018, 6, 40747–40756. [Google Scholar] [CrossRef]
- Panteli, M.; Mancarella, P. Modeling and evaluating the resilience of critical electrical power infrastructure to extreme weather events. IEEE Syst. J. 2015, 11, 1733–1742. [Google Scholar] [CrossRef]
- Bhuiyan, M.; Allan, R. Inclusion of weather effects in composite system reliability evaluation using sequential simulation. IEE Proc. Gener. Transm. Distrib. 1994, 141, 575–584. [Google Scholar] [CrossRef]
- Dobson, I.; Carreras, B.A.; Lynch, V.E.; Newman, D.E. Complex systems analysis of series of blackouts: Cascading failure, critical points, and self-organization. Chaos Interdiscip. J. Nonlinear Sci. 2007, 17, 026103. [Google Scholar] [CrossRef]
- Bhusal, N.; Abdelmalak, M.; Kamruzzaman, M.; Benidris, M. Power system resilience: Current practices, challenges, and future directions. IEEE Access 2020, 8, 18064–18086. [Google Scholar] [CrossRef]
- Panteli, M.; Mancarella, P.; Trakas, D.N.; Kyriakides, E.; Hatziargyriou, N.D. Metrics and quantification of operational and infrastructure resilience in power systems. IEEE Trans. Power Syst. 2017, 32, 4732–4742. [Google Scholar] [CrossRef]
- Lu, J.; Guo, J.; Jian, Z.; Yang, Y.; Tang, W. Resilience assessment and its enhancement in tackling adverse impact of ice disasters for power transmission systems. Energies 2018, 11, 2272. [Google Scholar] [CrossRef]
- Sun, Y.; Wang, P.; Cheng, L.; Liu, H. Operational reliability assessment of power systems considering condition-dependent failure rate. IET Gener. Transm. Distrib. 2010, 4, 60–72. [Google Scholar] [CrossRef]
- Zhang, H.; Wang, P.; Yao, S.; Liu, X.; Zhao, T. Resilience assessment of interdependent energy systems under hurricanes. IEEE Trans. Power Syst. 2020. [Google Scholar] [CrossRef]
- Zhang, H.; Bie, Z.; Li, G.; Lin, Y. Assessment method and metrics of power system resilience after disasters. J. Eng. 2019, 2019, 880–883. [Google Scholar] [CrossRef]
- Kim, J.; Dvorkin, Y. Enhancing distribution system resilience with mobile energy storage and microgrids. IEEE Trans. Smart Grid 2018, 10, 4996–5006. [Google Scholar] [CrossRef]
- Yao, S.; Wang, P.; Zhao, T. Transportable energy storage for more resilient distribution systems with multiple microgrids. IEEE Trans. Smart Grid 2018, 10, 3331–3341. [Google Scholar] [CrossRef]
- Li, Z.; Shahidehpour, M.; Alabdulwahab, A.; Abusorrah, A. Bilevel model for analyzing coordinated cyber-physical attacks on power systems. IEEE Trans. Smart Grid 2015, 7, 2260–2272. [Google Scholar] [CrossRef]
- Espinoza, S.; Poulos, A.; Rudnick, H.; de la Llera, J.C.; Panteli, M.; Mancarella, P. Risk and resilience assessment with component criticality ranking of electric power systems subject to earthquakes. IEEE Syst. J. 2020, 14, 2837–2848. [Google Scholar] [CrossRef]
- Panteli, M.; Pickering, C.; Wilkinson, S.; Dawson, R.; Mancarella, P. Power system resilience to extreme weather: Fragility modeling, probabilistic impact assessment, and adaptation measures. IEEE Trans. Power Syst. 2016, 32, 3747–3757. [Google Scholar] [CrossRef]
- Phadke, A.C.; Martino, C.D.; Cheung, K.F.; Houston, S.H. Modeling of tropical cyclone winds and waves for emergency management. Ocean Eng. 2003, 30, 553–578. [Google Scholar] [CrossRef]
- Chen, W.B.; Chen, H.; Hsiao, S.C.; Chang, C.H.; Lin, L.Y. Wind forcing effect on hindcasting of typhoon-driven extreme waves. Ocean Eng. 2019, 188, 106260. [Google Scholar] [CrossRef]
- Ruiz-Salcines, P.; Salles, P.; Robles-Díaz, L.; Díaz-Hernández, G.; Torres-Freyermuth, A.; Appendini, C.M. On the use of parametric wind models for wind wave modeling under yropical cyclones. Water 2019, 11, 2044. [Google Scholar] [CrossRef]
- Huges, L. On the low level wind structure of tropical cyclones. J. Meteorol. 1952, 9, 422–428. [Google Scholar] [CrossRef][Green Version]
- Tang, W.; Yang, Y.; Li, Y.; Lu, J.; Wu, Q. Investigation on resilience assessment and enhancement for power transmission systems under extreme meteorological disasters. Proc. CSEE 2020, 40, 2244–2254. [Google Scholar]
- Jiang, L.; Liu, J.; Wei, Z.; Gong, H.; Lei, C.; Li, C. Running state and its risk evaluation of transmission line based on markov chain model. Autom. Electr. Power Syst. 2015, 39, 51–57. [Google Scholar]
- Furness, P. Applications of monte carlo simulation in marketing analytics. J. Direct Data Digit. Mark. Pract. 2011, 13, 132–147. [Google Scholar] [CrossRef][Green Version]
- Wei, X.; Zhao, J.; Huang, T.; Bompard, E. A novel cascading faults graph based transmission network vulnerability assessment method. IEEE Trans. Power Syst. 2017, 33, 2995–3000. [Google Scholar] [CrossRef]
- Power Flow Test Systems Repository. Available online: Https://al-roomi.org/power-flow (accessed on 15 January 2020).
- Naval Research Laboratory—Marine Meteorology Division; JTWC. Western North Pacific Ocean Best Track Data. Available online: http://www.metoc.navy.mil/jtwc/jtwc.html?western-pacific (accessed on 12 December 2019).
- Zhang, H.X.; Lü, F.P. Vulnerability evaluation of power grid based on the analysis of cascading failure sequence. Power Syst. Prot. Control 2013, 17, 32–38. [Google Scholar]
- Yang, Y.; Nishikawa, T.; Motter, A.E. Small vulnerable sets determine large network cascades in power grids. Science 2017, 358, eaan3184. [Google Scholar] [CrossRef]
- Sabouhi, H.; Doroudi, A.; Fotuhi-Firuzabad, M.; Bashiri, M. Electrical Power System Resilience Assessment: A Comprehensive Approach. IEEE Syst. J. 2019, 14, 2643–2652. [Google Scholar] [CrossRef]


| (MW) | (MW) | ||||||
|---|---|---|---|---|---|---|---|
| 1 | 18 | 397 | 22.05 | 1 | 58 | 1740 | 30.00 |
| 2 | 18 | 397 | 22.05 | 2 | 53 | 1631 | 30.77 |
| 3 | 17 | 397 | 23.35 | 3 | 53 | 1531 | 28.88 |
| 4 | 17 | 374 | 22.00 | 4 | 59 | 1495 | 25.33 |
| 5 | 17 | 335 | 19.70 | 5 | 55 | 1424 | 25.89 |
| 6 | 18 | 335 | 18.61 | 6 | 64 | 1420 | 22.18 |
| 7 | 17 | 315 | 18.52 | 7 | 66 | 1357 | 20.56 |
| 8 | 18 | 315 | 17.50 | 8 | 52 | 1330 | 25.57 |
| 9 | 20 | 315 | 15.75 | 9 | 50 | 1316 | 26.32 |
| 10 | 19 | 315 | 16.57 | 10 | 55 | 1234 | 22.43 |
| 11 | 16 | 315 | 19.68 | 11 | 53 | 1226 | 23.13 |
| 12 | 20 | 315 | 15.75 | 12 | 57 | 1177 | 20.64 |
| 13 | 18 | 315 | 17.50 | 13 | 47 | 1174 | 24.97 |
| 14 | 22 | 315 | 14.31 | 14 | 55 | 1143 | 20.78 |
| 15 | 18 | 315 | 17.50 | 15 | 58 | 1142 | 19.69 |
| 16 | 18 | 315 | 17.50 | 16 | 51 | 1061 | 20.80 |
| 17 | 18 | 315 | 17.50 | 17 | 44 | 1059 | 24.06 |
| 18 | 17 | 315 | 18.52 | 18 | 51 | 1057 | 20.72 |
| 19 | 15 | 315 | 21.00 | 19 | 47 | 1033 | 21.97 |
| 20 | 19 | 315 | 16.57 | 20 | 44 | 1017 | 23.11 |
| Group (M1) | Invulnerable Lines (M1) | Group (M2) | Invulnerable Lines (M2) | ||
|---|---|---|---|---|---|
| Group 0 | None | 17.47 | Group 0 | None | 17.47 |
| Group 1 | 119,138,139,134,107 | 8.66 | Group 1 | 141,135,137,162,161 | 15.27 |
| Group 2 | 131,89,102,64,33 | 13.98 | Group 2 | 140,136,143,138,139 | 7.41 |
| Group 3 | 36,142,137,136,143 | 13.65 | Group 3 | 133,134,131,142,132 | 16.82 |
| Group 4 | 105,140,65,108,15 | 15.12 | Group 4 | 130,120,119,107,104 | 15.40 |
| Group 5 | 67,106,88,52,55 | 15.27 | Group 5 | 185,108,129,186,105 | 15.02 |
| Group 6 | 111,129,133,135,141 | 17.41 | Group 6 | 106,116,102,65,97 | 15.04 |
| 2 min | 5 min | 10 min | 20 min | |
|---|---|---|---|---|
| 30.44 | 23.50 | 17.10 | 9.90 |
© 2020 by the authors. Licensee MDPI, Basel, Switzerland. This article is an open access article distributed under the terms and conditions of the Creative Commons Attribution (CC BY) license (http://creativecommons.org/licenses/by/4.0/).
Share and Cite
Guo, J.; Feng, T.; Cai, Z.; Lian, X.; Tang, W. Vulnerability Assessment for Power Transmission Lines under Typhoon Weather Based on a Cascading Failure State Transition Diagram. Energies 2020, 13, 3681. https://doi.org/10.3390/en13143681
Guo J, Feng T, Cai Z, Lian X, Tang W. Vulnerability Assessment for Power Transmission Lines under Typhoon Weather Based on a Cascading Failure State Transition Diagram. Energies. 2020; 13(14):3681. https://doi.org/10.3390/en13143681
Chicago/Turabian StyleGuo, Jun, Tao Feng, Zelin Cai, Xianglong Lian, and Wenhu Tang. 2020. "Vulnerability Assessment for Power Transmission Lines under Typhoon Weather Based on a Cascading Failure State Transition Diagram" Energies 13, no. 14: 3681. https://doi.org/10.3390/en13143681
APA StyleGuo, J., Feng, T., Cai, Z., Lian, X., & Tang, W. (2020). Vulnerability Assessment for Power Transmission Lines under Typhoon Weather Based on a Cascading Failure State Transition Diagram. Energies, 13(14), 3681. https://doi.org/10.3390/en13143681


